Article

Lake Restoration Improved Ecosystem Maturity Through Regime Shifts—A Case Study of Lake Baiyangdian, China

1
College of Life Sciences, Hebei University, Baoding 071002, China
2
Hebei Ocean and Fishery Sciences Research Institute, Qinhuangdao 066200, China
3
Hebei Key Laboratory of Wetland Ecology and Conservation, Hengshui 053000, China
*
Authors to whom correspondence should be addressed.
Sustainability 2024, 16(21), 9372; https://doi.org/10.3390/su16219372
Submission received: 27 August 2024 / Revised: 16 October 2024 / Accepted: 18 October 2024 / Published: 29 October 2024

Abstract

:
Lake ecosystems are impacted by anthropogenic disturbances and have become vulnerable worldwide. Highly disturbed lake ecosystems are not well understood due to the lack of data on changes in the structures and functions of ecosystems. In this paper, we focus on Lake Baiyangdian (BYDL), the largest shallow lake in North China. Following the establishment of the Xiong’an New Area (XNA) in 2017, concerted efforts to restore BYDL’s aquatic environment have been undertaken, which has led to significant changes in the structures and functions of the ecosystems. We evaluated the biomass dynamics of main biological communities and detected the regime shifts of environmental factors in BYDL from 2016 to 2023. Further, we constructed a food web model for the BYDL ecosystem in 2023 by using Ecopath with Ecosim (EwE) and made a comparison with the reported results in 2018. The results showed significant changes in the ecosystem structure of BYDL over the last 6 years. In 2023, the submerged macrophytes biomass in the system increased by 4.2 times compared to 2018, leading to an increase in total system throughput. We found that BYDL changed from an algal-type lake to a macrophyte-dominated lake. In addition, we found TN, NH4+-N, and CODMn were significantly decreased in BYDL during the restoration. TN and NH4+-N had a change point in approximately 2021, indicating that a regime shift had occurred during restoration. Overall, the BYDL ecosystem was in an immature but developing state, as indicated by ecological network analysis indicators. Nutrient-loading reduction, hydrological regulation, and rational biomanipulation may be the potential driving factors of change in the BYDL ecosystem. We strongly recommend the timely harvesting of submerged macrophytes, the proliferation and release of herbivorous fishes, and the assessment of the ecological capacity of carnivorous fishes in the future ecological restoration of BYDL.

1. Introduction

Ecosystems under increasing anthropogenic stress can respond abruptly and through tipping points [1]. In shallow lake ecosystems, exceeding critical threshold levels of nutrient load can result in the loss of submerged macrophytes and a shift to turbid states [2]. The resulting turbid condition conducive to algal growth leads to a sharp decline in dissolved oxygen in the water. Natural and anthropogenic exploitation events (mainly eutrophication) cause regime shifts in shallow lake ecosystems [3]. Shallow lakes used for various purposes, such as urban drinking water sources, industrial water abstraction, agricultural farming, and landscape recreation, are reported to have the highest degree of exploitation compared to other types of lakes [4]. The increased utilization of shallow lakes has also resulted in serious water pollution problems. For example, Lake Taihu, one of the five largest freshwater lakes in China, has suffered from degradation of aquatic plants and sustained outbreaks of cyanobacterial blooms due to over-utilization, which has caused a decline in the lake’s biodiversity, as well as has had a serious impact on industrial and agricultural production and human health [5]. A state of clear, macrophyte-dominated shallow lakes is considered to be a healthy ecological status. Returning to a clear state requires nutrient load reductions below a threshold level [6]. However, for shallow lake management, the reverse shift from a turbid state (phytoplankton dominance) to a clear water state (macrophyte dominance) is difficult [7]. Multiple models have been applied to reveal alternative state shifts, but the potential effects of restoration measures on changes in ecosystem state remain relatively unknown. The active engagement with ecosystem state changes informs the restoration and management of shallow lakes. The restoration of shallow lakes has become an important task in ecological environment management. Therefore, clarifying the interrelationships between shallow lake restoration and ecosystem changes is particularly important in increasing attention to ecological restoration practices and quantitative studies.
BYDL, as a key ecological regulator in the Xiong’an New Area (XNA), plays an important role in maintaining the balance of regional ecosystems, regulating climate, recharging underground water sources, storing floodwater, and protecting biodiversity and rare species resources [8]. BYDL is located in the core of the XNA, and the construction of the XNA is vital for the stable development of BYDL’s ecological environment. However, due to highly intensive anthropogenic disturbances and prolonged drought, BYDL has dried up several times in the past decades and become very fragile [9]. Consequently, the structure of the food web has been significantly degraded, resulting in a decline in biodiversity and a transition to a phytoplankton-dominated turbid state [10]. To alleviate the drought situation, flow regulation was implemented on 19 occasions between 1997 and 2009 to recharge BYDL [11]. Since the establishment of the XNA in 2017, the government has taken a series of ecological restoration measures for BYDL, including the control of upstream pollution discharge outlets, ecological water supply, dredging, proliferation, and release (mainly bighead carp Hypophthalmichthys nobilis and silver carp Hypophthalmichthys molitrix and carnivorous fish), and a “fishing ban” [8]. These restoration measures might strongly affect the structure of the ecosystem, resulting in notable changes to the food web of BYDL. However, questions pertaining to the structure and function of the BYDL ecosystem suffering from these issues are still unanswered.
The Ecopath with Ecosim (EwE) model can be applied to simulate the state of an ecosystem at different periods, providing a quantitative assessment of internal ecosystem changes [12,13]. With a user-friendly interactive interface and standard procedures for use, the model offers a framework for understanding the ecosystem state [14]. In some studies, the ecosystem underwent a regime shift, and the models were applied to identify the abrupt changes or to provide directions to situations that could have caused these changes [15]. Neira et al. [16] compared the food web models of Humboldt Sul (Central Chile) in 1970 and 2004 and found that the ecosystem experienced at least two distinct periods of environmental differences. Li et al. [17] compared models of BYDL in 1982 and 2011, suggesting that the food web structure change in BYDL tends to be linear. Zeng et al. [18] evaluated the state of the BYDL ecosystem in 2009–2010 using ecological network analysis indicators and found that the system was in the “Bad” grade, with fragile connections between trophic levels (TLs). However, we do not know whether these restorations have led to regime shifts in ecosystems and the major driving mechanism processes that affect ecosystem change. Put differently, the questions are as follows: (1) Have regulation measures affected the occurrence of regime shifts in BYDL? (2) What impact have regulatory measures had on the state of the BYDL ecosystem? (3) What are the potential critical factors driving the changes in the ecosystem?
In this study, we focused on how anthropogenic restoration measures impact biotic and abiotic factors in the BYDL ecosystem state. BYDL was taken as our case. The goals of the present study were (1) to examine the changes in nutrient status in shallow lakes under anthropogenic restoration measures, (2) to establish EwE mass-balance models for BYDL and compare the state changes in the BYDL ecosystem before and after restoration measures, and (3) to discuss potential critical factors driving the changes in the BYDL ecosystem.

2. Materials and Methods

2.1. Study Area

BYDL (E 115.38°–116.02°, N 38.43°–39.02°) is the largest shallow (2 m mean depth) lake in North China, covering an area of 366 km2. It is located at the core of the XNA and is fed by nine upstream rivers (Figure 1). The terrain is flat and the climate is warm-temperate continental monsoon, with four distinct seasons and an average annual temperature of 12.1 °C. BYDL is surrounded by 40 villages, 143 lakelets, and more than 3700 ditches, which are connected to the lakelets. BYDL was once a shallow macrophytic lake where aquatic plants were crucial in maintaining clear water quality. However, since the 2000s, intense anthropogenic disturbances have overexploited the water resources, resulting in serious eutrophication of the water body, among which most of the area is heavily or moderately eutrophic [19]. Before government restoration measures were implemented, water quality had been deteriorating including lower dissolved oxygen levels from algal blooms, and declines in submerged plants and fish resources. The number of total fish species from 54 in 1958 continued to decrease to 24 in 1990, including some large economic fish that have already disappeared [8]. With the change in water quantity and quality, the food web of BYDL tends to be simplified, the food chain is shortened, and the structure of the ecosystem has also undergone profound changes.

2.2. Data Collection

The data used to build the EwE model in this study were obtained from the Lake BYD aquatic biological survey data collected in April, July, and October of 2023, including the species composition, community structure, species abundance, and biomass of submerged macrophytes, phytoplankton, zooplankton, zoobenthos, and fish. The establishment of the EwE for 2018 was based on the literature from previous years, and publications from nearby lakes [18,20]. Biomass data for submerged plants and phytoplankton from 2018 to 2023 were obtained from local investigation reports and field monitoring [8,11]. Additionally, we collected water quality data for BYDL between 2016 and 2023 for analysis. To explore whether a regime shift occurred in Lake Baiyangdian before and after the restoration measures, we used water quality indicators to signify nutrient loading and analyzed the change in the water quality indicators in a time series. The Mean t-test method was used to detect the change in water quality indicators, including ammonia nitrogen (NH4+-N), permanganate index (CODMn), total phosphorus (TP), and total nitrogen (TN), to identify the regime shift in BYDL. To verify regime shifts and to test thresholds, we performed change point analysis using the “strucchange” R package (R-4.3.0) [21].

2.3. Methodology

The modeling approach of the EwE model is based on a nutrient-related biomass framework constructed for the BYDL ecosystem. The EwE model uses trophic dynamics to describe the efficiency of energy transfer between TLs in an ecosystem. All the species are divided into different functional groups according to their trophic relations, which are all linked to other TL functional groups by predator–prey interactions [22]. A complete EwE model was constructed, including four fundamental parameters: biomass (B), production and biomass ratio (P/B), consumption and biomass ratio (Q/B), and ecotrophic efficiency (EE). The formula of EwE is based on a set of linear equations, with the specific model algorithm known as (1) production = catch + predation + net migration + biomass accumulation + other mortality; (2) consumption = production + respiration + unassimilated food, which can be simplified and expressed as follows [13]:
B ( i )   P B ( i )   E E ( i )   = j   B j Q B j D C i j + E X ( i )
where P B (i) (per year) is the production biomass ratio; EE(i) is the ecotrophic efficiency; Q B (j) (per year) is the ratio of consumption to the biomass; DC(ij) is the ratio that the prey j accounts for the predation of predator i; EX(i) is the output (including fish catch and migration).

2.3.1. Division of Functional Groups

According to the modeling requirements of the EwE model, this study was based on the ecological niche and feeding characteristics [18], and species were divided into 16 functional groups. These 16 functional groups almost all represent the energy flows of the biota composition of BYDL (the species composition is presented in Table S1 in the Supplementary Information). We divided fish into 9 functional groups, namely carnivorous fish, filter-feeding fish, other benthivorous fish, herbivorous fish, and fingerlings. In addition, snakehead, large culters (Culter alburnus and Chanodichthys erythropterus), common carp, and crucian carp were divided into independent functional groups as dominant species with important economic value. The zoobenthos were divided into three functional groups according to their taxonomic status: macrocrulstaceans, benthic molluscs, and microzoobenthos. The plankton were classified into two functional groups based on their mode of nutrition: zooplankton and phytoplankton. Phytoplankton and submerged macrophytes served as producers in the system, while the remaining functional groups as consumers. The detrital functional group, which represents the total non-living organic matter in the ecosystem, is essential for model construction. Furthermore, considering the species changes in different periods, we made corresponding adjustments to the diet composition of the functional groups [20].

2.3.2. Parameter Determination

Biomass (B) represents the total mass of a species per unit time and per unit area and is expressed as wet weight (t/km2). For a functional group containing multiple species, biomass is calculated as the average biomass of all species in that functional group within the study area. Phytoplankton biomass was calculated by counting the number of cells under a microscope and then converting the number of cells to biomass using the average wet weight of the phytoplankton cells. Zooplankton biomass was determined by counting and calculating under a microscope. The biomass of plankton is expressed in mg/L, which is then converted to the energy unit t/km² by multiplying it by the mean water depth [23]. Biomass data for submerged macrophytes for 2023 were obtained directly from field sampling. Benthic organisms were sampled using a Peterson dredge (1/16 m2) to collect triparallel sediment samples at each sample site, which were identified and weighed, and then the biomass of the benthic organisms was obtained based on the weighing method and the volume conversion method [11]. The biomass of fish stocks was estimated from gillnet and ground cage catches combined with survey reports from the local fisheries office. Detrital biomass was calculated from the relationship between primary productivity and water transparency [13] using the following empirical equations:
l o g 10 D = 0.954 · l o g 10 P P + 0.863 · l o g 10 E 2.41
where D represents detrital biomass (g⋅C⋅m−2), PP represents primary production (g⋅C⋅m−2), and E represents euphotic depth in meters (m). The euphotic depth is calculated by E = 2.5 × Secchi depth in meters (m).
Partial production/biomass (P/B) and consumption/biomass (Q/B) were estimated from measured data and calculated by empirical equations [14]. Functional groups that were unavailable for P/B and Q/B values were based on the output parameters of nearby lake ecosystems as references [8,11,20]. Based on previous studies of the food web structure of BYDL, the sampling sites set for the whole lake in 2018 and 2023 were basically the same in time and sites, and the analysis approaches were the same, so the trend in the obtained data was reliable.

2.4. Model Uncertainty and Balancing

When ecosystem material and energy inputs and outputs are in equilibrium, EE ≤ 1 for each functional group in the model, and if EE > 1, the model is not in equilibrium. Due to the greater uncertainty in the diet source, the diet should be prioritized for manual adjustment [14,24]. To overcome the uncertainty of the input data, these parameters should be checked, and further analyses and adjustments might still be required (the modified diet composition is shown in Table S2). Based on thermodynamics and ecological principles, pre-balancing (PREBAL) diagnostics are applied to the model debugging process. Gross food conversion efficiency (GEj) equals (P/Q)j [14], and the P/Q ratio should be between 0.1 and 0.3 for functional groups. After debugging the model to reach equilibrium, the EE varies between 0 and 1 for all functional groups. To test the reliability of the model, we analyzed the sensitivity of the data in the BYDL and ecological models in terms of the relationship between the rate of change in the model input data (−50%~50%) and the rate of change in the estimated data (Table S5). The quality of the model was assessed using the Pedigree index, which ranged from 0.16 to 0.68 based on the evaluation of 150 EwE models worldwide carried out by Morissette et al. [25]. Our model quality in this study was tested and obtained a Pedigree index of 0.563, indicating the high reliability of the model input parameters.

3. Results

3.1. Regime Shifts of Environmental Factors and Primary Producers

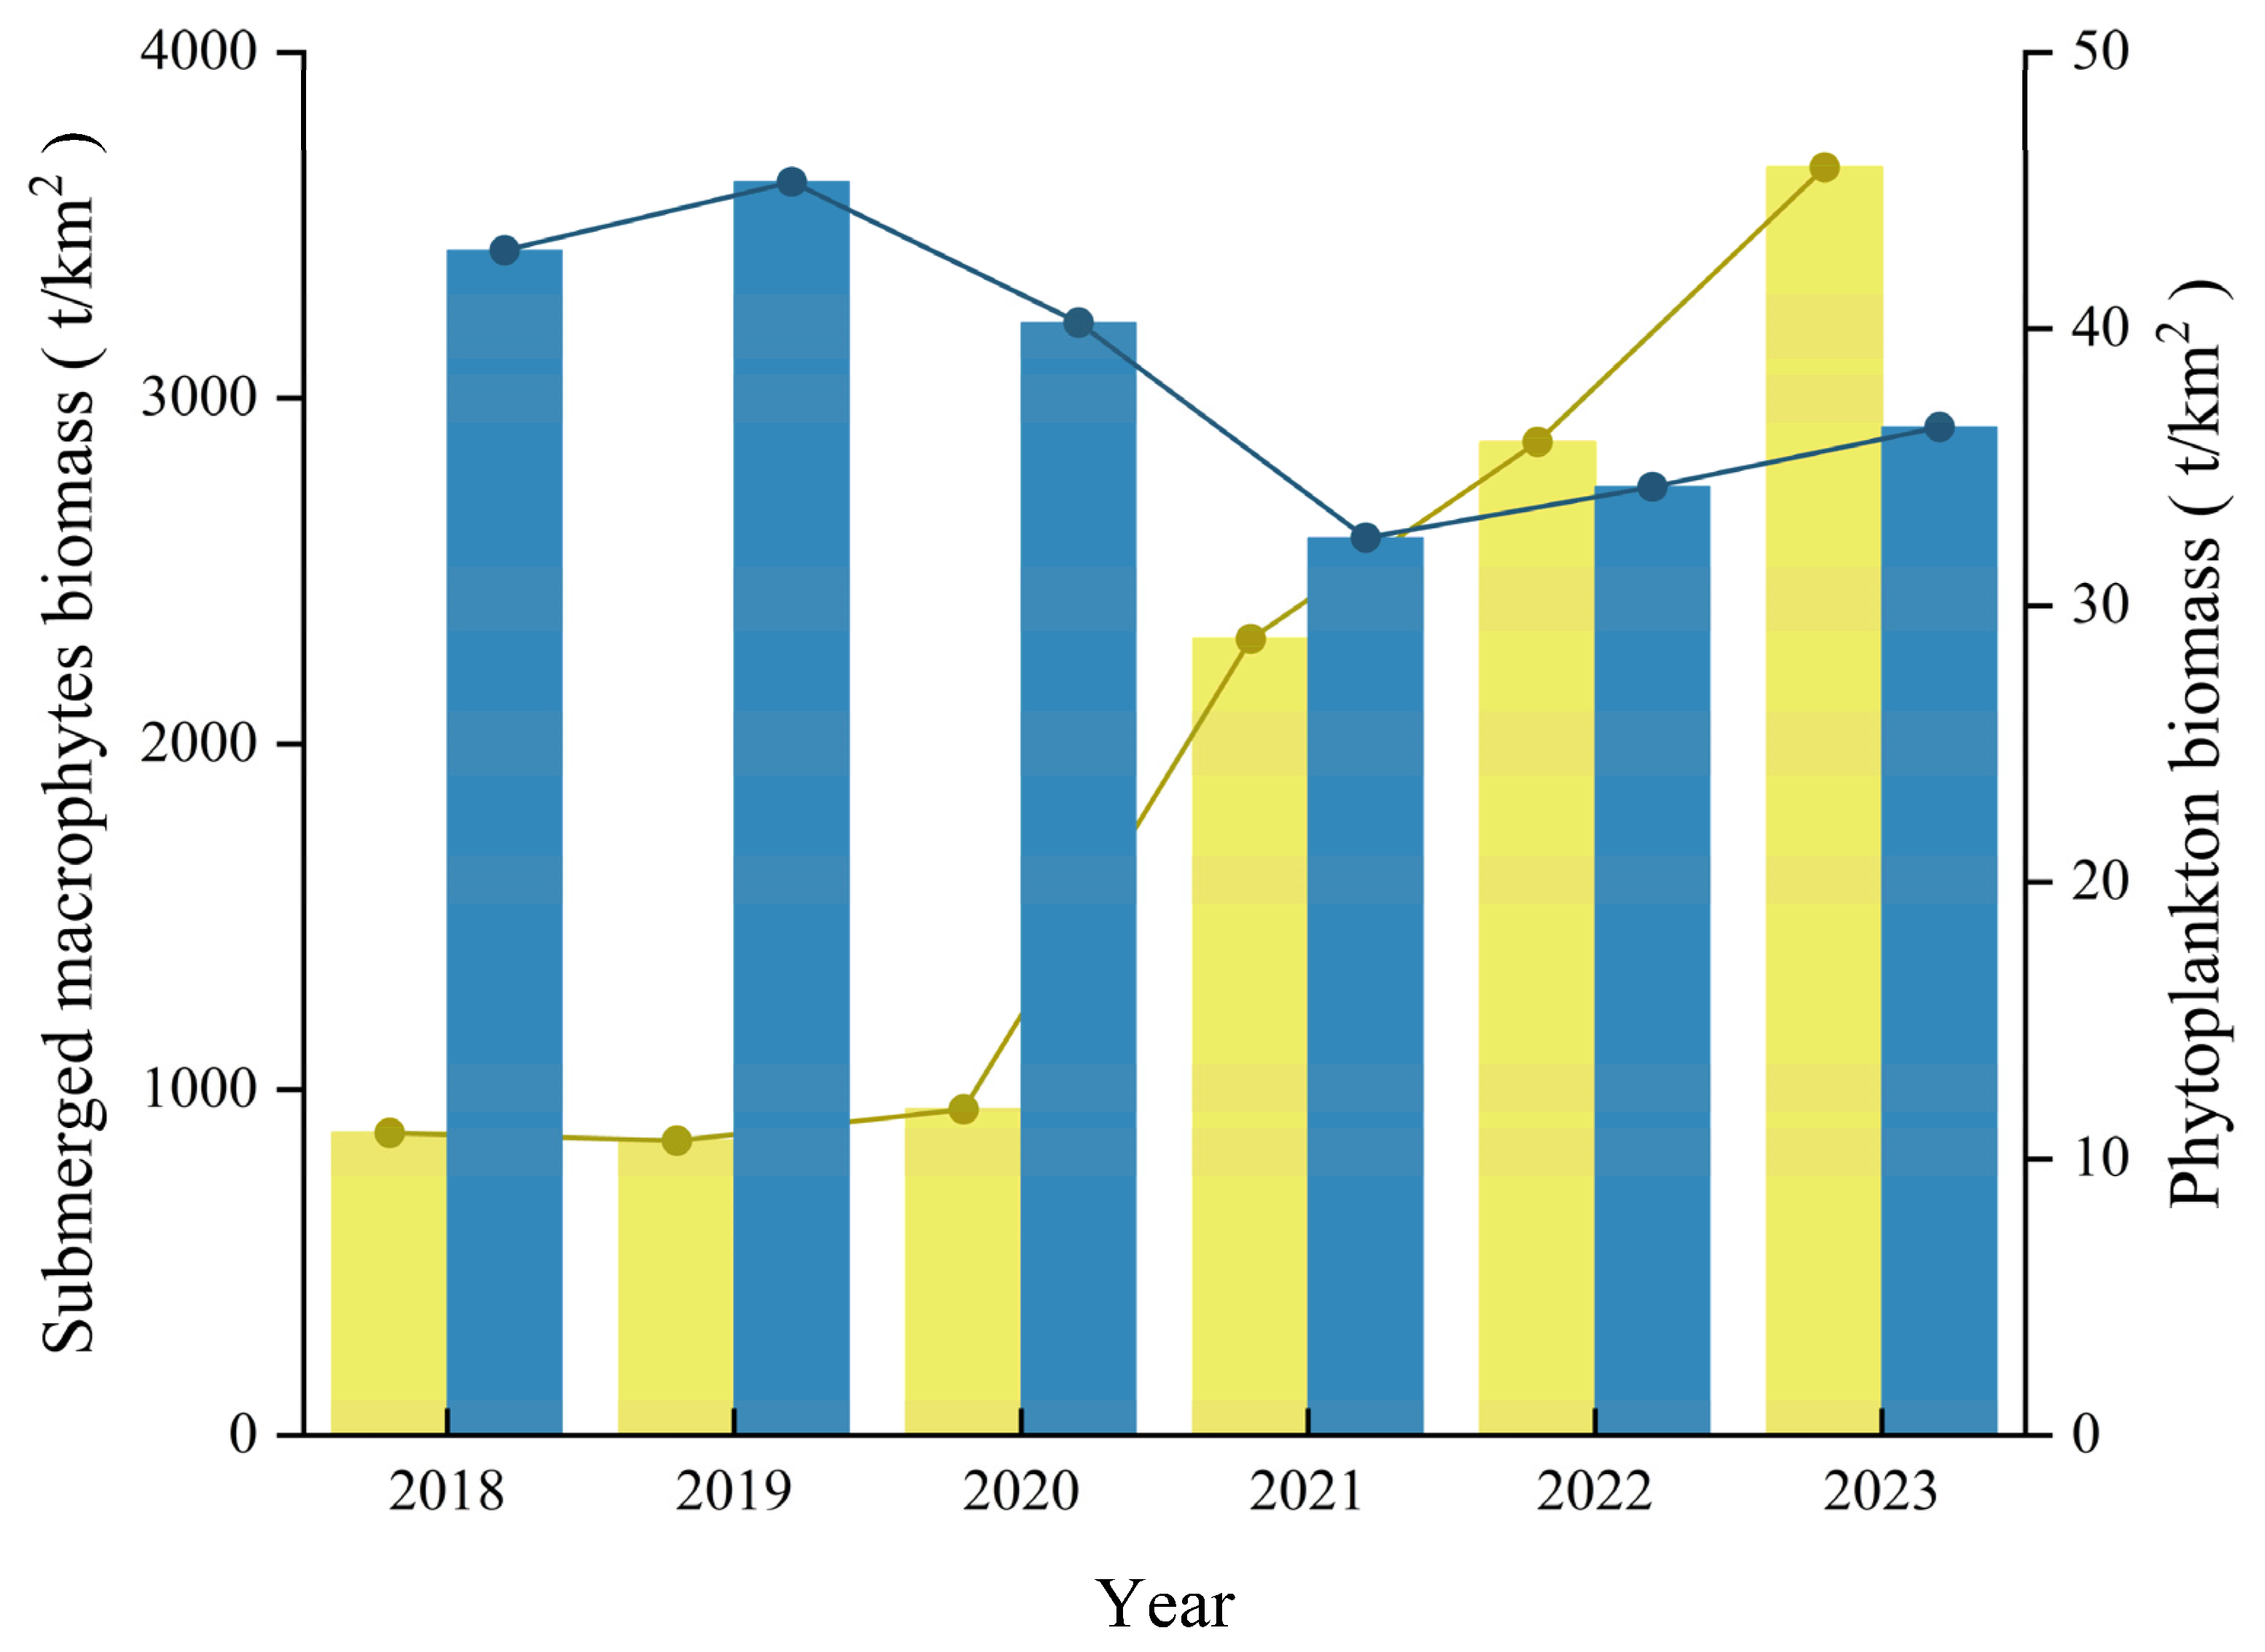
We calculated the biomass of submerged macrophytes and phytoplankton separately from 2018 to 2023. We observed that the biomass of submerged macrophytes exhibited a continued increase between 2018 and 2023. The trend in submerged macrophytes and phytoplankton had the opposite biomass change (Figure 2). Phytoplankton biomass was revealed to be the lowest in 2021 and submerged macrophytes biomass had the largest increase (144%) between 2020 and 2021. In addition, based on water quality survey data from 2016 to 2023, we summarized the trophic state change in BYDL (Figure 3). We conducted regime shift detections for the TP, TN, CODMn, and NH4+-N in BYDL (Figure 3). The results showed that TN and NH4+-N content were significantly reduced between 2020 and 2021, and CODMn was significantly reduced between 2018 and 2019. TP had a peak in 2016, with no significant difference between 2017 and 2023. TN and NH4+-N had a change point around 2021, and CODMn had a change point around 2019. This result was consistent with the trend in biomass change of submerged macrophytes, indicating that the ecosystem of BYDL may be experiencing a transitional phase from an algal-dominated lake to a submerged macrophyte-dominated lake. However, considering the relatively short time series of the data, it remains to be verified whether these trends represent a regime shift in the ecosystem, which requires longer-term data monitoring.

3.2. Basic Parameter Analysis

The input and output values of the EwE model of BYDL in 2023 are shown in Table 1. Biomass changes in each functional group in 2018 and 2023 are shown in Table 2. The biomass of functional groups in BYDL changed significantly from 2018 to 2023. In 2023, at the low TLs, phytoplankton and submerged macrophytes were significant primary producers in the ecosystem. In comparison to 2018, the biomass of submerged macrophytes increased by 4.2 times in 2023. At the middle TLs, molluscs were the dominant zoobenthos species in BYDL. The total zoobenthos stock decreased by 36.6% in 2023 compared to 2018. The decline in zoobenthos biomass was mainly due to the severe destruction of zoobenthos’ habitat caused by dredging. At the high TLs, snakehead occupied the top trophic niche of the food web, with the highest trophic level value of 3.49, followed by other carnivorous fish and culters, with TLs of 3.48 and 3.47, respectively. Carnivorous fish biomass in 2023 rose 2.7 times compared to 2018. The increased carnivorous fish strengthened the top–down effect of BYDL. The filter-feeding fish species in BYDL are mainly silver carp and bighead carp. In 2018, the resource of filter-feeding fish was only 0.02 t/(km2·a). After 2018, the resource of filter-feeding fish recovered to a certain extent due to proliferation and release. The biomass of herbivorous fish decreased to 0.82 t/km² in 2023, mainly due to dredging and interspecific competition, as well as increased predation pressure from carnivorous fish. However, this also indicated that large, submerged plants in the BYDL food web were not fully utilized.

3.3. Trophic Level Energy Flows

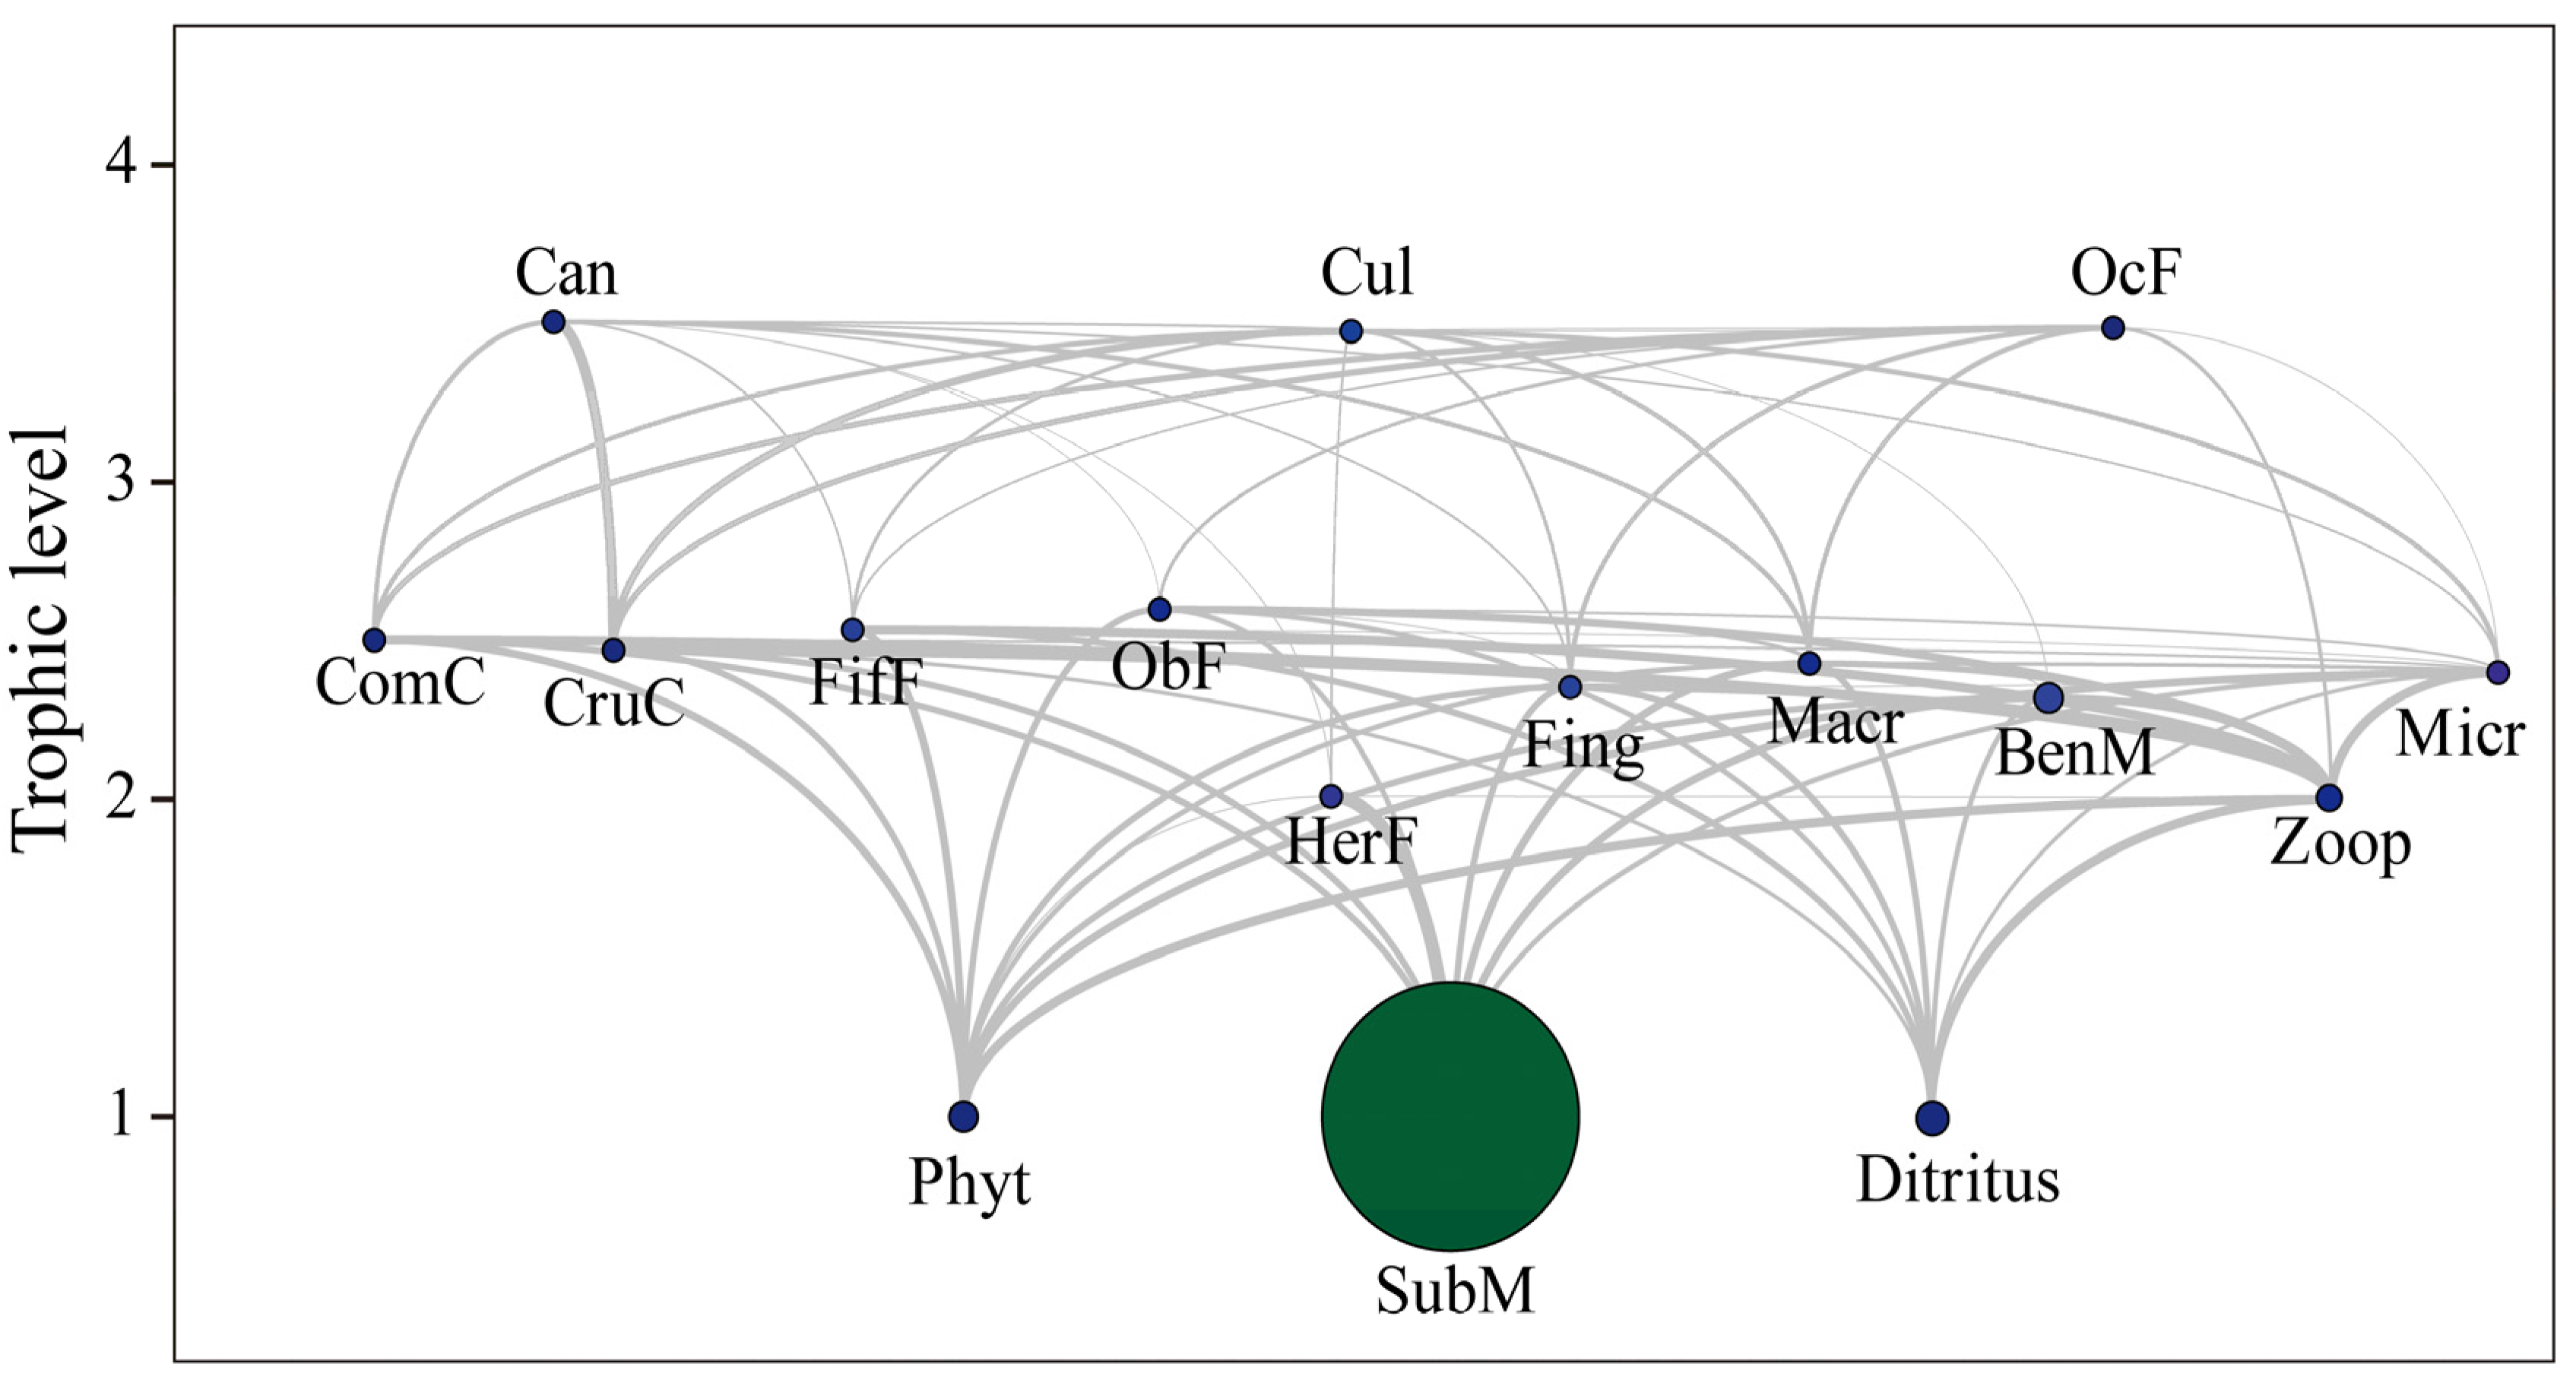
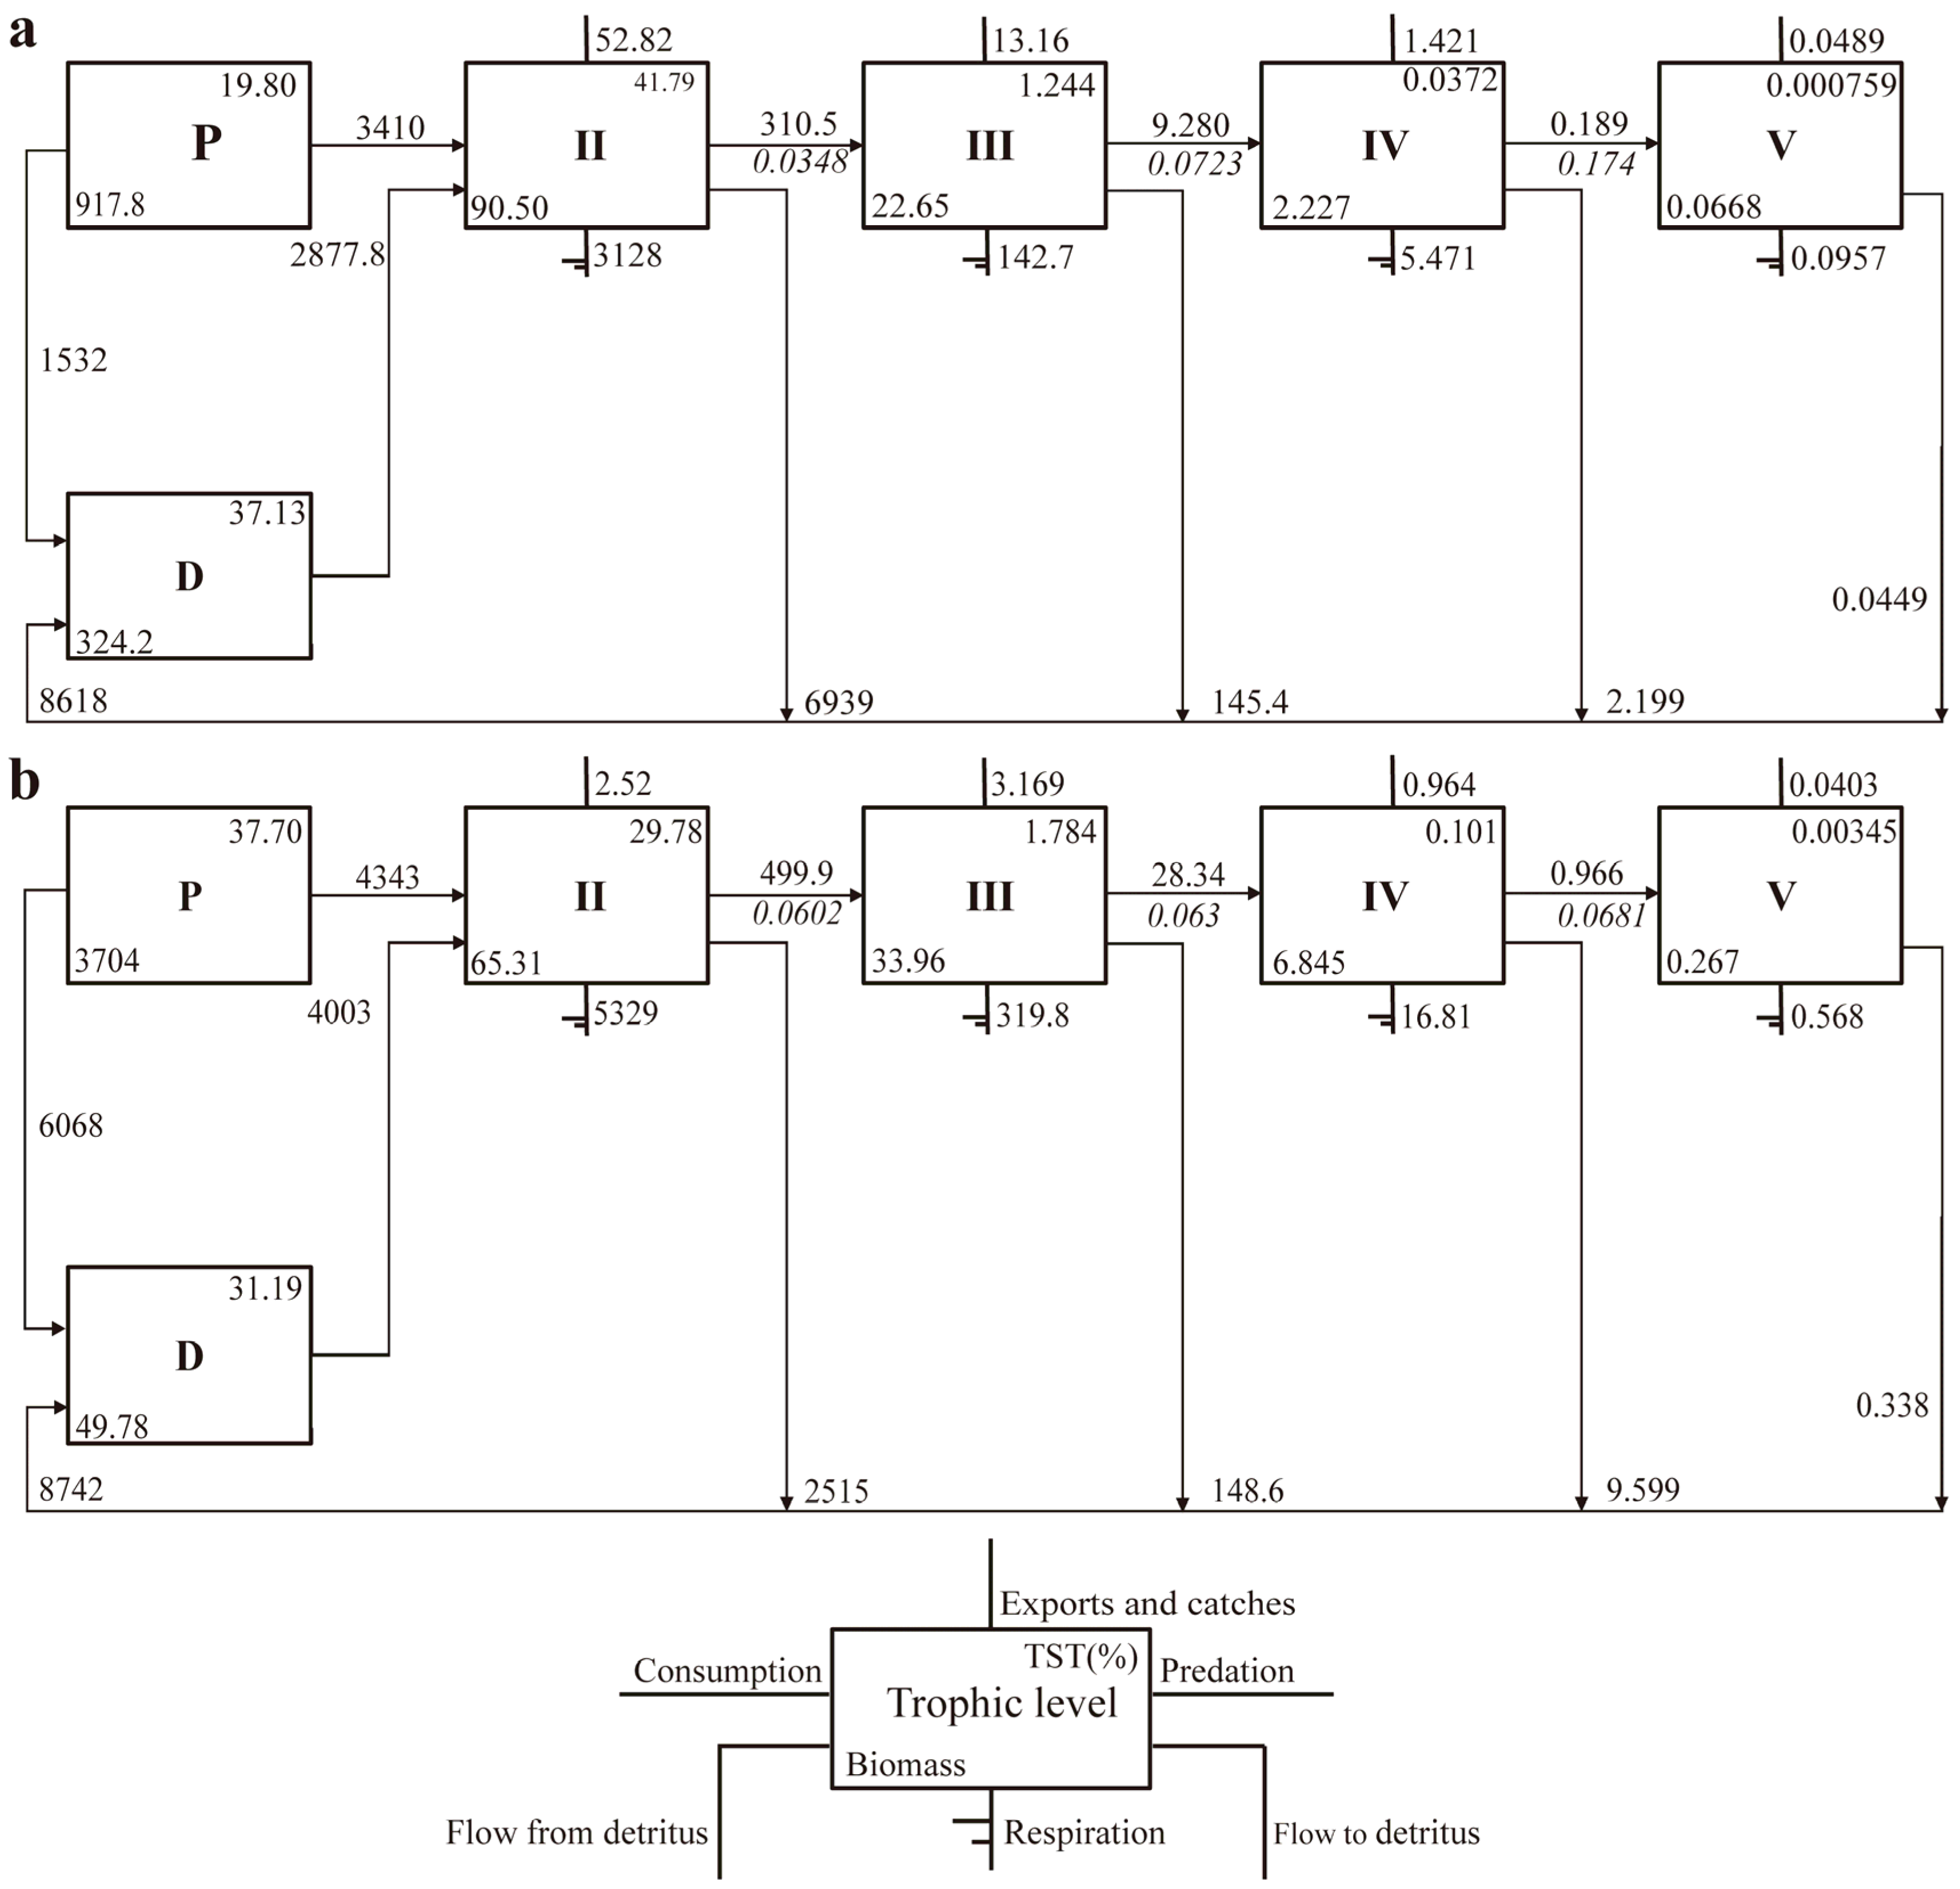
The food web structure of BYDL in 2023 is presented in Figure 4. The food web analysis of BYDL in 2023 revealed two main types of nutrient flows in the ecosystem. The first is the grazing food chain, starting with phytoplankton or submerged macrophytes. Energy flows through trophic level II (zooplankton, molluscs, and herbivorous fish) and trophic level III (omnivorous and carnivorous fish). The second is the detrital food chain, starting with organic detritus. Energy flows through detritus-eaters (zoobenthos and zooplankton) and then to carnivorous fish. The analysis of the food web structure in 2023 (Figure 4), in combination with Table S3 (Supplementary Information), indicates that detritus, phytoplankton, and submerged macrophytes functional groups dominated in the first trophic level; zooplankton and herbivorous fish dominated in trophic level II; and the predatory large carnivorous fish mainly occupy trophic level III. Using the Lindemann spine of two different periods that were compared (Figure 5), the primary producer production in 2023 was 10,411 t/(km2·a), 2.11 times higher than in 2018. The total flux from the system to detritus was 8618 t/(km2·a), more than 74.4 percent of primary producer production in 2018. However, the total ecosystem flow into detritus was 8742 t/(km2·a), which was lower than the production of primary producers (10411 t/[km2·a]) in 2023. As a result, the ratio of energy flow from the grazed food chain in the BYDL ecosystem to total system energy flow increased from 34% in 2018 to 54% in 2023. This indicates that the food web of the BYDL ecosystem shifted from being detrital food chain-dominated to being grazing food chain-strated for submerged macrophytes. In both periods, energy flows reduced gradually as trophic level increased. The highest energy flows were mainly found in lower TLs, which supplied an essential food base for the growth of some other functional groups (Figure 4). Table 3 shows an increasing trend in energy conversion efficiencies to TLs II, III, and IV by both primary producers and detritus. Compared to 2018, the transfer efficiency from trophic level II to trophic level III increased by 1.73 times in 2023. However, the total transfer efficiencies were slightly lower in 2023 (6.37%) than in 2018 (7.59%), indicating that the current BYDL ecosystem had reduced its ability to utilize the remaining available resources in adapting to changes in the external environment, resulting from un-utilized resources flowing into detritus buried in the sediments.

3.4. Changes in Ecosystem Functioning

Ecological network analysis indicators were used to compare the characteristics of the BYDL ecosystem in 2018 and 2023, as shown in Table 4. The total system indices showed the changes in ecosystem structure and function. The total system throughput in the BYDL ecosystem increased from 24,958 t/(km2·a) in 2018 to 28,034 t/(km2·a) in 2023. The main reason was the biomass of large submerged macrophytes present in the system, which increased the total system throughput in 2023. The ecosystem maturity can be characterized by the ratio of total biomass to total throughput (TB/TST) in the system [18]. The ratio tends to be low in developing ecosystems and increases as the system matures and stabilizes [14]. As the system matures, TB/TST values would be expected to increase to a maximum [26]. The TB/TST ratio increased from 0.041 in 2018 to 0.136 in 2023, indicating a growth in ecosystem maturity in 2023. The connectance index (CI) and system omnivory index (SOI) are important indicators for describing the relations within food webs. The values of CI and SOI reflect the complexity of the food chain as it progresses from linear to reticulate, with higher values indicating that the system is closer to maturity. The higher values of CI and SOI for ecosystems in 2023 compared to 2018 indicate increasing system complexity. The ratio of total primary production to respiration (TPP/TR) is used to describe the degree of system maturity. Mature ecosystems tend to have TPP/TR values close to one, while values much higher or lower than one are considered to be those of immature ecosystems [26]. In 2023, the system experienced a significant increase in primary producer biomass due to the abundance of large submerged macrophytes. This resulted in a total primary production that exceeded total respiration, causing the TPP/TR value to rise from 1.51 in 2018 to 1.84 in 2023. According to the Lindeman spine (Figure 5), the primary productivity of the BYDL ecosystem was 10,411 t/(km2·a), of which 4343 t/(km2·a) was consumed and the remaining 58.3% was not consumed by predators but deposited as detritus or mineralization. This result provides important guidelines for the harvesting of submerged macrophytes. We simulated harvesting 58.3% of the total submerged macrophytes biomass, and when the submerged macrophytes biomass was reduced to 1529.2 t/(km2·a), the corresponding system outputs showed that the amount of primary producer runoff debris in the system decreased by 44%. The value of TPP/TR was reduced from 1.84 to 1.37, which is closer to the standard value of 1. Additionally, the Finn’s cycling index (FCI) represents the proportion of an ecosystem’s throughput that undergoes recycling. Christensen [22] suggested that mature systems generally exhibit greater recycling than immature systems. The harvest simulated results (Table 4) showed an increased FCI from 8.39 to 12.45, indicating a significant improvement in system maturity with appropriate submerged macrophytes harvesting.

4. Discussion

4.1. Ecosystem Structure Differences

This study is very important for understanding the dynamic changes in the BYDL ecosystem, as many studies have indicated that this lake has experienced regime shifts [3]. The structure of the BYDL ecosystem changed significantly from 2018 to 2023. We documented that the changes occurred mainly in the biomass and energy transfer efficiency of functional groups (Table 3 and Figure 5). The first trophic level has the highest biomass, which is composed of submerged macrophytes, phytoplankton, and organic detritus. The first trophic level is dominated by submerged macrophytes. The conversion efficiency of energy transfer from primary producers to trophic level II was 44.3% higher in 2023 than in 2018, and the total system throughput expanded as submerged macrophytes biomass increased. With submerged macrophytes’ recovery, BYDL shifted from a turbid phytoplankton-dominated state to a clear submerged macrophyte-dominated state. This was for several reasons. First, with the increase in management efforts to control the discharge of nutrient-loading, the water quality was improved from Grade V to Grade III (Grade V is the worst). Thus, the dissolved oxygen and water transparency was improved, and the photosynthesis of submerged macrophytes was enhanced. Second, fish and macrozooplankton are also major biological factors influencing the algal-dominated lake and macrophyte-dominated lake regime shifts [27]. The biomass of carnivorous fish in the BYDL ecosystem in 2023 increased nearly threefold compared to 2018. The predation of carnivorous fish on benthic fish led to an increase in zooplankton abundance, which controlled the phytoplankton biomass [28]. In addition, the decline in the herbivorous fish populations also reduced grazing pressure on submerged plants, thereby increasing competition from submerged plants for phytoplankton. Finally, the maintenance of water level is the key to the growth of submerged macrophytes. In recent years, the water level (about 7 m) of BYDL has been maintained within the range suitable for the growth of submerged macrophytes through ecological water replenishment such as the South-to-North Water Diversion and Yellow River diversions project [29].
Under the premise of reducing external nutrient inputs, endogenous release is the main cause of eutrophication in lakes. Nitrogen released endogenously from lake sediments can continue to pollute water quality. Dredging can effectively remove nutrient-rich sediment to reduce endogenous release. However, the nitrogen (N)-loading reduction is relatively slow compared to the control effect of CODMn reduction. Therefore, TN and NH4+-N reduction was slightly retarded relative to CODMn, with the change point approximately around 2021. Overall, the stability of the BYDL ecosystem is subject to the interaction of multiple stressors, of which water quality improvement is a key factor. Regime shifts in shallow lakes are often initially caused by nutrient-loading. By controlling nutrient inputs, rational biomanipulation, and stable ecological water replenishment, submerged macrophytes gradually recovered over a 6-year period (Figure 4). The ecosystem of BYDL shows an improving trend, suggesting a succession of algal- to macrophytic-type in the lake type of BYDL, but its long-term stability still needs to be monitored.

4.2. Ecosystem Evolution Trends

In this study, we compared changes in the BYDL ecosystem between the two periods by using several ecological network analysis indices (Table 4). In general, TST is proportional to the scale of the system and increases with the total biomass flowing through the system [30]. Shallow lakes with higher biomass of macrophytes can sustain longer food chains, contributing to high energy flows in the ecosystem [31]. Compared with 2018, the submerged macrophytes with higher biomass in BYDL in 2023 increased the total system’s throughput and expanded the overall size of the system. As the size of the ecosystem expanded, the community structure within the system became more and more complex, and the system’s ability to resist external interference increased while the system also developed toward maturity. The TB/TST, CI, and SOI indices were all elevated, also demonstrating the system’s progression towards maturity. In 2018, the eutrophication of BYDL intensified due to excessive pollutants and nutrient loads, resulting in a significant increase in phytoplankton levels in the lake [32]. Consequently, system energy turnover was accelerated during this period, increasing the system cycling index, FCI. The high biomass of submerged macrophytes in the 2023 system increased total system primary production. However, the total respiration of the system decreased significantly due to a 79% decrease in herbivorous fish biomass, a 41% decrease in fingerling biomass, and an 81% decrease in benthic biomass. The system’s total primary production far exceeded total respiration, resulting in increased TPP/TR. After we simulated harvesting by reducing the biomass of submerged macrophytes in the system, TPP/TR was reduced from 1.84 to 1.34, which is closer to the ratio of 1 for mature systems. Therefore, we recommend suitable harvesting of submerged macrophytes to improve the maturity of the system.
Overall, the TST, TB/TST, CI, and SOI indices have increased from 2018 to 2023, indicating a steady developing trend in the BYDL ecosystem over the past six years. Since 2018, ecological restoration measures implemented in the XNA have played a role in restoring the BYDL system, and the resulting effects have maintained the stability of the ecosystem through a series of feedback mechanisms. In addition, by comparing the ecological network analysis indicators with other lake systems in China (Table S4, Supplementary Information), it was also confirmed that the BYDL ecosystem is in an immature but developing state.

4.3. Potential Drivers of Ecosystemic Change

Unfortunately, the EwE model we used is a static model that provides a snapshot of system change and can track the structure of the food web within the ecosystem. However, we cannot directly identify external drivers of ecosystem change in the present study. The ecosystem changes in BYDL are the result of a combination of factors. We speculate that factors such as nutrient load reduction, stable hydrological management, and rational biomanipulation are the main drivers influencing ecosystem changes. It is reported that 54 fish species were in the BYDL survey in 1958; in later years, the drought and the construction of reservoirs upstream led to the disappearance of migratory fish as well as a continuous decline in the total number of fish species—only 28 species of fish were found in 2018 [32]. In addition, the coupling and superposition of factors such as high release rate of sediment, pollution discharge, flood control, and rainfall have led to a serious degree of eutrophication in the lake, which is prone to triggered cyanobacterial blooms [8]. Since the establishment of the XNA in 2017, according to the “Ecological environment governance and protection plan for BYDL (2018–2035)”, which requires comprehensive regulation of the water environment of BYDL and adheres to systematic governance and the idea of “source control-pollution interception—water replenishment”, ecological restoration has been carried out deeply [33]. The water environment of BYDL has effectively improved through reduced pollution discharge from rivers, dredging, ecological water replenishment, fish resource enhancement, and a new fishing ban, with the number of fish species gradually recovering from 27 in 2018 to 34 in 2023. Improved water quality has contributed to the gradual dominance of submerged macrophytes. The single energy utilization way of submerged macrophytes in the 2023 ecosystem resulted in the energy of submerged macrophytes not being utilized adequately. The dead remains of submerged macrophytes eventually become detritus, recycled, or mineralized. To reduce the accumulation of large amounts of detrital sediments in the system, large-scale dredging has been carried out in BYDL. However, this has also caused damage to benthic habitats, as well as anthropogenic disturbance, resulting in a lower total biomass of zoobenthic in 2023 compared to 2018. It has been shown that sediment habitats play an important role in the structure and diversity of benthic communities and that dredging can disrupt the composition of benthic communities, especially for benthic molluscs, and those benthic communities are not sufficiently restored in a short period of time, resulting in potentially lower benthic community diversity [34]. Dredging can reduce the abundance and diversity of fish due to alteration of sediment conditions and the destruction of their habitat [35]. Dredging causes sudden changes in hydrological conditions and physical indicators of the water body, such as changes in dissolved oxygen, pH, transparency, etc., which in turn causes a series of aquatic biological responses. Sediment resuspension affects nutrient release and light inhibition, which in turn affects aquatic community structure [36]. Consequently, the reduction in herbivorous fish biomass has also been affected by dredging, as well as by the rising pressure from predation and interspecific competition. In addition, detritus itself can increase system stability by influencing the composition of the food web [37]. Large-scale dredging can remove large amounts of detritus from the system. Therefore, the effects of the extent of dredging on ecosystem health need to be further investigated. These factors may have contributed to a slight decrease in the total conversion rate of the system in 2023 (7.587 percent) compared to 2018 (6.369 percent), which is below the optimal “1/10 Law” for the energy conversion efficiency of the eco-pyramid [26]. However, compared to other lakes in China, the total ecosystem conversion rate of BYDL in 2023 (6.369 percent) was higher than that of Lake Wuli (4.9 percent) and Lake Qiandao (3.5 percent), and lower than that of Lake Taihu (10.87 percent) and Lake Dianshan (11.7 percent).

4.4. Management Recommendations for the Lake

The environmental characteristics of BYDL are the result of the interaction between natural geography and anthropogenic activities. For a long time, with socio-economic development, the increased input of exogenous pollutants and the reduced fishery resources caused by anthropogenic factors have led to significant changes in the structure and function of the ecosystem of BYDL. Fisheries can be put on a sustainable path through the limitation of fishing efforts [38]. In recent years, new fishery management regulations have been implemented in BYDL, prohibiting fishing from May to August each year, which has to some extent alleviated the pressure of overfishing. Moreover, together with the implementation of stock enhancement activities, these have to some extent repaired the structure of the food web of BYDL. BYDL ecosystem-based management recommendations for the future are proposed based on the findings of this study. Firstly, releasing species is adjusted through regular assessment of the effectiveness of enhancement and release. In general, controlling small-sized planktivorous fish may be difficult, while regulating larger-sized fish is comparatively easier [39]. Therefore, we propose assessing the ecological capacity of carnivorous fish and rationally regulating the fish community structure in the lake through biomanipulation. Based on the field survey and EwE model analysis, BYDL has a low number of herbivorous fish. Therefore, herbivorous fish should be released through proliferation, which can balance the community structure of lake fish and improve the utilization rate of submerged macrophytes through the feeding effect of herbivorous fish. Finally, due to the high biomass of the lower TLs in BYDL (e.g., high biomass of submerged plants 3667.2 t/(km2·a)), the decomposition of submerged macrophytes releases nitrogen and phosphorus. In particular, Potamogeton crispus L. transfers 71.5% of its phosphorus to water in dissolved and suspended detritus states. This can easily affect the water quality, triggering algal blooms. Therefore, it is necessary to harvest submerged macrophytes at the appropriate time. Studies have shown that harvesting large aquatic plants in autumn is more effective and can improve the ecosystem’s maturity [40]. Overall, although the Baiyangdian ecosystem shows an improving trend, the long-term stability of its ecosystem remains to be monitored. We recommend that changes in the Baiyangdian ecosystem be monitored continuously to more accurately assess the effectiveness of ecological restoration measures and make timely adjustments to management strategies.

5. Conclusions

This study managed to construct an EwE-based mass-balance model to quantitatively describe the changes in ecosystem structure and function in BYDL leading up to 2023. Upon comparison with the 2018 EwE model, significant changes in the biomass of species within the BYDL ecosystem were observed. Notably, the biomass of submerged macrophytes underwent the most significant change, and the biomass of carnivorous fish also changed considerably. We analyzed the annual biomass changes in submerged macrophytes and phytoplankton, and found that the biomass of submerged macrophytes had the opposite trend to that of phytoplankton. Combined with water quality indicators, TN, NH4+-N, and CODMn were significantly decreased in BYDL during the restoration. TN and NH4+-N had a change point in approximately 2021. BYDL’s ecosystem may be transitioning from an algal-dominated lake to a submerged macrophyte-dominated lake. Overall, the XNA has taken a series of ecological restoration measures for BYDL and has had a positive effect on the BYDL ecosystem. These result in the Baiyangdian ecosystem being immature but developing from 2018 to 2023. Nutrient load reduction, dredging, and fishery management might be key drivers causing changes in the structure and function of the BYDL ecosystem. The present study was the first to quantitatively analyze the impacts of multiple external anthropogenic activities on the BYDL ecosystem from a systemic perspective, and provides hints for achieving sustainable management of BYDL. Taking Lake BYD as a case area, the use of the EwE model provided a new perspective for us to quantitatively explore ecosystem changes in different periods, and the model will undoubtedly become a key tool for the increasingly urgent needs of integrated ecosystem management in the future.

Supplementary Materials

The following supporting information can be downloaded at: https://www.mdpi.com/article/10.3390/su16219372/s1, Table S1: Species composition for Ecopath model of Lake Baiyangdian in 2023; Table S2: Diet composition for the 2023 model of Lake Baiyangdian; Table S3: Trophic decomposition of function groups in the Lake Baiyangdian ecosystem; Table S4: Comparison of ecological network analysis indicators in different shallow lakes in China. Table S5: Sensitivity of the estimated parameters when input parameters value were varied for the 2023 model of the Baiyangdian Lake. References [41,42,43,44,45,46] are cited in the supplementary materials.

Author Contributions

H.L.: Conceptualization, methodology, investigation, writing—original draft, and writing—review and editing. Y.S.: Formal analysis, writing—review and editing. J.M.: Formal analysis, investigation, funding acquisition, and data curation. Z.L.: Investigation, formal analysis, and methodology. L.J.: Investigation, writing—review and editing. C.L.: Funding acquisition, methodology, and supervision. Y.Z.: Data curation and writing—review & editing. All authors have read and agreed to the published version of the manuscript.

Funding

This work was supported by the Hebei Provincial Key Research and Development Program Projects (20373603D); Open Foundation of Hebei Key Laboratory of Wetland Ecology and Conservation (No. hklk201905); Talent Fund of Hebei University (521000981303).

Institutional Review Board Statement

Not applicable.

Informed Consent Statement

Not applicable.

Data Availability Statement

The data presented in this study are available on request from the corresponding authors.

Acknowledgments

The authors sincerely thank all the students and staff who provided their input to this study. Our acknowledgments are also extended to the anonymous reviewers for their constructive feedback.

Conflicts of Interest

The authors declare no conflicts of interest.

References

  1. Scheffer, M.; Carpenter, S.; Foley, J.A.; Folke, C.; Walker, B. Catastrophic Shifts in Ecosystems. Nature 2001, 413, 591–596. [Google Scholar] [CrossRef] [PubMed]
  2. Scheffer, M.; Carpenter, S.R. Catastrophic Regime Shifts in Ecosystems: Linking Theory to Observation. Trends Ecol. Evol. 2003, 18, 648–656. [Google Scholar] [CrossRef]
  3. Xu, C.; Yin, X.; Xu, Z.; Liu, H.; Yang, Y.; Yang, Z. Simulating the Effects of Regulation Measures on Ecosystem State Changes in a Shallow Lake. Ecol. Indic. 2018, 92, 72–81. [Google Scholar] [CrossRef]
  4. Cao, Y.; Langdon, P.G.; Chen, X.; Huang, C.; Yan, Y.; Jia, Y.; Zeng, L. Regime Shifts in Shallow Lake Ecosystems along an Urban-Rural Gradient in Central China. Sci. Total Environ. 2020, 733, 139309. [Google Scholar] [CrossRef]
  5. Wu, M.; Zhang, X.; Reis, S.; Ge, S.; Gu, B. Pollution Controls in Lake Tai with the Reduction of the Watershed Nitrogen Footprint. J. Clean. Prod. 2022, 332, 130132. [Google Scholar] [CrossRef]
  6. Blindow, I.; Hargeby, A.; Hilt, S. Facilitation of Clear-Water Conditions in Shallow Lakes by Macrophytes: Differences between Charophyte and Angiosperm Dominance. Hydrobiologia 2013, 737, 99–110. [Google Scholar] [CrossRef]
  7. Hilt, S.; Köhler, J.; Adrian, R.; Monaghan, M.T.; Sayer, C.D. Clear, Crashing, Turbid and Back—Long-Term Changes in Macrophyte Assemblages in a Shallow Lake. Freshwater Biol. 2013, 58, 2027–2036. [Google Scholar] [CrossRef]
  8. Zhang, X.; Yi, Y.; Yang, Z. The Long-Term Changes in Food Web Structure and Ecosystem Functioning of a Shallow Lake: Implications for the Lake Management. J. Environ. Manage. 2022, 301, 113804. [Google Scholar] [CrossRef]
  9. Zhang, X.; Yi, Y.; Yang, Y.; Liu, H.; Yang, Z. Modelling Phosphorus Loading to the Largest Shallow Lake in Northern China in Different Shared Socioeconomic Pathways. J. Clean. Prod. 2021, 297, 126537. [Google Scholar] [CrossRef]
  10. Tang, C.; Yi, Y.; Zhang, Y.; Zhou, Y.; Teklit, Z.H.; Wang, X.; Cui, X.; Duan, P. Planktonic Indicators of Trophic States for a Shallow Lake (Baiyangdian Lake, China). Limnologica 2019, 78, 125712. [Google Scholar] [CrossRef]
  11. Yang, Y.; Chen, H. Assessing Impacts of Flow Regulation on Trophic Interactions in a Wetland Ecosystem. J. Environ. Inform. 2013, 21, 63–71. [Google Scholar] [CrossRef]
  12. Guo, C.; Ye, S.; Lek, S.; Liu, J.; Zhang, T.; Yuan, J.; Li, Z. The Need for Improved Fishery Management in a Shallow Macrophytic Lake in the Yangtze River Basin: Evidence from the Food Web Structure and Ecosystem Analysis. Ecol. Model. 2013, 267, 138–147. [Google Scholar] [CrossRef]
  13. Christensen, V.; Pauly, D. ECOPATH II—A Software for Balancing Steady-State Ecosystem Models and Calculating Network Characteristics. Ecol. Model. 1992, 61, 169–185. [Google Scholar] [CrossRef]
  14. Christensen, V.; Walters, C.J. Ecopath with Ecosim: Methods, Capabilities and Limitations. Ecol. Model. 2004, 172, 109–139. [Google Scholar] [CrossRef]
  15. Ofir, E.; Gal, G.; Goren, M.; Shapiro, J.; Spanier, E. Detecting Changes to the Functioning of a Lake Ecosystem Following a Regime Shift Based on Static Food-Web Models. Ecol. Model. 2016, 320, 145–157. [Google Scholar] [CrossRef]
  16. Neira, S.; Moloney, C.; Christensen, V.; Cury, P.; Shannon, L.; Arancibia, H. Analysing Changes in the Southern Humboldt Ecosystem for the Period 1970–2004 by Means of Dynamic Food Web Modelling. Ecol. Model. 2014, 274, 41–49. [Google Scholar] [CrossRef]
  17. Li, H.; Shen, H.Y.; Li, S.J.; Liang, Y.Z.; Lu, C.Y.; Zhang, L.L. Effects of eutrophication on the structure and function of the benthic-planktonic coupled food web in Baiyangdian Lake. Acta Ecol. Sin. 2018, 38, 2017–2030. (In Chinese) [Google Scholar]
  18. Zeng, Y.; Zhao, Y.; Qi, Z. Evaluating the Ecological State of Chinese Lake Baiyangdian (BYD) Based on Ecological Network Analysis. Ecol. Indic. 2021, 127, 107788. [Google Scholar] [CrossRef]
  19. Wang, X.; Wang, Y.; Liu, L.; Shu, J.; Zhu, Y.; Zhou, J. Phytoplankton and Eutrophication Degree Assessment of Baiyangdian Lake Wetland, China. Sci. World J. 2013, 2013, 436965. [Google Scholar] [CrossRef]
  20. Guo, S.Y.; Wang, J.G.; Wang, Y.; Chen, Z.H.; Yan, J. Analysis on the changes of structure and function of Baiyangdian ecosystem in recent 10 years based on Ecopath model. Asian J. Ecotoxicol. 2020, 15, 169–180. (In Chinese) [Google Scholar]
  21. Su, H.; Wu, Y.; Xia, W.; Yang, L.; Chen, J.; Han, W.; Fang, J.; Xie, P. Stoichiometric Mechanisms of Regime Shifts in Freshwater Ecosystem. Water Res. 2019, 149, 302–310. [Google Scholar] [CrossRef] [PubMed]
  22. Christensen, V. Ecosystem Maturity—Towards Quantification. Ecol. Model. 1995, 77, 3–32. [Google Scholar] [CrossRef]
  23. Shan, K.; Li, L.; Wang, X.; Wu, Y.; Hu, L.; Yu, G.; Song, L. Modelling Ecosystem Structure and Trophic Interactions in a Typical Cyanobacterial Bloom-Dominated Shallow Lake Dianchi, China. Ecol. Model. 2014, 291, 82–95. [Google Scholar] [CrossRef]
  24. Darwall, W.R.T.; Allison, E.H.; Turner, G.F.; Irvine, K. Lake of Flies, or Lake of Fish? A Trophic Model of Lake Malawi. Ecol. Model. 2010, 221, 713–727. [Google Scholar] [CrossRef]
  25. Morissette, L.; Hammill, M.O.; Savenkoff, C. The trophic role of marine mammals in the northern gulf of st. lawrence. Mar. Mammal Sci. 2006, 22, 74–103. [Google Scholar] [CrossRef]
  26. Odum, E.P. The strategy of ecosystem development. Science 1969, 164, 262–270. [Google Scholar] [CrossRef] [PubMed]
  27. Noordhuis, R.; van Zuidam, B.G.; Peeters, E.T.H.M.; van Geest, G.J. Further Improvements in Water Quality of the Dutch Borderlakes: Two Types of Clear States at Different Nutrient Levels. Aquat. Ecol. 2015, 50, 521–539. [Google Scholar] [CrossRef]
  28. Williams, A.E.; Moss, B.; Eaton, J. Fish Induced Macrophyte Loss in Shallow Lakes: Top-down and Bottom-up Processes in Mesocosm Experiments. Freshw. Biol. 2002, 47, 2216–2232. [Google Scholar] [CrossRef]
  29. Yang, W.; Yang, Z. Effects of Long-Term Environmental Flow Releases on the Restoration and Preservation of Baiyangdian Lake, a Regulated Chinese Freshwater Lake. Hydrobiologia 2014, 730, 79–91. [Google Scholar] [CrossRef]
  30. Brothers, S.M.; Hilt, S.; Meyer, S.; Köhler, J. Plant Community Structure Determines Primary Productivity in Shallow, Eutrophic Lakes. Freshw. Biol. 2013, 58, 2264–2276. [Google Scholar] [CrossRef]
  31. Ziegler, J.P.; Solomon, C.T.; Finney, B.P.; Gregory-Eaves, I. Macrophyte Biomass Predicts Food Chain Length in Shallow Lakes. Ecosphere 2015, 6, art5. [Google Scholar] [CrossRef]
  32. Zhu, H.; Liu, X.-J.; Cheng, S. Phytoplankton Community Structure and Water Quality Assessment in an Ecological Restoration Area of Baiyangdian Lake, China. Int. J. Environ. Sci. Technol. 2021, 18, 1529–1536. [Google Scholar] [CrossRef]
  33. Tong, J.K.; Chen, H.Y.; Li, N.; Li, P.Y.; Di, S.A.; Ma, B.L. Study on water pollution prevention and control of sewage outlets in key areas around Baiyangdian Lake. In Proceedings of the 23rd Academic Annual Meeting of the Environmental Science Society of Five Provinces and Cities in North China, 2023; pp. 127–132. (In Chinese). [Google Scholar]
  34. Barrio Froján, C.R.S.; Cooper, K.M.; Bremner, J.; Defew, E.C.; Wan Hussin, W.M.R.; Paterson, D.M. Assessing the Recovery of Functional Diversity after Sustained Sediment Screening at an Aggregate Dredging Site in the North Sea. Estuar. Coast. Shelf S. 2011, 92, 358–366. [Google Scholar] [CrossRef]
  35. Andrew, G.P.; Philip, B.; Kate, L.; Mathers, J.P.; Paul, J.W.; Dapeng, Y. The effects of water injection dredging on low-salinity estuarine ecosystems: Implications for fish and macroinvertebrate communities. Ecol. Indic. 2020, 122, 107224. [Google Scholar]
  36. Yan, J.L.; Li, F. Effects of sediment dredging on freshwater system: A comprehensive review. Environ. Sci. Pollut. 2023, 30, 119612–119626. [Google Scholar] [CrossRef]
  37. Moore, J.C.; Berlow, E.L.; Coleman, D.C.; Ruiter, P.C.; Dong, Q.; Hastings, A.; Johnson, N.C.; McCann, K.S.; Melville, K.; Morin, P.J.; et al. Detritus, Trophic Dynamics and Biodiversity. Ecol. Lett. 2004, 7, 584–600. [Google Scholar] [CrossRef]
  38. Pauly, D.; Christensen, V.; Guénette, S.; Pitcher, T.J.; Sumaila, U.R.; Walters, C.J.; Watson, R.; Zeller, D. Towards Sustainability in World Fisheries. Nature 2002, 418, 689–695. [Google Scholar] [CrossRef]
  39. Kong, X.; He, Q.-S.; Yang, B.; He, W.; Xu, F.-L.; Annette, B.G.J.; Kuiper, J.J.; van Gerven, L.P.A.; Qin, N.; Jiang, Y.; et al. Hydrological Regulation Drives Regime Shifts: Evidence from Paleolimnology and Ecosystem Modeling of a Large Shallow Chinese Lake. Glob. Chang. Biol. 2017, 23, 737–754. [Google Scholar] [CrossRef]
  40. Li, C.; Xian, Y.; Ye, C.; Wang, Y.; Wei, W.; Xi, H.; Zheng, B. Wetland Ecosystem Status and Restoration Using the Ecopath with Ecosim (EWE) Model. Sci. Total Environ. 2019, 658, 305–314. [Google Scholar] [CrossRef]
  41. Zhao, X.H.; Xu, D.P.; Ren, L.; Xu, R. Ecological capacity assessment of silver carp and bighead carp in Taihu Lake based on Ecopath model. J. Fish. Sci. China 2021, 28, 785–795. (In Chinese) [Google Scholar]
  42. Liu, E.S.; Li, Y.K.; Zang, R.W.; Wang, H. Preliminary analysis on the structure and function of Chaohu Lake ecosystem based on Ecopath model. J. Fish. Sci. China 2021, 38, 417–425. (In Chinese) [Google Scholar]
  43. Yu, J.; Liu, J.R.; Wang, L.; Wu, Z.X.; Yu, Z.M.; Liu, M.L. Structure and function analysis of Qiandao Lake ecosystem based on Ecopath model. Acta Hydrobiol. Sin. 2021, 45, 308–317. (In Chinese) [Google Scholar]
  44. Feng, D.X.; Chen, L.; Li, Y.K.; Yu, N.; Chen, L.Q. Ecosystem structure and energy flow characteristics of Dianshan Lake based on nutrient channel model. J. Fish. Sci. China. 2011, 18, 867–876. (In Chinese) [Google Scholar]
  45. Huang, X.F.; Gao, X.W.; Chen, J.C. Study on nutritional structure and energy flow of Wuli Lake ecosystem based on Ecopath model. J. Fish. Sci. China 2012, 19, 417–481. (In Chinese) [Google Scholar]
  46. Guo, C.; Chen, Y.; Li, W.; Xie, S.; Lek, S.; Li, Z. Food web structure and ecosystem properties of the largest impounded lake along the eastern route of China’s South-to-North Water Diversion Project. Ecol. Inform. 2018, 43, 174–184. [Google Scholar] [CrossRef]
Figure 1. Location and distribution of sampling sites for Lake Baiyangdian (BYDL).
Sustainability 16 09372 g001
Figure 2. Changes in submerged macrophytes (yellow) and phytoplankton biomass (blue) for the period 2018 to 2023. Both submerged macrophytes and phytoplankton biomass are expressed as annual averages. The units are converted to tonnes of wet weight per square kilometer.
Sustainability 16 09372 g002
Figure 3. Regime shifts of water quality indexes in Lake Baiyangdian for ammonia nitrogen (NH4+-N), permanganate index (CODMn), total phosphorus (TP), and total nitrogen (TN). Note that data are presented as mean ± standard error. Breaks between different colored lines indicate the locations of tipping points. The bar plots indicate the average value of water quality indices for different years. Student’s t-test was used to identify the possibility of regime shifts. ** p < 0.01, *** p < 0.001.
Sustainability 16 09372 g003
Figure 4. A food web of the Lake Baiyangdian ecosystem for 2023 (see Table 1 for definitions of functional group names). The circle represents functional group biomass (a bigger circle equals a higher biomass), and the line represents the proportion of diet available to the predator (thicker lines equal a larger proportion of diet).
Sustainability 16 09372 g004
Figure 5. The Lindeman spine for the 2018 (a) and 2023 (b) models. A description detailing the inflow and outflow processes for each box is provided at the figure’s base. The values for all transfers are expressed in t/(km2·a), and the biomass is denoted in t/km2.
Sustainability 16 09372 g005
Table 1. Input and output parameters of the BYDL ecosystem for 2023 the EwE model.
GroupAbbreviationTrophic
Level
Biomass
(t/km²)
P/BQ/BEEP/Q
1. SnakeheadSna3.493.070.863.860.2800.223
2. Large culters LarC3.476.780.673.200.4350.211
3. Common carpComC2.505.051.9810.690.9720.185
4. Crucian carpCruC2.4514.811.729.100.8470.189
5. Other carnivorous fish OcF3.485.950.923.800.3540.242
6. Filter-feeding fishFifF2.532.501.678.000.9520.209
7. Other benthivorous fishObF2.600.9252.48.290.9310.290
8. Herbivorous fishesHerF2.010.821.478.230.8180.179
9. FingerlingFing2.353.553.2611.000.8490.296
10. MacrocrustaceansMacr2.434.115.224.230.5780.215
11. Benthic mollusksBenM2.3234.323.3627.200.0040.124
12. MicrozoobenthosMicr2.40.88120.1268.300.7930.295
13. ZooplanktonZoop223.6251.51316.20.3790.163
14. PhytoplanktonPhyt136.65159 0.681
15. Submerged macrophytesSubM136671.25 0.082
16. DetritusDitritus149.78 0.458
Table 2. Biomass (t/km2) of functional groups for 2018 and 2023 in Lake Baiyangdian.
Group Name20182023
Carnivorous fish5.8715.8
Filter-feeding fish0.022.50
Omnivorous fish21.8520.79
Herbivorous fish 3.770.82
Fingerling6.003.55
Mollusk35.9534.32
Other meiobenthos26.054.99
Zooplankton15.9323.62
Phytoplankton42.8536.65
Submerged macrophytes874.933667.20
Detritus324.5049.78
Table 3. Transmission efficiency among nutrient levels of BYD Lake ecosystem in 2018 and 2023.
ParameterIn the Year 2018In the Year 2023
IIIIIIVIIIIIIV
Producer %4.1289.15320.515.9556.3376.790
Detritus %3.1716.35315.876.0916.2656.828
All flows %3.4837.22617.356.0206.3026.809
Proportion of total flow originating from detritus 0.660.46
From primary producers9.185%6.351%
From detritus6.837%6.387%
Total transfer efficiencies 7.587%6.369%
Table 4. Ecological network analysis indicators of change in the Lake Baiyangdian ecosystem in 2018 and 2023 (58.3% of submerged macrophytes harvested).
Parameter20182023Harvest Simulated Output in 2023
Total system throughput (t/km2)24,95828,03422,689
Total primary production/total respiration1.511.841.37
Total biomass/total throughput (/a)0.0410.1360.074
Connectance index0.270.330.33
System omnivory index0.0970.1680.168
Finn’s cycling index (FCI)36.408.3912.45
Disclaimer/Publisher’s Note: The statements, opinions and data contained in all publications are solely those of the individual author(s) and contributor(s) and not of MDPI and/or the editor(s). MDPI and/or the editor(s) disclaim responsibility for any injury to people or property resulting from any ideas, methods, instructions or products referred to in the content.