Article

Analysis of Mechanisms and Environmental Sustainability in In Situ Shale Oil Conversion Using Steam Heating: A Multiphase Flow Simulation Perspective

by
Zhaobin Zhang
1,2,*,
Zhuoran Xie
1,2,
Maryelin Josefina Briceño Montilla
1,2,
Yuxuan Li
1,2,
Tao Xu
1,2,
Shouding Li
1,2 and
Xiao Li
1,2
1
Key Laboratory of Shale Gas and Geoengineering, Institute of Geology and Geophysics, Chinese Academy of Sciences, Beijing 100029, China
2
College of Earth and Planetary Sciences, University of Chinese Academy of Sciences, Beijing 100049, China
*
Author to whom correspondence should be addressed.
Sustainability 2024, 16(21), 9399; https://doi.org/10.3390/su16219399
Submission received: 4 September 2024 / Revised: 12 October 2024 / Accepted: 28 October 2024 / Published: 29 October 2024
(This article belongs to the Section Energy Sustainability)

Abstract

:
Shale oil as an unconventional energy source holds significant extraction value. However, traditional extraction techniques often entail significant environmental impacts, emphasizing the need for more sustainable and environmentally friendly methods. In situ conversion of shale oil using superheated steam fits this bill. Based on this, we used a new TFC coupling simulator to build a geological model, providing a comprehensive depiction of the evolution process of various elements during in situ conversion by steam, thereby investigating the feasibility of this method. The results show that based on the temperature distribution within the shale oil reservoir during the heating stage, the area between the heating well and the production well can be divided into five regions. In addition, the steam injected contributes to driving the oil. However, due to the relatively low energy density of the steam, a large amount of steam needs to be injected into the reservoir in order to attain the intended heating outcome, resulting in a high ratio of liquid water in the produced products. Meanwhile, the evolution of components during in situ conversion is influenced by factors such as the injection rate of steam and soaking time. A slow injection rate and prolonged soaking time are both adverse to extraction of shale oil. On this basis, the in situ conversion heating strategy can be refined.

1. Introduction

Shale oil refers to petroleum stored in shale formations with nanoporous structures rich in organic matter. It is classified as an unconventional oil and gas resource. Shale oil can be extracted by heating to decompose kerogen and other organic materials in the oil shale [1,2]. China has abundant oil shale resources, amounting to 7.199 trillion tons, which can potentially yield approximately 476 billion tons of shale oil, ranking second in the world [3]. The exploitation of shale oil can greatly lessen the burden on oil supply.
Presently, the main methods for extraction of shale oil include in situ conversion technology and surface retorting technology [4,5]. Surface retorting technology involves mining oil shale to the surface and heating it in a retort furnace to 450–600 °C to pyrolyze the kerogen within, followed by using separation devices to obtain oil and gas [6]. This process requires open-pit mining and is mainly suitable for shallow shale oil. Meanwhile, this method generates a large number of polluting gases and waste residues during extraction [7]. Due to the low maturity of kerogen typically found in shale oil reservoirs, poor formation permeability, deep burial, and increasing environmental protection requirements, in situ conversion technology has become a more reasonable method of mining shale oil [8,9].
The in situ conversion technology of shale oil refers to the process of artificially heating the shale oil reservoir to pyrolyze the kerogen within into oil and gas for extraction [10]. This technique can be applied to deeper shale oil reservoirs and allows for resource conversion within a relatively small underground area [11,12]. Since large-scale surface mining and excavation are not required, in situ conversion technology has advantages such as being environmentally friendly, efficient, and cost-effective, offering significant development potential [13]. Currently, based on different heating methods, in situ conversion techniques can be divided into four categories: (1) heat conductive [14], (2) heat radiation [15], (3) combustion approaches [16], and (4) heat convection. Heat convection involves injecting high-temperature fluid into the reservoir through injection wells to heat the formation [17]. Using high-temperature steam as a heat carrier can significantly increase the heat exchange area, thereby improving heating efficiency and heat utilization. Additionally, the injection of high-temperature steam enhances the mobility of oil and gas and reduces the oxygen content in the reservoir, creating an anoxic environment that allows for more complete pyrolysis of organic matter instead of combustion [16]. Therefore, convective heating is considered a feasible in situ conversion technology.
In convection technology, steam, CO2, and N2 can all be used as heat-carrying fluids [16]. Currently, some researchers have conducted studies on in situ conversion extraction of shale oil using thermal convection heating. Chevron’s CRUSH technology [18] uses high-temperature carbon dioxide as a heat carrier to heat the reservoir. Mountain West Energy’s in situ gas-extraction technology [19] heats the reservoir by compressing the hydrocarbon gases within it, thereby inducing the pyrolysis of kerogen in the reservoir. Zhao et al. [20] applied for a patent for the in situ conversion by injecting steam in 2005. The process generally involves arranging multiple wells in the shale oil reservoir and connecting the wells within the reservoir through hydraulic fracturing. Some wells are used as injection wells to inject high-temperature steam into the reservoir. The high-temperature steam flows through the fractures in the reservoir and pyrolyzes the kerogen in the formation. The remaining wells are used as production wells to extract the pyrolysis products to the surface for oil and gas separation. Compared to CO2 and N2, using superheated steam for the in situ conversion of shale oil has the following advantages: (1) The cost of heating steam is low, and the process is simple [20]. (2) The water can be purified and reused, achieving both economic and environmental benefits [20]. (3) Using high-temperature steam as a heat carrier can increase the yield of oil and gas obtained from in situ conversion [21,22]. In summary, high-temperature steam can serve as an excellent heat carrier for in situ conversion of shale oil.
At the same time, several laboratory-scale investigations have examined the features and mechanisms of shale oil pyrolysis under fluid heating conditions. Saif et al. [23] analyzed the pore evolution characteristics of oil shale during the heating process and found that heating significantly increases the volume and connectivity of pores in the oil shale, thereby enhancing the permeability of the reservoir. Wang et al. [24] discovered that heating in shale oil reservoirs induces thermal fractures that connect with the pores, resulting in a final permeability that is several hundred times greater than its initial value, as determined by a high-temperature triaxial permeability test. Lee et al. [25] compared hydrocarbon production from kerogen in shale oil using electrical heating vs. a high-temperature steam injection and found that the hydrocarbon yield was higher with the high-temperature steam injection.
Experimental investigations of shale oil pyrolysis are often limited by laboratory conditions, with most studies focusing on specific aspects of shale oil or tending to provide qualitative descriptions of its conversion mechanisms. Consequently, these studies may not clearly and comprehensively reproduce the evolution of various components during in situ extraction of shale oil in more complex geological environments. To reveal this process, numerical simulation techniques need to be employed to establish a multiphase, multicomponent coupling field for accurate quantitative analysis. Huang et al. [26] established a thermal–hydraulic–mechanical–chemical coupling model to explore the evolution process of various components in in situ conversion technology. They also performed a sensitivity analysis on engineering parameters such as heating temperature and proposed a series of optimization schemes. Wang et al. [27] developed a numerical model considering the anisotropy of shale oil and analyzed the in situ conversion process under superheated steam heating. They found a significant correlation between heating efficiency and the anisotropy of reservoir permeability. Pei et al. [28] simulated the in situ conversion process by electrical heating and assisted nitrogen injection. The study found that nitrogen injection enhanced thermal convection, reservoir pressure, and the driving capability of oil and gas, thereby increasing the heating rate of the reservoir and improving oil recovery efficiency. In the aforementioned studies, various multiphase flow coupling models for describing in situ conversion of shale oil have been established; however, they lack detailed characterization of the multiphase thermal–fluid coupling process. Currently, there is no clear understanding of the specific flow and evolution patterns of components during the in situ conversion process following high-temperature water vapor injection.
To assess the feasibility of shale oil extraction through high-temperature steam injection, it is crucial to address challenges such as the progression of different components in the in situ conversion as well as the time and energy needed for complete organic matter pyrolysis, along with the resulting oil and gas recovery efficiency. This study uses a new TFC simulator to construct a geological model, offering an in-depth analysis of the phase and component changes occurring within the reservoir throughout the in situ conversion process. Additionally, sensitivity analyses are conducted on key parameters with the aim of determining the optimal conversion strategy.

2. Model

2.1. Thermo-Flow–Chemical (TFC) Coupling Model

In situ conversion is a multifaceted process involving multiphase flow, heat transfer, and phase transformation. To model this process, we developed a thermo-flow–chemical (TFC) coupling simulator. It effectively simulates phase transformation, multiphase flow, and heat transfer. It also accounts for the formation or dissociation of substances, phase transitions, and the related thermal effects. This tool has been utilized in various studies of unconventional oil and gas simulations [29,30,31]. The simulator is now open-source and can be downloaded for use from https://gitee.com/geomech/hydrate (accessed on 1 September 2024).
To simplify the model calculations, the following assumptions are made in the model: (1) The model involves a total of five components (kerogen, heavy oil, light oil, natural gas, coke, and water), where kerogen and coke are solids, natural gas is a gas, water considers the phase change between liquid and gas, and the other components are liquids. It is important to note that heavy oil, light oil, and natural gas are actually mixtures of various substances; however, in the model adopted in this paper, for simplification purposes, they are treated as pure substances composed of a single component, represented by C22H46, C11H24, and CH4. (2) The movement of each fluid phase adheres to Darcy’s law. (3) Liquids and solids have much lower compressibility compared to gases, so in the calculations, they are assumed to be incompressible, with their densities represented as constants. Although that is not entirely accurate, it has minimal impact on the final results.
The physical and chemical processes involved in the model can be broadly divided into three parts: fluid phase flow, heat transfer, and phase change. The specific equations used in the model are as follows:
The flow of each component in the simulation model is crucial throughout the entire simulation process. It is assumed that the flow of the fluid phases (gas, water, light oil, and heavy oil) follows Darcy’s law, which is expressed as follows:
v α = k k r , α μ α p α + ρ α g
where v is Darcy velocity vector (m/s), k is intrinsic permeability (m2), k r is relative permeability (dimensionless), μ is fluid dynamic viscosity (Pa · s), p is pressure (Pa), ρ is fluid density (kg/m3), and g is gravity vector (m/s2). The subscript α represents the corresponding fluid component.
In multiphase flow, relative permeability plays a critical role in influencing the flow resistance of each phase. The relative permeability of each phase is calculated using a modified Stone method [32]:
k r , α = s α s i r , α 1 s i r , α n α
where s i r , α is residual saturation (dimensionless) and n α is reduction exponent (dimensionless); its value changes according to reservoir properties.
The mass conservation equation is given as follows:
ϕ ρ α s α t = div ρ α v α
where ϕ is Porosity (dimensionless), t is time (s), and s α is volume fraction of phase α . Additionally, the sum of the saturations of all phases in the pore space equals 1. It is important to note that chemical reactions also alter the mass of various components. However, since an explicit method is used for calculating reactions, this implies that reactions and flow are treated as two independent processes. Therefore, the mass conservation equation in the flow process does not consider the chemical effects of the reaction.
In the above equation, the densities of the liquid and solid phases are constant, with specific values shown in Table 1. The density of methane gas is calculated through a function related to temperature and pressure [33]:
ρ g = M m p g × 10 6 R T 1.0 + 0.025 p g 0.000645 p g 2
where R is gas constant and M m is molecular mass of methane.
The viscosity coefficient of methane depends on pressure and temperature and is fitted using the following functions [34]:
μ g = 10.3 × 1 0 6 exp 1 + 0.053 p g 280 T 3
The density and viscosity coefficients of steam are obtained from the property tables published by the International Association for the Properties of Water and Steam (IAPWS-IF97) [35].
The viscosity coefficients of heavy oil and light oil are calculated using the following function [36]:
μ o i l = 10 a + b T + c T + d · T 2 3
The coefficients a, b, c, and d are selected based on the properties of the fluids. For light oil, the values are as follows: −5.0206, 894.52 K, 0.0096 K−1, −9.8 × 10⁻⁶ K−2. For heavy oil, the values are as follows: −4.5109, 1184.7 K, 0.0062 K−1, −5.4491 × 10⁻⁶ K−2. Additionally, solid phases (kerogen and coke) are considered to have no viscosity coefficients, as they are treated as non-flowing fluids.
Heat transfer involves two basic processes: heat conduction and heat convection. Heat conduction refers to the transfer of heat due to temperature gradients, while heat convection is the primary mechanism of heat transfer, involving the fluid itself carrying heat and inducing fluid movement. These are represented as follows:
q h e a t = λ T + α ρ α c α v α T
where q h e a t is heat flow, c is specific heat (J/(kg · K)), λ is thermal conductivity (W/(m · K)), and T is temperature (K). According to the principle of energy conservation, temperature change is determined by the transfer of heat, as expressed by the following equation:
div q h e a t = ϕ α ρ α c α s α + ρ s c s T t
where ρ s is bulk density (kg/m3) and c s is specific heat of the porous media (J/(kg · K)).
The phase changes involved in the simulation include the evaporation and condensation of water and the pyrolysis of organic matter. The specific reactions are as follows [37,38]:
K e r o g e n 0.6   C 22 H 46 + 0.1   C 11 H 24 + 0.1   C H 4 + 0.1   H 2 O + 0.1   C o k e
C 22 H 46 0.5   C 11 H 24 + 0.2   C H 4 + 0.3   C o k e
The reservoir temperature controls the pyrolysis of heavy oil and kerogen. Additionally, attention must be paid to the critical temperature required for these two reactions to occur, as well as the energy needed for the reactions to proceed (activation energy). The critical reaction temperature and activation energy for reaction (9) are 565 K and 161.6 kJ/mol, respectively, while for reaction (10), they are 603 K and 206.0 kJ/mol [39].

2.2. Model Verification

The TFC coupling simulator applied in the study has been validated at various scales through lab tests [29], established models [29], and actual field data [31]. However, it is essential to validate the chemical aspect. Presently, many lab tests have been conducted to investigate this. This simulator utilizes the classic experiment on pyrolysis of heavy oil conducted by Pei et al. to validate whether the phase transformation simulation during the pyrolysis of organic matter in the simulator is reliable [40,41].
Specifically, a core-scale experimental device is used in the experiment, not considering natural fractures. In the experimental sample, heavy oil density is 1007 kg/m3, viscosity is 191.6 Pa·S, and mass is 0.02 kg. Pyrolysis experiments were carried out under initial temperature of 599.15 K and pressure of 3.2 MPa. According to the experiment, the decomposition temperature of the heavy oil is over 623.15 K, pyrolysis produced 0.2671 of coke, 0.1721 of gas, and 0.5608 of light oil, (expressed in mass stoichiometric factors), with a rate constant reaction of 1.21·10−6 s−1. The aforementioned parameters were incorporated into the numerical model to calculate the mass of each component and compare it with the experimental results. The simulation results closely matched the experimental data, demonstrating that the chemical model accurately calculated the mass fractions of each component at different times. This confirms that the model can correctly simulate the shale oil extraction process (Figure 1).
Table 1. The main input parameters used in simulation model.
ParameterValueParameterValue
Initial temperature350 KInitial pressure20 MPa
Steam injection rate130 kg/daySteam temperature800 K
Reservoir porosity0.3Vertical heat conductivity 0.667   W · ( m · K)−1
Horizontal heat conductivity 2   W · ( m · K)−1Well produce pressure10 MPa
Horizontal permeability3 mDVertical permeability1 mD
Gas constant 8.314   J / ( mol · K)Molecular mass of methane0.016 kg/mol
Density of kerogen [42]2590 kg/m3Density of heavy oil [43]980 kg/m3
Density of light oil [43]797.2 kg/m3Density of water [35]985.8 kg/m3
Density of coke [42]1100 kg/m3Initial saturation of kerogen [44]0.6
Initial saturation of heavy oil [44]0.2Initial saturation of water [44]0.04

2.3. Model Setup

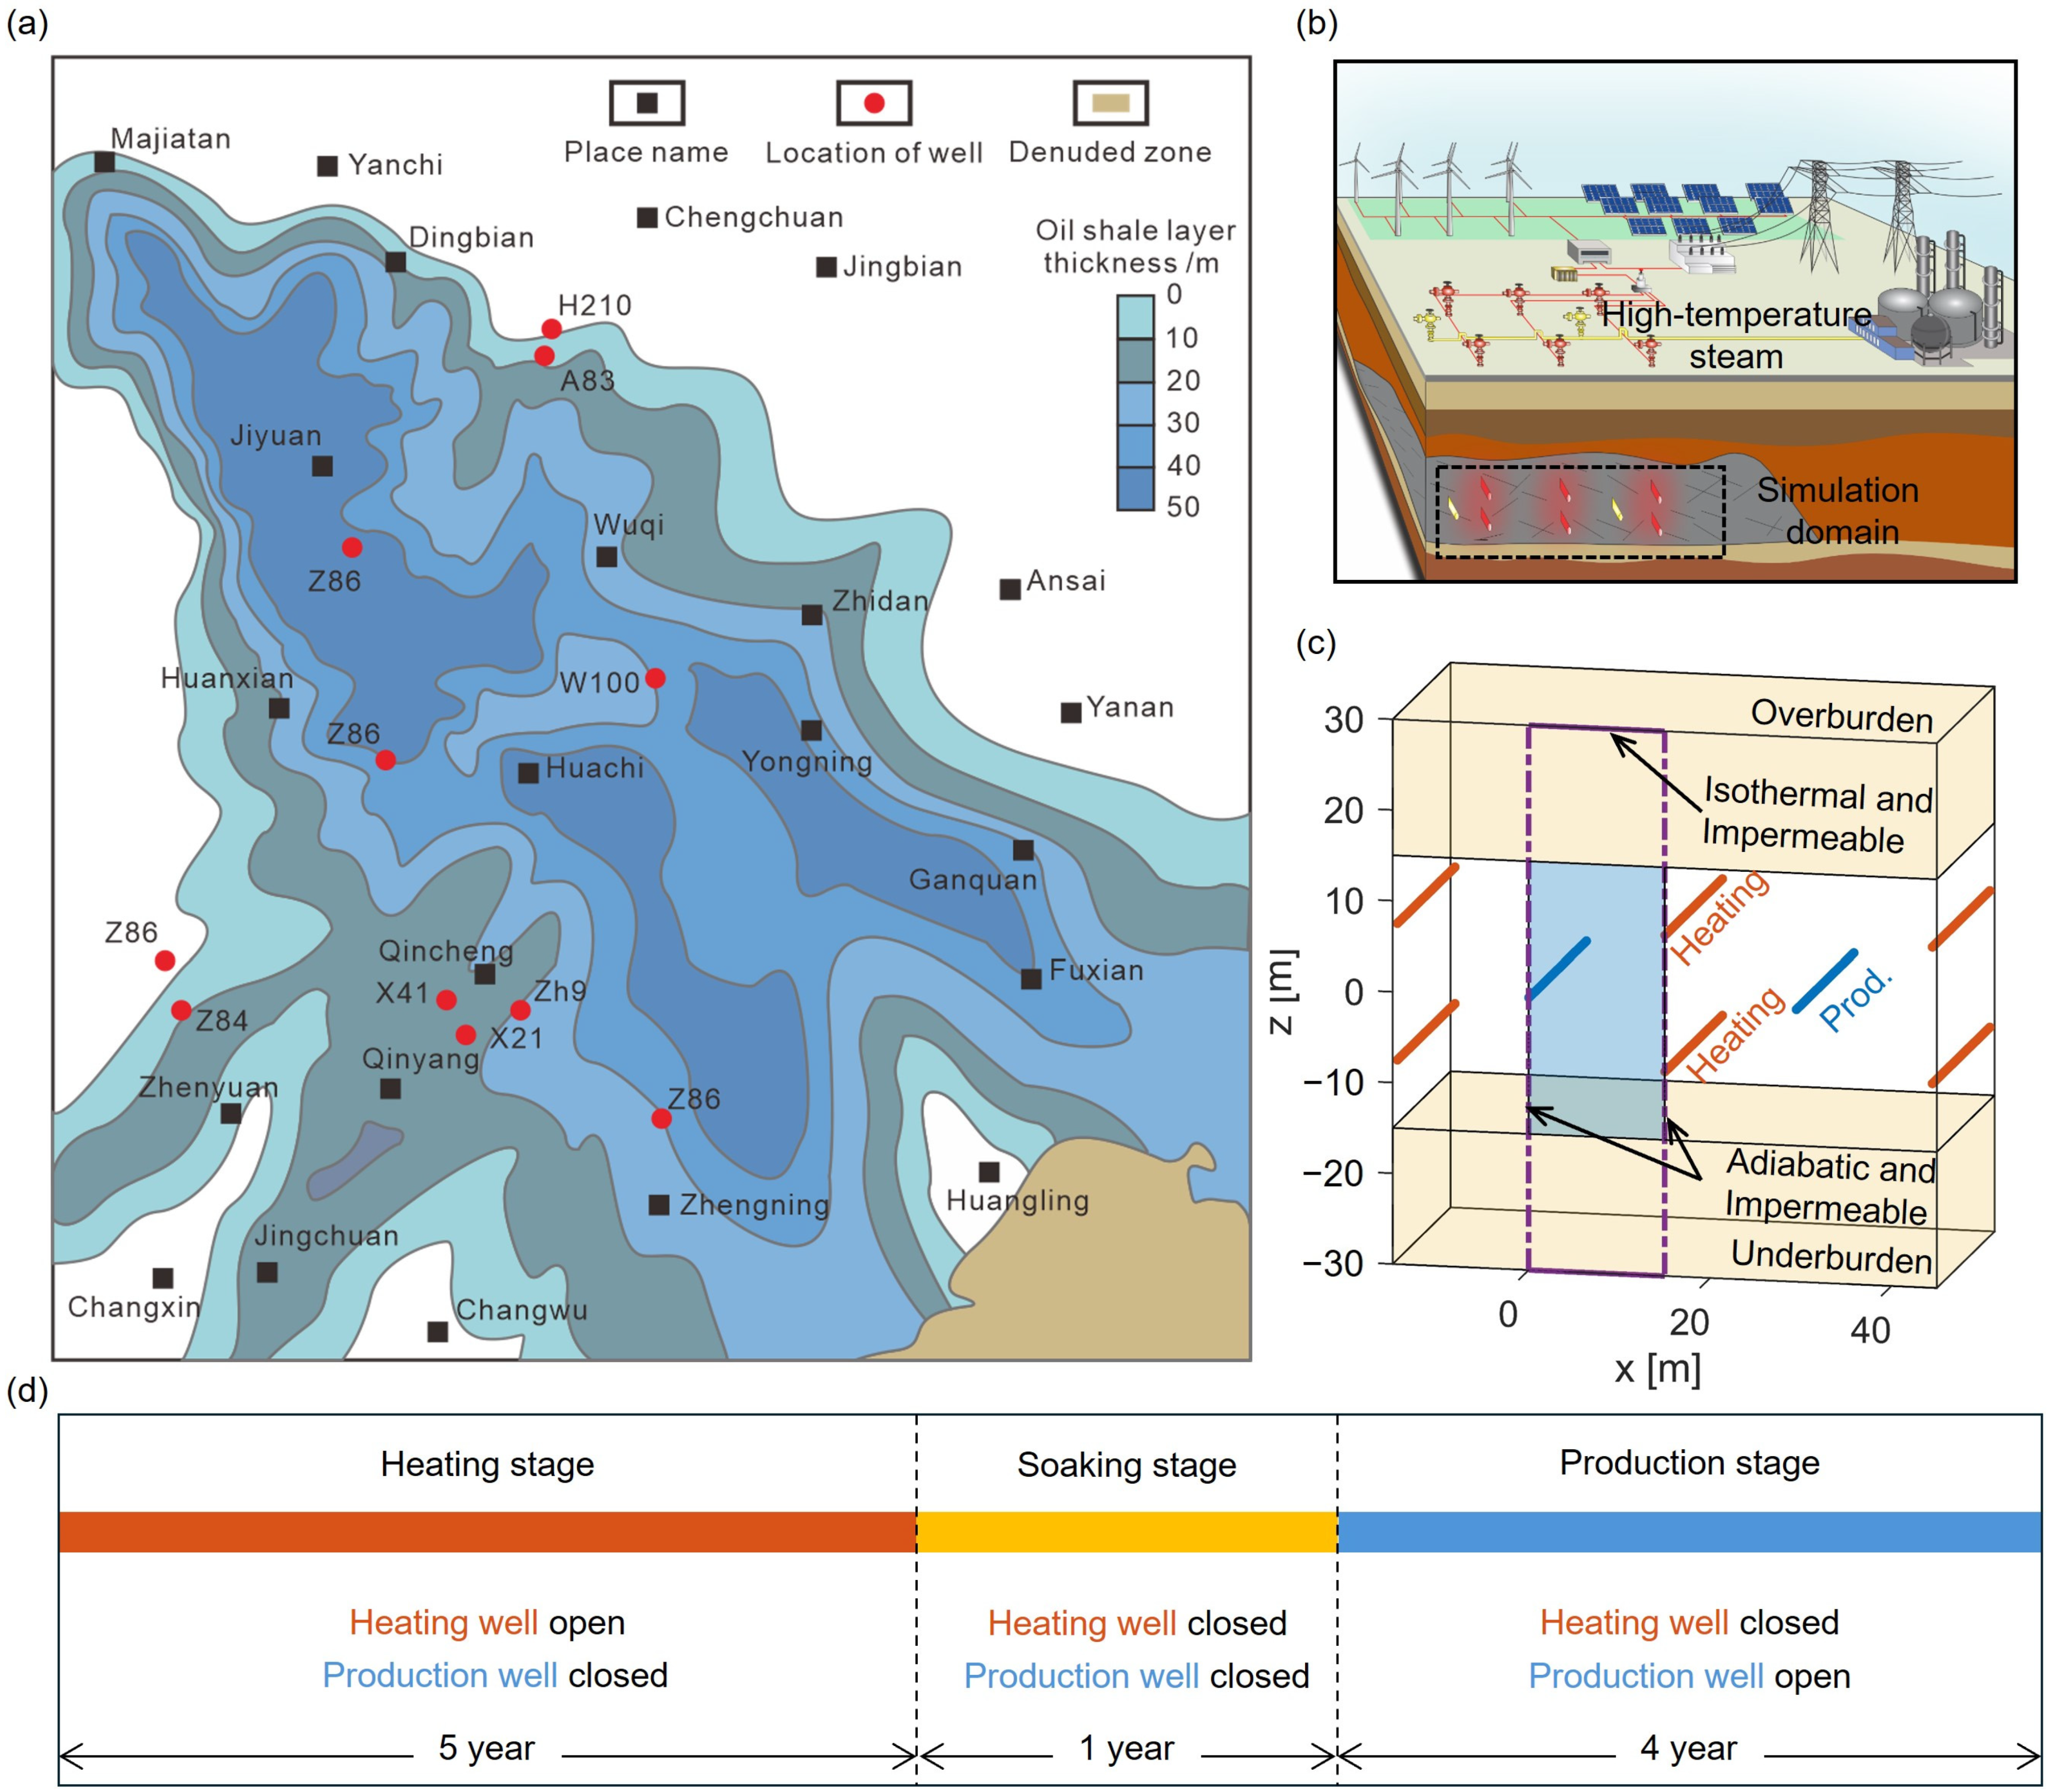
This paper is based on shale oil reservoir in the 7th member of YanChang formation, upper Triassic in Ordos Basin (Figure 2a). The saturation of each phase and porosity data inside the reservoir are derived from this. Two-dimensional geological model is used in this study to calculate a shale oil reservoir measuring 30 m in height and 15 m in length. Two heating wells and one production well are included within the calculation range (Figure 2b,c). Given that both the heating and production wells are horizontal, and assuming the reservoir’s homogeneity, the model can be extended further along the y-axis. For convenience in analysis, the thickness of the model for subsequent numerical calculations is set to 1 m. It is worth noting that this model can be considered part of a larger-scale well network, with similar models applicable to both sides of the current model. Due to the symmetry and continuity of the model and the presence of low-permeability rock layers both above and below the shale oil reservoir, the top and bottom boundaries of the model are set as impermeable and isothermal. The lateral boundaries are set as impermeable and adiabatic. The reservoir is defined as a homogeneous anisotropic medium, with horizontal permeability set to three times the vertical permeability. Steam is injected at a rate of 130 kg per meter of reservoir per day, with a temperature of 800 K, through the heating well. Additional parameters used in the model are provided in Table 1.
A 10-year simulation of the in situ conversion process for shale oil extraction was conducted. Depending on the operational states of the heating and production wells, the entire process can be segmented into three distinct stages (Figure 2d): Heating stage (0–5 years): in this stage, the production wells are closed, and the heating wells are open, injecting superheated steam into the shale oil reservoir. Soaking stage (5–6 years): Both the production wells and the heating wells are closed. The purpose of this stage is to allow the residual heat from the 5-year heating stage to be fully utilized. During this stage, the heat enables more thorough pyrolysis of organic matter. Production stage (6–10 years): the heating wells remain closed while the production wells are opened to extract the oil and gas produced by pyrolysis.

3. Results

3.1. Evolution of Steam, Liquid Water, and Temperature Fields

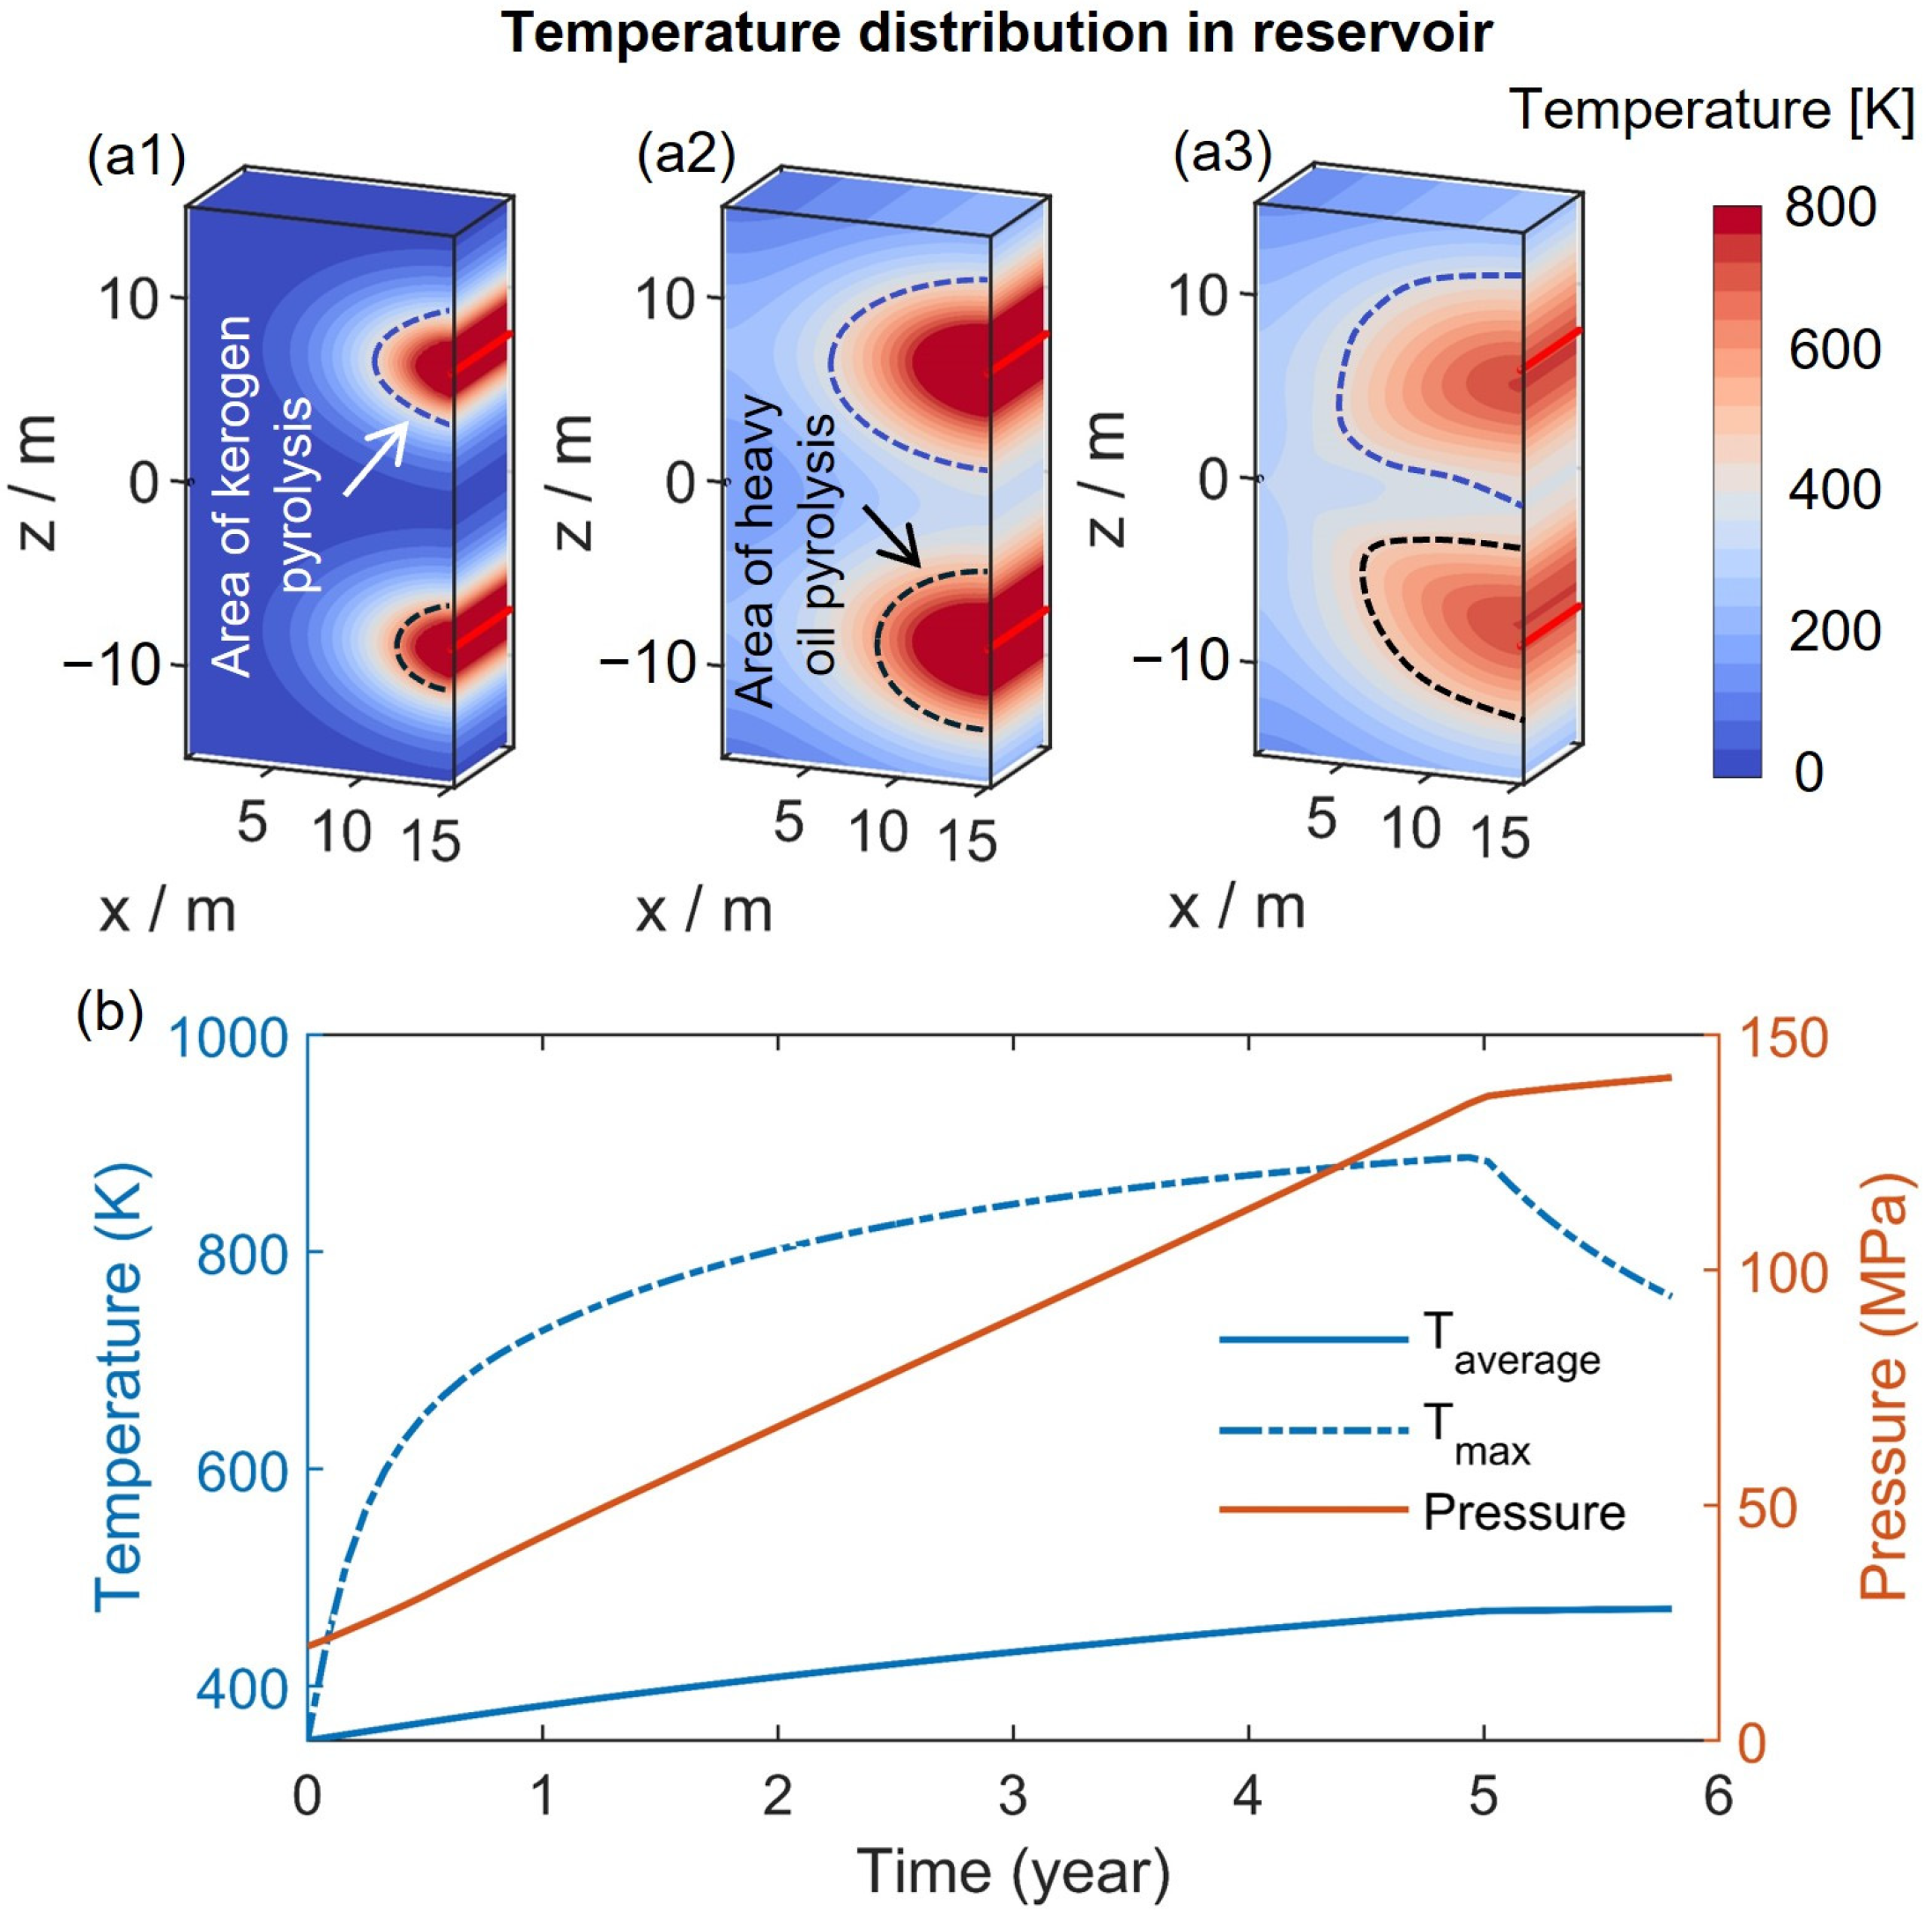
In the initial heating stage, as the steam is injected, the total mass of steam in the reservoir increases. A layer of steam forms around the heating well (Figure 3a,b). However, the volume of the high-temperature steam infused into the reservoir needs to be significantly greater than the actual increase in the volume of high-temperature steam (Figure 3c). It is evident that a significant portion of the injected steam is consumed. There are two main pathways for the consumption of steam: (1) Due to the high pressure, the boiling point of water in the reservoir is very high. (2) The heat in the steam is consumed during heat transfer and chemical reactions, leading to its condensation into liquid water. This is similar to the conclusions drawn by Chen et al. [39], who simulated the steam injection process for shale oil extraction and found that steam injection significantly increased the saturation of liquid water in the reservoir. But during the initial stage, the reservoir temperature has not yet reached the critical temperature required for the pyrolysis of kerogen and heavy oil. The loss of heat is relatively small. Therefore, although a portion of the steam is consumed through the aforementioned two pathways during the initial heating phase, the total amount of steam in the reservoir increases. At this stage, the high-temperature region in the reservoir is concentrated around the heating well, and the maximum temperature in this area rises rapidly with the continuous injection of steam (Figure 4). After approximately 0.5 years of heating, the temperature near the heating well reaches the critical temperature required for the pyrolysis of organic matter. Some of the energy carried by the water vapor is consumed during pyrolysis and condenses into liquid form. However, because the range of reactions is relatively small and the required energy is relatively low when kerogen and heavy oil initially begin to pyrolyze, the total amount of steam in the reservoir continues to increase. Nonetheless, after a certain period of pyrolysis reactions, the rate of increase gradually slows down to zero (Figure 3c).
After 1 year of heating, the total mass of steam begins to diminish. This is because, as the pyrolysis range of organic matter gradually expands, more energy is required. The accumulated steam in the reservoir is insufficient to sustain the pyrolysis reactions, and the subsequently injected steam is quickly consumed as well. Additionally, with the injection of steam and the pyrolysis of organic matter, the pressure in the reservoir gradually increases, leading to a further rise in the boiling point of water. Considering the above factors, the water vapor content begins to continuously decrease (Figure 3c). During this process, the maximum temperature is basically stable due to the limit of the boiling point of steam (Figure 4b). The temperature trend obtained is similar to the results simulated by Jin et al. [45] after injecting steam into the shale oil reservoir. However, due to the lower reservoir pressure and steam injection temperature in that study compared to this work, the stabilized maximum temperature is lower.
During the soaking stage, the injection of steam is stopped, and the steam in the reservoir completely condenses into liquid form. In the subsequent process, the steam content in the reservoir remains zero. Additionally, during the soaking stage, the high-temperature zones concentrated around the heating well begin to dissipate, and the temperature distribution within the reservoir gradually becomes more uniform. This leads to the overall average temperature of the reservoir increasing, despite a reduction in the maximum temperature within the reservoir (Figure 4b).

3.2. Pyrolysis Characteristics

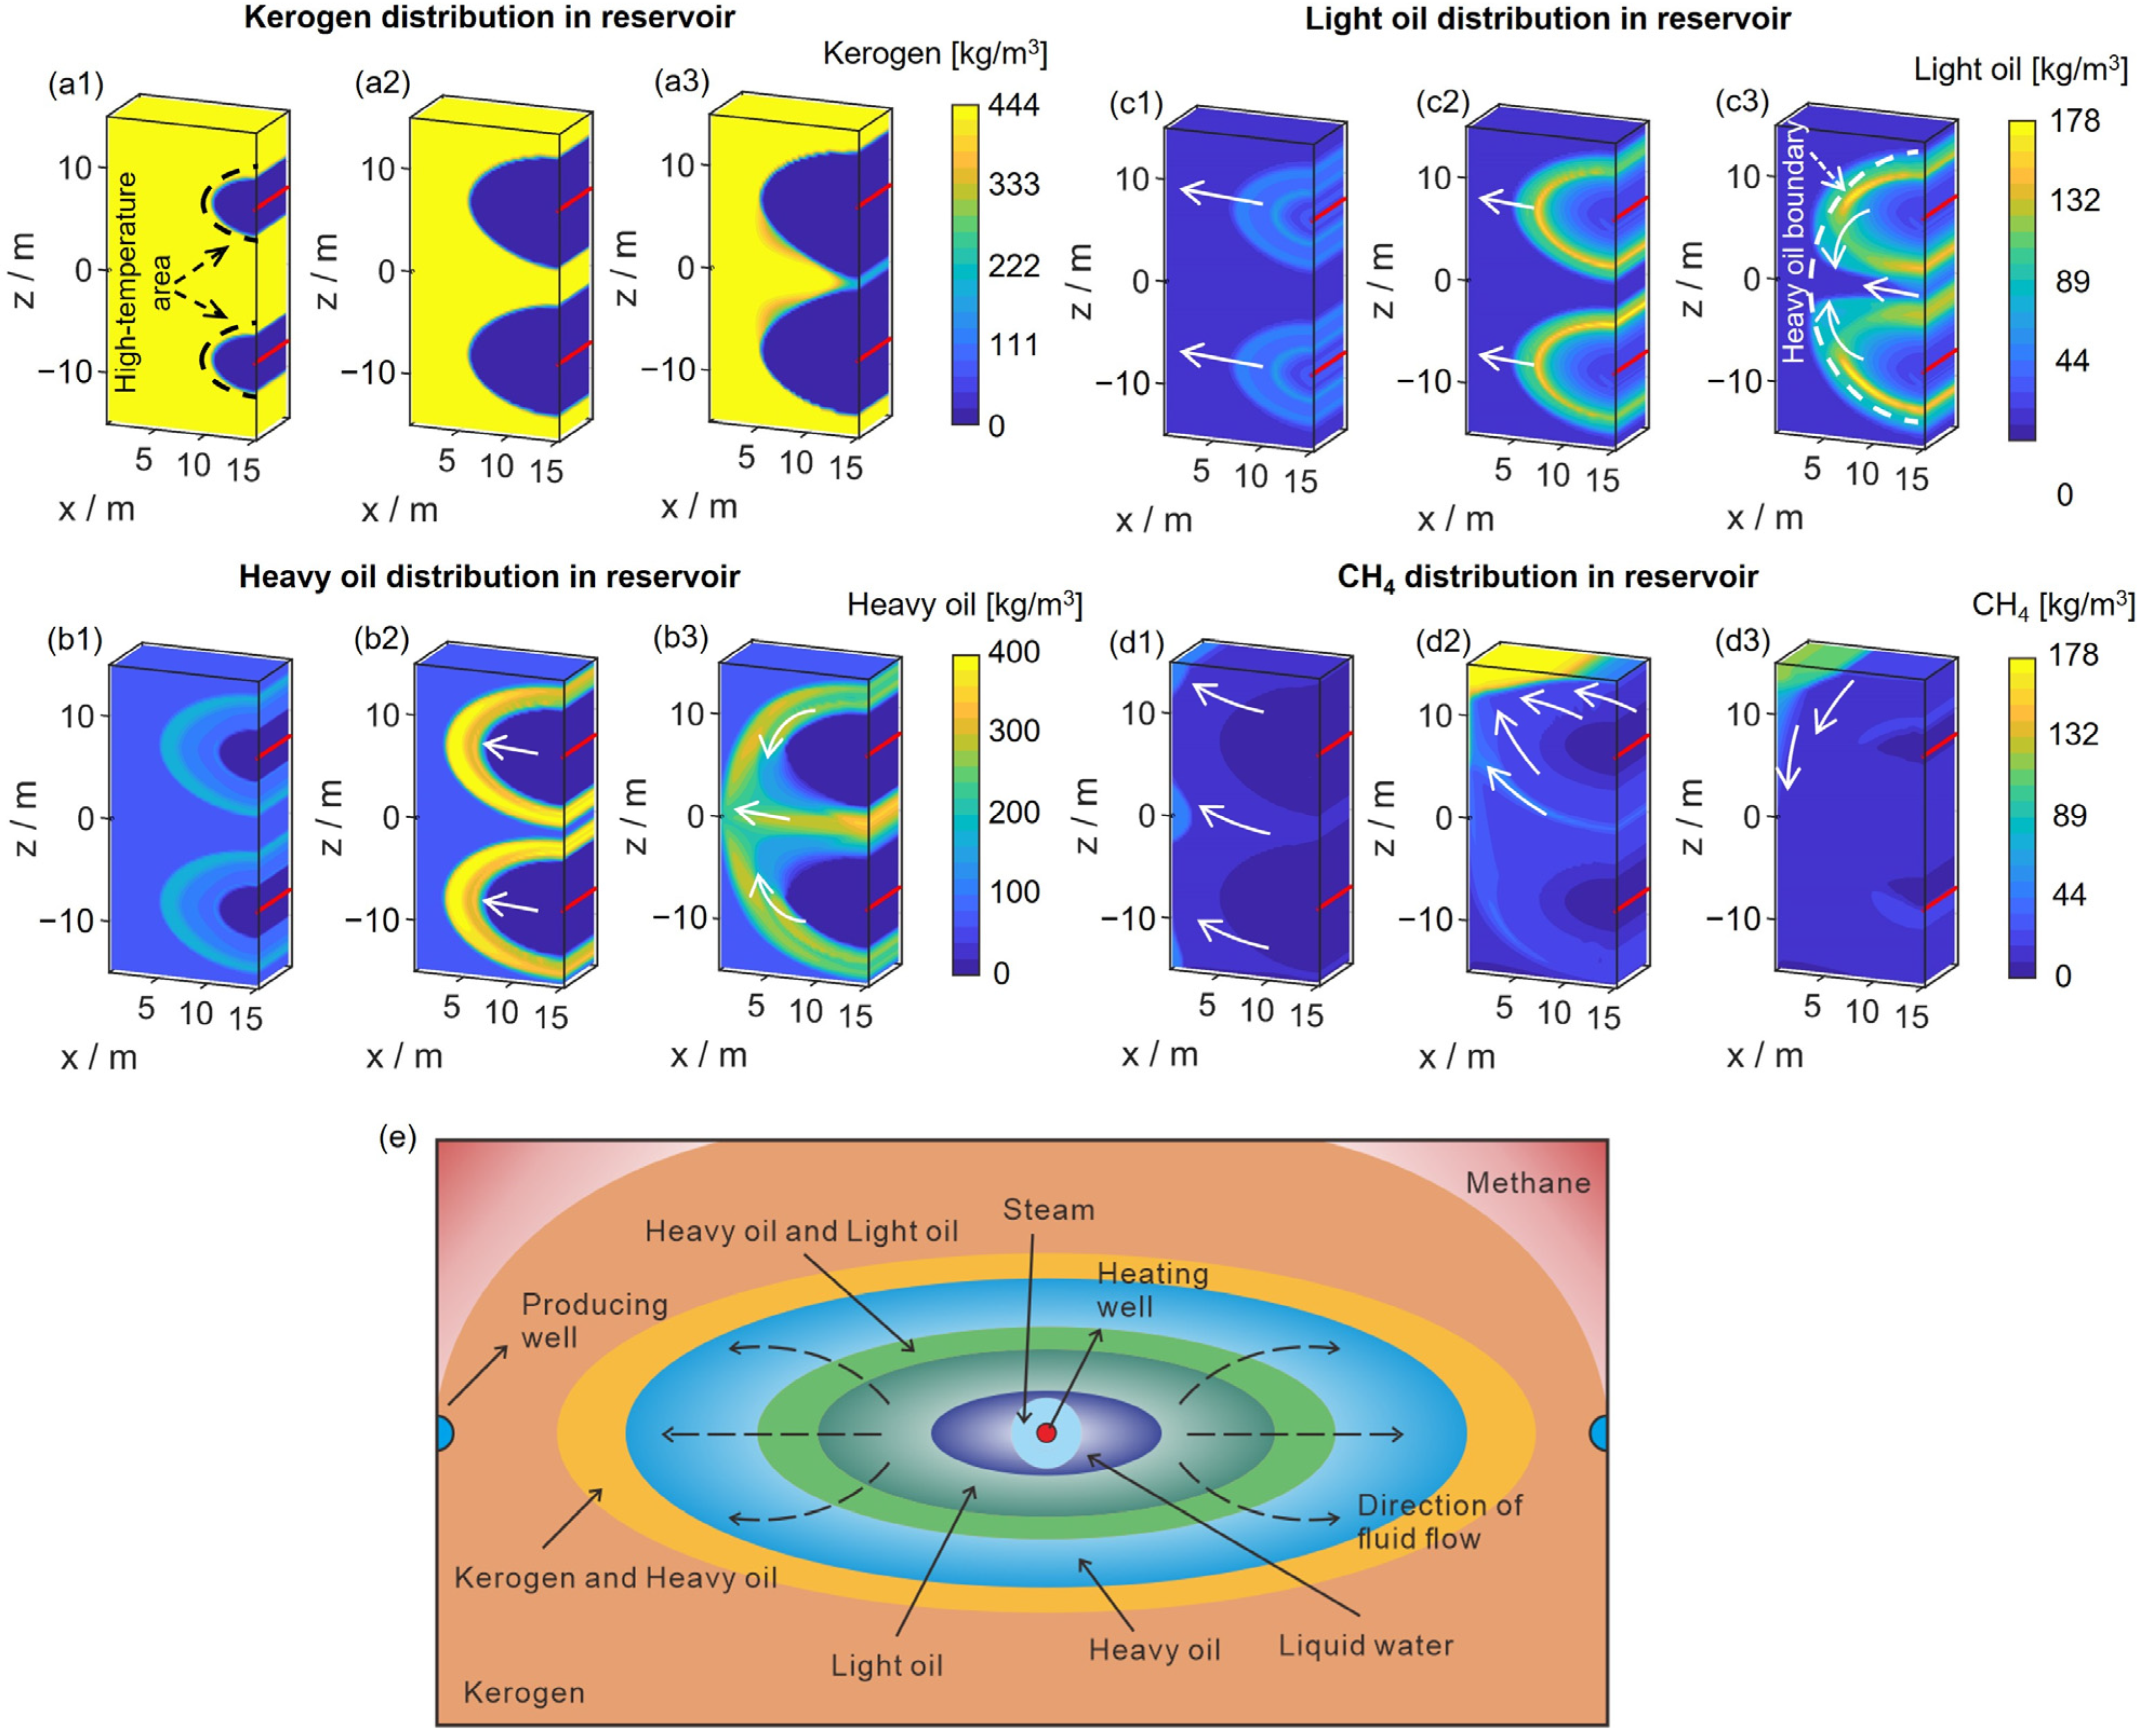
Under the influence of superheated steam, the substances in the reservoir undergo decomposition. During this process, the distribution of components is mostly in the form of approximate elliptical rings centered around the heating well, with each layer typically having a relatively clear boundary. This distribution is closely related to fluid migration, heat transfer, the sequence of different components’ generation, and differences in viscosity. Centered around the heating well, the layers from the innermost to the outermost are the steam layer, liquid water layer, light oil layer, heavy oil layer, kerogen layer, and methane layer (Figure 5e). The formation reasons for layers of different substances vary. The evolution of the steam layer near the heating well and the liquid water layer formed by the condensation of steam have been described in detail in the previous section.
Next are the heavy oil, light oil, and kerogen layers. These organic matters undergo mutual conversion during the heating stage, so their distribution areas in the reservoir overlap significantly. The main chemical reactions in the in situ conversion process involve the pyrolysis of kerogen and heavy oil, and the beginning of these reactions depends on whether the critical temperature is met. The critical temperature for kerogen pyrolysis is 565 K, while that for heavy oil pyrolysis is 603 K, which is slightly higher than that of kerogen. Since the maximum temperature in the reservoir gradually increases over time, the pyrolysis of heavy oil occurs with a certain delay compared to kerogen. As both kerogen and heavy oil pyrolysis can produce light oil, and since these reactions do not occur simultaneously, there are also differences in saturation within the light oil layer. Centered around the heating well, the saturation of light oil shows a trend of low-high-low as it extends outward. The outermost light oil layer, with lower saturation, is at a lower temperature and is produced solely from kerogen pyrolysis. The middle light oil layer, with the highest saturation, is the product of simultaneous pyrolysis of both kerogen and heavy oil. Additionally, due to the continuous injection of steam and the thickening of the liquid water layer, light oil originally located near the heating well is displaced outward by the water. This not only increases the saturation in the middle of the light oil layer but also reduces the saturation within the light oil layer. Heavy oil decomposes into light oil and methane, while also receiving replenishment from the kerogen pyrolysis occurring in the outer regions. Thus, a higher saturation heavy oil layer forms between the light oil layer and the kerogen layer. On the outermost side of the heating well, there is also a smaller layer of methane gas above the reservoir. Due to the low viscosity of the gas phase, the methane formed from pyrolysis migrates quickly, moving rapidly to the outermost part of the reservoir under the influence of pressure differences and concentration gradients. Additionally, because of methane’s low density, it is also affected by buoyancy and accumulates at the top of the reservoir.
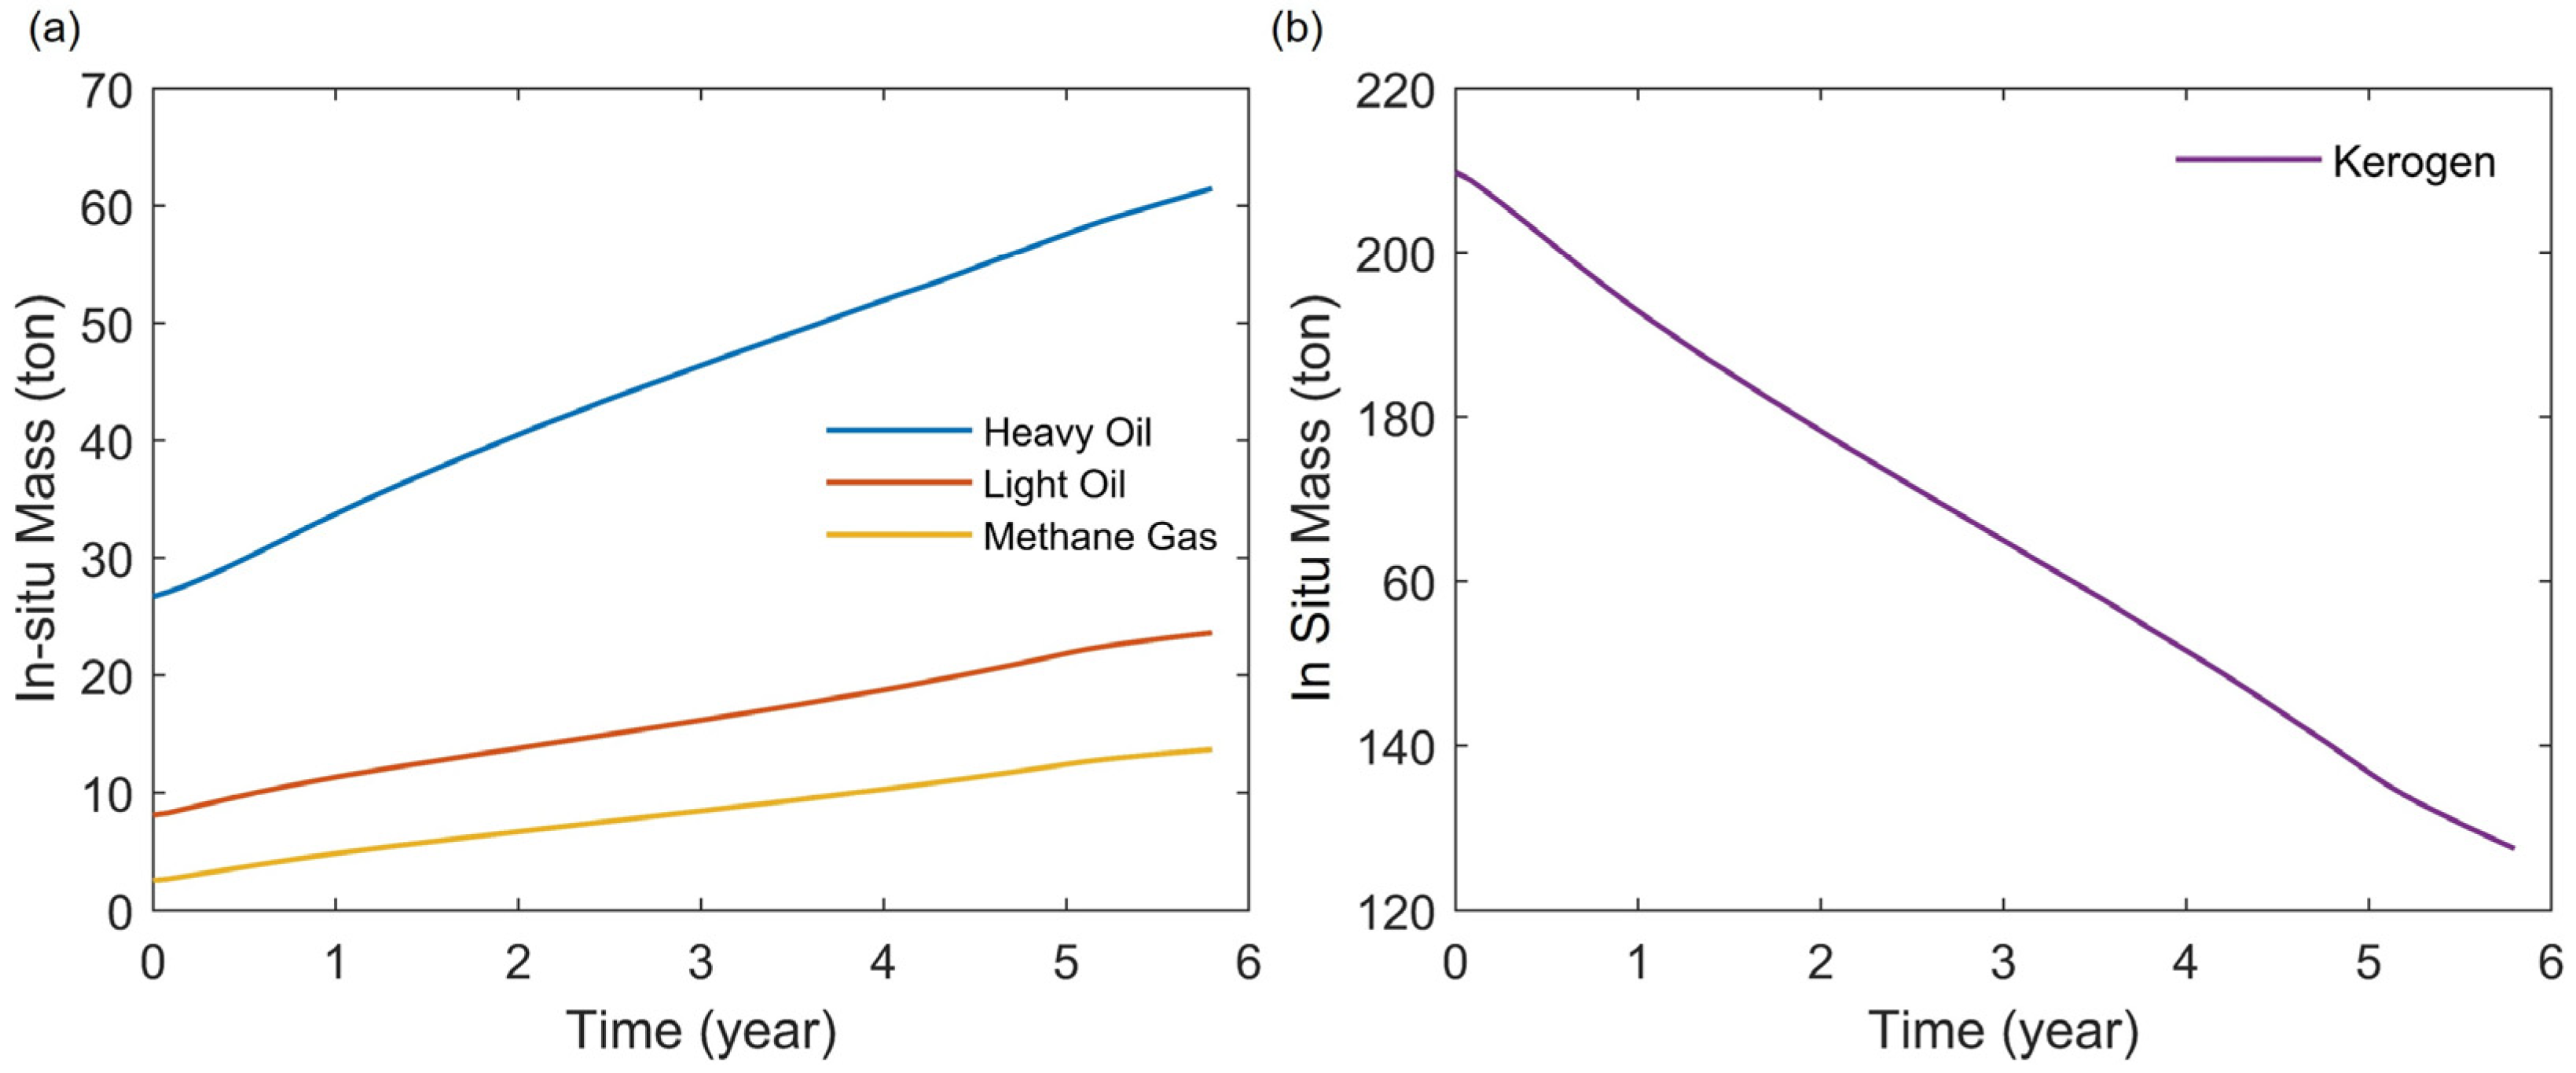
During the heating and soaking stages, the total mass of light oil, heavy oil, and methane shows an increasing trend, except for kerogen (Figure 6). Light oil and CH4 are decomposition products of heavy oil and kerogen; their concentrations in the reservoir continue to increase with the ongoing decomposition of both substances. Heavy oil not only undergoes decomposition, but also is a product of kerogen pyrolysis. Additionally, kerogen pyrolysis requires a lower temperature and has a broader reaction range. Overall, during the heating stage, the content of heavy oil continues to increase. Kerogen is the only substance that solely acts as a reactant; its concentration steadily decreases as the in situ conversion progresses. It is noteworthy that kerogen pyrolysis does not cease immediately with the cessation of steam injection but continues under residual heat. Kerogen pyrolysis persists until the production stage, and it does not stop until then.

3.3. Production Characteristics

After the 6-year heating and soaking stages, the heating well is kept closed, and the production well is opened. The shale oil produced is extracted through pressure differences and the flow of reservoir fluids. The products include light oil, heavy oil, CH4, and water. Kerogen and coke without fluidity cannot be produced through the production well (Figure 7).
During the production stage, the sequence of production and the proportions of various substances in the shale oil reservoir generally align with the results simulated by Lee et al. [46]: Liquid water accounts for the largest proportion and the initial production rate of methane is faster compared to other components. This is because of the large amount of superheated water vapor injected into the reservoir. Meanwhile, at the moment the production well is opened, a large amount of methane immediately escapes from the reservoir, and the cumulative production of methane stabilizes within just 0.1 years. This is primarily due to the relatively concentrated distribution of methane in the reservoir, with its lower density causing it to be mainly located above the production well. And as the only gaseous component among the products, methane has a lower viscosity and flows more rapidly. Therefore, methane is produced at the fastest rate during the initial stages of production. Additionally, the production of light oil starts with a slight delay relative to other substances. This is because the distribution of light oil is trapped by the kerogen layer and heavy oil layer. Only after some of the heavy oil has escaped can light oil migrate towards the vicinity of the production well and start production. Additionally, although the production rates of methane, heavy oil, and light oil become very slow in the later stages, they continue for about 0.6 years before completely stopping. This is because, under residual heat, the temperature during the production stage is still sufficient to allow for the pyrolysis of kerogen and heavy oil. Heavy oil, light oil, and methane are all products of kerogen pyrolysis, and thus they nearly cease production simultaneously with the end of the pyrolysis reactions.

4. Sensitivity Analysis

By analyzing the baseline case, we investigated the heating mechanisms and the evolution of various components during the shale oil in situ conversion process. However, in this case, organic matter in the reservoir was not completely pyrolyzed by the end of the in situ extraction process. This is closely related to the total amount of heat injected into the reservoir and the efficiency of heat utilization. The rate and duration of the steam injection determine the total amount of energy supplied to the reservoir. Increasing the soaking time theoretically allows more time for the pyrolysis of organic matter, potentially improving energy utilization efficiency. Therefore, this section analyzes sensitivity parameters such as steam injection rate and soaking time to explore the component content in the final products and the efficiency of energy utilization under different operational conditions.

4.1. Steam Injection Rate

Two injection strategies can be employed by varying the steam injection rate: 1. Maintaining the same injection duration while varying the steam injection rate to control the total amount of energy injected into the reservoir. 2. Keeping the total amount of injection constant while varying the injection rate, which involves either injecting a large amount of energy into the reservoir over a short period or injecting a smaller amount of energy continuously over a longer duration.
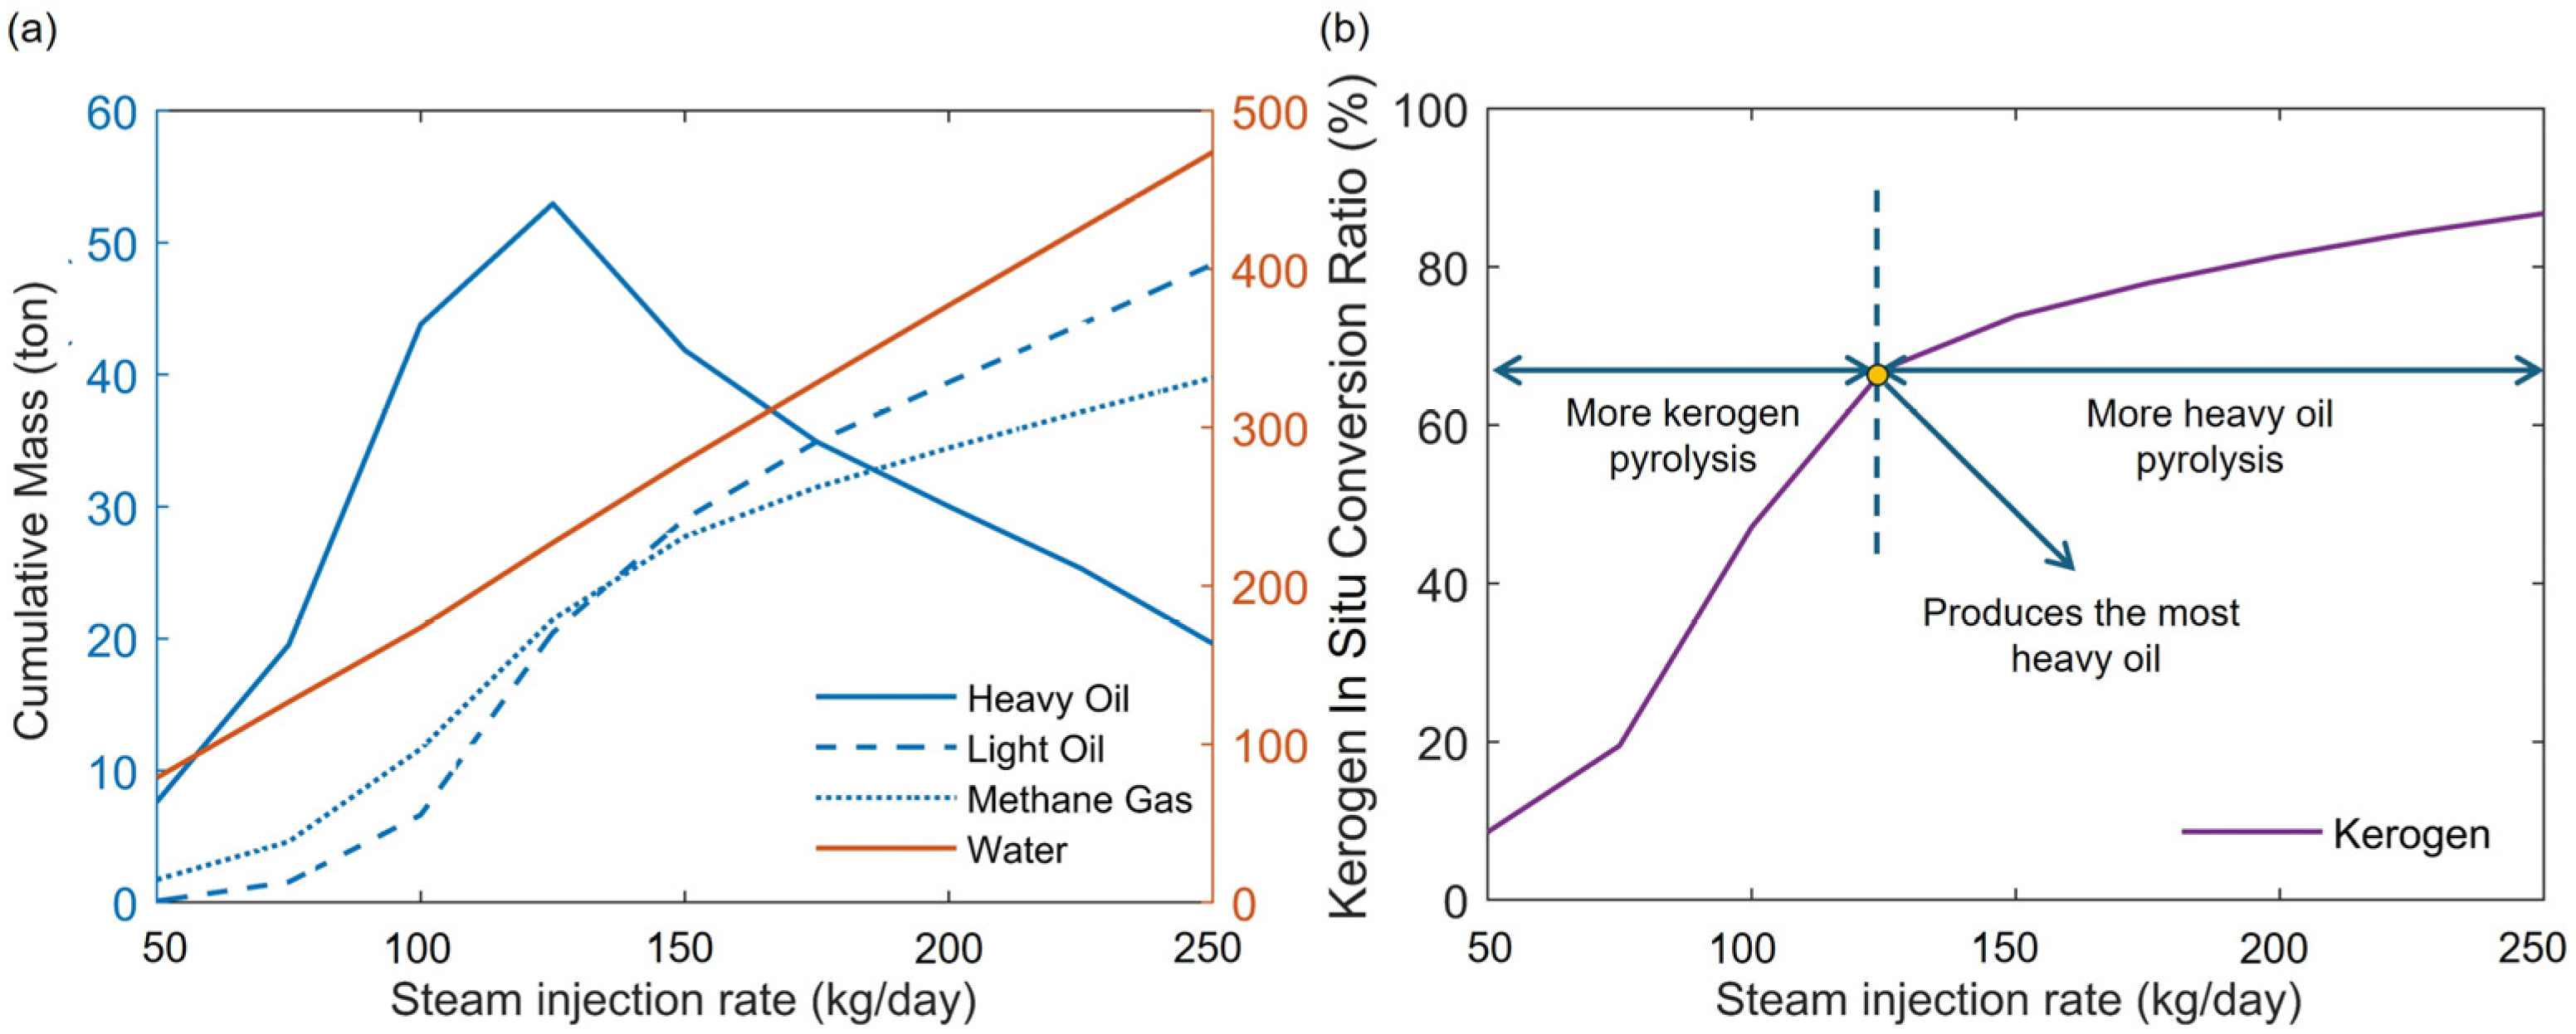
First, the steam injection duration is fixed at 5 years (the same as the base case). The water vapor injection rate varies between 50 and 250 kg/day to change the total energy infused into the shale oil reservoir. Due to more steam injection, the final mass of water produced through the production well increases with the steam injection rate. For heavy oil, the final cumulative production reaches its peak at a steam injection rate of approximately 130 kg/day. Meanwhile, the aggregate production of CH4 and light oil continues to increase with a higher steam injection rate (Figure 8a). The reservoir’s heat will first decompose kerogen because the kerogen’s critical reaction temperature is lower than heavy oil. When the heat injected into the reservoir is initially increased, more kerogen decomposes, producing more heavy oil. However, when the water vapor injection rate approaches 130 kg/day, the reservoir heat is sufficient to decompose the kerogen nearly completely in the high-temperature region, but the remaining heat is insufficient to further pyrolyze the heavy oil. Therefore, under these conditions, the heavy oil content in the products is at its highest. If the steam injection rate is increased and more heat is added to the reservoir, this excess heat will cause the remaining heavy oil to further pyrolyze into light oil and methane, reducing the final output of heavy oil while increasing the content of light oil and methane in the products. The changes in the total amount of kerogen pyrolysis also support this viewpoint. When the injection rate is less than 130 kg/day, the amount of kerogen pyrolysis increases rapidly with the increase in injection rate. However, further increasing the injection rate has a diminished effect on promoting kerogen pyrolysis.
If the total amount of steam injection is kept constant (the same as in the base case), The water vapor injection rate varies between 50 and 250 kg/day. At a lower water vapor injection rate, the time of heating is extended, and at a higher rate, the heating duration is reduced, thereby maintaining a stable total energy injection into the reservoir. Since the total amount of steam injection remains stable, the water content in the final products also remains relatively constant. However, the cumulative production of light oil and methane increases with an increasing steam injection rate. The heavy oil content remains nearly constant at a lower steam injection rate but begins to decrease when the steam injection rate exceeds approximately 80 kg/day (Figure 9a). Based on Figure 9b, varying the steam injection rate does not significantly affect the amount of kerogen undergoing pyrolysis in the reservoir. However, increasing the steam injection rate can result in the production of more light oil and methane and less heavy oil due to the enhanced pyrolysis of heavy oil caused by the higher steam injection rate. This indicates that a higher steam injection rate improves energy utilization. This is likely because concentrating the energy injection achieves the temperatures required for the pyrolysis of heavy oil and kerogen more quickly in the high-temperature regions, thereby reducing heat loss during the transfer process and improving overall energy efficiency.

4.2. Soaking Time

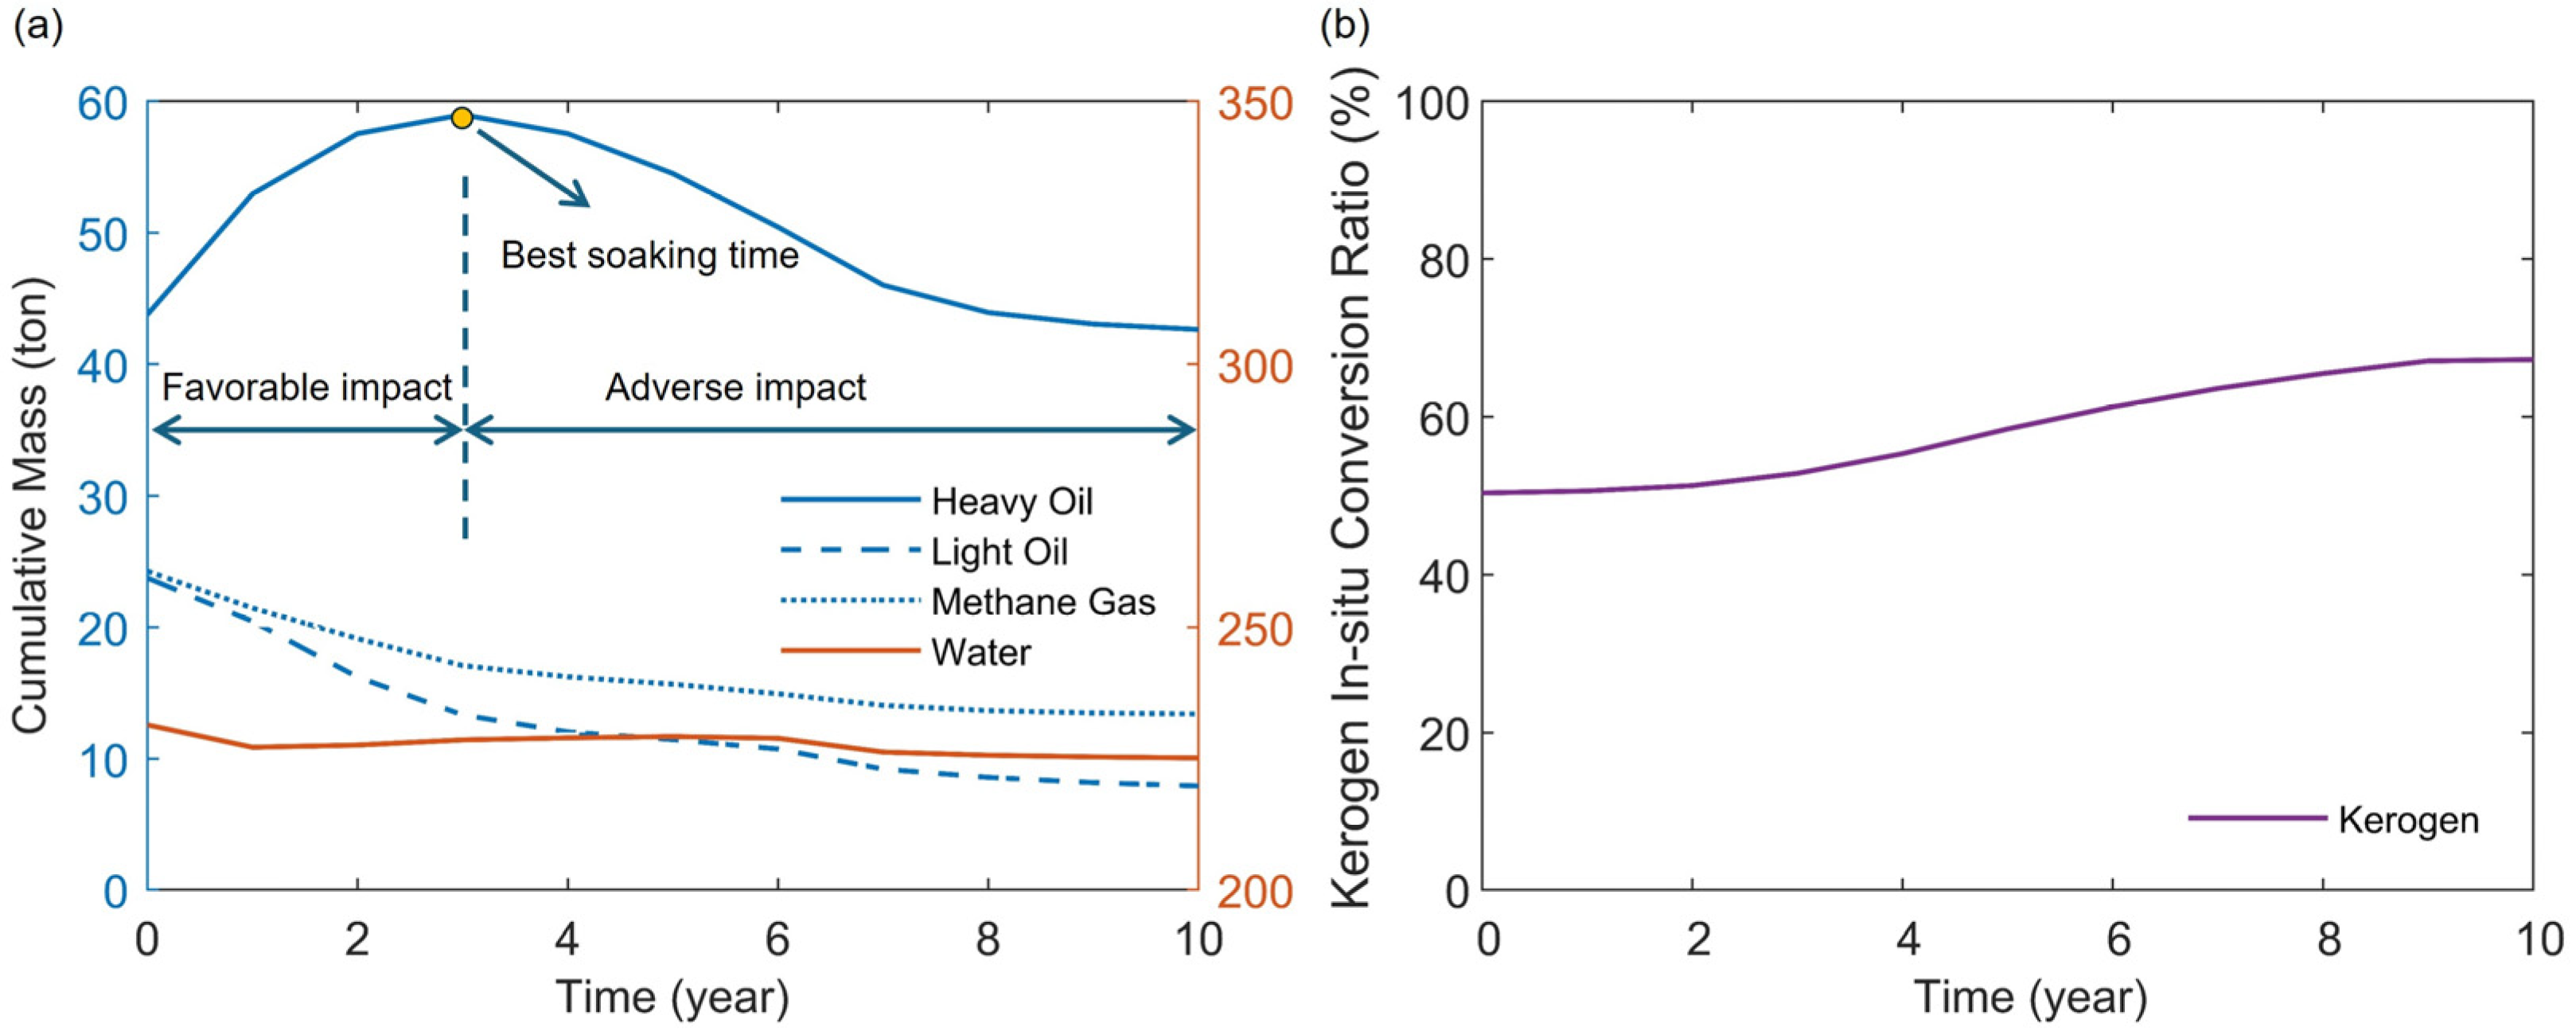
The soaking time refers to the period between the end of the heating stage and the beginning of the production stage, during which both the heating wells and the production wells are closed. During this period, components within the reservoir may continue to react under residual heat and flow due to concentration gradients and pressure differentials. Therefore, theoretically, increasing the soaking time can lead to more thorough pyrolysis reactions in the reservoir and result in a more uniform distribution of fluids within the reservoir. In this section, soaking time is varied within the range of 0–10 years. Since the amount of injected steam remains constant, changing the soaking time has a minimal effect on the water content in the products. Additionally, a slight increase in soaking time (<3 years) at the early stages can lead to an increase in heavy oil production. However, further increasing the soaking time to 10 years results in a decrease in heavy oil production. Additionally, as the soaking time increases, the production of light oil and methane gradually decreases (Figure 10a). Additionally, with the increase in soaking time, the mass of kerogen decomposition experiences a slight rise (Figure 10b). This indicates that extending the soaking stage does indeed allow for more thorough pyrolysis of the organic matter, a promoting effect that is particularly evident when the soaking time is short or even absent. However, as the soaking time continues to increase, the distribution of shale oil in the reservoir becomes more uniform, which reduces the oil and gas content near the production well, making extraction more difficult. A long soaking time facilitates the pyrolysis of organic matter, but its adverse impact on oil and gas production is more pronounced.

5. Discussion

Based on the temperature distribution within the reservoir, the range from the heating well to the production well can be divided into five regions: the displacement zone, multiple-reaction zone, kerogen pyrolysis zone, preheating zone, and primitive rock zone (Figure 11). The displacement zone is closest to the heating well and has the highest temperature. The heavy oil and kerogen there are almost entirely pyrolyzed. The primary phase change occurring there is the condensation of steam. The liquid water layer displaces the oil and gas produced by pyrolysis to the outer side of this zone, which is almost completely occupied by liquid water and steam. The multiple-reaction zone is the primary area where pyrolysis reactions occur. In this zone, the temperature reaches the critical levels for both heavy oil and kerogen pyrolysis, resulting in simultaneous reactions and the production of a substantial amount of oil and gas. In the kerogen pyrolysis zone, the temperature only reaches the critical level required for kerogen pyrolysis. Within this range, only the pyrolysis of kerogen occurs. In the preheating zone, the temperature is elevated compared to the initial conditions but is insufficient to trigger pyrolysis reactions. The primitive rock zone maintains a temperature nearly identical to the initial state, but lower viscosity substances like methane produced from pyrolysis have migrated into the pores of this zone. In addition, we found that the majority of the injected steam condenses into liquid near the heating well due to high pressure and heat exchange. As the liquid water layer thickens, it can displace the oil and gas produced by pyrolysis towards the production well. This is an advantage of using steam heating for in situ conversion. However, due to the limited heat capacity of water, the energy carried by a unit volume of water is relatively low. In order to attain the intended heating outcome, a large volume of steam must be injected into the reservoir. This results in a higher water content in the products, which negatively impacts oil and gas production. Additionally, if the water in the products cannot be separated and reused, it may lead to resource waste. This is an unavoidable disadvantage of using steam heating for in situ conversion.
Additionally, the numerical model used in this study involves some simplifications compared to actual conditions: Firstly, in actual in situ extraction of shale oil, the chemical reactions and substances involved are far greater in number than those taken into account in this simulator, and the heterogeneity of real geological reservoirs can be quite complex, potentially affecting fluid migration, distribution, and the pyrolysis temperature of organic matter. Secondly, in actual shale oil extraction, hydraulic fracturing is typically performed prior to heating the reservoir to increase its permeability, and the injection of steam can raise the reservoir temperature and potentially promote the development of fractures, further enhancing the reservoir’s permeability. These factors can impact fluid migration. Finally, in this study, the steam injection rate was kept constant. However, in actual heating processes, maintaining a constant rate for extended periods can be challenging. Variations in steam injection rate may also have a potential impact on the pyrolysis of substances like kerogen.

6. Conclusions

This study employed a TFC coupling simulator to build a geological model and simulate the multiphase and multicomponent evolution process in the reservoir during the extraction of shale oil via water vapor heating. Subsequently, the feasibility of this in situ conversion method for shale oil extraction was discussed. Based on the simulation results, the following conclusions were drawn:
  • During the heating stage, the range from the heating well to the production well can be divided into five regions: the displacement zone, multiple-reaction zone, kerogen pyrolysis zone, preheating zone, and primitive rock zone. The distribution of different components in the reservoir generally forms approximate elliptical rings centered around the heating well. After the production well is opened, due to differences in the viscosity and distribution of the components, there are differences in the order of production and the production rates of each component.
  • During the heating stage, the injected heat first supplies the pyrolysis of kerogen. Increasing the injected heat can enhance the pyrolysis of more kerogen in the reservoir, thereby increasing the production of heavy oil. However, if the injected heat is sufficient to nearly completely pyrolyze the kerogen in the reservoir, continued injection of heat will primarily affect the pyrolysis of heavy oil. This will reduce the heavy oil content in the products while increasing the light oil and methane content. By maintaining a constant total injected heat while increasing the rate of heat injection, heat loss can be reduced and heat utilization efficiency improved. This results in a more thorough pyrolysis of heavy oil, thereby increasing the content of light oil and methane in the products. Additionally, an excessively long soaking time can negatively impact oil and gas production.
  • Most of the superheated steam, after being injected into the reservoir, condenses into liquid water under high pressure and heat exchange condition, which can help displace oil. However, because the energy density of steam is relatively low, a large amount of steam needs to be injected into the reservoir to achieve the desired heating effect. This results in a high proportion of water in the extracted products, which is detrimental to oil and gas production. Future research needs to focus on improving energy utilization efficiency and developing separation and reuse technologies for the water in the products. These advancements may be crucial for the successful implementation of this in situ conversion technology.

Author Contributions

Conceptualization, Z.Z. and S.L.; methodology, Z.Z. and M.J.B.M.; software, Z.Z.; validation, Z.X., S.L. and X.L.; data curation, Z.X.; writing—original draft preparation, Z.X., Z.Z., Y.L. and T.X.; writing—review and editing, Z.X. and Z.Z.; visualization, Z.X.; supervision, X.L. All authors have read and agreed to the published version of the manuscript.

Funding

This research was funded by the National Natural Science Foundation of China (Grant No. 42090023), the Key Deployment Program of Chinese Academy of Sciences (Grant Nos: YJKYYQ20190043, ZDBS-LY-DQC003, KFZD-SW-422, ZDRW-ZS-2021-3-1), the Scientific Research and Technology Development Project of China National Petroleum Corporation (Grant No. 2022DJ5503) and CAS Key Technology Talent Program.

Institutional Review Board Statement

Not applicable.

Informed Consent Statement

Not applicable.

Data Availability Statement

The data presented in this study are available in the result sections in this article.

Conflicts of Interest

The authors declare no conflicts of interest.

References

  1. Sun, Y.; Bai, F.; Liu, B.; Liu, Y.; Guo, M.; Guo, W.; Wang, Q.; Lu, X.; Yang, F.; Yang, Y. Characterization of the oil shale products derived via topochemical reaction method. Fuel 2014, 115, 338–346. [Google Scholar] [CrossRef]
  2. Yu, H.; Chen, J.; Zhu, Y.; Wang, F.; Wu, H. Multiscale transport mechanism of shale gas in micro/nano-pores. Int. J. Heat Mass Transf. 2017, 111, 1172–1180. [Google Scholar] [CrossRef]
  3. Wang, G.; Liu, S.; Yang, D.; Fu, M. Numerical study on the in-situ pyrolysis process of steeply dipping oil shale deposits by injecting superheated water steam: A case study on Jimsar oil shale in Xinjiang, China. Energy 2022, 239, 122182. [Google Scholar] [CrossRef]
  4. Caineng, Z.; Zhang, G.; Zhi, Y.; Shizhen, T.; Lianhua, H.; Rukai, Z.; Xuanjun, Y.; Qiquan, R.; Denghua, L.; Zhiping, W. Concepts, characteristics, potential and technology of unconventional hydrocarbons: On unconventional petroleum geology. Pet. Explor. Dev. 2013, 40, 413–428. [Google Scholar]
  5. Soone, J.; Doilov, S. Sustainable utilization of oil shale resources and comparison of contemporary technologies used for oil shale processing. Oil Shale 2003, 20, 311–323. [Google Scholar] [CrossRef]
  6. Liu, G.; Sun, P.; Ji, Y.; Wan, Y.; Wang, H.; You, X. Current status and energy analysis of oil shale’s retorting process in the world. Pet. Chem. 2021, 61, 123–138. [Google Scholar] [CrossRef]
  7. Yi, P.; Yang, L.; Min, Y.; Shuangchun, Y.; Jinhui, Z. The environmental impact assessments of oil shale in in-situ mining and surface mining. Int. J. Appl. Environ. Sci. 2012, 7, 403–409. [Google Scholar]
  8. Yu, H.; Xu, H.; Fan, J.; Zhu, Y.-B.; Wang, F.; Wu, H. Transport of shale gas in microporous/nanoporous media: Molecular to pore-scale simulations. Energy Fuels 2020, 35, 911–943. [Google Scholar] [CrossRef]
  9. Liu, Z.; Meng, Q.; Dong, Q.; Zhu, J.; Guo, W.; Ye, S.; Liu, R.; Jia, J. Characteristics and resource potential of oil shale in China. Oil Shale 2017, 34, 15–41. [Google Scholar] [CrossRef]
  10. Yu, H.; Fan, J.; Chen, J.; Zhu, Y.; Wu, H. Pressure-dependent transport characteristic of methane gas in slit nanopores. Int. J. Heat Mass Transf. 2018, 123, 657–667. [Google Scholar] [CrossRef]
  11. Wang, L.; Zhao, Y.; Yang, D.; Kang, Z.; Zhao, J. Effect of pyrolysis on oil shale using superheated steam: A case study on the Fushun oil shale, China. Fuel 2019, 253, 1490–1498. [Google Scholar] [CrossRef]
  12. Han, X.; Jiang, X.; Cui, Z. Studies of the effect of retorting factors on the yield of shale oil for a new comprehensive utilization technology of oil shale. Appl. Energy 2009, 86, 2381–2385. [Google Scholar] [CrossRef]
  13. Gavrilova, O.; Vilu, R.; Vallner, L. A life cycle environmental impact assessment of oil shale produced and consumed in Estonia. Resour. Conserv. Recycl. 2010, 55, 232–245. [Google Scholar] [CrossRef]
  14. Zhao, J.; Yang, D.; Kang, Z.; Feng, Z. A micro-CT study of changes in the internal structure of Daqing and Yan’an oil shales at high temperatures. Oil Shale 2012, 29, 357. [Google Scholar] [CrossRef]
  15. Bientinesi, M.; Petarca, L.; Cerutti, A.; Bandinelli, M.; De Simoni, M.; Manotti, M.; Maddinelli, G. A radiofrequency/microwave heating method for thermal heavy oil recovery based on a novel tight-shell conceptual design. J. Pet. Sci. Eng. 2013, 107, 18–30. [Google Scholar] [CrossRef]
  16. Crawford, P.M.; Killen, J.C. New challenges and directions in oil shale development technologies. In Oil Shale: A Solution to the Liquid Fuel Dilemma; American Chemical Society: Washington, DC, USA, 2010; pp. 21–60. [Google Scholar]
  17. Lu, Z.; Liu, Z.; Zhao, X.; Guo, Y.; Liu, Q. Coupling of methoxy group with organic matter during methanolysis of heavy hydrocarbon using oil shale as an example. J. Anal. Appl. Pyrolysis 2021, 158, 105264. [Google Scholar] [CrossRef]
  18. Crawford, P.M.; Biglarbigi, K.; Dammer, A.R.; Knaus, E. Advances in world oil shale production technologies. In Proceedings of the SPE Annual Technical Conference and Exhibition, Denver, CO, USA, 21–24 September 2008; p. 116570. [Google Scholar]
  19. Hou, H.; Du, Q.; Huang, C.; Zhang, L.; Hu, E. An oil shale recovery system powered by solar thermal energy. Energy 2021, 225, 120096. [Google Scholar] [CrossRef]
  20. Kang, Z.; Zhao, Y.; Yang, D. Review of oil shale in-situ conversion technology. Appl. Energy 2020, 269, 115121. [Google Scholar] [CrossRef]
  21. Razvigorova, M.; Budinova, T.; Petrova, B.; Tsyntsarski, B.; Ekinci, E.; Ferhat, M. Steam pyrolysis of bulgarian oil shale kerogen. Oil Shale 2008, 25, 27. [Google Scholar] [CrossRef]
  22. Bennouna, C.; Mokhlisse, A.; Lemée, L.; Joffre, J.; Amblès, A. Supercritical fluid extraction of Moroccan (Timahdit) oil shale with water. J. Anal. Appl. Pyrolysis 1999, 50, 163–174. [Google Scholar]
  23. Saif, T.; Lin, Q.; Bijeljic, B.; Blunt, M.J. Microstructural imaging and characterization of oil shale before and after pyrolysis. Fuel 2017, 197, 562–574. [Google Scholar] [CrossRef]
  24. Wang, G.; Yang, D.; Zhao, Y.; Kang, Z.; Zhao, J.; Huang, X. Experimental investigation on anisotropic permeability and its relationship with anisotropic thermal cracking of oil shale under high temperature and triaxial stress. Appl. Therm. Eng. 2019, 146, 718–725. [Google Scholar] [CrossRef]
  25. Lee, K.J.; Moridis, G.J.; Ehlig-Economides, C.A.J.E.E. Exploitation, Compositional simulation of hydrocarbon recovery from oil shale reservoirs with diverse initial saturations of fluid phases by various thermal processes. Energy Explor. Exploit. 2017, 35, 172–193. [Google Scholar] [CrossRef]
  26. Huang, H.; Yu, H.; Xu, W.; Lyu, C.; Micheal, M.; Xu, H.; Liu, H.; Wu, H. A coupled thermo-hydro-mechanical-chemical model for production performance of oil shale reservoirs during in-situ conversion process. Energy 2023, 268, 126700. [Google Scholar] [CrossRef]
  27. Wang, G.; Yang, D.; Kang, Z.; Zhao, J.; Lv, Y. Numerical investigation of the in situ oil shale pyrolysis process by superheated steam considering the anisotropy of the thermal, hydraulic, and mechanical characteristics of oil shale. Energy Fuels 2019, 33, 12236–12250. [Google Scholar] [CrossRef]
  28. Pei, S.; Wang, Y.; Zhang, L.; Huang, L.; Cui, G.; Zhang, P.; Ren, S. An innovative nitrogen injection assisted in-situ conversion process for oil shale recovery: Mechanism and reservoir simulation study. J. Pet. Sci. Eng. 2018, 171, 507–515. [Google Scholar] [CrossRef]
  29. Zhang, Z.; Xu, T.; Li, S.; Li, X.; Montilla, M.J.B.; Lu, C. Comprehensive effects of heat and flow on the methane hydrate dissociation in porous media. Energy 2023, 265, 126425. [Google Scholar] [CrossRef]
  30. Zhang, Z.; Briceño Montilla, M.J.; Li, S.; Li, X.; Xing, J.; Hu, Y. Numerical evaluations on the fluid production in the in-situ conversion of continental shale oil reservoirs. Pet. Sci. 2024, 21, 2485–2501. [Google Scholar] [CrossRef]
  31. Zhang, Z.; Li, Y.; Li, S.; He, J.; Li, X.; Xu, T.; Lu, C.; Qin, X. Optimization of the natural gas hydrate hot water injection production method: Insights from numerical and phase equilibrium analysis. Appl. Energy 2024, 361, 122963. [Google Scholar] [CrossRef]
  32. Masuda, Y. Modeling and experimental studies on dissociation of methane gas hydrates in Berea sandstone cores. In Proceedings of the Third International Gas Hydrate Conference, Salt Lake City, UT, USA, 18–22 July 1999. [Google Scholar]
  33. Duan, Z.; Mao, S. A thermodynamic model for calculating methane solubility, density and gas phase composition of methane-bearing aqueous fluids from 273 to 523 K and from 1 to 2000 bar. Geochim. Cosmochim. Acta 2006, 70, 3369–3386. [Google Scholar] [CrossRef]
  34. Younglove, B.; Ely, J.F. Thermophysical properties of fluids. II. Methane, ethane, propane, isobutane, and normal butane. J. Phys. Chem. Ref. Data 1987, 16, 577–798. [Google Scholar] [CrossRef]
  35. Kretzschmar, H.-J.; Wagner, W. International Steam Tables; Springer: Berlin/Heidelberg, Germany, 2019. [Google Scholar]
  36. Yaws Carl, L. Yaws’ Handbook of Thermodynamic and Physical Properties of Chemical Compounds; Knovel: Singapore, 2003. [Google Scholar]
  37. Burnham, A.K.; Braun, R.L. General kinetic model of oil shale pyrolysis. In Lawrence Livermore National Laboratory Report UCRL-89805; Lawrence Livermore National Laboratory: Livermore, CA, USA, 1984. [Google Scholar]
  38. Braun, R.L.; Burnham, A.K. Chemical Reaction Model for Oil and Gas Generation from Type 1 and Type 2 Kerogen; Lawrence Livermore National Lab. (LLNL): Livermore, CA, USA, 1993.
  39. Chen, X.; Rao, X.; Xu, Y.; Liu, Y. An effective numerical simulation method for steam injection assisted in situ recovery of oil shale. Energies 2022, 15, 776. [Google Scholar] [CrossRef]
  40. Pei, S.; Huang, L.; Zhang, L.; Ren, S. Experimental study on thermal cracking reactions of ultra-heavy oils during air injection assisted in-situ upgrading process. J. Pet. Sci. Eng. 2020, 195, 107850. [Google Scholar] [CrossRef]
  41. Briceño Montilla, M.J.; Li, S.; Zhang, Z.; Li, X.; Sun, Y.; Ma, S. Theoretical Analysis of the Effect of Electrical Heat In Situ Injection on the Kerogen Decomposition for the Development of Shale Oil Deposits. Energies 2023, 16, 5007. [Google Scholar] [CrossRef]
  42. Zhao, B.; Li, Y.; Huang, W.; Wang, X.; Chen, C. Experimental study on mechanical properties of shale rock and its strength criterion. Arab. J. Geosci. 2021, 14, 264. [Google Scholar] [CrossRef]
  43. Guanglun, L.; Zi, L.; Chuanjin, Y.; Xin, M.; Dan, W. Numerical simulation on oil shale in-situ upgrading by steam injection. In Proceedings of the 2016 International Field Exploration and Development Conference (IFEDC), Beijing, China, 11–12 August 2016. [Google Scholar]
  44. Wenzhi, Z.; Suyun, H.; Lianhua, H. Connotation and strategic role of in-situ conversion processing of shale oil underground in the onshore China. Pet. Explor. Dev. 2018, 45, 563–572. [Google Scholar]
  45. Jin, J.; Jiang, W.; Liu, J.; Shi, J.; Zhang, X.; Cheng, W.; Yu, Z.; Chen, W.; Ye, T. Numerical analysis of in situ conversion process of oil shale formation based on thermo-hydro-chemical coupled modelling. Energies 2023, 16, 2103. [Google Scholar] [CrossRef]
  46. Lee, K.; Moridis, G.J.; Ehlig-Economides, C.A. A comprehensive simulation model of kerogen pyrolysis for the in-situ upgrading of oil shales. SPE J. 2016, 21, 1612–1630. [Google Scholar] [CrossRef]
Figure 1. (a) The equipment setup used for the pyrolysis experiment. (b) Comparison of simulation results with experimental results. The curves represent the evolution of each component’s content over time in a high-pressure cylinder as simulated by the simulator, while the triangles indicate the corresponding experimental results [40,41].
Sustainability 16 09399 g001
Figure 2. Model Setup. (a) Distribution of oil shale in the 7th member of Yanchang formation, upper Triassic in Ordos basin [42]. (b) Conceptual diagram of in situ conversion [30]. (c) Diagram illustrating the model configuration. The specific well network layout is shown, with the purple dashed lines indicating the simulation domain. (d) Schematic diagram of the in situ conversion process. The entire process is divided into three stages, with each stage’s duration and well setting shown.
Sustainability 16 09399 g002
Figure 3. (a,b) The mass distribution of water vapor (a1a3) and water (b1b3) after 1 year of heating, at the end of heating stage (after 5 years), and at the end of soaking stage (after 6 years). (c) The change of the total mass of liquid water and steam over time.
Sustainability 16 09399 g003
Figure 4. (a1a3) Temperature distribution of the reservoir after 1 year of heating, at the end of heating stage, and at the end of the soaking stage. The blue dotted box is the area of kerogen pyrolysis; the black dotted box is the area of heavy oil pyrolysis. (b) The change of the average pressure, maximum temperature, and average temperature over time.
Sustainability 16 09399 g004
Figure 5. The mass distribution of different components after 1 year of heating, at the end of heating stage, and at the end of soaking stage. The arrows indicate the direction of fluid flow. (a) Shows the distribution of kerogen. (b) Shows the distribution of heavy oil. (c) Shows the distribution of light oil. (d) Shows the distribution of CH4. (e) Is the distribution diagram of each component.
Sustainability 16 09399 g005
Figure 6. The change of the in situ mass of (a) heavy oil, CH4, light oil, and (b) kerogen over time.
Sustainability 16 09399 g006
Figure 7. Change of the aggregate production of (a) light oil, heavy oil, CH4, and (b) liquid water over time during the production stage.
Sustainability 16 09399 g007
Figure 8. (a) The evolution of the final aggregate production of different products obtained through the production well with varying steam injection rates and (b) the evolution of the proportion of kerogen that has undergone pyrolysis with varying steam injection rates with a constant steam injection duration.
Sustainability 16 09399 g008
Figure 9. (a) The evolution of the final aggregate production of different products obtained through the production well with varying steam injection rates and (b) the evolution of the proportion of kerogen that has undergone pyrolysis with varying steam injection rates with a constant toal steam injection mass.
Sustainability 16 09399 g009
Figure 10. (a) The change of the aggregate production of different products obtained through the production well with varying soaking times. (b) The change of the proportion of kerogen that has undergone pyrolysis with varying soaking times.
Sustainability 16 09399 g010
Figure 11. Temperature distribution in the reservoir from the production well to the heating well during the heating stage and the main phenomena occurring in different regions.
Sustainability 16 09399 g011
Disclaimer/Publisher’s Note: The statements, opinions and data contained in all publications are solely those of the individual author(s) and contributor(s) and not of MDPI and/or the editor(s). MDPI and/or the editor(s) disclaim responsibility for any injury to people or property resulting from any ideas, methods, instructions or products referred to in the content.