Article

City Boundaries—Utilizing Fuzzy Set Theory for the Identification and Localization of the Urban–Rural Transition Zone

1
Department of Socio-Economic Geography, Institute of Spatial Management and Geography, Faculty of Geoengineering, University of Warmia Mazury in Olsztyn, 10-720 Olsztyn, Poland
2
Department of Geoinformation and Cartography, Institute of Geodesy and Civil Engineering, Faculty of Geoengineering, University of Warmia Mazury in Olsztyn, 10-720 Olsztyn, Poland
*
Author to whom correspondence should be addressed.
Sustainability 2024, 16(21), 9490; https://doi.org/10.3390/su16219490
Submission received: 30 August 2024 / Revised: 26 October 2024 / Accepted: 28 October 2024 / Published: 31 October 2024
(This article belongs to the Special Issue Urban Planning and Sustainable Land Use—2nd Edition)

Abstract

:
This article examines the potential of fuzzy set theory for analysing gradual changes in land use patterns within peri-urban areas. The primary objective of the study was to propose a methodology based on fuzzy set theory for the precise delineation of city boundaries and the identification and spatial localisation of the urban–rural transition zone. The analysis focused on elucidating the defining parameters of this area and the scope of land use changes within the urban–rural transition zone. The analysis employed data from four discrete time points. The data were collected in 2005, 2010, 2017, and 2022. The characteristics of the urban–rural transition zone were evaluated through an examination of historical data and the current land use patterns in regions experiencing direct urbanization pressure. The study demonstrated that, although spatial barriers remain, the city’s development has continued at a consistent pace. Between 2005 and 2010, the area of land classified as urban exhibited a 10% increase, with a further 7% increase observed in the subsequent period, spanning 2010 to 2017. In the most recent period under examination, the urban land area increased by 9%, a figure that is consistent with the rates observed in previous years. These results indicate the stability of urbanization processes in the analysed city, while also revealing significant changes in the limits of urban development and in the intensity of land use. The research project concentrated on the city of Olsztyn and the neighbouring suburban areas, which are subject to direct influence from the city’s expansion. The area under study encompasses 202.4 km2 within an eight-km radius of the city centre. The authors of the study emphasized the necessity for systematic monitoring of changes in the transition zone between urban and rural areas. This is to ensure effective control of spatial development and ongoing adjustment of planning tools to effectively prevent uncontrolled expansion. The methodology used enabled the precise delimitation of urban development and the transition zone. This allowed for an in-depth analysis of changes in land use intensity.

1. Introduction

Urbanization is a complex process that drives urban growth, population density and expansion. This, in turn, serves to enhance the role of cities as key centres for commerce and governance [1]. The process of urbanization, which is a significant global change driven by human activities, has an impact on the formation of cultural identity and the organization of space [2,3]. Consequently, urbanization significantly alters the landscape by progressively changing land use patterns. This spatial spread is influenced by various interacting factors, leading to the creation of new landscape configurations [4]. Urbanization is, therefore, a spatial process occurring across both metropolitan and peripheral areas. Over the last century, accelerated urban growth has created significant strain on land and local resources, particularly in rural zones near cities. It is often conceptualized as a natural growth phenomenon originating in city centres and leading to the unplanned development of smaller urban areas, especially along transportation corridors [5]. As noted earlier, many of these processes occur rapidly and cause swift changes in land use structure and organization, especially in areas immediately surrounding cities [6].
It is important to recognize that urbanization is an ongoing process. Most cities keep growing continuously, with each level of development being a temporary phase and a foundation for the next stage of expansion [7]. Urbanization advances in stages, with suburbanization being one of its most dynamic phases [8,9]. Suburbanization, which involves the development of housing on the outskirts of cities, plays a crucial role across timespans of rapid urban growth [10]. The urban population has grown considerably in the 21st century, resulting in urban sprawl and an increased demand for land in suburban areas. This frequently necessitates the implementation of compulsory land purchase programmes [11]. Areas that are subject to pressure from suburbanisation are evaluated to ascertain their potential for investment and the viability of the real estate market [12,13,14,15,16,17,18]. Suburban regions may expand in conjunction with existing urban frameworks or emerge as small, dispersed residential developments along the peripheries of cities [19]. In the literature, areas directly subjected to urbanization pressure are described as the urban–rural transition zone [20], the rural-urban continuum [21,22,23,24,25], or the suburban zone [26,27,28,29]. Research on suburbs examines not only newly incorporated areas within the urban influence but also shifts in land use, infrastructure development, and the environmental consequences of urbanization [30,31,32]. Researchers also examine transformations in land use in the rural-urban zone [21,33,34,35,36] which forms a green buffer zone surrounding the city [37,38,39], as well as local centres that serve as focal locations for the development of housing, services, and employment opportunities [40]. In the process of urban development, economic factors cannot be overlooked as they have a significant impact on the process. The decline in land values in suburban areas, coupled with public investment in transport and other infrastructure, serves to stimulate development, attracting both residents and investors. These factors encourage residential, industrial and logistics growth while reducing spatial and social conflicts due to lower development density. In response to the growing interest in peri-urban areas, local administrations are also introducing legal and fiscal policies, such as local plans, to support future development.
Traditionally, suburban zones are considered to be neither fully urban nor completely rural, facing a mix of challenges that reflect the complexities of both city and countryside issues [41]. Urban expansion significantly impacts the rural-urban continuum, causing spatial overlaps between various land use categories [42]. The land use changes that accompany urbanization lead to the creation of peri-urban areas which are characterized by complex (fuzzy) land-use patterns and cannot be classified as purely urban or purely rural. Due to their specificity, these areas known as the peri-urban interface, and they are marked by considerable functional changes over time, as well as variations in types and patterns of land use [43]. Transition zones are created due to the high demand for land for new housing and industrial development projects. These areas are also referred to as the rural-urban fringe or conflict zones along the urban–rural interface [44]. A transition zone can be described as a structurally diverse peri-urban area where the city meets the countryside, with the distance between this area and the city’s administrative boundaries varying over time [45]. In these zones, the forms and functions typical of both urban and rural areas overlap, leading to continuous transformation of the peri-urban regions [46]. Because of its mixed land use, it defies clear classification as either strictly urban or strictly rural. As a result, there is a transitional zone along the rural-urban fringe, characterized by a variety of land uses.
Contemporary research on peri-urban areas focuses mainly on defining and analysing suburban areas which are much larger than transition zones [47,48,49]. An urban–rural transition zone can be a suburban area or only a part of a suburban area, depending on the definition and the applied delimitation methods. Most research relies on demographic and statistical data relating to land use. The utilization of a Spatial Information System incorporating spatial databases pertaining to land cover, in conjunction with data analysis and modelling techniques, is also a highly beneficial approach in such analyses. GIS tools, enhanced by remote sensing techniques, offer a means to detect changes in land use within suburban areas [50] and provide precise information on land use and land cover changes [51,52]. Remote sensing technologies are employed to track urbanization trends [53,54], produce high-resolution land cover data [55,56], detect land use changes in both urban and suburban regions [57], and observe alterations caused by human activities [58,59]. The extent of urbanization can be assessed using images from synthetic-aperture radars (SAR), very high resolution (VHR) satellite imagery [60,61,62], and nighttime light (NTL) data [63,64,65,66].
Areas characterized by a complex land use structure and an interplay between radically different land use types and functions, such as transition zones, can be effectively analysed through the application of fuzzy logic. Fuzzy logic is employed to elucidate complex and indistinct concepts that conventional models fail to define adequately. Classical set theory asserts that each element distinctly belongs (true—1) or does not belong (false—0) to a set, with each set possessing sharply delineated boundaries [67]. In the context of fuzzy set theory, propositions may be assigned intermediate values beyond the binary true (1) and false (0) values. These intermediate values represent degrees of truthfulness that range between 0 and 1 [68]. The above implies that every element can be a member, a non-member, or a partial member of a given set, and the membership function of each element is described by a real number in the range from 0 to 1 [69]. Fuzzy logic represents the fundamental tenet of fuzzy set theory and is employed to assess control systems and models that are defined by incomplete or uncertain data [70,71].
Fuzzy or unclear land use patterns are typically observed in the urban–rural transition zone [20]. The types and functions of land use in transition zones can be described as collections of attributes that contribute to the multifaceted nature of these areas. Due to the often imprecise nature of spatial data, fuzzy membership functions can be employed to classify various land cover categories [72]. Fuzzy set theory provides a framework for examining the correspondence between different types of land use and the categories they represent on a spectrum from 0 to 1 [71]. In transition zones, where land use and land cover types are diverse, a fuzzy metric can be used to evaluate each spatial occurrence and land cover condition, thereby determining its classification as urban or rural.
The urban–rural transition zone represents the boundary of urban expansion and is characterized by the most rapid spatial transformations [73]. The rural-urban boundary should be accurately defined to determine the degree of urbanization and its environmental impact in the context of the urban–rural divide [74]. The primary challenge in identifying and locating the transition zone stems from the fact that rapid urbanization frequently alters its position and shape. This variability can be attributed to urban characteristics, topography, development thresholds, infrastructure availability, investment spending, and land ownership. These changes often lead to shifts in land ownership and, subsequently, spatial conflicts [75]. The delineation of physical boundaries and the categorization of urban, rural, and suburban areas are fundamental to the effective planning of urban and rural contexts. In transition areas, it is essential to establish land use and management principles to preserve and enhance public and ecosystem services [76]. The changing nature of the urban–rural boundary is a crucial factor in the study of urbanization. A dynamic approach to these evolving transition zones facilitates the identification of pivotal areas of transformation. The accurate definition of urban boundaries is conducive to the efficient management of resources and the planning of infrastructure, the control of urban sprawl, and the protection of green belts and natural buffers, which are vital for sustainable development. However, the mixed nature of transition areas makes precise boundary delineation challenging, which can in turn give rise to socio-spatial conflicts. This study introduces a replicable method for the detection and mapping of urban expansion and the urban–rural transition zone, which is based on fuzzy set theory.
The study was conducted in a peri-urban zone and involved the analysis of historical data and land use patterns to capture the key characteristics of areas under urban pressure. The research was carried out in the city of Olsztyn and its surrounding suburban area, which is directly influenced by urban expansion, covering an area of 202.4 km2 within an 8-km radius from the city centre. The analyses relied on photogrammetric data for 2005, 2010, 2017, and 2022. The study examined the contribution of various land use types to the formation of urban and rural areas. A fuzzy model was created for the assessment of urban and rural functions, with the objective of establishing urban boundaries and mapping the urban–rural transition zone. This model builds on previous research and is enhanced with both current and historical photogrammetric data, offering new methods for the visualization of city boundaries and the tracking of changes in the transition zone over time [20,71,77].

2. Materials and Methods

2.1. Research Area

Olsztyn, the capital of the region, is located in the Warmia-Mazury voivodeship and is one of the largest urban centres in northeastern Poland (Figure 1).
The Olsztyn area is characterized by a distinctive natural, meteorological, and hydrological environment, which has a significant impact on the city’s development. Olsztyn is endowed with an abundance of water resources, which exert a profound influence on the city’s topography and functionality. Within the administrative boundaries of the city, there are fifteen lakes, thirteen of which have a surface area exceeding one hectare. The collective surface area of these lakes is 725 hectares, which constitutes over 8% of the city’s total area. Moreover, the Łyna River traverses Olsztyn, functioning as one of the region’s primary rivers and exerting a significant influence on the city’s hydrological system. The Łyna River provides water for both industrial and agricultural purposes and serves as an important recreational area for residents and tourists alike. Moreover, groundwater serves as a source of potable water for the city and plays a pivotal role in maintaining the local water supply system. The city of Olsztyn is distinguished by its abundance of water resources and extensive green areas, which contribute to its status as one of the greenest cities in Poland. Forests occupy over 21% of the city’s total area, with the Municipal Forest representing the most extensive green space. The natural barriers of lakes, forests, and rivers, which previously served a defensive function, now constrain the spatial expansion of the city, with the exception of the southeastern region. In terms of climate, Olsztyn is situated within a transitional temperate zone. In recent years, the mean annual temperature was approximately 8.3 °C, while the mean annual precipitation ranged between 600 and 700 mm. The predominant winds in the area are from the west and southwest, with speeds ranging from 3 to 5 m/s.
In conclusion, the city’s sustainable development is supported by the abundance of natural and water resources, combined with a temperate climate. However, challenges related to water resource management and the protection of green and recreational areas are crucial for ensuring the city’s continued harmonious growth, in line with its unique natural assets. To facilitate the study, the area of Olsztyn was subdivided into regular spatial units in the form of hexagons, which were designated as basic fields. The area of each unit is 200,000 square metres (20 hectares), which permits a precise spatial analysis that takes into account local variations. A total of 1012 hexagonal fields have been delineated within the study area, thereby facilitating a comprehensive evaluation and comparison of diverse urban and rural spatial elements (Figure 2).
The division of the study area into hexagonal units offers a number of methodological advantages. The regular hexagonal layout ensures that the survey units are evenly distributed, thereby eliminating the potential for overlaps between neighbouring areas and preventing gaps that could occur if a rectangular subdivision were used. This allows for the generation of consistent and comparable results, thereby enhancing the reliability of the analysis.
The selection of a hexagonal subdivision of the study space facilitates a precise representation of the spatial configuration of the area, which is essential for identifying and understanding spatial patterns and the dynamics of phenomena in the study area. In the context of the analyzed area, such a method allows for comprehensive monitoring of environmental, urban and natural processes, while enabling more informed planning and management of urban space.

2.2. Methodology

The methodology for identifying and delineating the urban–rural transition zone was previously detailed in the authors’ earlier research [20], and it was used to analyse an area that is directly subjected to urbanization pressure. The proposal put forward was that the different land use types within any given urban area should correspond to the varying levels of function that they perform in the city. To quantify this idea, fuzzy set theory was employed to attribute specific values to the different land use types and to evaluate how far they extend into the range of functions that are typical of any urban area in the interval [0, 1]. The degree of membership indicates how closely a given object is associated with a set of attributes defining urban or rural land use types. Assigning degrees of membership to set elements is a complex, subjective process that depends on context. This degree reflects a meaningful order within a set of attributes [78]. Statistical methods, questionnaire surveys, or expert interviews can determine degrees of membership [79,80]. A questionnaire designed to assess and evaluate urban space was used to develop a fuzzy model of the city. The questionnaire aimed to determine the fuzzy measures associated with the adopted forms of space use, which in turn defined the degree to which the surveyed areas could be classified as having an urban nature. Respondents were asked to indicate, through a direct comparison method using three diagrams (developed in the form of a matrix), which areas they perceived as having a “more urban” character, characterized by a higher concentration of urban–related features. The data collected, expressed as numerical values, were then assigned to 24 forms of space use. For each form, a fuzzy measure, defined as the degree of association with urban characteristics, was calculated based on the questionnaire responses, as shown in Table 1.
The survey was conducted among employees of the Geoengineering Department, the Olsztyn Municipal Office, and offices involved in planning and real estate transactions. To accurately represent the diversity of urban space, some forms of use were described using data from all three diagrams, while others, such as inland surface water areas, were described using optical and topographic data. After processing the survey results, a fuzzy measure of use for each of the 24 forms of space use was determined and normalized within the range [0, 1], as shown in Table 1.
The chosen procedure should ensure that each variable completely belongs to fuzzy sets to avoid the need for data normalization in later steps. In this study, expert interviews were used to determine degrees of membership due to the complexity of land use and the subjective nature of classifying functions as urban or rural, which can change over time [81]. Many land use types previously considered urban are now seen as both urban and rural, and vice versa [82].
In spatial analyses, the existing land use functions have to be defined and localized, particularly in transition zones combining both urban and rural (U and R) functions. In practical terms, the spatial extent of urban functions can be more readily defined. In accordance with the tenets of fuzzy set theory, the diminution of urban space is complemented by an expansion of rural space. The fundamental operations of fuzzy sets indicate that the degree of membership for urban functions will inherently account for rural functions within the same fuzzy set. To illustrate, if a given area is assigned a fuzzy value of 0.85 for urban functions, the corresponding fuzzy value for rural functions would be 0.15. This indicates that the area is more urban than rural and can therefore be classified as urban space. In this study, a transition zone is defined as an area with an equal mix of urban and rural functions, making it neither purely urban nor purely rural. A transition zone is defined at the point where the fuzzy values for urban and rural land use types converge, with the membership level for both sets, U and R, equaling 0.5.
To ascertain the boundaries of urban development, assess the extent and pace of urbanization, and identify and map the transition zone, twenty-four land use types were selected (Table 1). In a previous study, the authors identified the membership level for each land-use type within a set of urban functions based on the findings from a questionnaire survey [20]. The present study defined urban functions through an analysis of current structures, land use functions as specified in local zoning plans, and different landscape types. A fuzzy value for land use was calculated and normalized for each of the twenty-four land use types, indicating their degree of membership in a set of urban functions in the interval [0, 1] (Table 1).
The study used orthophotos from the years 2005, 2010, 2017 and 2022, which were obtained from official datasets (source: https://www.geoportal.gov.pl/, 29 August 2024). In the initial phase of the study, photointerpretation was undertaken in conjunction with expert interviews to enable the visual analysis of orthophotomaps [4,83,84] and the identification of existing land use types across all 1012 hexagonal fields. The method of photointerpretation, which involves the visual examination of images, is particularly effective and straightforward for the classification of complex and heterogeneous landscapes and spatial objects (Figure 3). This technique relies on key image attributes, including shape, colour, hue, and texture, to recognize and classify objects, measure their physical dimensions, such as length and height, and compare them with real-world counterparts [85].
The percentage of each of the twenty-four land use types within each hexagonal field was calculated for the years 2005, 2010, 2017, and 2022 by employing cartographic resources from national databases, including aerial photographs and data from the land and building register. In instances where certain land use types were challenging to discern, field surveys were also conducted. Furthermore, datasets in GeoTIFF format and information from online platforms, including the web map services (WMS, WMTS), were incorporated into the analysis using ArcGIS Pro 3.1. The findings of this inventory were subsequently employed in the construction of a comprehensive geospatial database, comprising vector data for each year under study.

3. Results

The calculated degrees of belonging to a set of urban functions (Table 1) and the results of the land use inventory for 2005, 2010, 2017 and 2022 were employed in the construction of a fuzzy city model. The model was employed to delineate the urban development boundaries and to identify and locate the transition zone. The degree of belonging to a set of urban functions within each hexagonal box was determined by summing the products of all land use types and their corresponding degrees of belonging, as defined in Table 1.
Subsequently, these calculations were employed to develop a fuzzy model that encompassed both urban and rural areas, with each function assigned a degree of membership of 0.5. The resulting models representing urban and rural functions for each year under consideration are presented in Figure 4. To enhance the spatial precision of these models, the calculated values were interpolated using kriging, a well-established geostatistical estimation method that enables a more accurate representation of spatial changes and patterns [86,87]. This approach afforded a comprehensive and continuous spatial distribution of urban and rural functions within the study area for each year under consideration.
The boundaries between urban and rural areas were represented by isolines with a degree of membership of 0.5. The boundaries delineated on the basis of data from 2005, 2010, 2017 and 2022 are presented in relation to the administrative boundary of the Olsztyn city on the topographic map in Figure 5.
The urban–rural transition zone was identified and localized based on the boundary between urban and rural land use (complementing µ = 1 of urban use) in areas where each function has a degree of membership of 0.5. The degree of membership and the spatial reach of the transition zone around Olsztyn were determined based on the boundary between urban and rural land use. The areas where land use functions are neither entirely urban nor entirely rural were identified in regions where both urban and rural influences significantly affect land use. The interval within which the study area cannot be classified as purely urban or purely rural was determined based on the shape of the membership functions. The resulting transition zone was determined for four intervals of the membership function: [0.30–0.50] (Figure 6), [0.35–0.50] (Figure 7), [0.40–0.50] (Figure 8), and [0.45–0.50] (Figure 9), in 2005, 2010, 2017, and 2022.
The proposed method was used to identify significant spatial changes and changes in the size of the transition zone in 2005–2007, 2007–2010, 2010–2017, and 2017–2022. It can be observed that at no point during the analysed periods did the outer boundary of the transition zone coincide with Olsztyn’s administrative boundary. This suggests that the transitional areas extend beyond the officially defined city limits, indicating a dynamic interaction between urban and rural land uses in the surrounding regions. The transition zone also covered parts of the surrounding municipalities. The most extensive area encompassed by the transition zone within the specified range of memberships [0.3–0.5] was estimated at 3.0 km, and the minimum width of the transition zone approximated 0.5 km. In 2005, the area of the transition zone, measured based on the size of hexagonal fields in the membership interval [0.3–0.5], was determined at 234 fields. The above implies that an area of 4680 ha cannot be classified as purely urban or purely rural. In 2010, the area of the transition zone in the membership interval [0.3–0.5] also reached 234 fields (4680 ha). Differences were observed in the shape, size, and spatial reach of the transition zone. The area of the transition zone in the membership interval [0.3–0.5] was determined at 253 fields (5060 ha) in 2017 and 271 fields (5420 ha) in 2022. The rapid increase in the area of the transition zone resulted mainly from urban development in the southern part of the study area (Figure 10).
Changes in the area of the transition zone in each year of the analysis and in the adopted membership intervals are presented in Table 2.
From 2005 to 2010, the most significant growth was observed in the areas occupied by single-family homes (9.23%), multi-family housing (3.01%), and industrial plants and warehouses (2.15%). The period between 2010 and 2017 saw the greatest expansion in construction sites (15.65%), single-family homes (7.21%), and public roads (3.40%). In the period between 2017 and 2022, the most notable increases were observed in the areas allocated for public roads, single-family homes, and multi-family housing, with respective increases of 14.01%, 8.77%, and 3.62%. Over the entire study period (2005–2022), the most substantial increases were observed in single-family homes (+25.30%), public roads (+18.44%), and multi-family housing (+9.42%). Conversely, the most significant declines were found in the areas designated for arable land, forests, and natural green spaces.

4. Discussion

The dynamics of urban expansion are primarily influenced by urban morphology (types of development), alongside economic, social, technical, and environmental factors that drive urban growth [88]. This study employed fuzzy set theory and land use data from 2005, 2010, 2017, and 2022 to develop a method for identifying and locating the rural-urban transition zone. The aim of this method is to quantify the degree of urbanization on a scale of 0 to 1, to delineate urban growth boundaries, and to assess the rate of land use change in the transition zone. The use of fuzzy set theory allows us to understand the different intensities of urban and rural features in different geographical areas.
The proposed method was used to determine changes in urban development based on photogrammetric data for 2005, 2010, 2017, and 2022, and the results are presented in Figure 11. The inclusion of a significance level of 0.05 enabled an accurate determination of the degree of urbanization in the different years under analysis. Furthermore, the authors suggest that to capture smaller changes in the forms of development in the transition zone, the value adopted may be lowered. This approach supported the identification of the main directions and the rate of changes in land use.
The most noticeable and most profound changes were observed in the southern part of the study area, where the boundary of urban development had shifted by more than 2 km between 2005 and 2022 (Figure 12a). The above can be attributed mainly to the swift development of single-family homes and multi-family housing. Rapid development was also observed in the northwestern part of the study area, directly adjacent to the city of Olsztyn area (Figure 12b). In recent years, these areas have undergone a significant transformation from a rural village to a residential estate. In the northeastern part of the study area, the most notable changes in the boundary of urban development occurred between 2017 and 2022 (Figure 12c), mainly due to the construction of a transport hub connecting industrial areas with the Olsztyn ring road. The city of Olsztyn has been struggling for years with a lack of investment land, mainly due to the nature and number of spatial barriers. The numerous forests, lakes and wetlands mean that more and more residents are forced to look for land for their own investments outside the city limits. This is also reflected in the statistics on population change in the city and its migration to the suburbs. Over the past 20 years, the population of Olsztyn has decreased by more than 5000 people, while the community of Stawiguda alone has added more than 6000 people. According to the latest models, urban development should be comprehensive and take into account all important aspects of the functioning of the urban organism. It is therefore defined, among other things, by the improvement of investment attractiveness, the implementation of new technologies, and the improvement of the quality of life in connection with the quality of the natural environment. Once again, this development dynamic is driven by the availability and value of land outside the centre. And land, especially investment land in the transition zone, is firstly available and secondly its price is definitely more attractive than land in the city.
The boundary between rural and urban areas, where the degree of membership is 0.5, signifies the “centre–core” of the transition zone. In this region, both urban and rural land-use types are present, making it impossible to classify the area as exclusively urban or rural. The degree of membership for identifying and localizing the transition zone is influenced by the level of detail. The width of the transition zone is determined by the manner in which urban functions are replaced by rural functions. The transition zone occupies a small area when urban functions are suddenly replaced by rural functions, or when natural barriers prevent further urban development. The transition zone is much larger when the transition from urban to rural land use proceeds more smoothly and when diverse land-use types are present in a large area.
To ascertain the efficacy of the devised methodology, we conducted a comparison between the delineated border of the transition zone between urban and rural areas and optical data, specifically orthophotos, developed for select years (Figure 13). The findings of this analysis demonstrate that the adopted method is an efficacious instrument for discerning spatial alterations that facilitate urban development.
However, due to the absence of a quantitative assessment of the validity of the results obtained, the authors conducted a validation using Anselin Local Moran’s method I.
I i = x i X ¯ S i 2         j = 1 , j i n w i , j x j X ¯
where x i is an attribute for feature i, X ¯ represents the average value of the associated attribute, w i , j represents the spatial weight between features i, j, and:
S i 2 = j = 1 , j i n x j X ¯ 2 n 1
with n denoting the total number of features present in the dataset.
This method enables the identification of local spatial clusters, thereby facilitating the precise verification of the delimitation’s accuracy.
The application of Anselin Local Moran’s I permitted the analysis of spatial dependencies in the transition zone, confirming that the delimited boundaries correspond to statistically significant clusters exhibiting urban and rural characteristics (Figure 14). This validation demonstrated that the boundaries are not only visually consistent with the optical data but also statistically validated. The analysis showed that both the fuzzy set method and Anselin Local Moran’s I indicate a continuous process of urbanisation, involving the incorporation of new areas into the urban structure.
Furthermore, to substantiate the veracity of the identified results pertaining to the degree of urban affiliation and the proposed models, the authors conducted a validation survey over the specified time frame. For this purpose, photographic documentation was collected for 50 primary fields, the degree of urban affiliation of which was assessed for the 2022 year. This was performed to confirm the absence of significant changes in land use in relation to the orthophotos used in the study. Subsequently, 43 residents of Olsztyn were requested to assign the most appropriate form of land use to each photograph, selecting from the options of urban, rural, or unknown. In only five cases did the respondents’ assessments diverge from the specified degree of field affiliation, indicating that the analysis is accurate.
The results of the analyses demonstrate that the developed method allows for the precise delineation of regions designated as “urban islands”, which emerge in rural landscapes and, as the areas between them and the main urban area evolve, are gradually integrated into the urban structure. It should be highlighted that the precision of the method employed in the identification and delineation of the transition zone is contingent upon the degree of detail in the underlying data and the frequency of data collection. In the context of dynamic peri-urban development, the effective application of the method would necessitate a higher frequency of data collection. This would enable not only the precise monitoring of changes in urban areas but also a detailed analysis of the transformation of peripheral areas. Consequently, this would contribute to a more comprehensive understanding of the spatial dynamics at the urban–rural interface. In the process of localizing the transition zone, fuzzy membership intervals should be properly selected to identify significant changes and directions of urban growth. Significant urbanization processes were identified in the northern part of the study area, where extensive forests with high environmental value are the main barrier to urban expansion. This area was subjected to anthropogenic pressure in the membership intervals [0.35, 0.50] and [0.40, 0.50] (Figure 7 and Figure 8). In these intervals, urbanization can also be observed in areas that appear to be physically separated from the urban fabric. In the northwestern part of the study area, there was notable spatial diffusion, with urban development occurring at a greater distance from the city center.
The results of the conducted research suggest that the “urban islands” forming around urban areas represent an early stage of the urbanization process, which, as development progresses, are gradually absorbed into larger urban structures. Our analysis indicates that these isolated areas of urban-type development, located within the transition zone, are a significant element of urban growth. In the context of urbanization, these areas can be regarded as regions that will eventually become an integral part of the urban fabric. Based on the research, it was also possible to identify the main directions of urban sprawl. Identifying areas vulnerable to this phenomenon is particularly important, as they are characterized by low-density housing, a predominance of residential areas, and the generation of substantial future costs associated with the construction of necessary technical infrastructure, which is predominantly financed by public funds. Moreover, urban sprawl contributes to significant costs related to the construction, maintenance, and modernization of suburban transport networks due to the increased burden imposed by residents of suburban areas.
The justification for seeking new identification methods lies in the fact that urbanization processes, particularly those related to urban sprawl, pose challenges for the optimal management of space. Consequently, the application of methods and tools, such as those presented in this article, can support the implementation of preventive measures, especially in the effective use of spatial planning instruments. The conducted research on the analysed case allowed for the identification of the directions and scale of urban area development. As a result, the proposed method also enables the identification of areas with high environmental value, which may be threatened by urbanization processes. Referring the research results to the theory of sustainable development, it can be concluded that indicating the directions of urban expansion through the identification of changes in the transition zone allows for the implementation of appropriate spatial management strategies. In the long term, this enables administrative authorities to monitor and plan changes in such a way that the urbanization process proceeds in a sustainable manner, with respect for natural resources and in accordance with environmental protection principles.
In conclusion, it is important to emphasize the potential of the proposed method in identifying areas that may be exposed to uncontrolled urbanization processes in the future. This would enable optimal decision-making regarding the spatial development of these areas and guide the development of technical infrastructure, particularly in the transition zone.
The proposed method is highly versatile and can be employed to identify urban–rural transition zones and delineate urban development boundaries. It offers a flexible approach to capturing the gradual and often ambiguous transitions between urban and rural land uses. The capacity to assign degrees of membership enables a nuanced comprehension of spatial dynamics, particularly in contexts where conventional binary classification techniques may be inadequate in reflecting the intricacies of mixed land-use types. Nevertheless, despite these advantages, the method’s dependency on subjectively defined membership functions and its heightened computational complexity may constrain its scalability, particularly when applied to larger datasets or regions. The accuracy of this method is primarily influenced by factors such as the quality and resolution of the spatial data, size of the primary fields, the precision in calculating the proportions of different land-use types, and the membership intervals used in defining the transition zone. Nevertheless, when fuzzy set theory is applied with due care and attention and with access to high-quality data, this approach provides an effective tool for urban planners to monitor and manage urban sprawl, optimise land use, and implement sustainable urban development strategies, particularly in transition zones where traditional methods might be inadequate. The unique characteristics of the urban–rural transition zone are shaped by the presence of various land-use types within a compact area. A morphological analysis identified the following land-use types as significantly contributing to the distinct nature of the transition zone: single-family residences, low-density multi-family housing, construction sites, allotment gardens, orchards, green spaces, agricultural land, and boundaries that restrict further urban expansion.
Long-term urbanization processes are leading to significant spatial transformations. To manage and promote sustainable urban development, it is essential to continuously monitor these changes. GIS tools, along with photogrammetric and remote sensing data from programs such as Copernicus and Landsat, have proven invaluable for tracking land use changes in urban and suburban areas [51,53,89,90]. It is important to note that the proposed method is not limited to photogrammetric data; Urban Atlas and CORINE Land Cover (CLC) data can also be effectively utilized. The ability to refine photogrammetric data interpretations based on field surveys allows for more precise analysis of ongoing changes. This approach is not constrained by data publication dates, enabling ongoing monitoring and better understanding of urban development trends. In light of the frequently imprecise character of spatial data, fuzzy set theory is of crucial importance for the accurate identification and definition of urban development. This method allows for precise delineation of metropolitan boundaries and evaluation of urbanization levels within the range of [0, 1].
In the course of their ongoing research, the authors have devoted attention to the question of analysing the dynamics of change, including the analysis of the trajectory of change in the urbanisation process. The question of determining the point in time, in relation to the value of spatial features, at which the incorporation of ‘urban islands’ into the urban fabric occurs is an interesting one. The authors posit that the combination of advanced technologies, including satellite data, machine learning, and artificial intelligence, could enhance the monitoring and prediction of urbanisation trends. Satellite data could provide current information on land use changes, while machine learning algorithms could identify development patterns and predict the location of the next urbanisation spike. The application of artificial intelligence could facilitate the automation of the process of identifying transition zones, while enabling the continuous monitoring of these areas. The combination of these technologies will facilitate a more comprehensive understanding of urban development dynamics, thereby enabling sustainable spatial management and the minimisation of the negative effects of urbanisation on rural and natural areas.
The present study’s innovative contribution lies in its application of fuzzy set theory to analyse and accurately delineate urban boundaries, as well as to identify the urban–rural transition zone. The principal innovative elements are as follows:
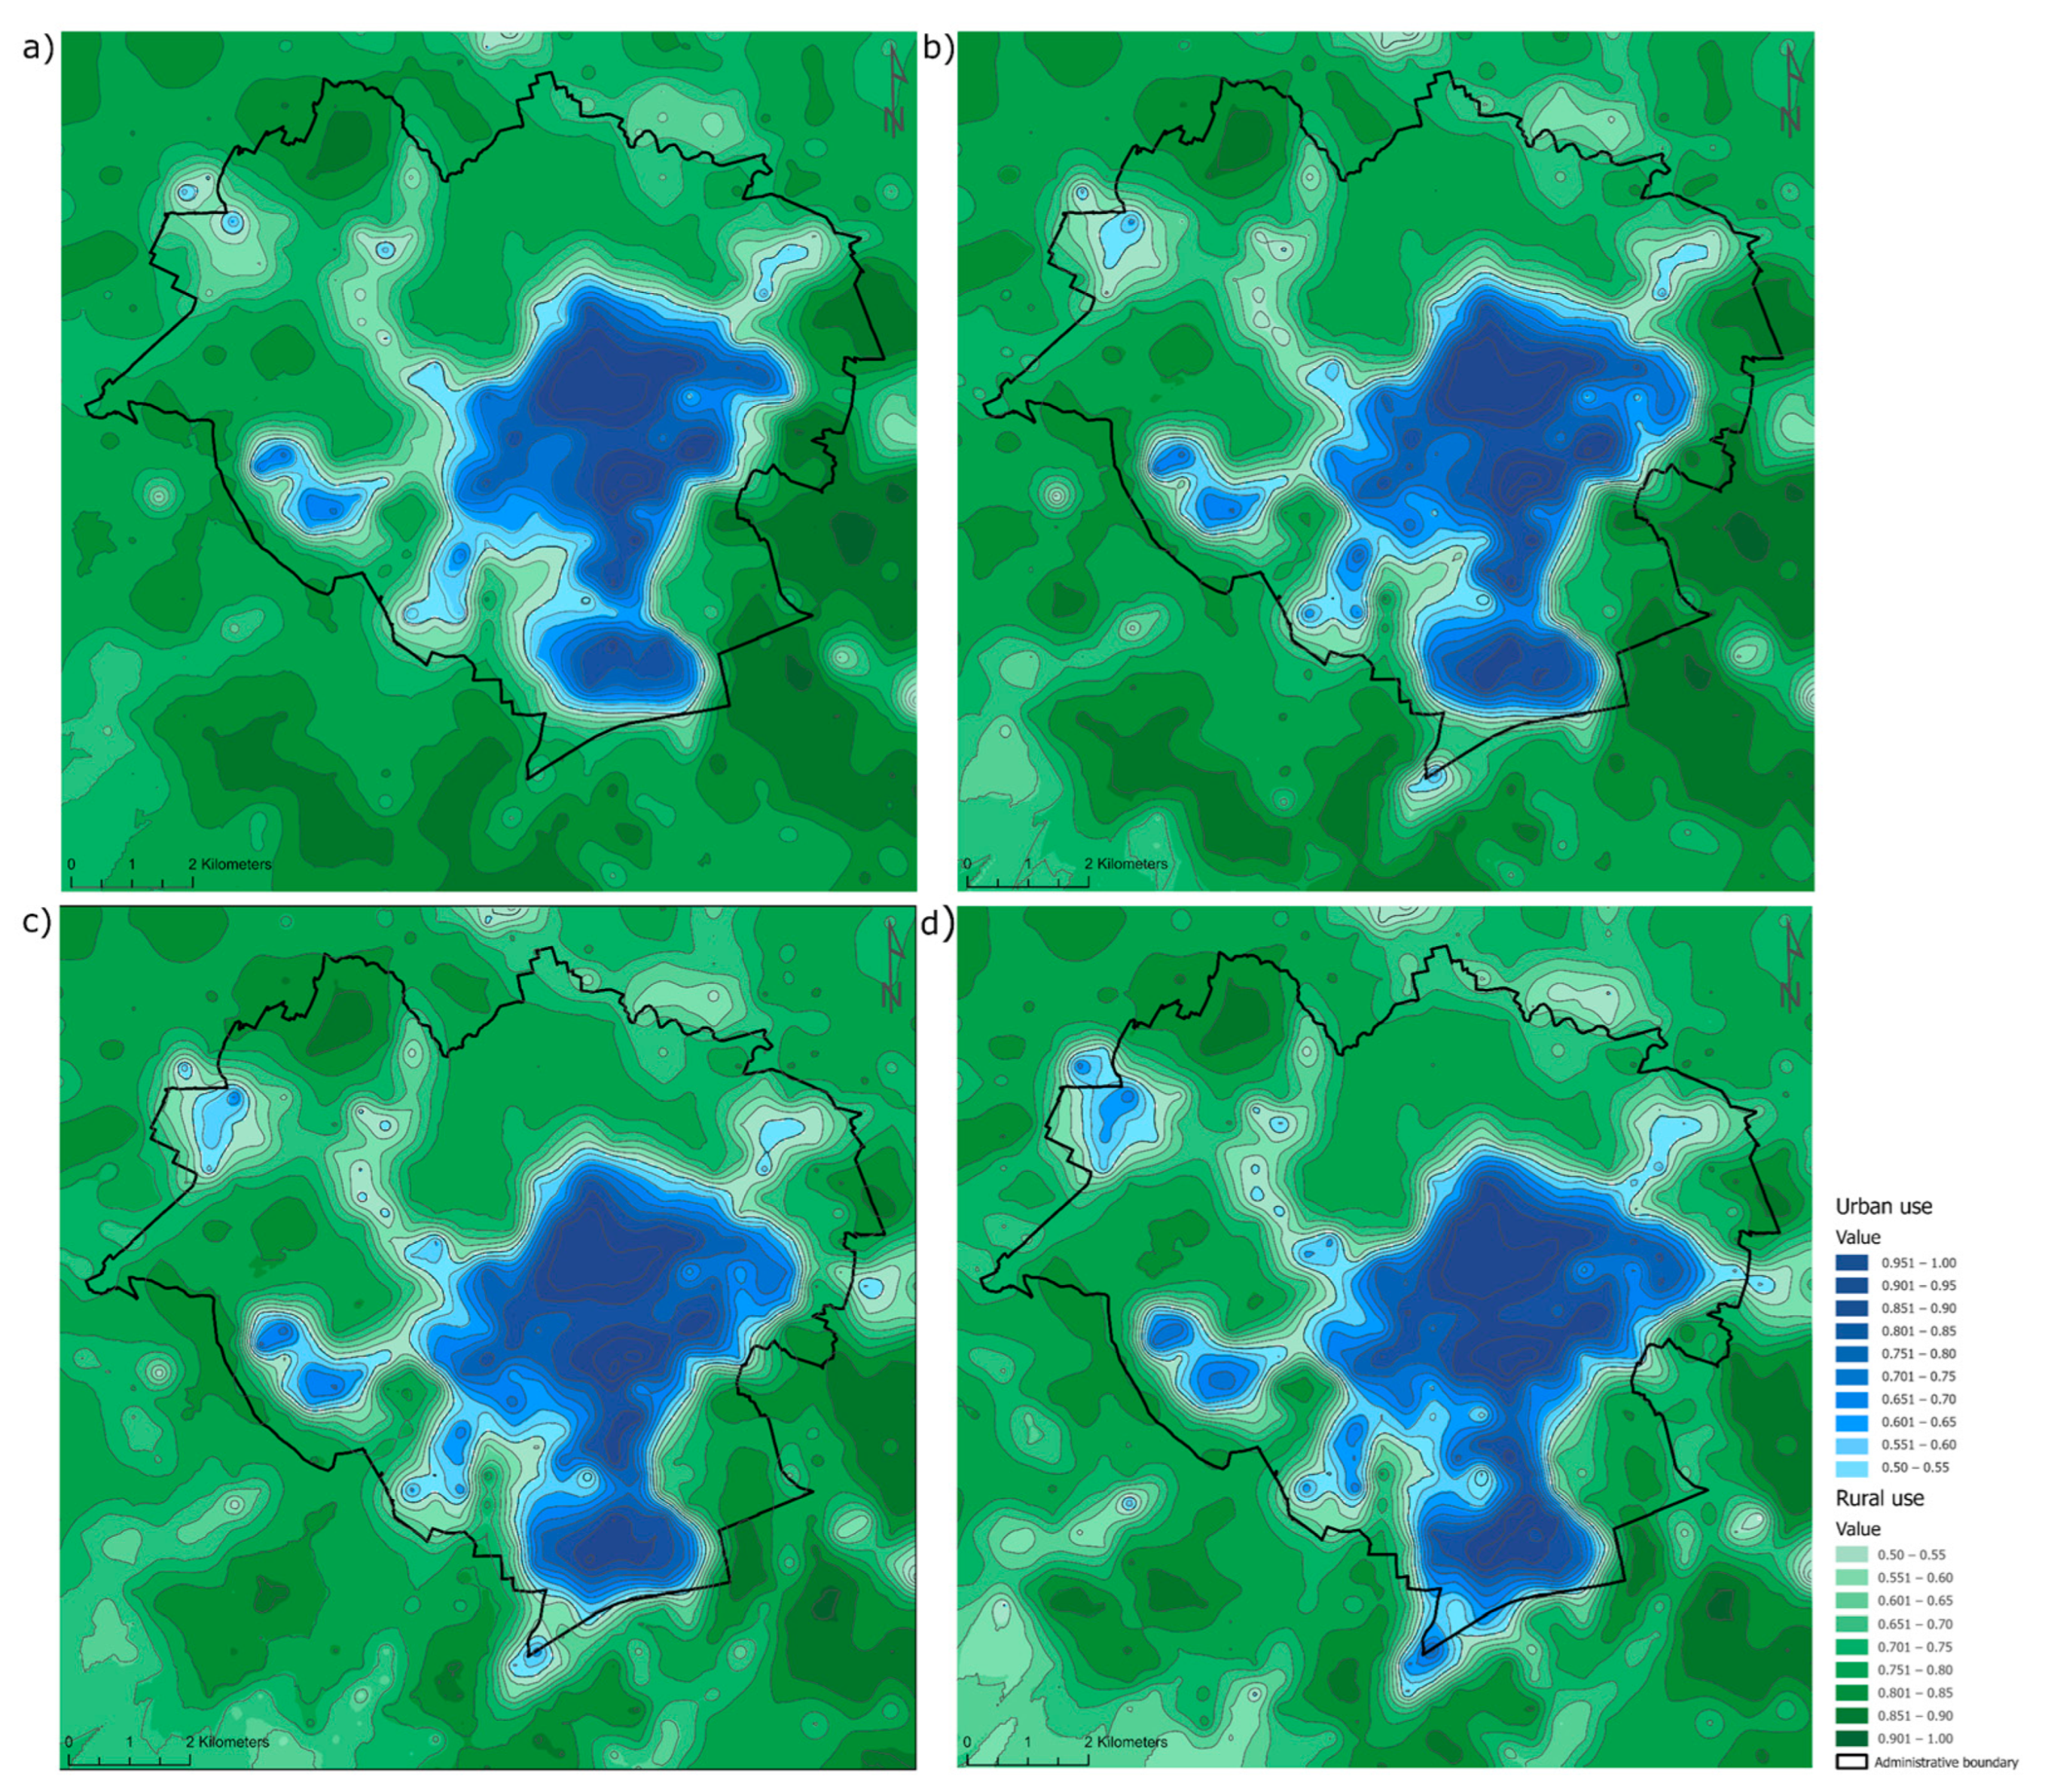
The application of fuzzy set theory: In contrast to the conventional delineation of sharp boundaries between urban and rural areas, this study employs a fuzzy boundary approach that more accurately reflects the gradual transitions in land use. The concepts of urban or rural function set memberships with values in the range [0, 1] are introduced, thus enabling the analysis of complex, hybrid areas with greater accuracy;
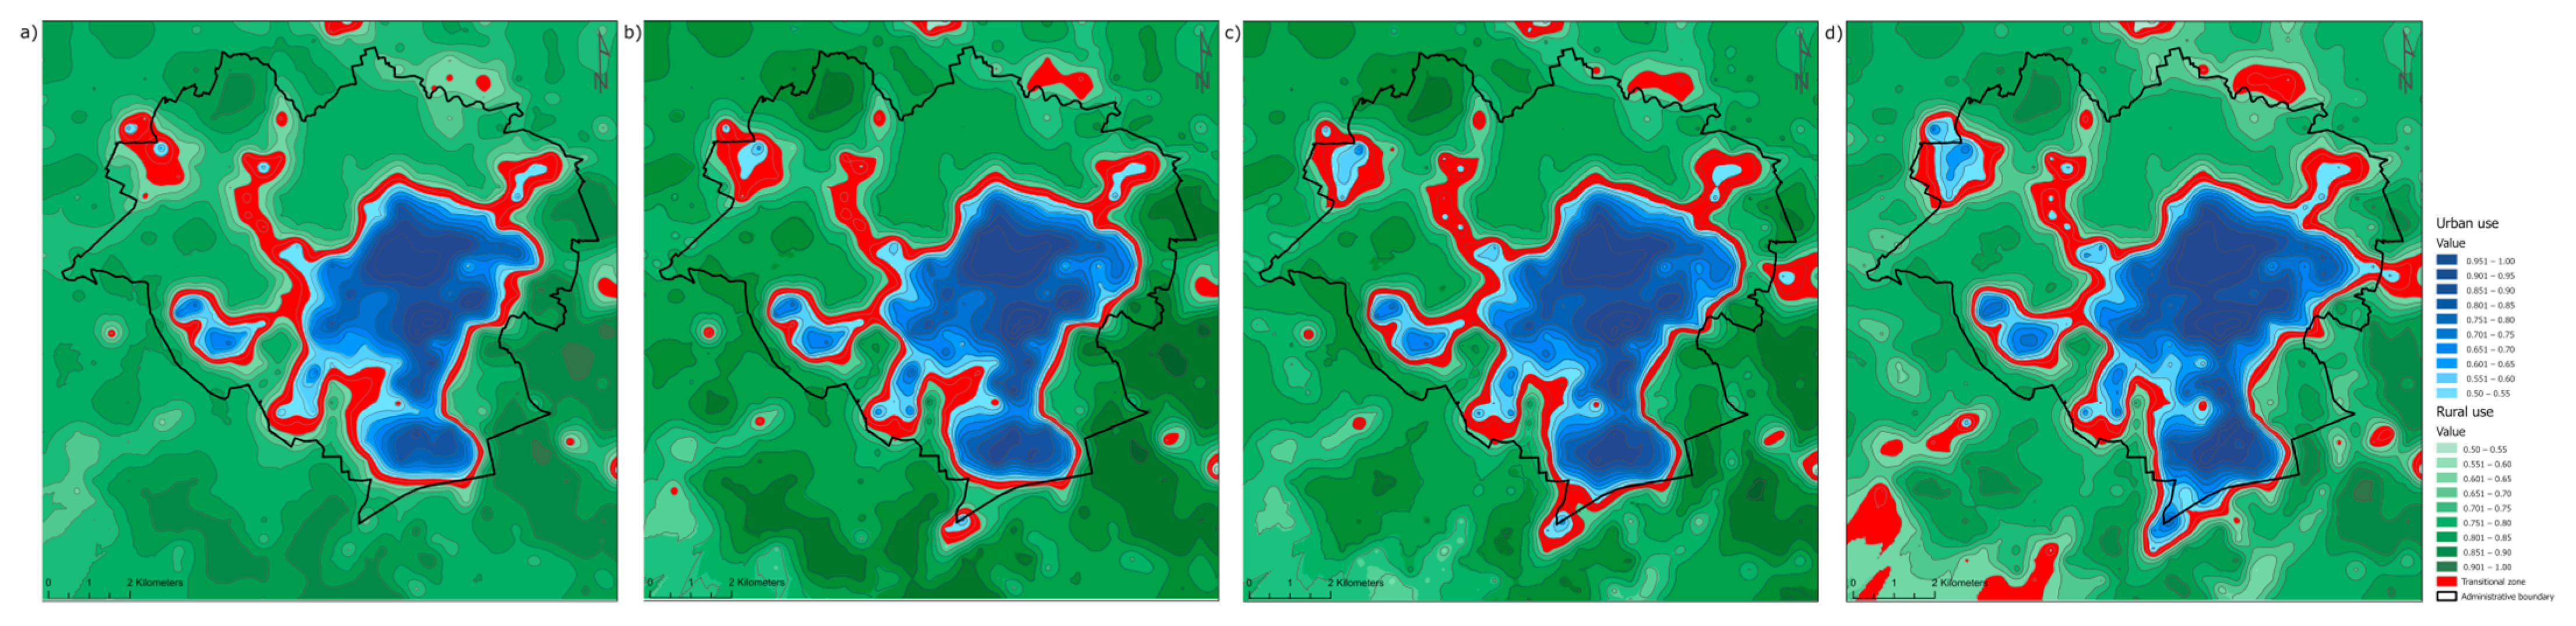
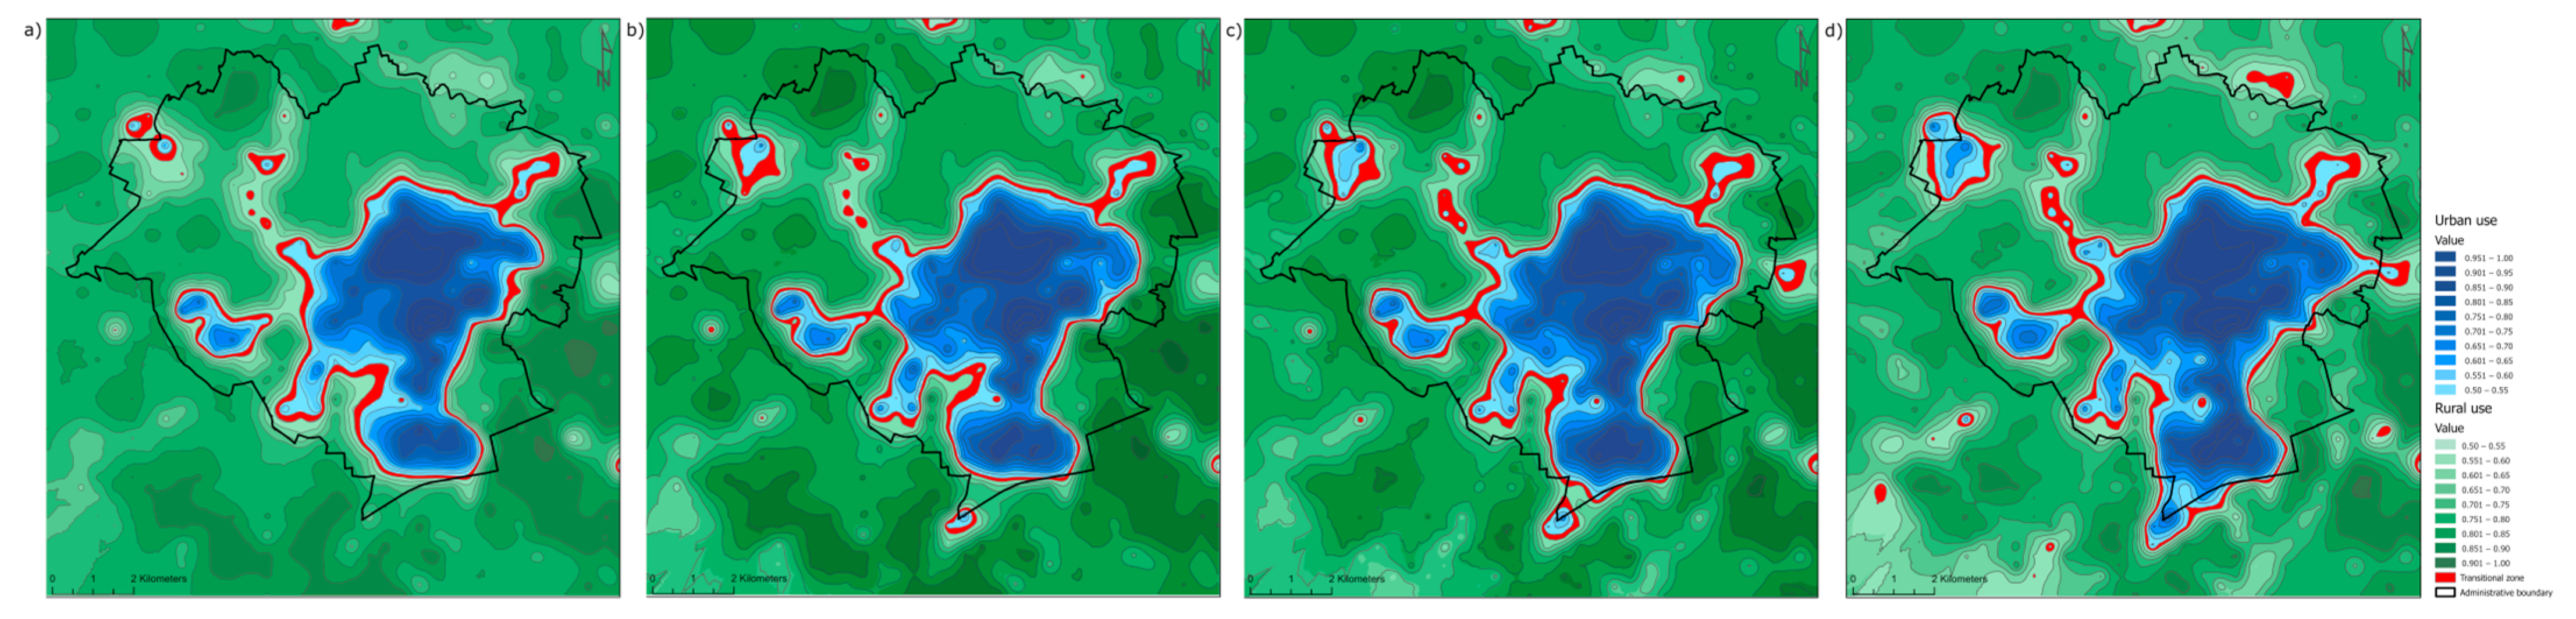
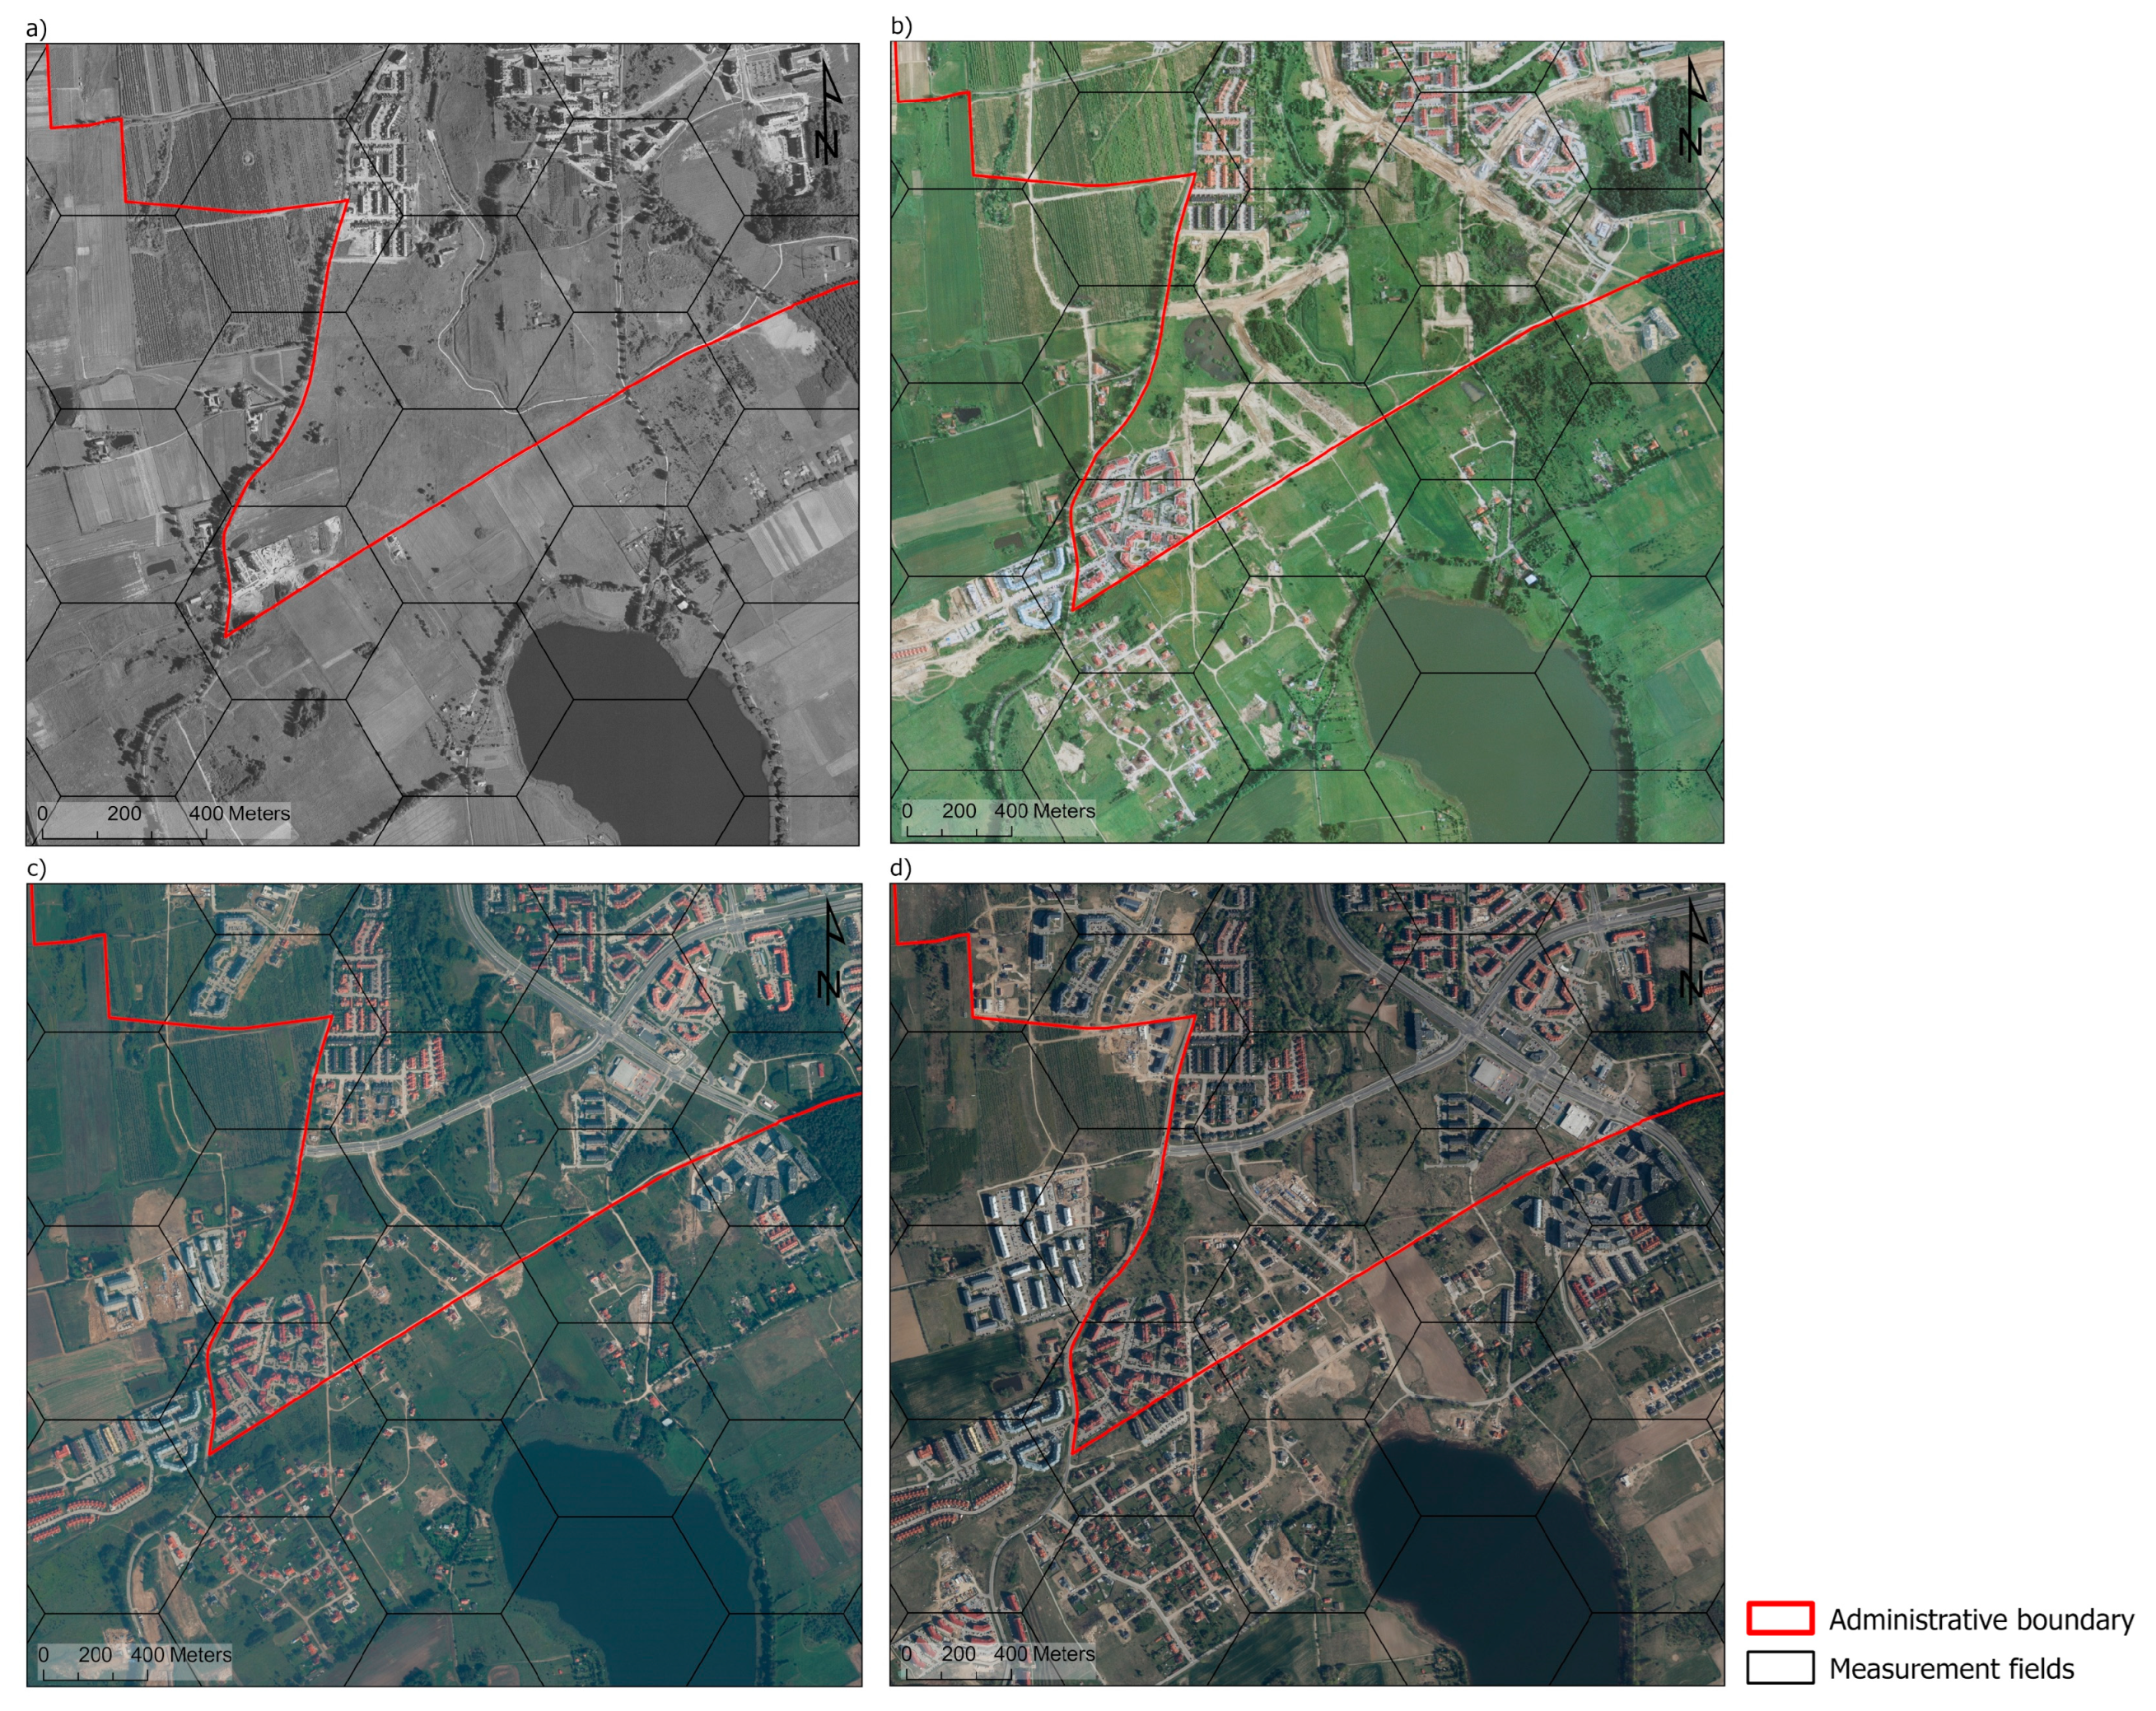
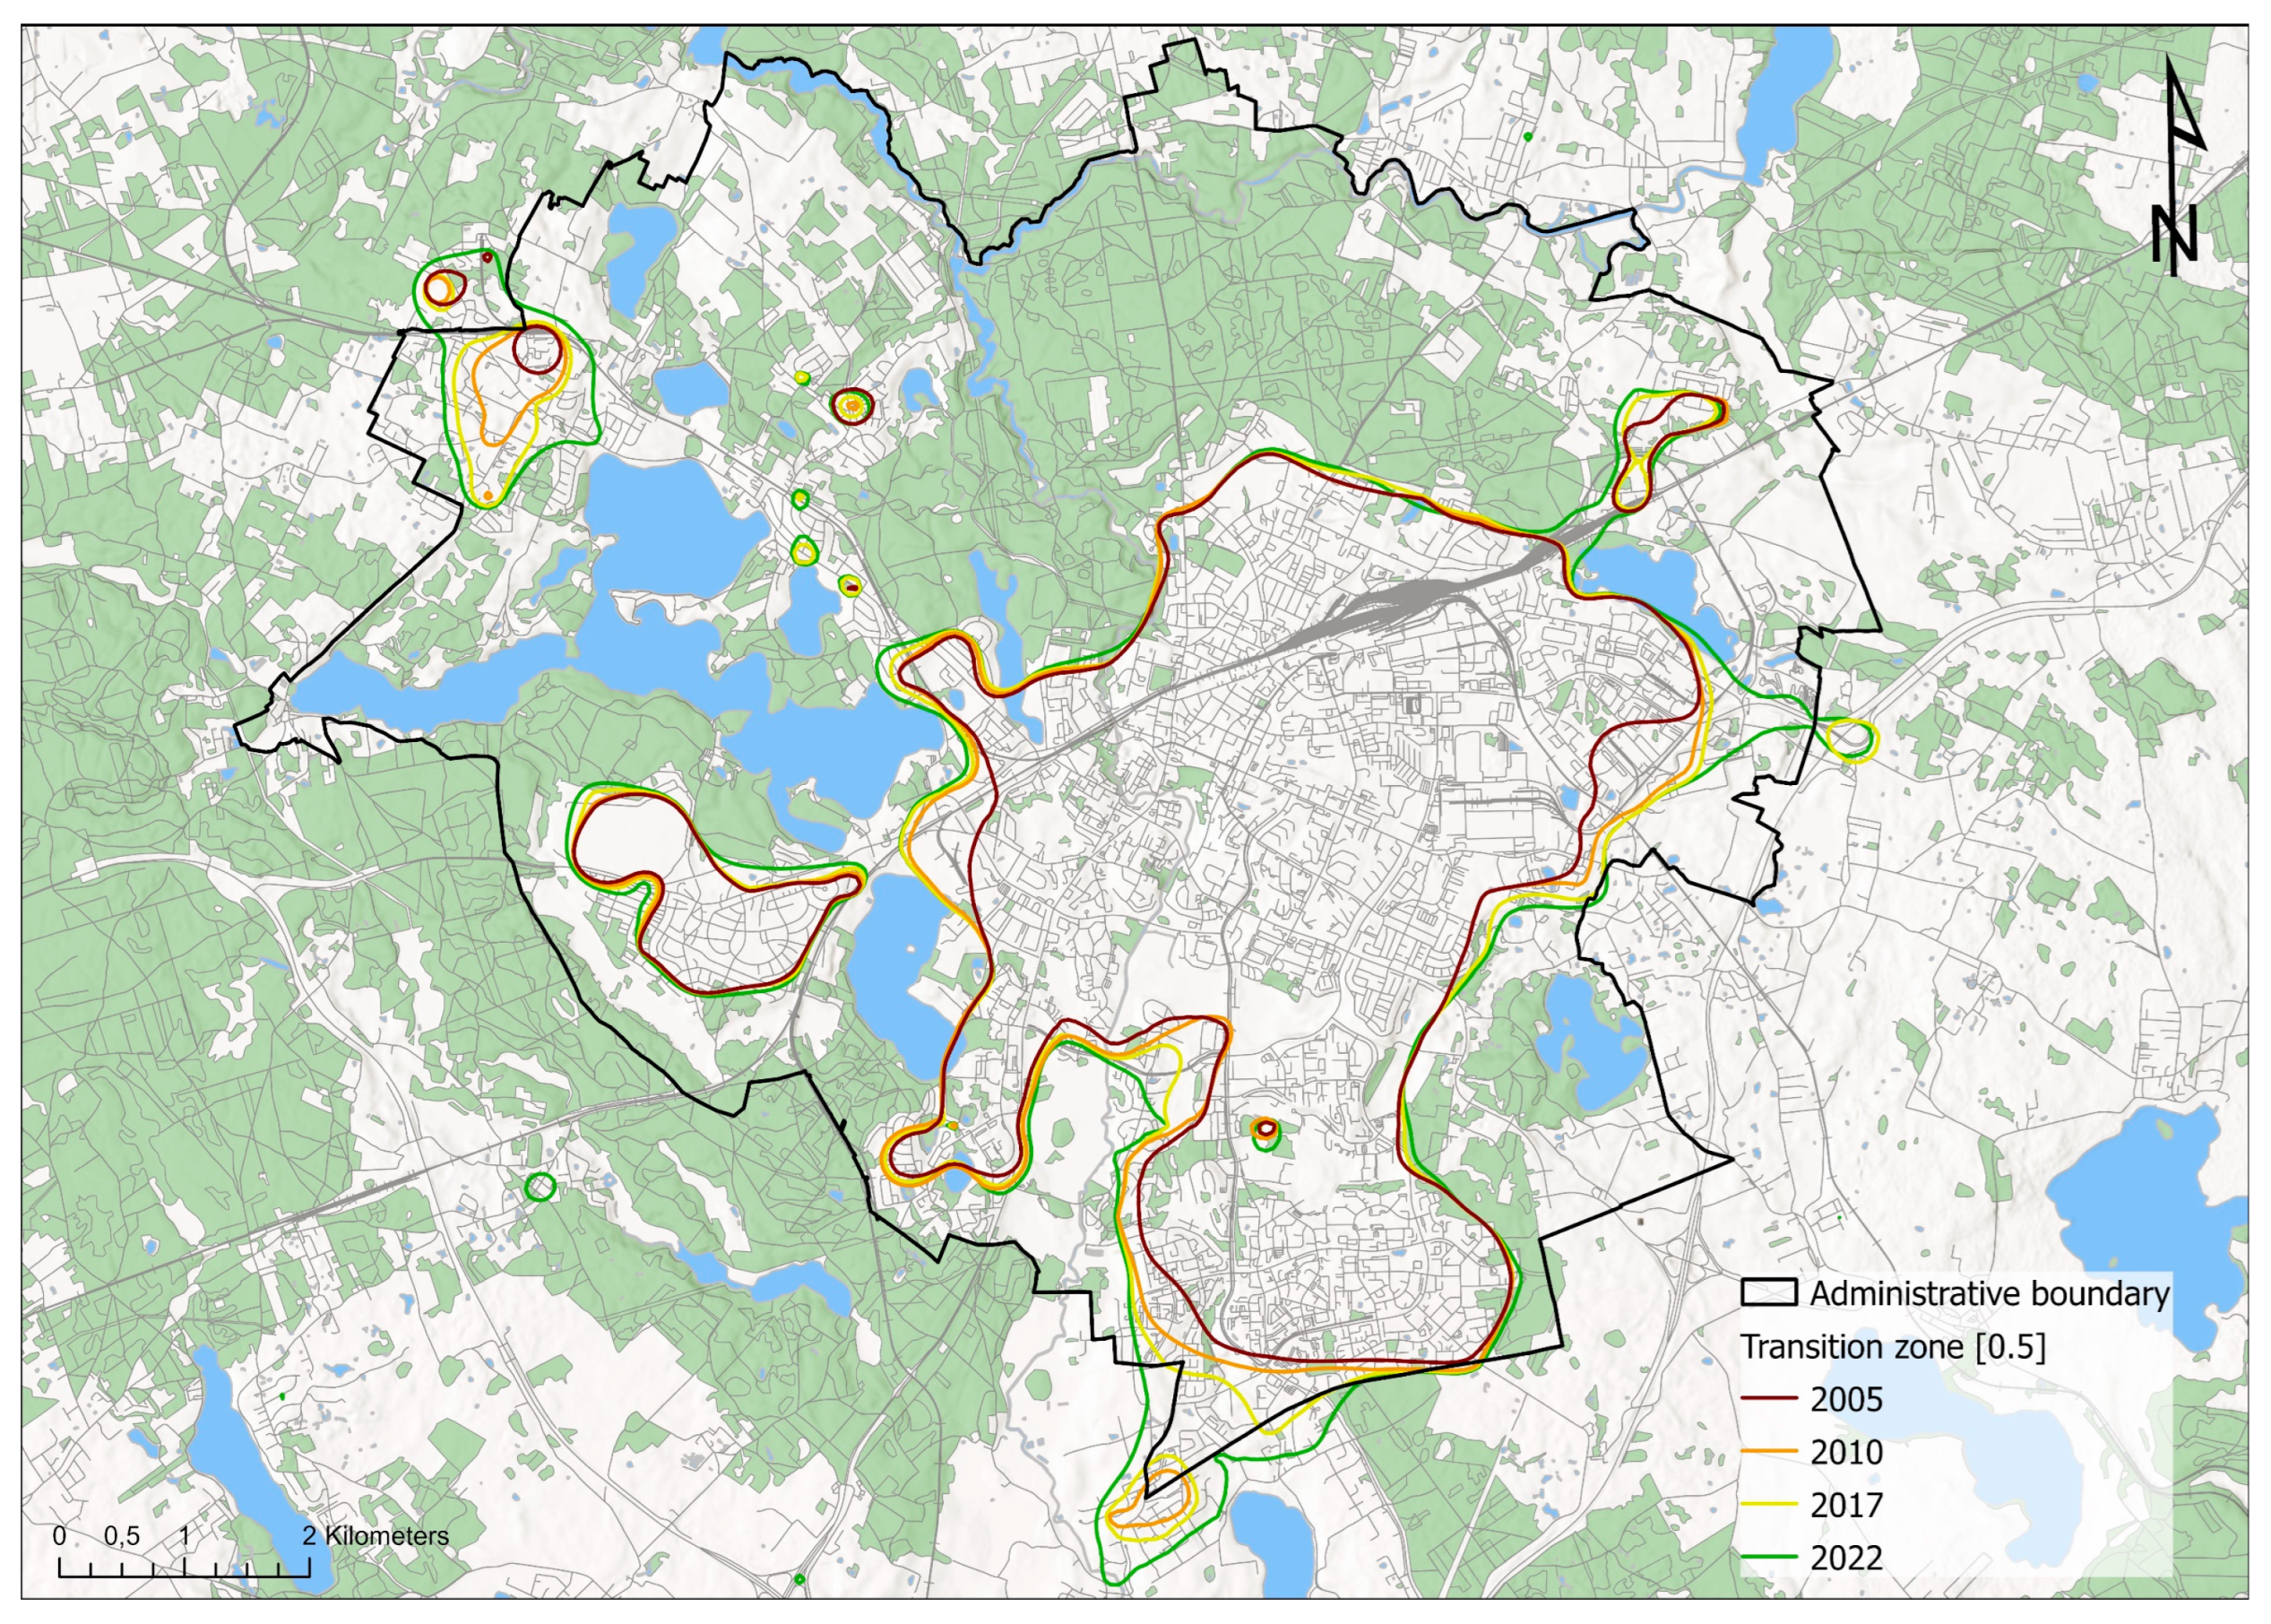
The dynamics of spatial change: The study monitors spatial change and the extent of urbanisation across selected time periods (2005, 2010, 2017, 2022), examining the rate and trajectory of urban development, thereby facilitating more accurate forecasting of future urban development;
The utilisation of sophisticated geospatial data analytics techniques: the application of photogrammetric techniques, GIS, and spatial data derived from orthophotomaps and remote terrain reconnaissance enabled the precise location of land use changes and the identification of conflict areas;
Monitoring of transition zones: The study focuses on the continuous monitoring of urban–rural transition zones, which is crucial for the prevention of urban sprawl and the degradation of green spaces.
In conclusion, the study introduces a novel approach to the analysis of urbanisation, enabling a more flexible and precise delineation of urban boundaries in peri-urban areas that are undergoing dynamic change.

5. Conclusions

Despite the widely discussed issues of urban development, as shown in the literature review, the identification of the trends of this development and the shift of the transition zone of the city toward the countryside is still an unsolved problem. This is a key issue to identify the real limits of the city and to plan its development in a sustainable way. Identifying the directions of expansion can support the optimisation of urban infrastructure and protect naturally valuable areas from uncontrolled degradation caused by dispersed development. Parameters such as the width and dynamics of change of the transition zone provide valuable information such as the direction, barriers, and intensity of development, allowing the identification of significant problems associated with this process. The development of dynamic methods for the identification of transition zones is therefore an extremely important issue.
Urban development induces changes in the rural-urban transition zone. The parameters of the transition zone and the accompanying spatial changes should be regularly monitored. Urbanization processes in peri-urban areas should be closely examined to minimize the uncontrolled growth of the urban–rural transition zone in violation of the provisions of local zoning plans. Changes in land use are particularly evident in the transition zone, and they determine the directions of urban development.
In the present study, the presented method was used to identify and localize the boundary of urban growth and the rural-urban transition zone. The fuzzy measures assigned to urban functions are highly useful for evaluating the degree of urbanization in the interval [0.00–1.00], as well as variations in the rate of urban development. The external boundaries of urban development and its spatial diffusion can also be reliably identified based on the degree of membership of the analysed land-use types. The monitoring of urbanization processes, particularly in the transition zone area, should be based on objective geospatial data, which provide a valuable source of information and a reference point for the development of new tools. It is essential to ensure open access to these data, as well as to employ popular and open exchange standards that encompass both current and historical spatial data. This will facilitate accurate and reliable analysis of the dynamics of the urbanization process.
The study revealed significant alterations to the urban development boundaries and land use intensity, defined within the interval [0, 1] through the proposed methodology. This allowed for the identification of the prevailing trends in urban development. A comparative analysis of urbanisation processes between the years 2005 and 2022 reveals a progressive urbanisation within the transition zone, resulting in the incorporation of an increasing amount of rural land into the urban area. This is observed in the studied membership intervals [0.30–0.50, 0.35–0.50, 0.40–0.50, 0.45–0.50]. In the membership interval [0.30–0.50], the area exhibited a notable expansion, increasing from 4680 ha in 2005 to 5420 ha in 2022. This trend suggests the proliferation of low-density urbanization, which has occurred at the expense of rural areas. This expansion is further corroborated by the growth in the designated areas for residential development, where the spatial characteristics of urban and rural zones are increasingly intermingled. It is noteworthy that there was an increase of 25.3% in single-family housing and 9.4% in multi-family housing, which contributed to the gradual transformation of these areas into more urbanized forms of land use.
Further analysis of the membership interval [0.40–0.50] reveals a state of stabilization, whereas the slight growth observed in the [0.45–0.50] interval is indicative of a continuous process of urban development. Furthermore, a notable increase in the area allocated for public roads (+14%) between 2017 and 2022 serves to illustrate the pivotal role that infrastructure plays in facilitating the process of urban expansion.
In conclusion, the data on the area in each membership group and the changes in land use demonstrate a clear trend of urban sprawl, characterized by a noticeable increase in the area integrated into the transition zone for residential development and road infrastructure. This expansion occurs at the expense of natural and agricultural land, emphasizing the need for monitoring and sustainable planning to manage this growth and mitigate the negative impacts on the environment and rural areas.
The results of the validation of the adopted method indicate that the utilisation of fuzzy sets facilitates a more precise delineation of the transition zone. When applied to data of an appropriate quality and resolution, this method enables more accurate identification of anomalies and local urban development patterns. Furthermore, the method enables the examination of urbanisation trends through the identification of “urban islands”, which, in conjunction with the various stages of urban development, determine the direction of urban expansion. The findings of the study substantiate the efficacy of the adopted method in discerning spatial alterations that precipitate urban expansion and its utility in the modelling and forecasting of future spatial changes.
The direction and rate of urban development were influenced mainly by the absence of significant physical barriers and the rapid development of infrastructure (southern segment of the Olsztyn ring road with the accompanying infrastructure, and transport hubs with access roads). The urban boundaries and transition zone were precisely defined, exhibiting a dichotomous character and reflecting a clear demarcation between urban and rural areas. In contrast, other boundaries were fuzzy in nature, extending through space as a continuum, suggesting a gradual, smooth transition between areas with different degrees of urbanization. Such variation in the definition of boundaries reflects the dynamic nature of urbanization processes and the complexity and heterogeneity of land use at the urban–rural interface. The study also demonstrated that regions with characteristics typical of a transitional zone are formed around urban areas, but also inside urban areas if some segments of urban space are characterized by a low degree of membership in the set of urban functions.
The confirmation of the effectiveness of the proposed method of determining the transition zone allows the authors to perceive its potential in the context of spatial planning and management, as well as the formulation of new strategies for the development of cities and neighbouring municipalities. The implementation of this method can facilitate optimal spatial decision making, which can yield numerous benefits for stakeholders. Nevertheless, the process is intricate and comprises multiple stages, necessitating the judicious selection of data, the deployment of sophisticated analytical instruments, and a meticulous interpretation of the resulting data.
In the context of the implementation of the method, the following stages can be distinguished:
  • Determining the purpose of the analysis—clearly defining the research problem, e.g., identifying and locating urban investment boundaries and transition zones that can be used to forecast urban development; establishing the temporal and spatial scope of the study;
  • Acquisition of geospatial data collection of precise satellite data, aerial photographs and GIS data;
  • Land use classification—assigning individual lands to specific land use categories adopted for the analysis;
  • Development of an urban and transition zone model—creation of a detailed spatial model including urban and rural transition areas;
  • Analysis of land use change—study of the dynamics of land use change over specific time intervals;
  • Visualisation of results—preparation of detailed maps showing land use changes, such as conversion of agricultural land to urban;
  • Validation of results—carrying out validation of results using statistical and field methods;
  • Interpretation and inference—analysing the causes of observed changes and assessing their impact on the study area;
  • Visualising results—graphical presentation of the results obtained to facilitate interpretation and communication;
  • Inference, forecasting of change and updating of planning policy—formulation of forecasts of future change and updating of planning policy.
Once the analysis has been completed, it would be beneficial to implement a monitoring system for land use change. The regular updating of data (for example, on an annual or several-yearly basis) will facilitate the tracking of long-term trends in urban and peri-urban space. The findings of this analysis can inform the formulation of a novel spatial planning policy framework that reflects the identified trends and challenges, such as the necessity to safeguard green spaces or the implementation of sustainable urban development.
The method presented does not assume a centralized nature of the city; rather, it examines the emergence of different forms of use independently of the centres of settlement. The delimitation of a city, or urban investment, is a theoretical construct that can be useful in a number of ways. For example, it can inform negotiations regarding the appropriate development and shaping of space at the interface between different administrative units.

Author Contributions

Conceptualization, A.B.; Data curation, A.B. and S.C.; Formal analysis, A.B.; Methodology, A.B.; Project administration, I.C., S.C. and K.S.; Supervision, I.C.; Visualization, S.C. and K.S.; Writing—original draft, A.B. and S.C.; Writing—review and editing, A.B., I.C. and S.C. All authors have read and agreed to the published version of the manuscript.

Funding

This research received no external funding.

Institutional Review Board Statement

Not applicable.

Informed Consent Statement

Not applicable.

Data Availability Statement

The data presented in this study are available upon request from the corresponding author.

Conflicts of Interest

The authors declare no conflicts of interest.

References

  1. Gratz, N.G. Urbanization, Arthropod and Rodent Pests and Human Health. In Proceedings of the 3rd International Conference on Urban Pests; Grafické Závody: Prague, Czech Republic, 1999. [Google Scholar]
  2. United Nations World Urbanization Prospects—Population Division. United Nations; United Nations World Urbanization Prospects—Population Division: New York, NY, USA, 2019. [Google Scholar]
  3. Węcławowicz, G. Geografia społeczna miast w Polsce = Urban social geography in Poland. Prz. Geogr. 2017, 89, 535–563. [Google Scholar] [CrossRef]
  4. Antrop, M.; Van Eetvelde, V. Holistic Aspects of Suburban Landscapes: Visual Image Interpretation and Landscape Metrics. Landsc. Urban Plan. 2000, 50, 43–58. [Google Scholar] [CrossRef]
  5. Acevedo, W.; Masuoka, P. Time-Series Animation Techniques for Visualizing Urban Growth. Comput. Geosci. 1997, 23, 423–435. [Google Scholar] [CrossRef]
  6. Antrop, M. Why Landscapes of the Past Are Important for the Future. In Landscape and Urban Planning; Elsevier: Amsterdam, The Netherlands, 2005; Volume 70. [Google Scholar]
  7. Paddison, R. Handbook of Urban Studies; SAGE Publications: Washington, DC, USA, 1998; pp. 1–512. [Google Scholar]
  8. van den Berg, L.; Drewett, R.; Klaassen, L.H. A Study of Growth and Decline: Urban Europe; Elsevier: Amsterdam, The Netherlands, 1982; ISBN 978-1-4831-5743-6. [Google Scholar]
  9. Champion, A.G. The Stages of Urban Development Model Applied to Upper-Tier Regions in the British Urban System. Area 1986, 18, 239–245. [Google Scholar]
  10. Szmytkie, R. Suburbanisation Processes within and Outside the City: The Development of Intra-Urban Suburbs in Wrocław, Poland. Morav. Geogr. Rep. 2021, 29, 149–165. [Google Scholar] [CrossRef]
  11. Dadashpoor, H.; Ahani, S. Land Tenure-Related Conflicts in Peri-Urban Areas: A Review. Land Use Policy 2019, 85, 218–229. [Google Scholar] [CrossRef]
  12. Renigier-Biłozor, M.; Biłozor, A. Optimization of the Variables Selection in the Process of Real Estate Markets Rating. Oeconomia Copernic. 2015, 6, 139. [Google Scholar] [CrossRef]
  13. Bilozor, A.; Renigier-Bilozor, M.; Cellmer, R. Assessment Procedure of Suburban Land Attractiveness and Usability for Housing. In Proceedings of the 2018 Baltic Geodetic Congress (BGC Geomatics), Olsztyn, Poland, 21–23 June 2018; pp. 91–96. [Google Scholar]
  14. Ready, R.; Abdalla, C. GIS Analysis of Land Use on the Rural-Urban Fringe: The Impact of Land Use and Potential Local Disamenities on Residential Property Values and on the Location of Residential Development in Berks County, Pennsylvania; Northeast Regional Center for Rural Development, Pennsylvania State University: University Park, PA, USA, 2003. [Google Scholar]
  15. Hasse, J.E.; Lathrop, R.G. Land Resource Impact Indicators of Urban Sprawl. Appl. Geogr. 2003, 23, 159–175. [Google Scholar] [CrossRef]
  16. Biłozor, A.; Renigier-Biłozor, M. Procedure of Assessing Usefulness of the Land in the Process of Optimal Investment Location for Multi-Family Housing Function. Procedia Eng. 2016, 161, 1868–1873. [Google Scholar] [CrossRef]
  17. Gumma, M.K.; Mohammad, I.; Nedumaran, S.; Whitbread, A.; Lagerkvist, C.J. Urban Sprawl and Adverse Impacts on Agricultural Land: A Case Study on Hyderabad, India. Remote Sens. 2017, 9, 1136. [Google Scholar] [CrossRef]
  18. Renigier-Biłozor, M.; Biłozor, A.; Wisniewski, R. Rating Engineering of Real Estate Markets as the Condition of Urban Areas Assessment. Land Use Policy 2017, 61, 511–525. [Google Scholar] [CrossRef]
  19. Altrock, U. New (Sub)Urbanism? How German Cities Try to Create Urban Neighborhoods in Their Outskirts as a Contribution to Solving Their Recent Housing Crises. Urban Gov. 2022, 2, 130–143. [Google Scholar] [CrossRef]
  20. Biłozor, A.; Czyża, S.; Bajerowski, T. Identification and Location of a Transitional Zone between an Urban and a Rural Area Using Fuzzy Set Theory, CLC, and HRL Data. Sustainability 2019, 11, 7014. [Google Scholar] [CrossRef]
  21. Simon, D. Urban Environments: Issues on the Peri-Urban Fringe. Annu. Rev. Environ. Resour. 2008, 33, 167–185. [Google Scholar] [CrossRef]
  22. Siemiński, J.L. Kontinuum miejsko-wiejskie i niektóre jego problemy infrastrukturalne. Infrastrukt. Ekol. Teren. Wiej. 2010, 2, 215–228. [Google Scholar]
  23. Sobotka, S. Przekształcenia historycznych układów przestrzennych wsi w strefie podmiejskiej Olsztyna, ze szczególnym uwzględnieniem Brąswałdu, Dorotowa i Jonkowa. Acta Sci. Pol. Adm. Locorum 2014, 13, 39–57. [Google Scholar]
  24. Szmytkie, R. Metody Analizy Morfologii i Fizjonomii Jednostek Osadniczych; Instytut Geografii i Rozwoju Regionalnego Uniwersytetu Wrocławskiego: Wrocław, Poland, 2014; ISBN 978-83-62673-45-2. [Google Scholar]
  25. Konecka-Szydłowska, B. Najmniejsze Miasta w Polsce w Ujęciu Koncepcji Kontinuum Miejsko-Wiejskiego. Rozw. Reg. Polityka Reg. 2018, 41, 151–165. [Google Scholar] [CrossRef]
  26. Labbé, D. Facing the Urban Transition in Hanoi: Recent Urban Planning Issues and Initiatives; Institut National de la Recherche Scientifique-Urbanisation Centre de Documentation: Quebec, QC, Canada, 2010. [Google Scholar]
  27. Loibl, W.; Piorr, A.P.; Ravetz, J. Concepts and Methods. In Life Sciences; University of Copenhagen: Copenhagen, Denmark, 2011. [Google Scholar]
  28. Ravetz, J.; Warhurst, P. Manchester: Re-Inventing the Local–Global in the Peri-Urban City-Region. In Peri-Urban Futures: Scenarios and Models for Land Use Change in Europe; Nilsson, K., Pauleit, S., Bell, S., Aalbers, C., Sick Nielsen, T.A., Eds.; Springer: Berlin/Heidelberg, Germany, 2013; pp. 169–207. ISBN 978-3-642-30528-3. [Google Scholar]
  29. Degórska, B. Urbanizacja Przestrzenna Terenów Wiejskich na Obszarze Metropolitalnym Warszawy: Kontekst Ekologiczno-Krajobrazowy; IGiPZ PAN: Warszawa, Poland, 2017; ISBN 978-83-61590-86-6. [Google Scholar]
  30. Cieślak, I.; Biłozor, A. A Dynamic Evaluation of Landscape Transformations Based on Land Cover Data. Landsc. Online 2022, 97, 1097. [Google Scholar] [CrossRef]
  31. Ma, D.; Xiong, H.; Zhang, F.; Gao, L.; Zhao, N.; Yang, G.; Yang, Q. China’s Industrial Green Total-Factor Energy Efficiency and Its Influencing Factors: A Spatial Econometric Analysis. Environ. Sci. Pollut. Res. 2022, 29, 18559–18577. [Google Scholar] [CrossRef]
  32. Moreira-Muñoz, A.; Río, C.D.; Leguia-Cruz, M.; Mansilla-Quiñones, P. Spatial Dynamics in the Urban-Rural-Natural Interface within a Social-Ecological Hotspot. Appl. Geogr. 2023, 159, 103060. [Google Scholar] [CrossRef]
  33. Tacoli, C. The Links between Urban and Rural Development. Environ. Urban. 2003, 15, 3–12. [Google Scholar] [CrossRef]
  34. Gallent, N. The Rural–Urban Fringe: A New Priority for Planning Policy? Plan. Pract. Res. 2006, 21, 383–393. [Google Scholar] [CrossRef]
  35. Nabielek, K.; Kronberger-Nabielek, P.; Hamers, D. The Rural-Urban Fringe in the Netherlands: Recent Developments and Future Challenges. Spool 2013, 1, 101–120. [Google Scholar]
  36. Hoffmann, E.; Jose, M.; Nölke, N.; Möckel, T. Construction and Use of a Simple Index of Urbanisation in the Rural–Urban Interface of Bangalore, India. Sustainability 2017, 9, 2146. [Google Scholar] [CrossRef]
  37. Gallent, N.; Shaw, D. Spatial Planning, Area Action Plans and the Rural-Urban Fringe. J. Environ. Plan. Manag. 2007, 50, 617–638. [Google Scholar] [CrossRef]
  38. Gant, R.L.; Robinson, G.M.; Fazal, S. Land-Use Change in the Edgelands: Policies and Pressures in London’s Rural–Urban Fringe. Land Use Policy 2011, 28, 266–279. [Google Scholar] [CrossRef]
  39. Hao, P.; Geertman, S.; Hooimeijer, P.; Sliuzas, R. The Land-Use Diversity in Urban Villages in Shenzhen. Environ. Plan A 2012, 44, 2742–2764. [Google Scholar] [CrossRef]
  40. Chen, M.; Zhou, Y.; Huang, X.; Ye, C. The Integration of New-Type Urbanization and Rural Revitalization Strategies in China: Origin, Reality and Future Trends. Land 2021, 10, 207. [Google Scholar] [CrossRef]
  41. De Toro, P.; Formato, E.; Fierro, N. Sustainability Assessments of Peri-Urban Areas: An Evaluation Model for the Territorialization of the Sustainable Development Goals. Land 2023, 12, 1415. [Google Scholar] [CrossRef]
  42. Lin, J.; Qiu, S.; Tan, X.; Zhuang, Y. Measuring the Relationship between Morphological Spatial Pattern of Green Space and Urban Heat Island Using Machine Learning Methods. Build. Environ. 2023, 228, 109910. [Google Scholar] [CrossRef]
  43. Nechyba, T.J.; Walsh, R.P. Urban Sprawl. J. Econ. Perspect. 2004, 18, 177–200. [Google Scholar] [CrossRef]
  44. Antrop, M. Rural-Urban Conflicts and Opportunities. In The New Dimensions of the European Landscape; Wageningen UR Frontis Series; Jongman, R.H.G., Ed.; Springer: Dordrecht, The Netherlands, 2004; Volume 4, pp. 83–91. ISBN 978-1-4020-2910-3. [Google Scholar]
  45. Yang, Y.; Ye, L. Peri-Urban Development. In Urban Studies; Oxford University Press: Oxford, UK, 2020; ISBN 978-0-19-092248-1. [Google Scholar]
  46. Qviström, M. Landscapes out of Order: Studying the Inner Urban Fringe beyond the Rural—Urban Divide. Geogr. Ann. Ser. B Hum. Geogr. 2007, 89, 269–282. [Google Scholar] [CrossRef]
  47. Dijkstra, L.; Poelman, H. A Harmonised Definition of Cities and Rural Areas: The New Degree of Urbanisation. In Regional Policy Working Papers; Word Bank: Washington, DC, USA, 2014. [Google Scholar]
  48. Almusaed, A.; Almssad, A. City Phenomenon between Urban Structure and Composition. In Sustainability in Urban Planning and Design; Almusaed, A., Almssad, A., Truong-Hong, L., Eds.; IntechOpen: London, UK, 2020; ISBN 978-1-83880-351-3. [Google Scholar]
  49. Sahana, M.; Ravetz, J.; Patel, P.P.; Dadashpoor, H.; Follmann, A. Where Is the Peri-Urban? A Systematic Review of Peri-Urban Research and Approaches for Its Identification and Demarcation Worldwide. Remote Sens. 2023, 15, 1316. [Google Scholar] [CrossRef]
  50. Al-Bilbisi, H. Spatial Monitoring of Urban Expansion Using Satellite Remote Sensing Images: A Case Study of Amman City, Jordan. Sustainability 2019, 11, 2260. [Google Scholar] [CrossRef]
  51. Rahman, M.M.; Szabó, G. Sustainable Urban Land-Use Optimization Using GIS-Based Multicriteria Decision-Making (GIS-MCDM) Approach. ISPRS Int. J. Geo-Inf. 2022, 11, 313. [Google Scholar] [CrossRef]
  52. Śleszyński, P.; Gibas, P.; Sudra, P. The Problem of Mismatch between the CORINE Land Cover Data Classification and the Development of Settlement in Poland. Remote Sens. 2020, 12, 2253. [Google Scholar] [CrossRef]
  53. Lefebvre, A.; Sannier, C.; Corpetti, T. Monitoring Urban Areas with Sentinel-2A Data: Application to the Update of the Copernicus High Resolution Layer Imperviousness Degree. Remote Sens. 2016, 8, 606. [Google Scholar] [CrossRef]
  54. Balz, T.; Washaya, P.; Jendryke, M. Urban Change Monitoring Using Globally Available Sentinel-1 Imagery. In Proceedings of the 2018 International Workshop on Big Geospatial Data and Data Science (BGDDS), Wuhan, China, 22–23 September 2018; pp. 1–4. [Google Scholar]
  55. Liu, X.; Hu, G.; Chen, Y.; Li, X.; Xu, X.; Li, S.; Pei, F.; Wang, S. High-Resolution Multi-Temporal Mapping of Global Urban Land Using Landsat Images Based on the Google Earth Engine Platform. Remote Sens. Environ. 2018, 209, 227–239. [Google Scholar] [CrossRef]
  56. Schug, F.; Okujeni, A.; Hauer, J.; Hostert, P.; Nielsen, J.Ø.; van der Linden, S. Mapping Patterns of Urban Development in Ouagadougou, Burkina Faso, Using Machine Learning Regression Modeling with Bi-Seasonal Landsat Time Series. Remote Sens. Environ. 2018, 210, 217–228. [Google Scholar] [CrossRef]
  57. Benedetti, A.; Picchiani, M.; Del Frate, F. Sentinel-1 and Sentinel-2 Data Fusion for Urban Change Detection. In Proceedings of the IGARSS 2018—2018 IEEE International Geoscience and Remote Sensing Symposium, Valencia, Spain, 22–27 July 2018; pp. 1962–1965. [Google Scholar]
  58. Akay, S.S.; Sertel, E. Urban Land Cover/Use Change Detection Using High Resolution Spot 5 and Spot 6 Images and Urban Atlas Nomenclature. Int. Arch. Photogramm. Remote Sens. Spatial Inf. Sci. 2016, 41, 789–796. [Google Scholar] [CrossRef]
  59. Che, M.; Gamba, P. Intra-Urban Change Analysis Using Sentinel-1 and Nighttime Light Data. IEEE J. Sel. Top. Appl. Earth Obs. Remote Sens. 2019, 12, 1134–1142. [Google Scholar] [CrossRef]
  60. Liu, Z.; He, C.; Zhang, Q.; Huang, Q.; Yang, Y. Extracting the Dynamics of Urban Expansion in China Using DMSP-OLS Nighttime Light Data from 1992 to 2008. Landsc. Urban Plan. 2012, 106, 62–72. [Google Scholar] [CrossRef]
  61. Washaya, P.; Balz, T. Sar Coherence Change Detection of Urban Areas Affected by Disasters Using Sentinel-1 Imagery. Int. Arch. Photogramm. Remote Sens. Spatial Inf. Sci. 2018, 42, 1857–1861. [Google Scholar] [CrossRef]
  62. Kuc, G.; Chormański, J. Sentinel-2 Imagery for Mapping and Monitoring Imperviousness in Urban Areas. Int. Arch. Photogramm. Remote Sens. Spatial Inf. Sci. 2019, 42, 43–47. [Google Scholar] [CrossRef]
  63. Ma, T.; Zhou, C.; Pei, T.; Haynie, S.; Fan, J. Quantitative Estimation of Urbanization Dynamics Using Time Series of DMSP/OLS Nighttime Light Data: A Comparative Case Study from China’s Cities. Remote Sens. Environ. 2012, 124, 99–107. [Google Scholar] [CrossRef]
  64. Gao, B.; Huang, Q.; He, C.; Dou, Y. Similarities and Differences of City-Size Distributions in Three Main Urban Agglomerations of China from 1992 to 2015: A Comparative Study Based on Nighttime Light Data. J. Geogr. Sci. 2017, 27, 533–545. [Google Scholar] [CrossRef]
  65. Li, X.; Zhou, Y. Urban Mapping Using DMSP/OLS Stable Night-Time Light: A Review. Int. J. Remote Sens. 2017, 38, 6030–6046. [Google Scholar] [CrossRef]
  66. Zhao, J.; Ji, G.; Yue, Y.; Lai, Z.; Chen, Y.; Yang, D.; Yang, X.; Wang, Z. Spatio-Temporal Dynamics of Urban Residential CO2 Emissions and Their Driving Forces in China Using the Integrated Two Nighttime Light Datasets. Appl. Energy 2019, 235, 612–624. [Google Scholar] [CrossRef]
  67. Cantor, G. Ueber eine elementare Frage der Mannigfaltigketislehre. Jahresber. Dtsch. Math. Ver. 1890, 1, 72–78. [Google Scholar]
  68. Zadeh, L. Fuzzy Sets. Inf. Control. 1965, 8, 338–353. [Google Scholar] [CrossRef]
  69. Zimmermann, H.J. Fuzzy Set Theory. Wiley Interdiscip. Rev. Comput. Stat. 2010, 2, 317–332. [Google Scholar] [CrossRef]
  70. Piegat, A. Fuzzy Modeling and Control: With 96 Tables. In Studies in Fuzziness and Soft Computing; Physica-Verl: Heidelberg, Germany, 2001; ISBN 978-3-7908-1385-2. [Google Scholar]
  71. Biłozor, A.; Cieślak, I.; Czyza, S. An Analysis of Urbanisation Dynamics with the Use of the Fuzzy Set Theory-A Case Study of the City of Olsztyn. Remote Sens. 2020, 12, 1784. [Google Scholar] [CrossRef]
  72. Cieślak, I.; Górecka, K. An Evaluation of Urbanisation Processes in Suburban Zones Using Land-Cover Data and Fuzzy Set Theory. Bull. Geogr. Socio. Econ. Ser. 2021, 54, 49–62. [Google Scholar] [CrossRef]
  73. Davis, J.S.; Nelson, A.C.; Dueker, K.J. The New’ Burbs the Exurbs and Their Implications for Planning Policy. J. Am. Plan. Assoc. 1994, 60, 45–59. [Google Scholar] [CrossRef]
  74. Peng, J.; Hu, Y.; Liu, Y.; Ma, J.; Zhao, S. A New Approach for Urban-Rural Fringe Identification: Integrating Impervious Surface Area and Spatial Continuous Wavelet Transform. Landsc. Urban Plan. 2018, 175, 72–79. [Google Scholar] [CrossRef]
  75. Cieślak, I. Identification of Areas Exposed to Land Use Conflict with the Use of Multiple-Criteria Decision-Making Methods. Land Use Policy 2019, 89, 104225. [Google Scholar] [CrossRef]
  76. Gottero, E.; Larcher, F.; Cassatella, C. Defining and Regulating Peri-Urban Areas through a Landscape Planning Approach: The Case Study of Turin Metropolitan Area (Italy). Land 2023, 12, 217. [Google Scholar] [CrossRef]
  77. Biłozor, A.; Cieślak, I.; Czyża, S.; Szuniewicz, K.; Bajerowski, T. Land-Use Change Dynamics in Areas Subjected to Direct Urbanization Pressure: A Case Study of the City of Olsztyn. Sustainability 2024, 16, 2923. [Google Scholar] [CrossRef]
  78. Łachwa, A. Rozmyty Świat Zbiorów, Liczb, Relacji, Faktów, Reguł i Decyzji; Akademicka Oficyna Wydawnicza EXIT: Warsaw, Poland, 2001; ISBN 978-83-87674-21-2. [Google Scholar]
  79. Hall, L.O.; Szabo, S.; Kandel, A. On the Derivation of Memberships for Fuzzy Sets in Expert Systems. Inf. Sci. 1986, 40, 39–52. [Google Scholar] [CrossRef]
  80. Cieślak, M.; Smoluk, A. Zbiory Rozmyte; Rozpoznawanie Obrazów; Teoria Katastrof: Wybór Tekstów. 1988. Available online: http://www.bb.wz.uw.edu.pl/index.php?KatID=1&typ=record&001=vtls000025485 (accessed on 29 August 2024).
  81. Hoogerbrugge, M.; Burger, M. Selective Migration and Urban–Rural Differences in Subjective Well-Being: Evidence from the United Kingdom. Urban Stud. 2022, 59, 2092–2109. [Google Scholar] [CrossRef]
  82. Isaia, M.; Siniscalco, C.; Badino, G. From Rural to Urban: Landscape Changes in North-West Italy over Two Centuries. Landsc. Hist. 2014, 35, 73–76. [Google Scholar] [CrossRef]
  83. Bieda, A. Increase in the Number of Submitted Maps for Design Purposes as a Determinant of Proper Spatial Planning Policy. J. Water Land Dev. 2017, 34, 65–75. [Google Scholar] [CrossRef]
  84. Computing Archaeology for Understanding the Past—CAA 2000: Computer Applications and Quantitative Methods in Archaeology: Proceedings of the 28th Conference, Ljubljana, Slovenia, April 2000; Stancic, Z.; Veljanovski, T. (Eds.) University of Michigan Press: Ann Arbor, MI, USA, 2001; ISBN 978-1-84171-225-3. [Google Scholar]
  85. Linder, W. Digital Photogrammetry; Springer: Berlin/Heidelberg, Germany, 2016; ISBN 978-3-662-50462-8. [Google Scholar]
  86. Tiwari, V.; Kumar, A.; Mukherjee, M. GIS and AHP-Based Groundwater Recharge Potential Zones in Urban Region: A Study of Ajmer City, Rajasthan, India. In Urban Climate; Elsevier: Amsterdam, The Netherlands, 2024; Volume 54, p. 101840. ISSN 2212-0955. [Google Scholar] [CrossRef]
  87. Hu, S.; Tong, L.; Frazier, A.E.; Liu, Y. Urban Boundary Extraction and Sprawl Analysis Using Landsat Images: A Case Study in Wuhan, China. In Habitat International; Elsevier: Amsterdam, The Netherlands, 2015; Volume 47, pp. 183–195. ISSN 0197-3975. [Google Scholar] [CrossRef]
  88. Cieślak, I.; Czyża, S.; Szuniewicz, K.; Ogrodniczak, M. Assessment of Residential Areas of City on the Example of Olsztyn. IOP Conf. Ser. Mater. Sci. Eng. 2019, 471, 102001. [Google Scholar] [CrossRef]
  89. Lisini, G.; Salentinig, A.; Du, P.; Gamba, P. SAR-Based Urban Extents Extraction: From ENVISAT to Sentinel-1. IEEE J. Sel. Top. Appl. Earth Obs. Remote Sens. 2018, 11, 2683–2691. [Google Scholar] [CrossRef]
  90. Zhang, M.; Chen, F.; Tian, B.; Liang, D. Multi-Temporal SAR Image Classification of Coastal Plain Wetlands Using a New Feature Selection Method and Random Forests. Remote Sens. Lett. 2019, 10, 312–321. [Google Scholar] [CrossRef]
Figure 1. Location of the study area.
Sustainability 16 09490 g001
Figure 2. The study area divided into hexagonal fields.
Sustainability 16 09490 g002
Figure 3. Urban—rural transition zone methodology.
Sustainability 16 09490 g003
Figure 4. Models of urban and rural land use functions within the study area, displaying membership values in the range of [0.50–1.00] for: (a) 2005, (b) 2010, (c) 2017, and (d) 2022.
Sustainability 16 09490 g004
Figure 5. The boundaries between rural and urban areas defined by a membership degree of 0.5 in: (a) 2005, (b) 2010, (c) 2017, (d) 2022. Red line—urban–rural boundary; black line—administrative boundaries of Olsztyn city.
Sustainability 16 09490 g005
Figure 6. Identification of urban and rural functions within the study area using the membership range [0.5, 1.0], along with the spatial extent of the transition zone defined by the membership range [0.30, 0.50] for the years: (a) 2005, (b) 2010, (c) 2017, (d) 2022.
Sustainability 16 09490 g006
Figure 7. Determination of rural and urban functions based on the membership range [0.5, 1.0], along with the spatial extent of the transition zone defined by the membership range [0.35, 0.50] in: (a) 2005, (b) 2010, (c) 2017, and (d) 2022.
Sustainability 16 09490 g007
Figure 8. Determination of rural and urban functions based on the membership range [0.5, 1.0], along with the spatial extent of the transition zone defined by the membership range [0.40, 0.50] in: (a) 2005, (b) 2010, (c) 2017, and (d) 2022.
Sustainability 16 09490 g008
Figure 9. Determination of rural and urban functions based on the membership range [0.5, 1.0], along with the spatial extent of the transition zone defined by the membership range [0.45, 0.50] in: (a) 2005, (b) 2010, (c) 2017, and (d) 2022.
Sustainability 16 09490 g009
Figure 10. Urban development in the southern part of the study area in: (a) 2005, (b) 2010, (c) 2017, and (d) 2022.
Sustainability 16 09490 g010
Figure 11. The boundary between rural and urban areas is characterized by a degree of membership of 0.5 in 2005, 2010, 2017, and 2022.
Sustainability 16 09490 g011
Figure 12. Boundary between urban and rural areas with a degree of membership of 0.5 in 2005, 2010, 2017, and 2022: (a) southern part of the study area, (b) Gutkowo—north-western part of the study area, (c) north-eastern part of the study area.
Sustainability 16 09490 g012
Figure 13. Verification of transition zone between rural and urban areas defined by a membership degree of 0.5 in: (a) 2005, (b) 2010, (c) 2017, and (d) 2022.
Sustainability 16 09490 g013
Figure 14. Validation of transition zone between rural and urban areas defined by a membership degree of 0.5, utilizing Anselin Local Moran’s I analysis for the years: (a) 2005, (b) 2010, (c) 2017, and (d) 2022.
Sustainability 16 09490 g014
Table 1. The level of membership within a set of urban functions in the interval [0, 1].
NoLand-Use TypesDegree of Alignment with Urban Functions
1Single-family homes0.69
2Multi-family housing1.00
3Services 0.92
4Sports and recreational areas0.66
5Commercial facilities with a sales area larger than 2000 m2 0.90
6Agricultural land 0.09
7Orchards and horticulture farms0.26
8Auxiliary services for farms, breeding centres, horticulture farms, forests, and fish farms0.10
9Farmstead buildings in crop, livestock, and horticulture farms 0.16
10Industrial plants and warehouses0.97
11Mining areas0.34
12Forests0.20
13Organized green spaces 0.68
14Natural (unorganized) green spaces0.35
15Gardens 0.45
16Cemeteries0.51
17Marine surface waters0.20
18Inland surface waters 0.20
19Public roads0.82
20Internal roads0.80
21Water transport routes0.52
22Technical infrastructure0.66
23Special areas—military, police0.76
24Construction sites0.64
Table 2. Area of the transition zone in each year of the analysed period based on the number of fields.
0.30–0.50
Fields/Area (ha)
0.35–0.50
Fields/Area (ha)
0.40–0.50
Fields/Area (ha)
0.45–0.50
Fields/Area (ha)
200523446801693380100200045900
20102344680164328088176044880
201725350601853700991980501000
2022271542019739401092180511020
Disclaimer/Publisher’s Note: The statements, opinions and data contained in all publications are solely those of the individual author(s) and contributor(s) and not of MDPI and/or the editor(s). MDPI and/or the editor(s) disclaim responsibility for any injury to people or property resulting from any ideas, methods, instructions or products referred to in the content.

