Abstract
The depth and width of drip infiltration play a critical role in designing effective irrigation strategies. However, existing models primarily focus on continuous irrigation and fail to predict wetting patterns under intermittent drip irrigation. This study developed an infiltration model to estimate soil moisture depth and width under intermittent drip irrigation and identified strategies that enhance effective water storage. Indoor soil box simulations were conducted, with continuous drip irrigation as the control. Results showed that intermittent irrigation increased infiltration width and reduced depth, maximizing water storage efficiency. We recommend adopting an intermittent irrigation system with 1.5 h of irrigation followed by a 0.5 h interval, repeated four times. This system increased effective water storage by up to 16.23% compared to continuous irrigation. The proposed method is suitable for sandy loam farmland in southern Xinjiang and can significantly improve water use efficiency in arid regions.
1. Introduction
Agriculture uses 70–80% of the total water used, with irrigation accounting for over 72% of all freshwater withdrawals worldwide, according to the Food and Agriculture Organization (FAO). This percentage can reach up to 80% in some areas, depending on the climate and agricultural methods used [1]. Because drip irrigation has the benefits of conserving water, boosting productivity, lowering evaporation, and inhibiting the growth of weeds, it is seen as a mandatory alternative in dry and semi-arid areas where water is scarce. The efficient utilization of water resources in agricultural irrigation has become a key issue in achieving sustainable agricultural development. Sustainable irrigation is an environmentally friendly way to irrigate plants in landscapes and agriculture that promotes crop output, labor and energy savings, and climate change adaptability. Globally, with the water scarcity era, the goal is to eradicate hunger. In line with the Sustainable Development Goals, investments in irrigation must be balanced by advancements in water governance to ensure equitable access and environmental sustainability [2].
Traditional irrigation methods are less suitable for intermittent drip irrigation and affect water storage by changing soil-wetting processes and reducing vertical infiltration depth. Understanding water movement and storage during these periods is crucial for improving agricultural productivity. Intermittent irrigation technology can optimize soil moisture distribution by accurately controlling the irrigation cycle and periods, improving water use efficiency, and refining agricultural water resource management. Research on intermittent drip irrigation systems in water-scarce areas primarily focuses on continuous systems, as models predicting soil wetting patterns under continuous drip irrigation do not accurately reflect the dynamic nature of soil moisture distribution, limiting farmers’ and agricultural water managers’ ability to optimize irrigation schedules and maximize efficient water storage [3,4,5,6,7,8,9]. As the most advanced water-saving irrigation technology, no doubt specific to soil type, terrain, and crop, drip irrigation can maximize the efficiency of irrigation water and has been widely promoted and applied in Xinjiang [5,6,7]. However, the efficient operation of the drip irrigation system needs to be coordinated with soil and plant parameters, such as soil type, soil texture, crop root depth, etc. [8,10], To determine a reasonable drip irrigation system. Several researchers, like Rubio et al., 2022 and Wang et al., 2024, believe that wetting depth and width are important parameters for soil moisture distribution in drip irrigation systems. These are the main indicators reflecting soil moisture content, water evaporation, and percolation and are an important basis for determining the irrigation soil moisture ratio [11,12]. The wetting width and the effective water storage capacity in the soil’s moist soil body are related to the planned wetting layer depth of the crop root zone, dripper flow rate, irrigation volume, irrigation interval time, and irrigation cycle [13,14,15].
However, when formulating a drip irrigation system that adapts to different soil types, textures, dripper flow rates, and irrigation schemes, the traditional on-site field experiment method to analyze the shape and moisture distribution of drip irrigation soil moisture bodies faces the difficulties of visualization, high cost, and time consumption challenges [16,17]. Simulation methods based on physical models are of prime importance, cost-effective, and efficient in determining the characteristics of pressurized irrigated soil environments [18,19]. In previous scientific research, researchers in the field of irrigation have developed various models to simulate and predict soil moisture patterns and moisture distribution characteristics under drip irrigation conditions. These methods mainly include analytical models, numerical models, empirical models, and mathematical models [20,21,22,23,24]. Analytical models rely on numerous assumptions, while numerical and mathematical models require a lot of calculations and are computationally expensive. Empirical models only require a smaller number of input parameters to develop more accurate and timely solutions. Empirical solutions, when combined with the robustness of dimensional analysis, could employ simple and easy-to-use models for applied problems.
The Buckingham π-Theorem has been widely used in many fields, including agricultural irrigation, where it helps simplify complex hydraulic models. Recent studies, such as those by Solat et al. [25] and Kisi et al. [26], have demonstrated the utility of dimensional analysis in predicting wetting patterns and optimizing moisture distribution under drip irrigation systems. Additionally, Najib et al. [27], Zamani et al., [28] and Fan et al. [29] have shown that dimensional analysis can improve model accuracy, providing reliable predictions for managing water resources efficiently in agriculture.
A comprehensive model is needed to address water application issues and forecast wetting front motions in sandy loam soils. The model should measure water storage effectiveness in different soil types, climates, and irrigation schedules. Current models lack a comprehensive understanding of soil types, environmental settings, and the relationships between soil texture, water availability, and irrigation intervals, necessitating a complete model to improve water utilization in various environments. Therefore, this study conducted an indoor soil box infiltration simulation test by applying the time-tested Buckingham π-Theorem concept. We introduced the idea of equivalent continuous flow and determined the prediction model for the infiltration depth and width of constant and intermittent drip irrigation systems. Based on the prediction model, the effective water contents in the moist body were integrated by the boundary integral to obtain effective water storage in the moist body. We determined the peak effective soil water storage in the case of an intermittent drip irrigation system to provide a theoretical basis for formulating an intermittent drip irrigation system for sandy loam farmland in the southern Xinjiang province of China.
2. Materials and Methods
This study utilized laboratory-based soil box simulations to examine infiltration dynamics under intermittent and continuous drip irrigation systems. The primary methodology involved applying the Buckingham π-Theorem for dimensional analysis, simplifying complex hydraulic variables into dimensionless groups to model water movement effectively. Soil samples, representative of those from the Tarim Basin, were used to create controlled conditions that mimic the region’s sandy loam soil properties. Key parameters such as dripper flow rate, irrigation intervals, and infiltration time were adjusted to assess their impact on infiltration depth and moisture distribution. This approach allowed us to simulate practical irrigation scenarios within a controlled environment, with findings applicable to optimizing water resource management in similar arid or semi-arid agricultural regions.
The Buckingham π-Theorem is a fundamental approach in fluid dynamics and hydrology that simplifies complex systems by reducing physical variables into dimensionless groups. The Buckingham π-Theorem posits that any physical system can be described by a set of dimensionless parameters derived from the governing variables, thereby minimizing the number of variables needed to model complex interactions effectively [30].
2.1. Study Area
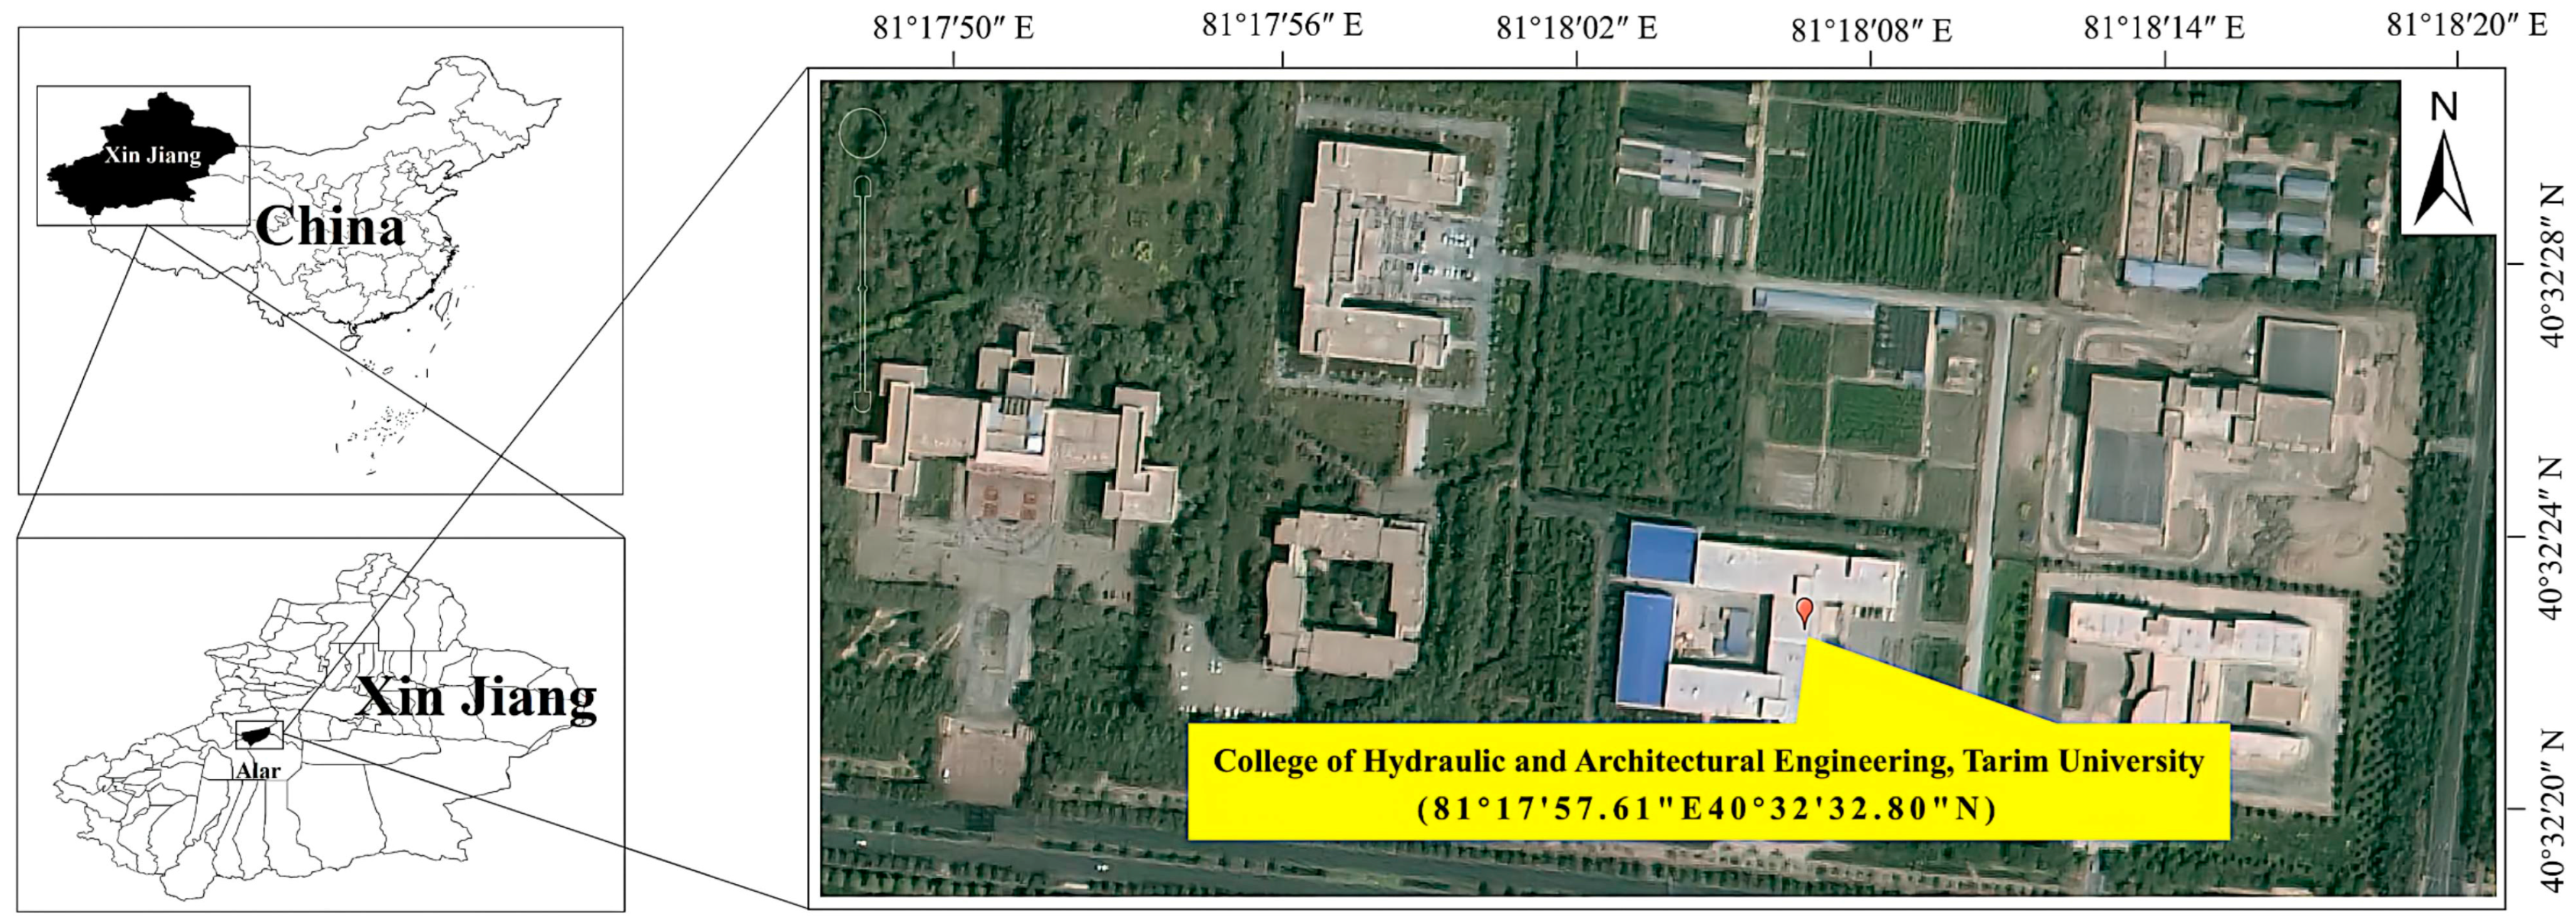
The study area is located at the College of Hydraulic and Architectural Engineering, Tarim University, which is situated in the Alar Reclamation District of the southern Xinjiang Uyghur Autonomous Region, China. The geographical coordinates of the study site are 81°17′57.61″ E and 40°32′32.80″ N. The region is part of the Tarim Basin, known for its unique hydrological characteristics and arid climate conditions. The university’s location is marked on the map in Figure 1, showing its central position within the irrigation experimental area of the Tarim University campus. The altitude ranges from 1012 m to 1028 m. The average annual precipitation varies from 40.1 mm to 82.5 mm, with precipitation being rare and unevenly distributed, primarily concentrated between May and September. The average annual evaporation rates are significantly higher, ranging from 1876.6 mm to 2558.9 mm, indicating that evaporation greatly exceeds precipitation. The average annual temperature is 10.8 °C, with July temperatures averaging between 22.4 °C and 26.2 °C and January temperatures averaging between −11.5 °C and −8.4 °C. The average annual sunshine duration is between 2556.3 and 2991.8 h, with a daily illumination rate of 58.69%, peaking in summer and reaching its lowest point in winter [31].
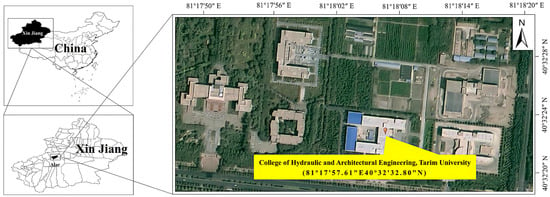
Figure 1.
Geographical Location of the Study Area.
2.2. Soil Characteristics
The test soil was taken from the cotton field in the Tarim Irrigation Area in the Alar Reclamation District of southern Xinjiang. The soil sampling depth is 0~20 cm, the soil bulk density is 1.35 g·cm−3, and the conductivity of the soil solution with an initial soil-to-water ratio of 1:5 is 2010 μS·cm−1. According to the conversion relationship between soil total salt content (S) and EC1:5, S (g·kg−1) = 0.00315EC1:5 (μS·cm−1) + 0.37713. The soil is severely saline [32]. After the soil was air-dried and passed through a 2 mm soil sieve, it was set aside. The particle size of the test soil sample is 0.01~2 μm, accounting for 3.86%; >2~50 μm accounts for 28.45%; >50~2000 μm accounts for 67.69%. According to the international soil texture classification standard, it is sandy loam, and the field water holding capacity is 23%.
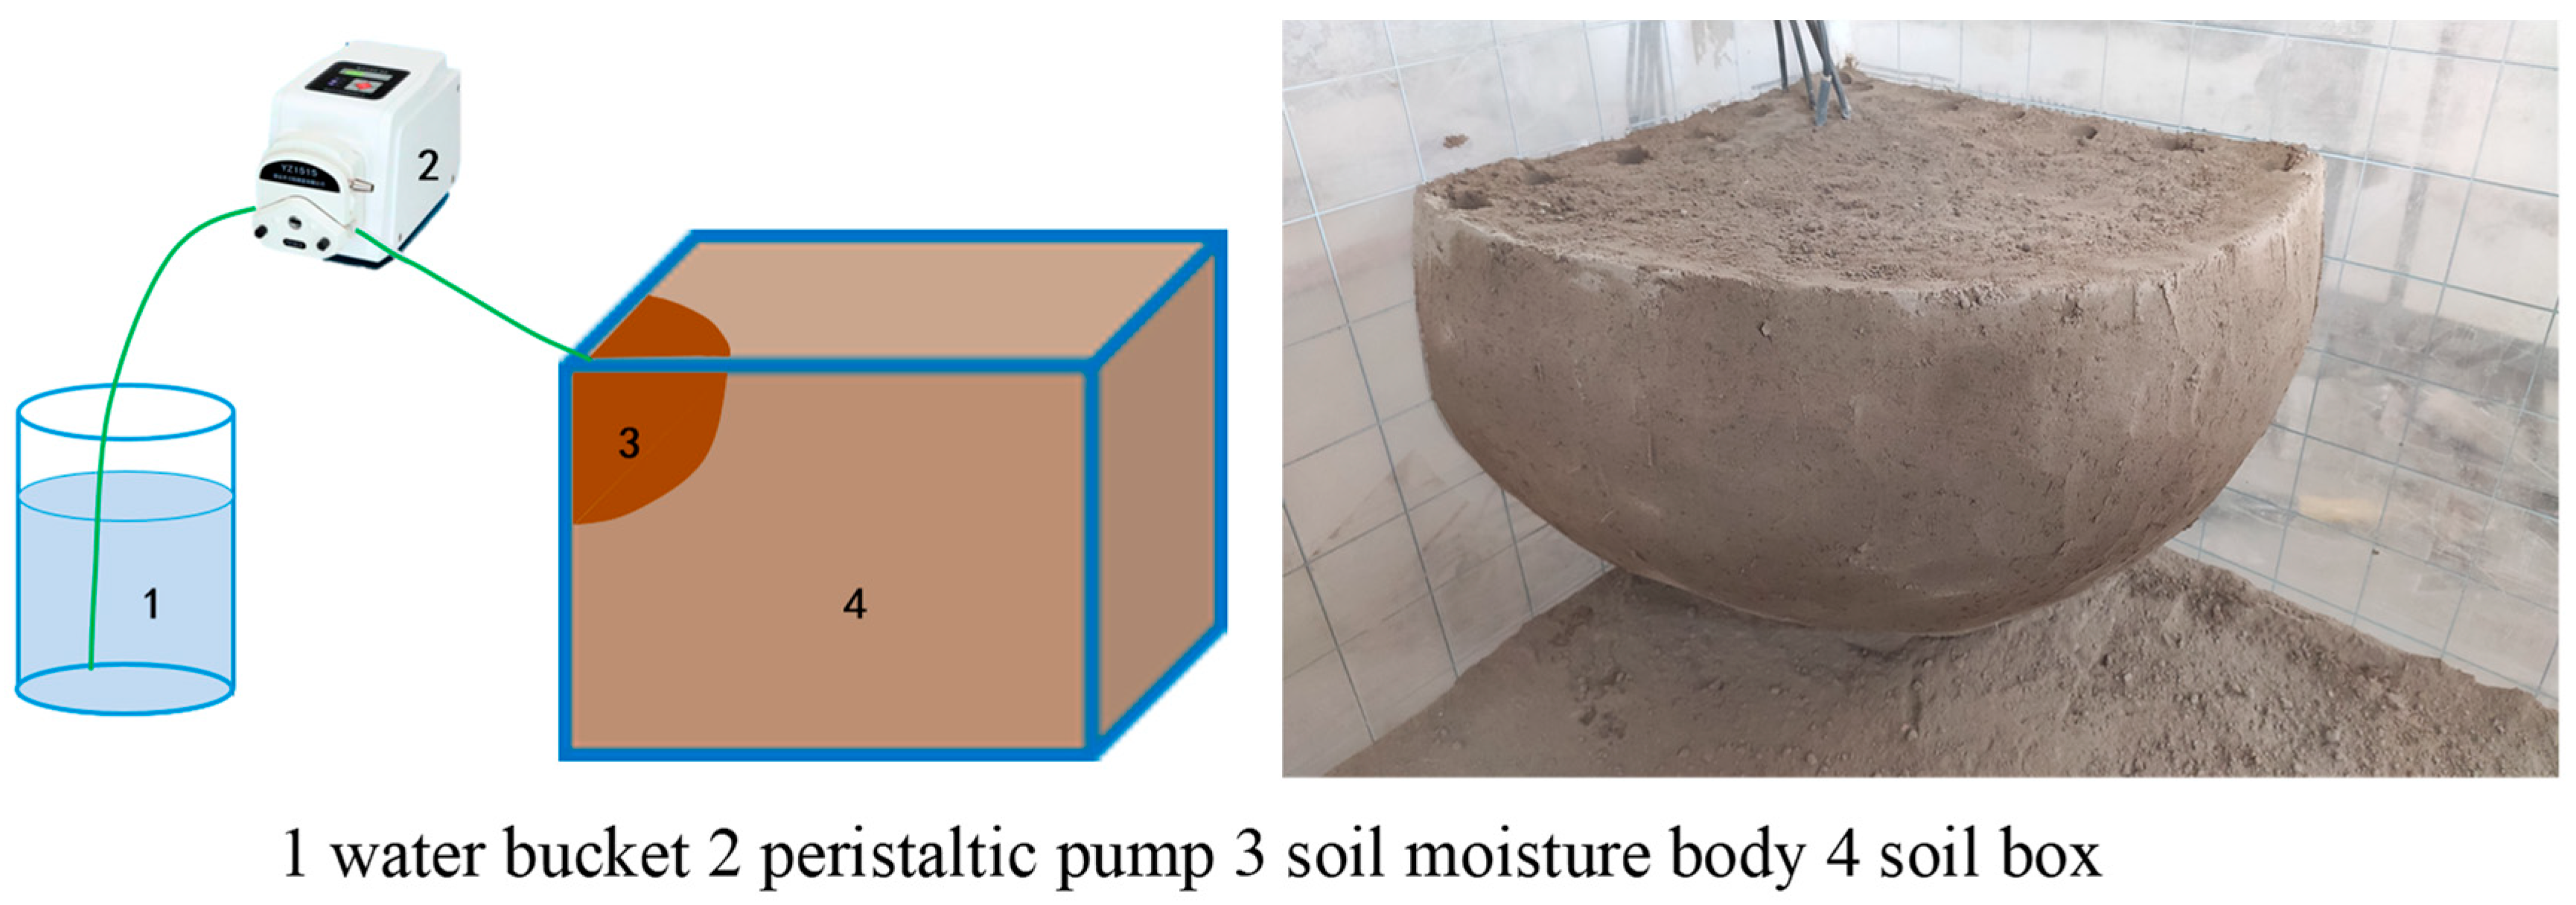
The test device includes a BT100-02 constant flow pump, a bucket, and a 10 mm thick acrylic plate cubic earth box. The length, width, and height of the earth box are all 60 cm. The sieved air-dried soil was divided into layers of 5 cm and filled into the soil box in layers with the original bulk density of 1.35 g·cm−3. The layers were roughened, and the soil filling depth was 50 cm. After leaving it for 48 h, the drip irrigation test was started. Irrigation water was taken from the Tenth Regiment alkali drainage canal in the Tarim Irrigation Area of Alar Reclamation District in southern Xinjiang. The salinity of the drainage water was determined to be 3 g·L−1 by the “residue method.” During the test, one end of the BT100-02 constant flow pump was connected to a bucket for water supply, and the other end was connected to an infusion needle to simulate dripping water from a dripper. An electronic scale with a sensitivity of 0.01 g was used to determine the flow rate of the dripper. The soil box test simulated and analyzed the conditions of continuous drip irrigation and intermittent drip irrigation. The dripper flow rate is 1/4 of the soil moisture content. The dripper flow rate is based on the standard that no surface runoff is generated. Take 1/4 of the dripper flow rate of 2.4 L·h−1 and set the dripper constant flow rate to 0.6 L·h−1 (10 cm3·min−1). The dripper is fixed at a 90° position in one corner of the soil box. To prevent the evaporation of surface soil water during the test process, the surface of the soil box was covered with a plastic film. The schematic diagram of the test device and the schematic diagram of the soil moisture body after redistribution 24 h after the completion of irrigation are shown in Figure 2.
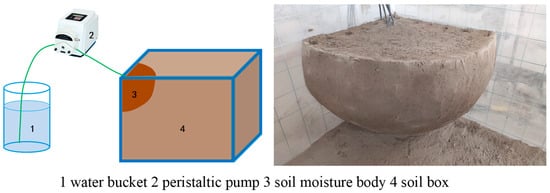
Figure 2.
Diagram of drip irrigation device and soil moisture body after redistribution.
2.3. Experimental Design
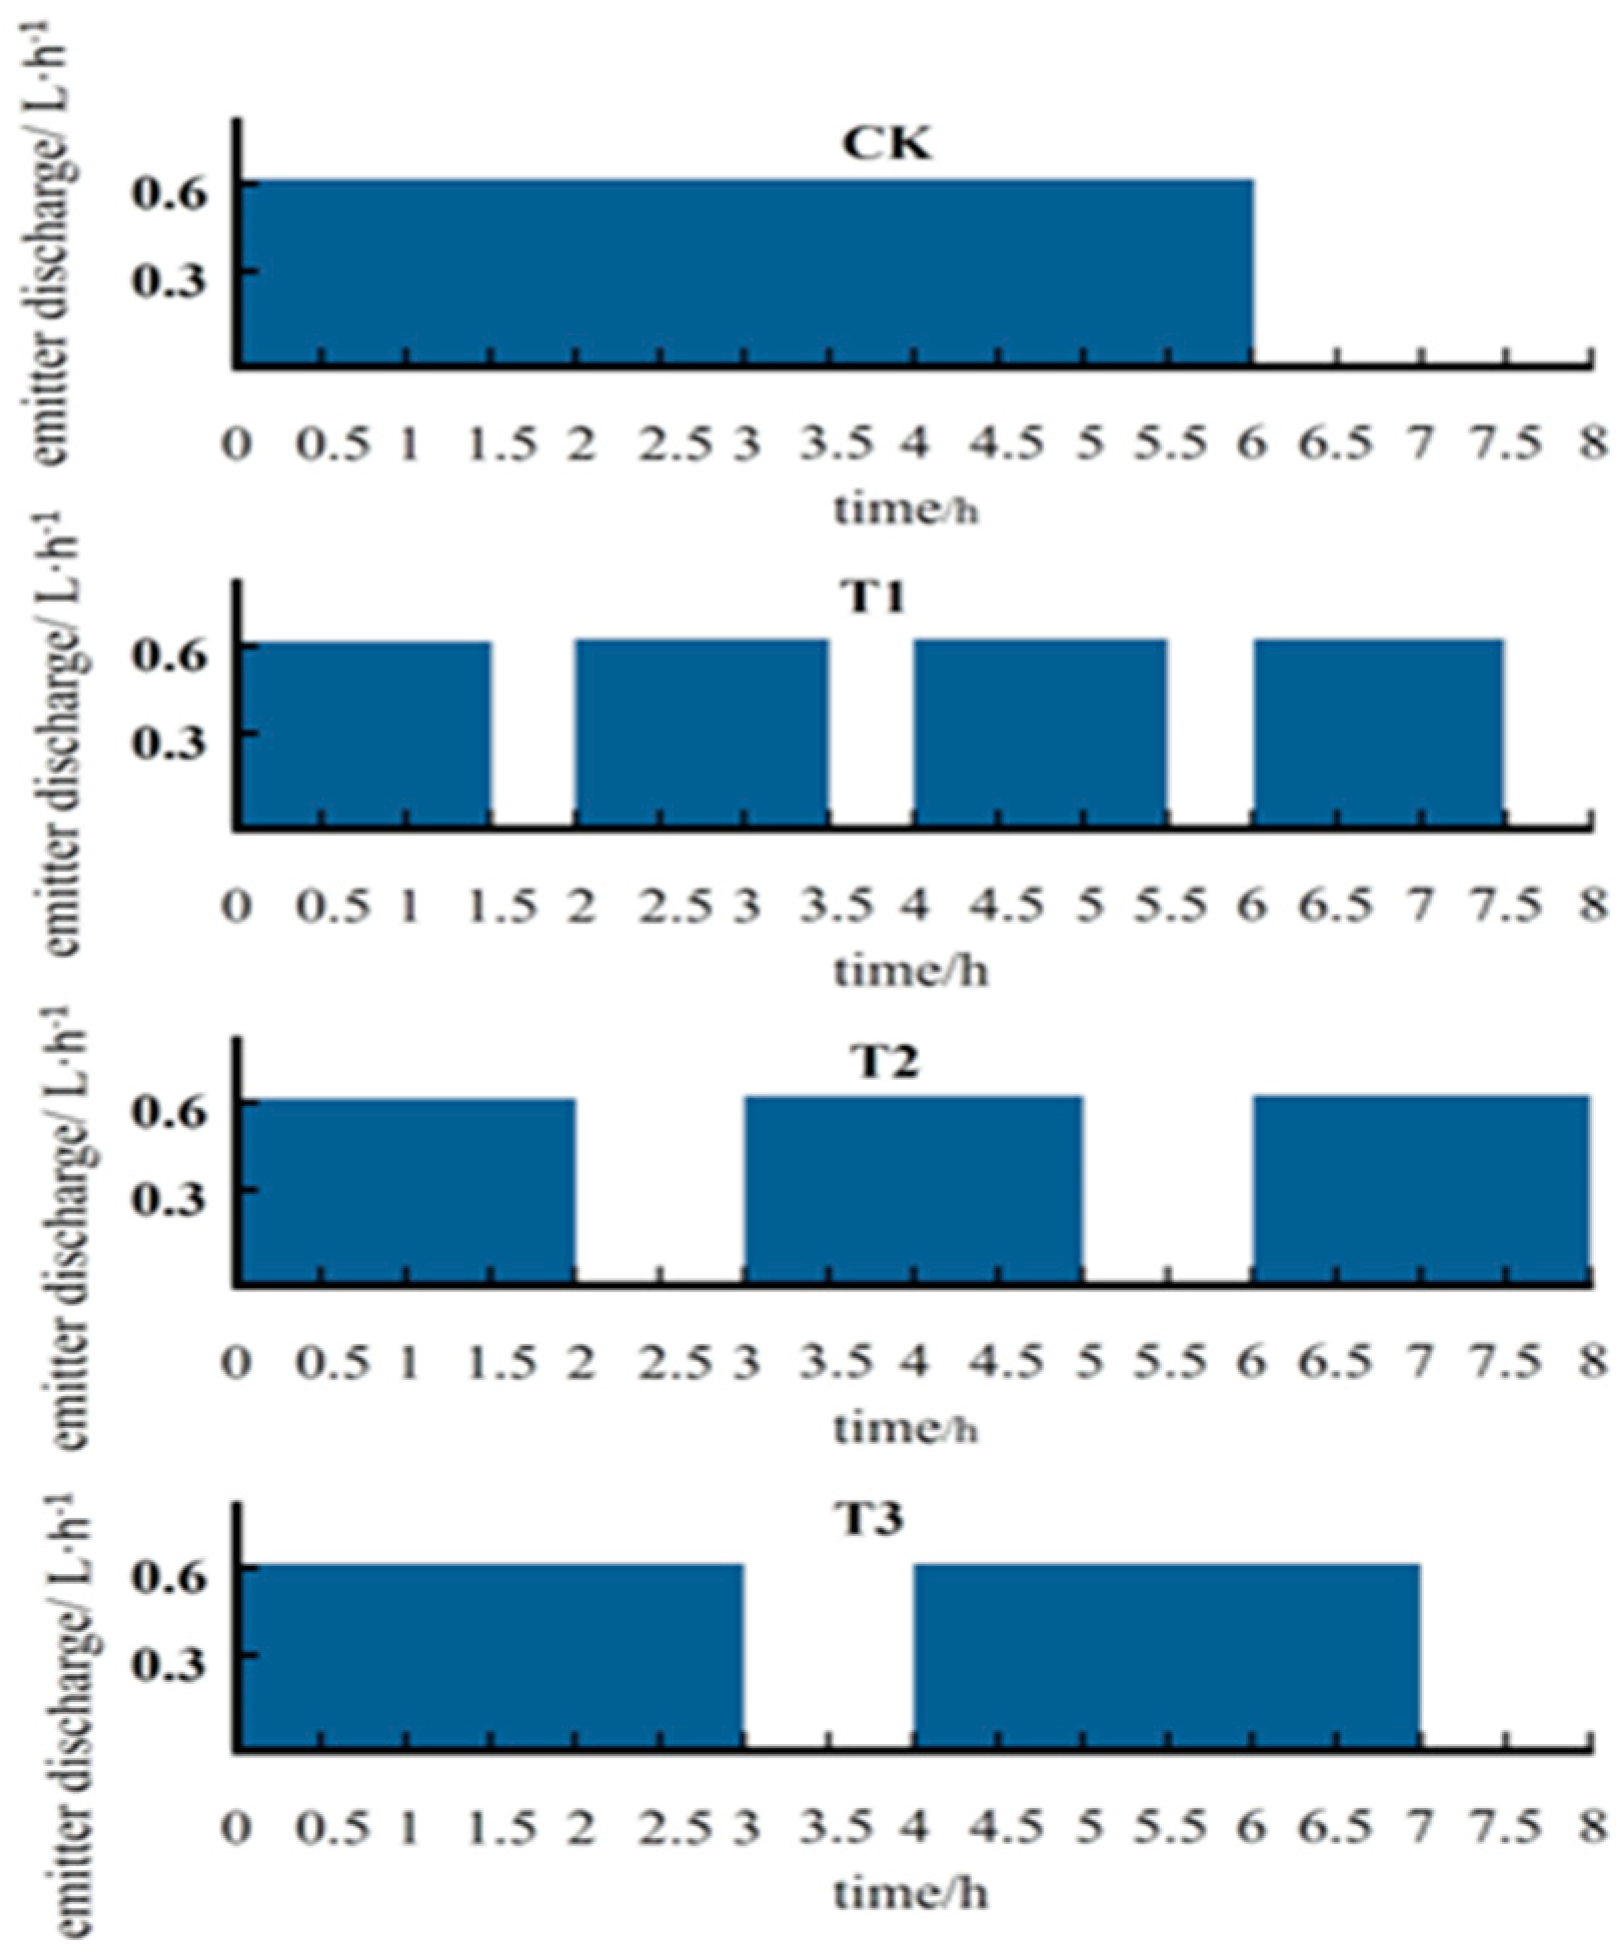
According to the definition of intermittent irrigation [33,34], a process of alternating water supply and stoppage is considered a single irrigation cycle. The number of times water is supplied and stopped to complete the entire process of intermittent irrigation represents the number of cycles, while the ratio of water supply time to cycle time is defined as the cycling rate. Based on references [3,4], continuous irrigation is set as the control treatment, with a total water supply time of 6 h.
For treatment T1, the number of cycles is 4, with a water supply time of 1.5 h per cycle (for comparison with treatment T2’s water supply time of 2 h per cycle) and an intermittent time of 0.5 h, resulting in a cycling rate of 3/4. For treatment T2, the number of cycles is 3, with a water supply time of 2 h per cycle (for comparison with treatment T3’s water supply time of 3 h per cycle) and an intermittent time of 1 h, resulting in a cycling rate of 2/3. For treatment T3, the number of cycles is 2, with a water supply time of 3 h per cycle (for comparison with treatment T1’s cycling rate) and an intermittent time of 1 h, resulting in a cycling rate of 3/4.
By adjusting the number of cycles, water supply time, and intermittent time, the aim is to study the impact of different intermittent irrigation systems on the soil moisture wetting front and the effective water storage in the wetted volume. The irrigation system for each treatment is shown in Figure 3.
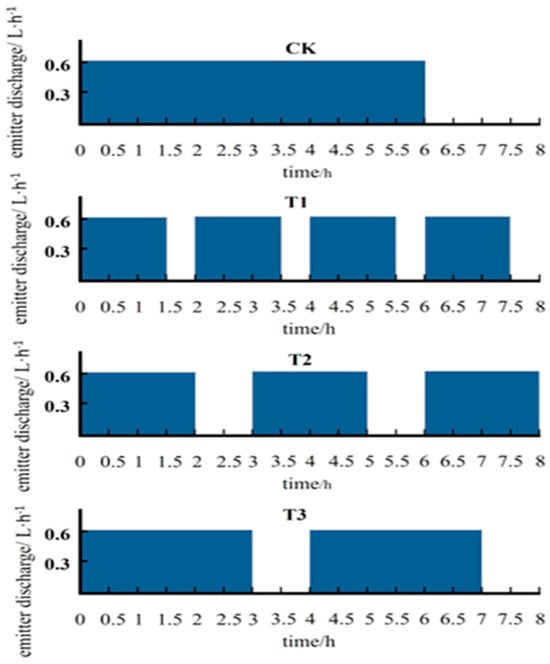
Figure 3.
Schematic diagram of different irrigation regimes.
2.4. Measurements and Methods
2.4.1. Soil Moisture Front
We placed a hard, transparent PE plastic film around the soil box. Using a marker, draw the soil moisture front curve on the hard, transparent PE plastic film according to the principle of first sparse and then denser during the infiltration time. A ruler was used to read the soil moisture front curve at different times during infiltration. The penetration depth and width of the infiltrated water were recorded in MS Excel (version 2016, Microsoft Corporation, Redmond, WA, USA) as tabulated data.
2.4.2. Soil Moisture
Twenty-four hours after the redistribution of the intermittent drip irrigation cycle, a soil auger is used to pick up soil from the moist body at 5 cm in the depth direction and 5 cm in the horizontal direction from the dripper until the initially dry soil is obtained. The drying method was used to determine the soil mass moisture content in the wet bodies.
2.4.3. Soil-Saturated Hydraulic Conductivity
The undisturbed soil samples were taken with a ring knife and soaked in the laboratory for 24 h to make them saturated, and then we placed an empty ring knife on it. The interface is sealed and fixed with wax and rubber ring to avoid water leakage and then placed on the funnel. We slowly added water to the empty ring knife above the soil ring knife to the edge of the ring knife. After the water head stabilized, we measured the time for the beaker to be placed under the funnel. At this stage, the water started trickling down, and we measured the outlet water flow every 5 min. The mathematical formula of saturated hydraulic conductivity is in Equation (1) [35]:
In the formula, is the saturated hydraulic conductivity, cm·min−1, is the n-th seepage water volume, cm3, is the time interval between each infiltration, min, is the seepage cross-sectional area, cm2, is the thickness of the water layer, cm, and is the thickness of the soil layer, cm. The saturated hydraulic conductivity measured under this test condition is 0.073 cm·min−1.
2.4.4. Validation of Estimation Model
The root mean square error (RMSE), mean relative error (RE), mean absolute error (MAE), percentage deviation (PBIAS), and model effectiveness (EF) are used to evaluate the model estimation effect quantitatively. When the RMSE and MAE are closer to 0, PBIAS < ±10%, and the EF value is closer to 1, it means that the difference between the simulated value and the experimental observation value is smaller, and the agreement between the two is better. The mathematical representations are as follows:
In the formula, is the i-th measured value, is the i-th simulated value, and is the total number of data points.
2.5. Data Processing
The experimental data were organized using Microsoft Office Excel 2017, and the Origin2024 software was used to analyze and fit the power function curve and draw the soil moisture spatial distribution contour map. SPSS 20.0 carried out a single-factor analysis of variance (LSD) to determine the difference in effective water storage in soil moisture bodies in each treatment. The infiltration depth and width of the soil moisture body were estimated using the dimensional-analysis-based Buckingham π –theorem.
3. Results
3.1. Estimating the Depth and Width of Wetted Body Penetration
Dimensional analysis is an important analytical tool in physics, which uses the basic dimensions of physical quantities to analyze the consistency and conservation of physical laws. According to the principle of dimensional consistency, the dimensional information of physical variables is used to determine the relationship between physical variables. The infiltration depth and width of the wet body can be estimated through dimensional analysis. The size of the wet body depends on the dripper flow rate (Q), saturated hydraulic conductivity (Ks), and irrigation time (t). The functional relationship between the penetration depth (H) and penetration width (D) of the wet body is expressed as follows:
In the formula, H is the infiltration depth, cm, D is the infiltration width, cm, Q is the continuous irrigation dripper flow rate, cm3·min−1, Ks is the saturated hydraulic conductivity, cm·min−1, and t is the drip irrigation time, min. The dimensions of each variable are L, L, L3T−1, LT−1, and T, respectively.
In dimensional analysis, dimensionless physical relationships can be established by expressing these physical quantities as products or ratios of basic dimensions and comparing and analyzing them across different unit systems. There are n dependent variables and independent variables in a dimensionally homogeneous equation. If these variables contain m basic dimensions, these variables are arranged into n-m dimensionless terms. These dimensionless terms are called π terms. The variables are infiltration depth (infiltration width), dripper flow rate, soil-saturated hydraulic conductivity, and drip irrigation time. The total number of variables is four, and the basic dimensions are length (L) and time (T). Therefore, the number of π terms is two. Dimensionless terms are constructed by combining variables. Each dimensionless term is a combination of the original variables through multiplication or division. The combined dimension is one (that is, the sum of the dimensional exponents of time and length is zero). CK continuous irrigation is expressed as follows:
The first π term can be composed of the variables penetration depth (H), dripper flow rate (Q), and saturated hydraulic conductivity (Ks) and is expressed as follows:
As dimensionless functions, a1 and b1 are estimated:
Obtaining a1 = ½ and b1 = −1/2, it can be expressed as follows:
The second π term is expressed as follows:
As dimensionless functions, a2 and b2 are estimated:
Obtaining a2 = 3/2 and b2 = −1/2, it can be expressed as follows:
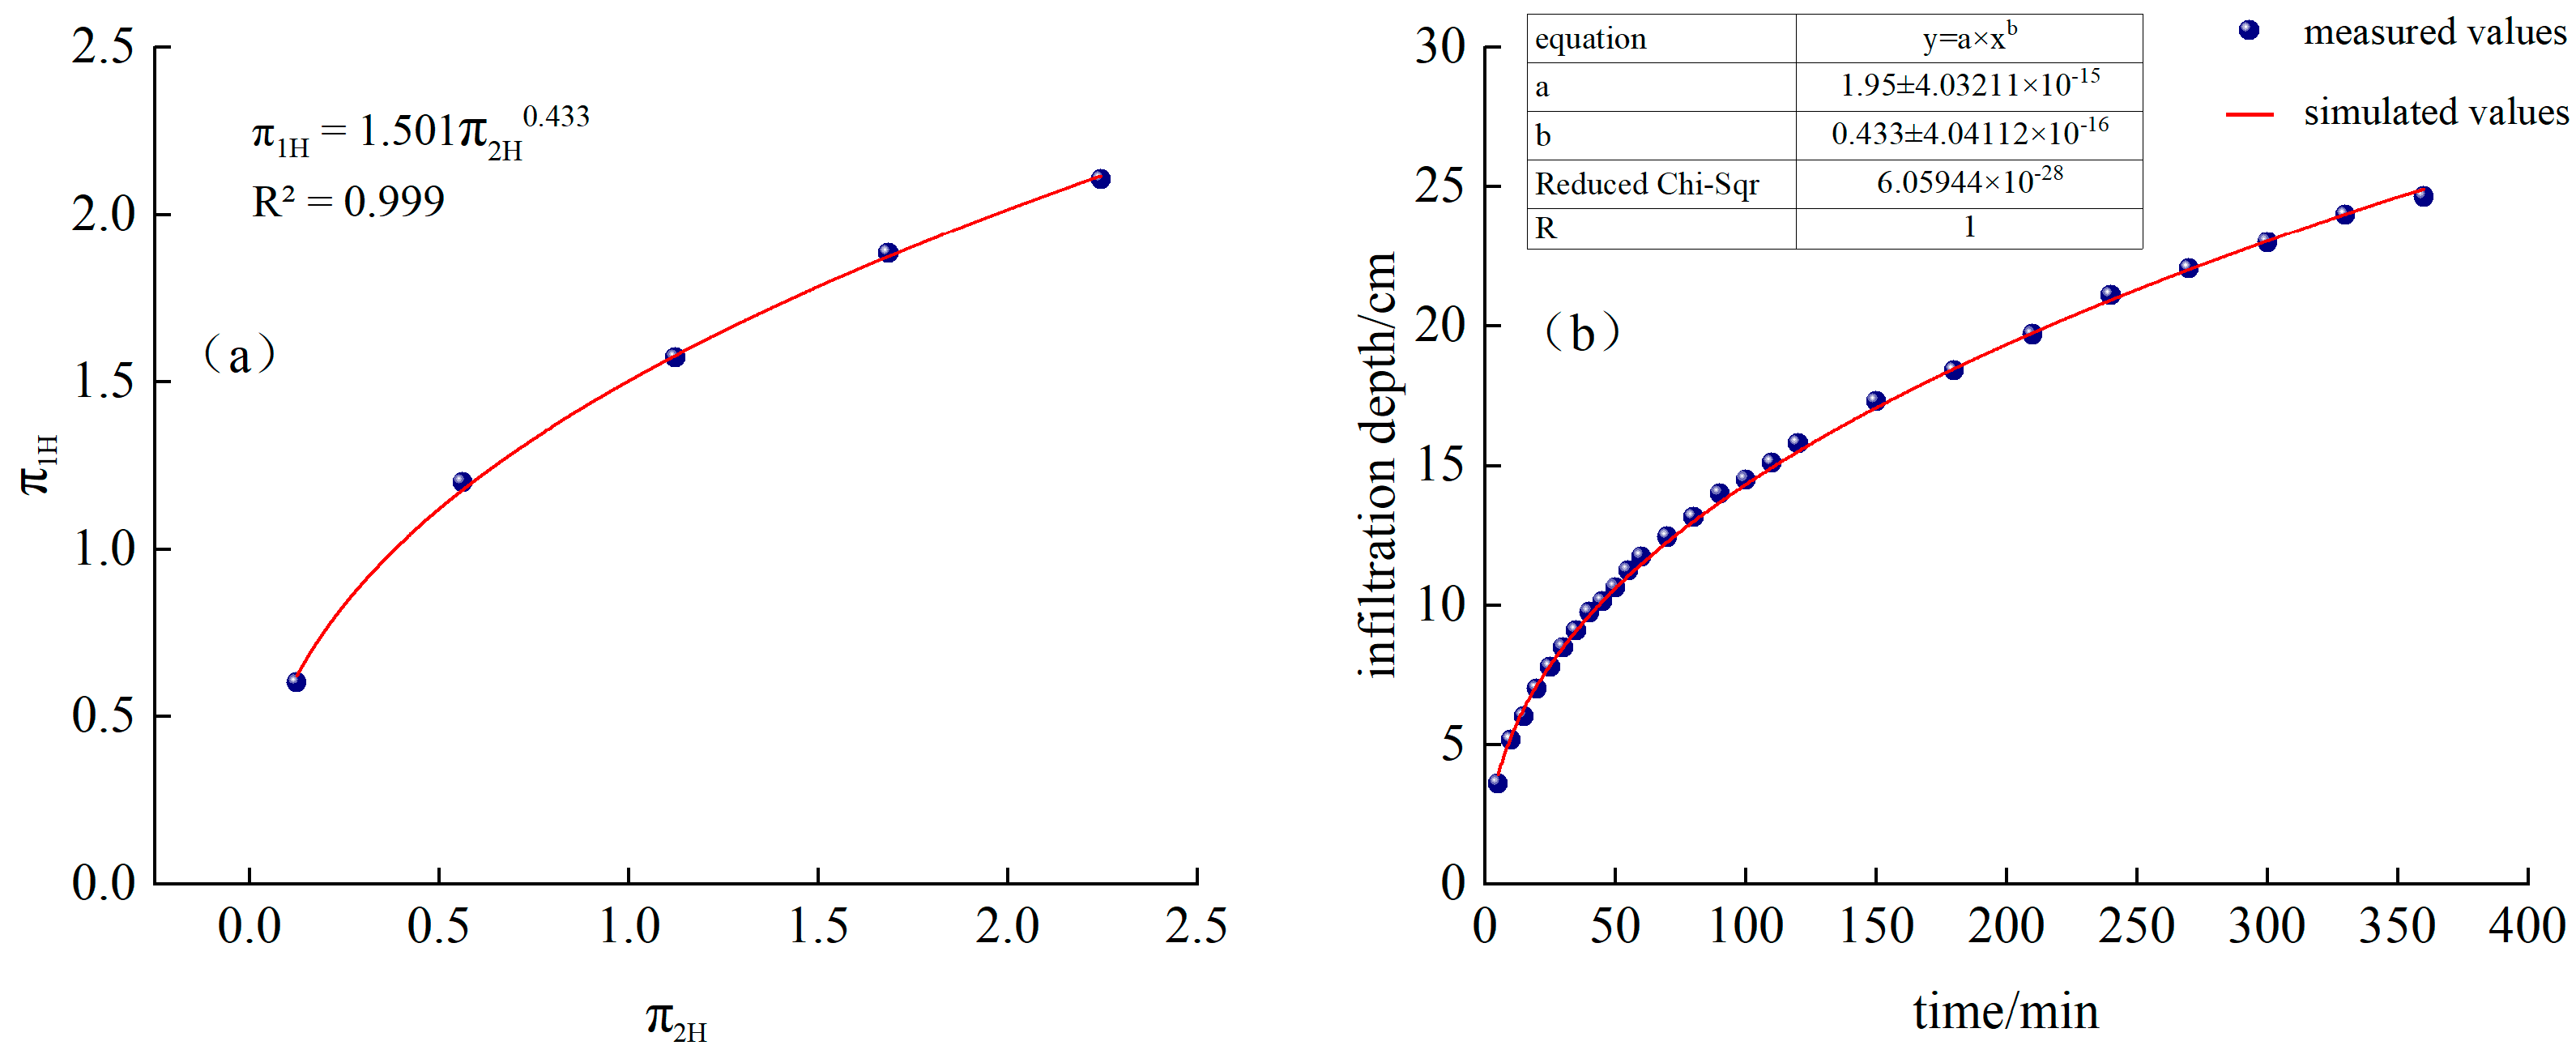
Fitted from the measured data, as shown in Figure 4a, and is a power function relationship:
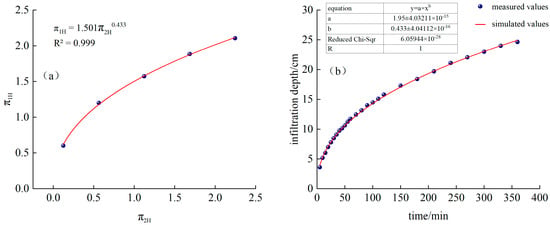
Figure 4.
(a) Continuous irrigation and fitting function, (b) Comparison of simulated and measured values of infiltration depth for continuous irrigation.
Substituting into Equations (11) and (14), we obtain the following:
The time-varying curves of simulated and measured values are shown in Figure 4b.
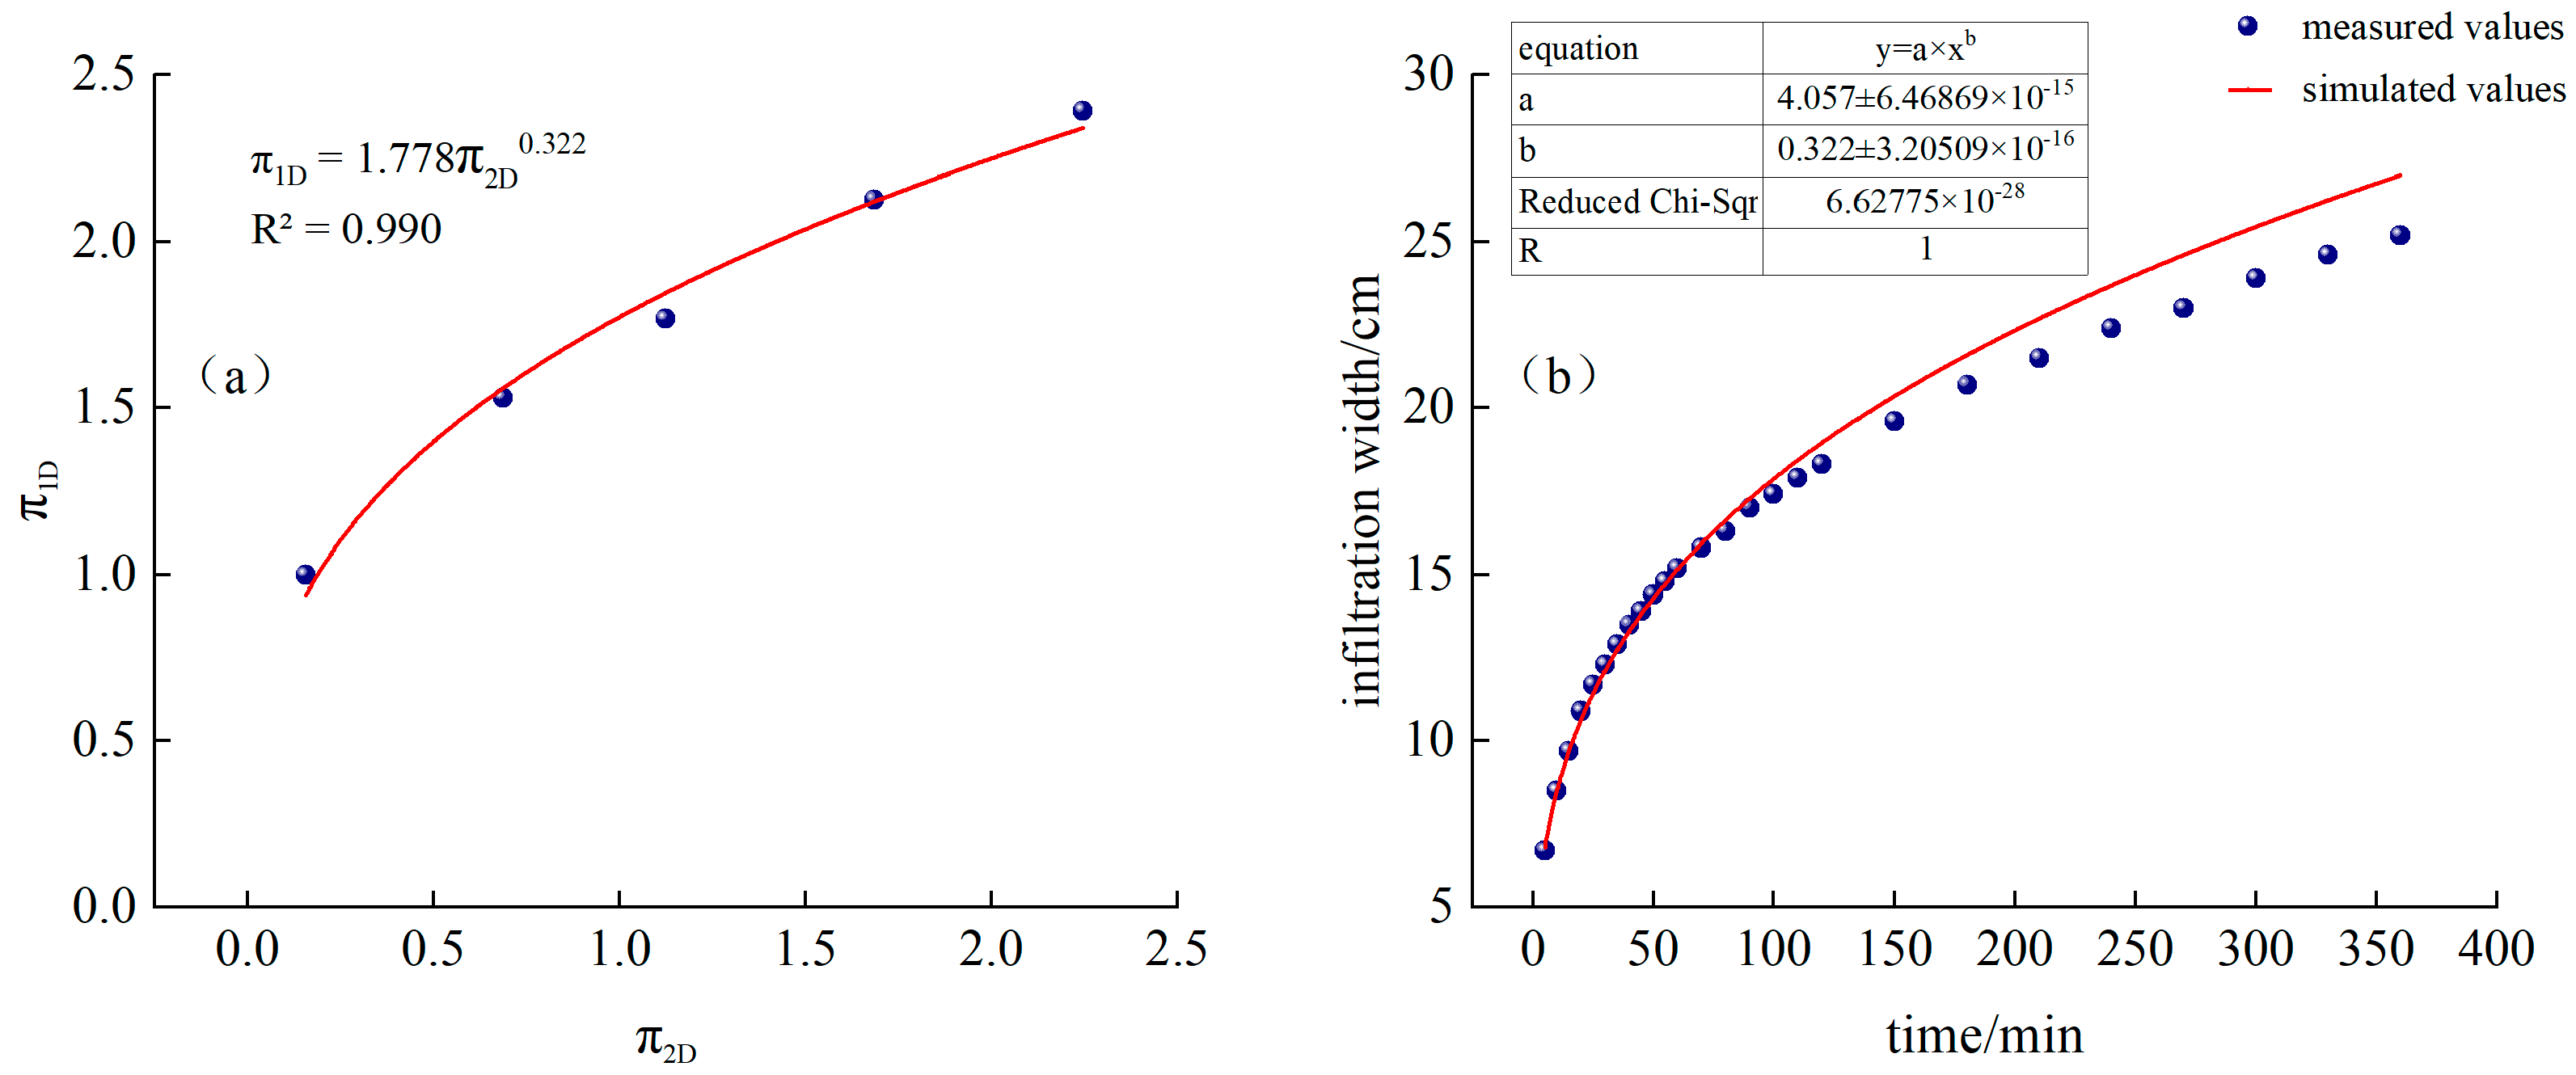
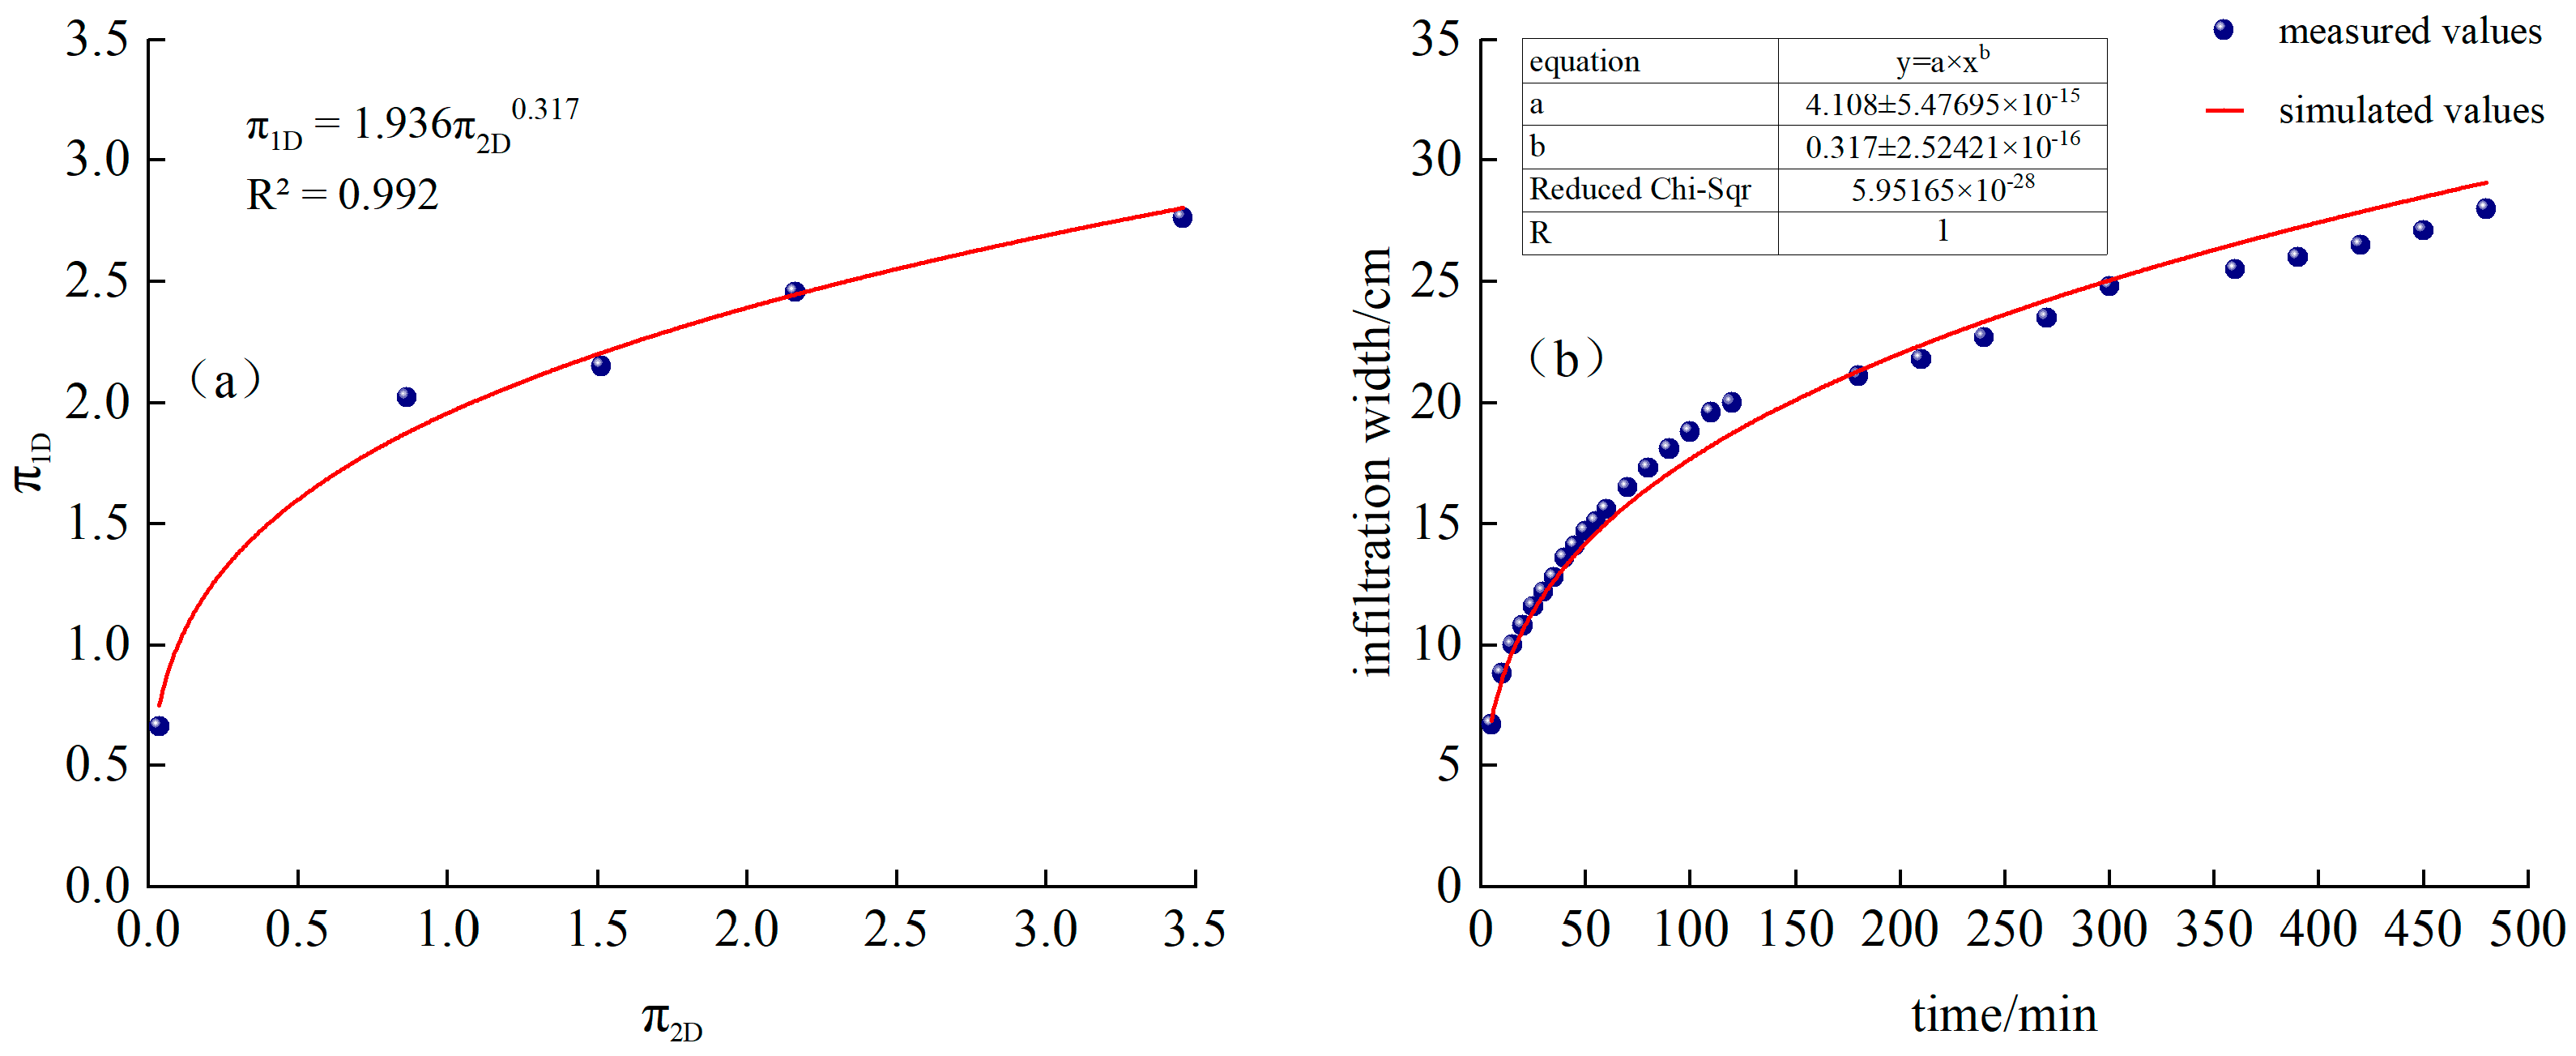
In the same way, the two π terms of the penetration width D can be expressed as follows:
Fitted from measured data, as shown in Figure 5a:
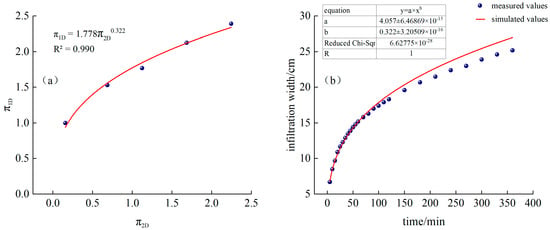
Figure 5.
(a) Continuous irrigation and fitting function, (b) Comparison of simulated and measured values of infiltration width for continuous irrigation.
Substituting into Equation (19), we obtain the following:
The time-varying curves of simulated and measured values are shown in Figure 5b.
It can be seen from Figure 4a and Figure 5b that the measured infiltration depth and width of CK continuous irrigation treatment are relatively close to the model-calculated values. Among them, the RMSE of the calculated simulated infiltration depth and the measured value is 0.17 cm, MAE is 0.15 cm, PBIAS is 0.26%, and EF is 0.99. The RMSE between the simulated and measured infiltration width is 0.81 cm, MAE is 0.56 cm, PBIAS is −2.80%, and EF is 0.97. MAE and RMSE are both close to 0, |PBIAS| < 10%, and EF is close to 1, indicating that, in this experience, the model has high calculation accuracy and can be used to predict the water infiltration depth and width of sandy loam soil under different irrigation time, dripper flow rate, and saturated hydraulic conductivity under continuous irrigation conditions.
Intermittent irrigation is different from continuous irrigation. Moisture front migration also depends on the number of irrigation intermittent cycles and cycle intermittent time. The average flow rate calculated based on the entire cycle time (drip irrigation time plus intermittent time) is defined as the equivalent continuous flow rate QC. QC is the ratio of total irrigation volume to total cycle time. The equivalent continuous flow rates processed by T1, T2, and T3 are 8 cm3·min−1, 7.5 cm3·min−1, and 8.5 cm3·min−1 respectively. The two π-term expressions of intermittent irrigation infiltration depth and width are as follows:
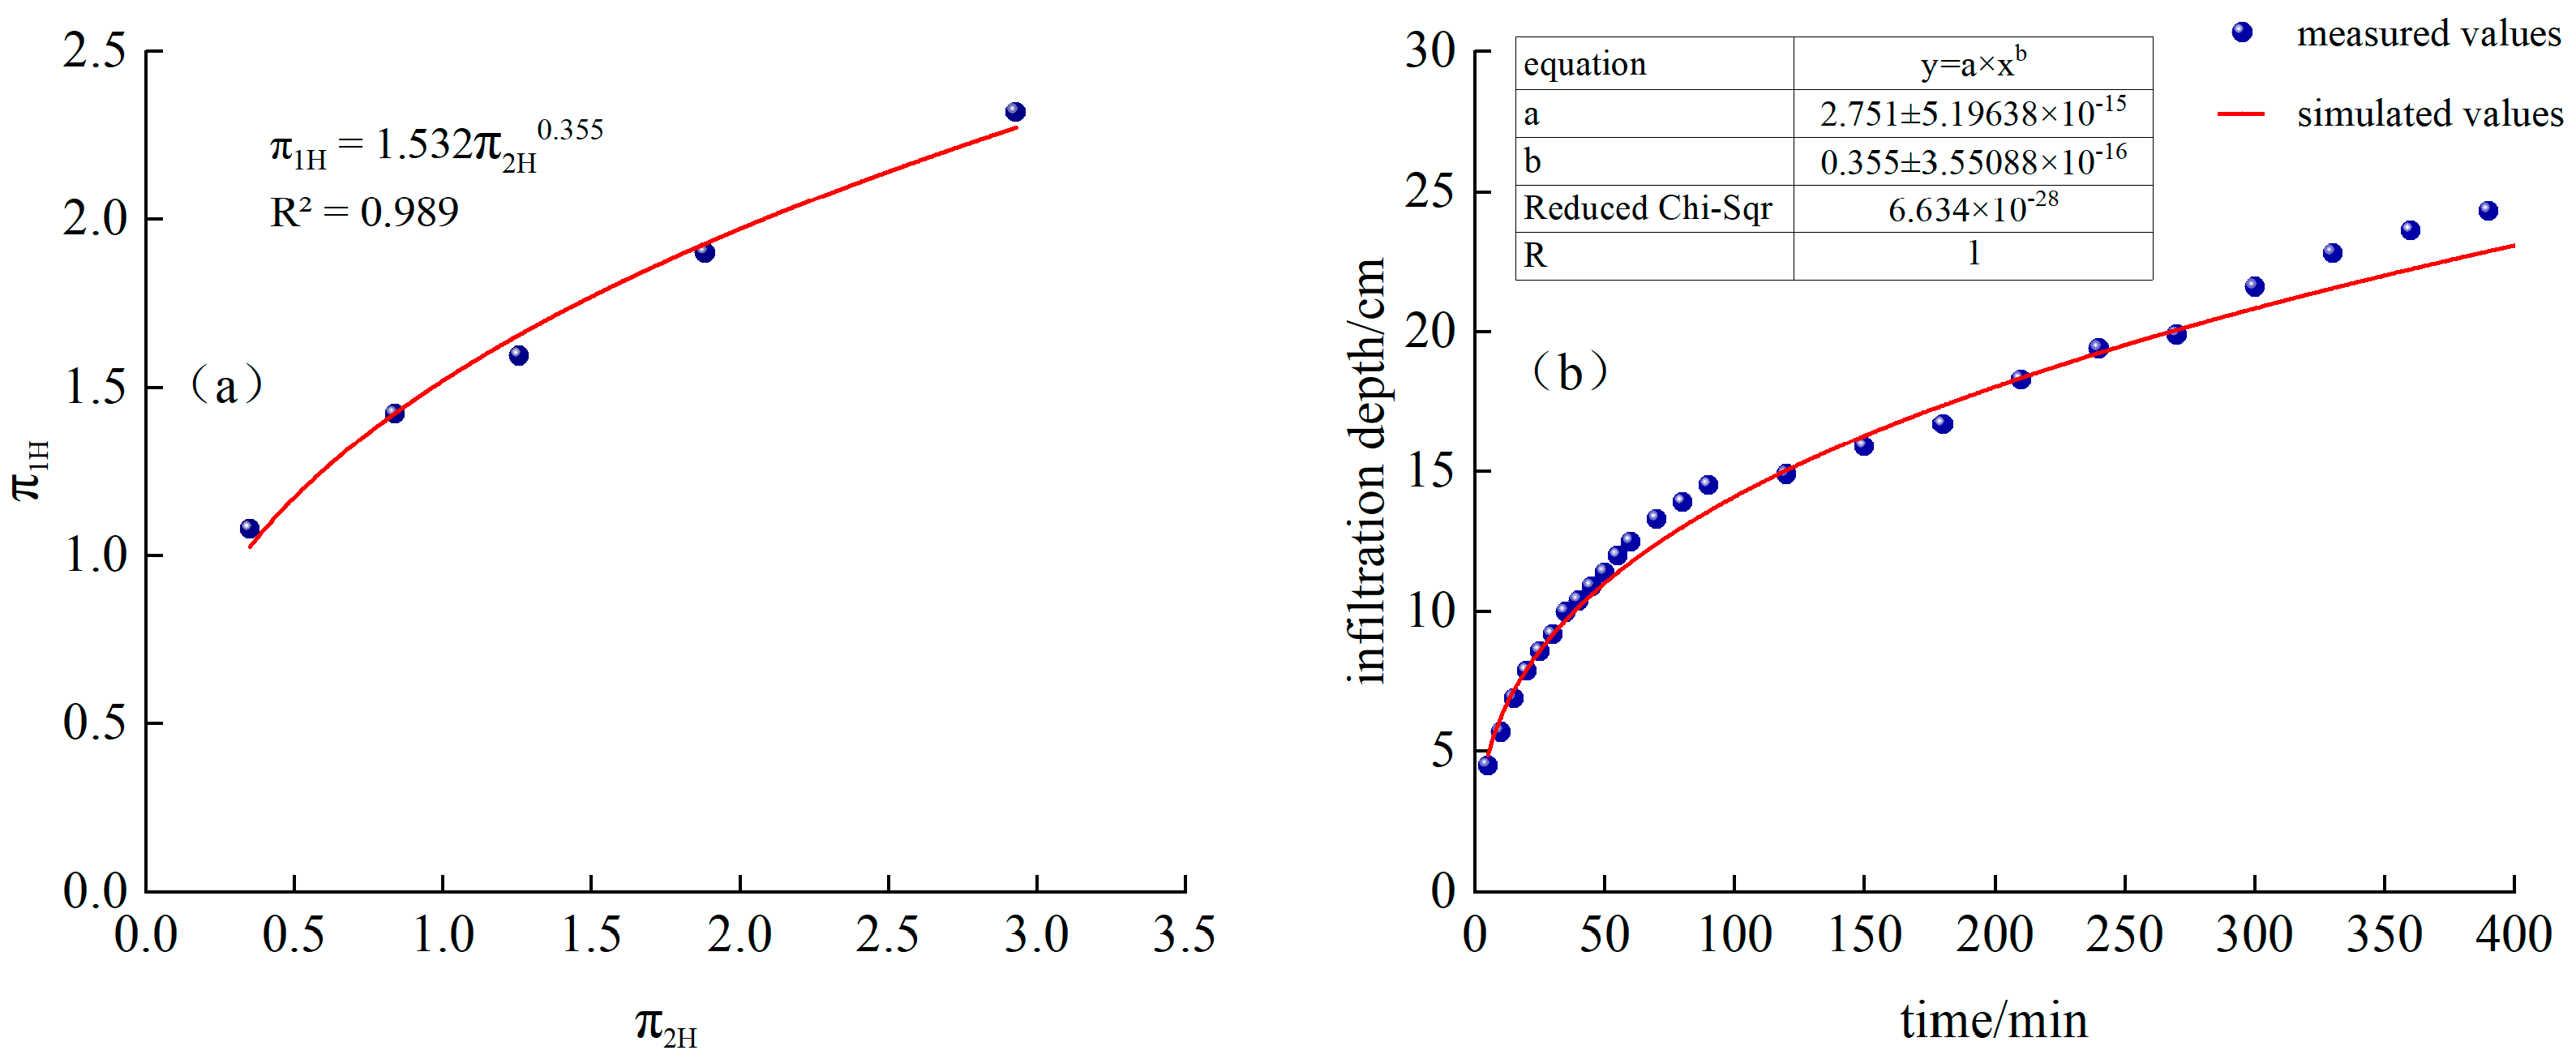
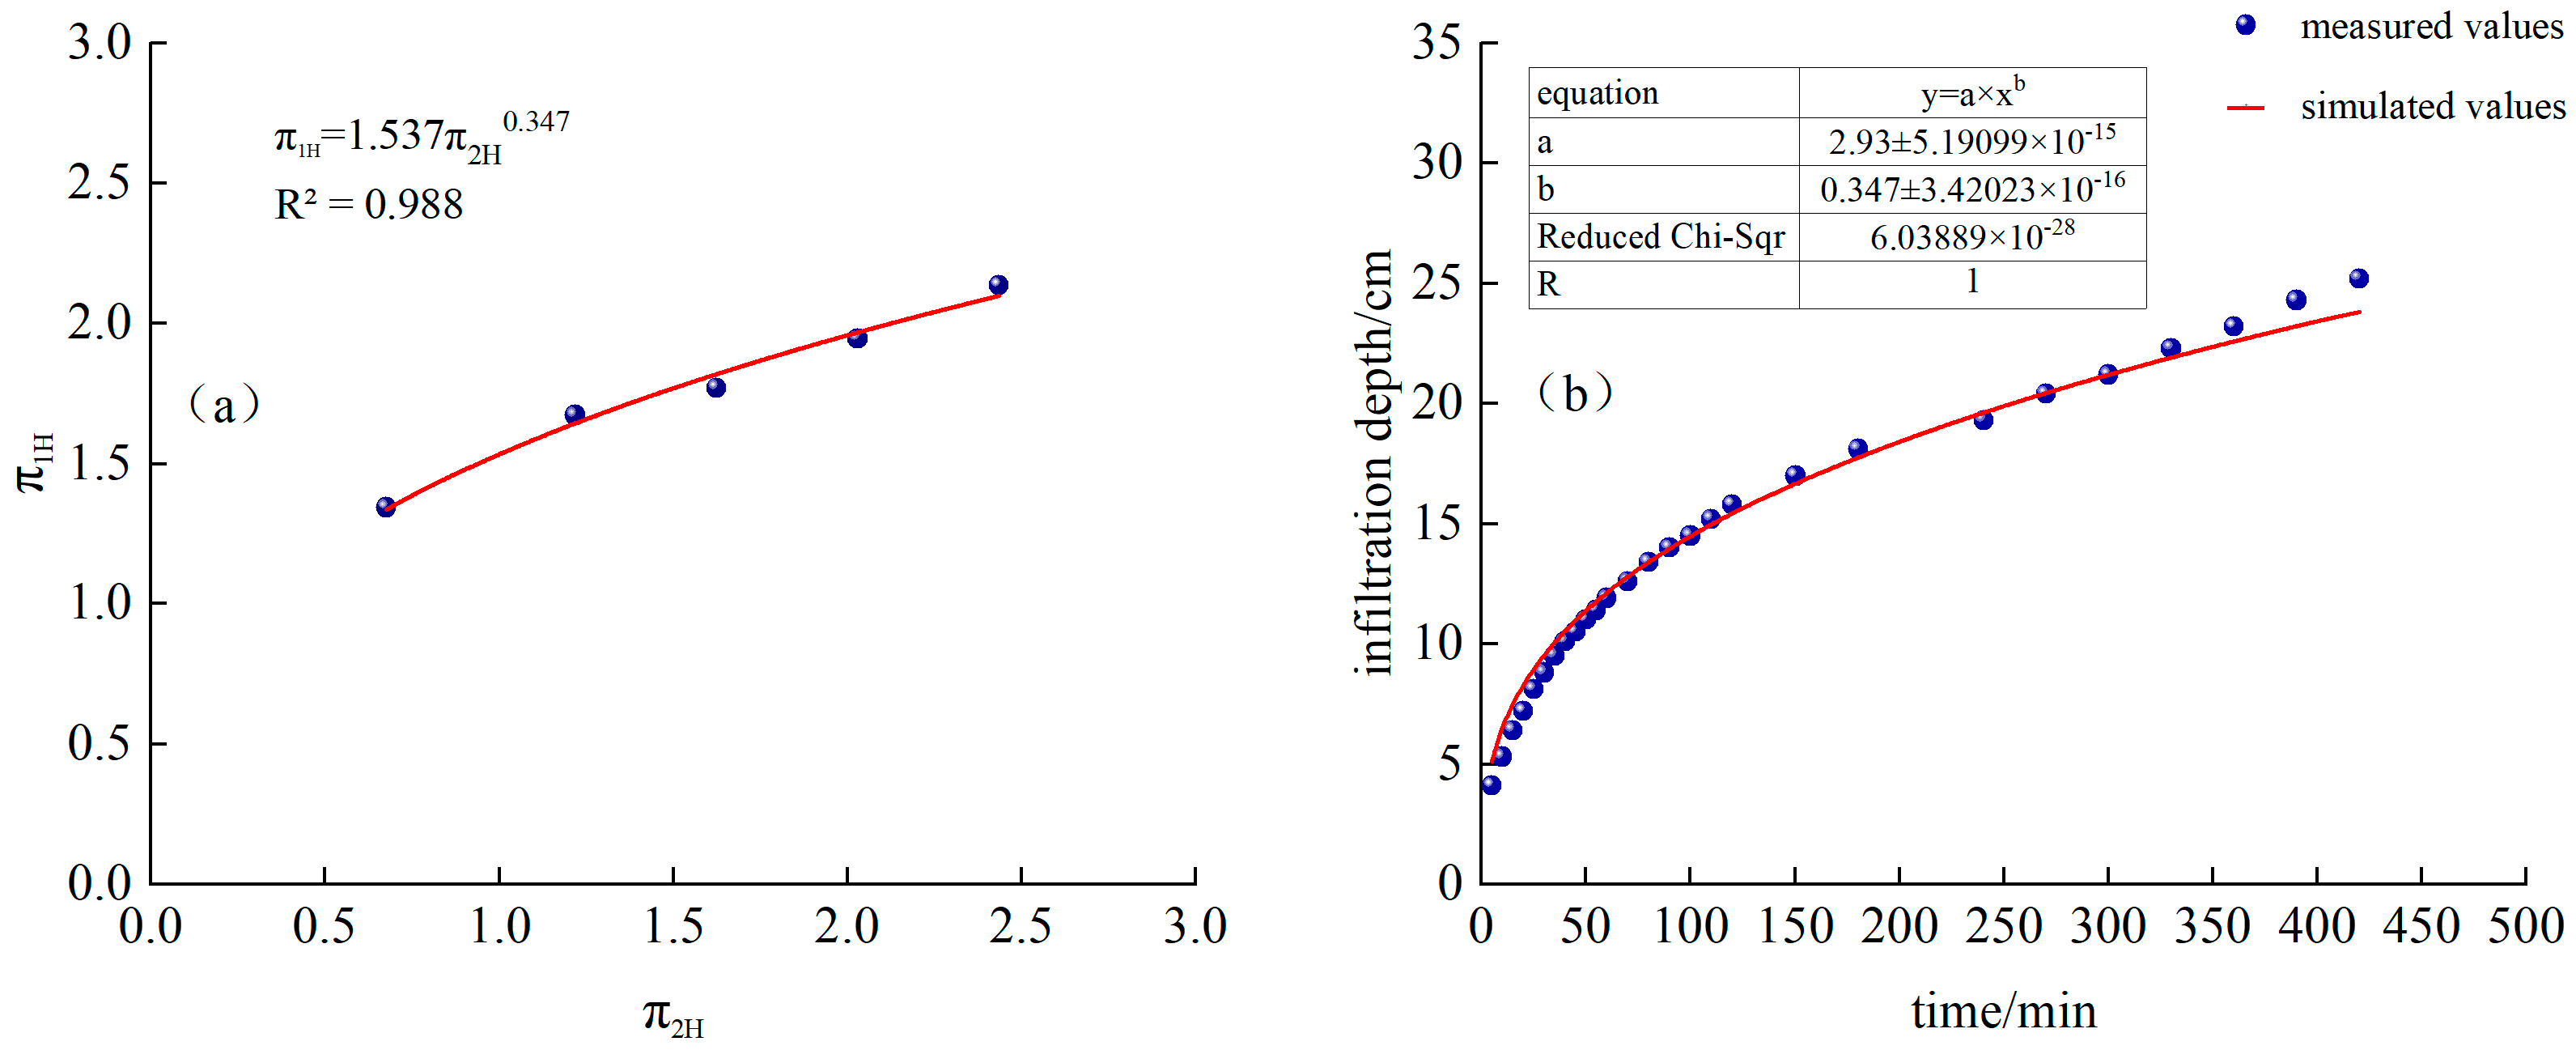
As shown in Figure 6a, T1 processing and is a power function relationship:
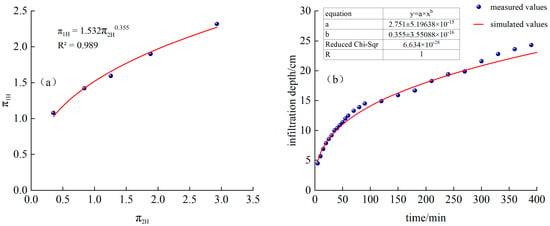
Figure 6.
(a) T1 treatment and fitting function, (b) Comparison of simulated and measured values of infiltration depth for T1 treatment.
Substituting into Formula (22), we obtain the following:
The time-varying curves of simulated and measured values are shown in Figure 6b.
Fitted from measured data, as shown in Figure 7a:
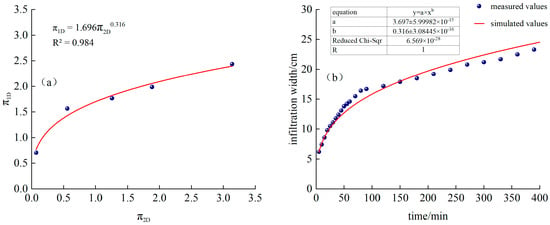
Figure 7.
(a) T1 treatment and fitting function, (b) Comparison of simulated and measured values of infiltration width for T1 treatment.
Substituting into Equation (23), we obtain the following:
The time-varying curves of simulated and measured values are shown in Figure 7b.
Figure 7a,b show that by introducing the equivalent continuous flow rate Qc and performing dimensional analysis using the Buckingham π theorem, we can better estimate and predict the total cycle time of 7.5 h, a 1.5 h irrigation with 0.5 h of intermittent irrigation, and four intermittent irrigation cycles: penetration depth and width of the moistening front.
As shown in Figure 8a, T2 processing and is a power function relationship:
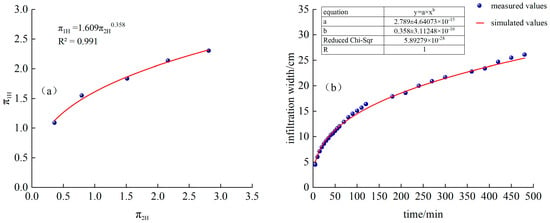
Figure 8.
(a) T2 treatment and fitting function, (b) Comparison of simulated and measured values of infiltration depth for T2 treatment.
Substituting into Formula (22), we obtain the following:
The time-varying curves of simulated and measured values are shown in Figure 8b.
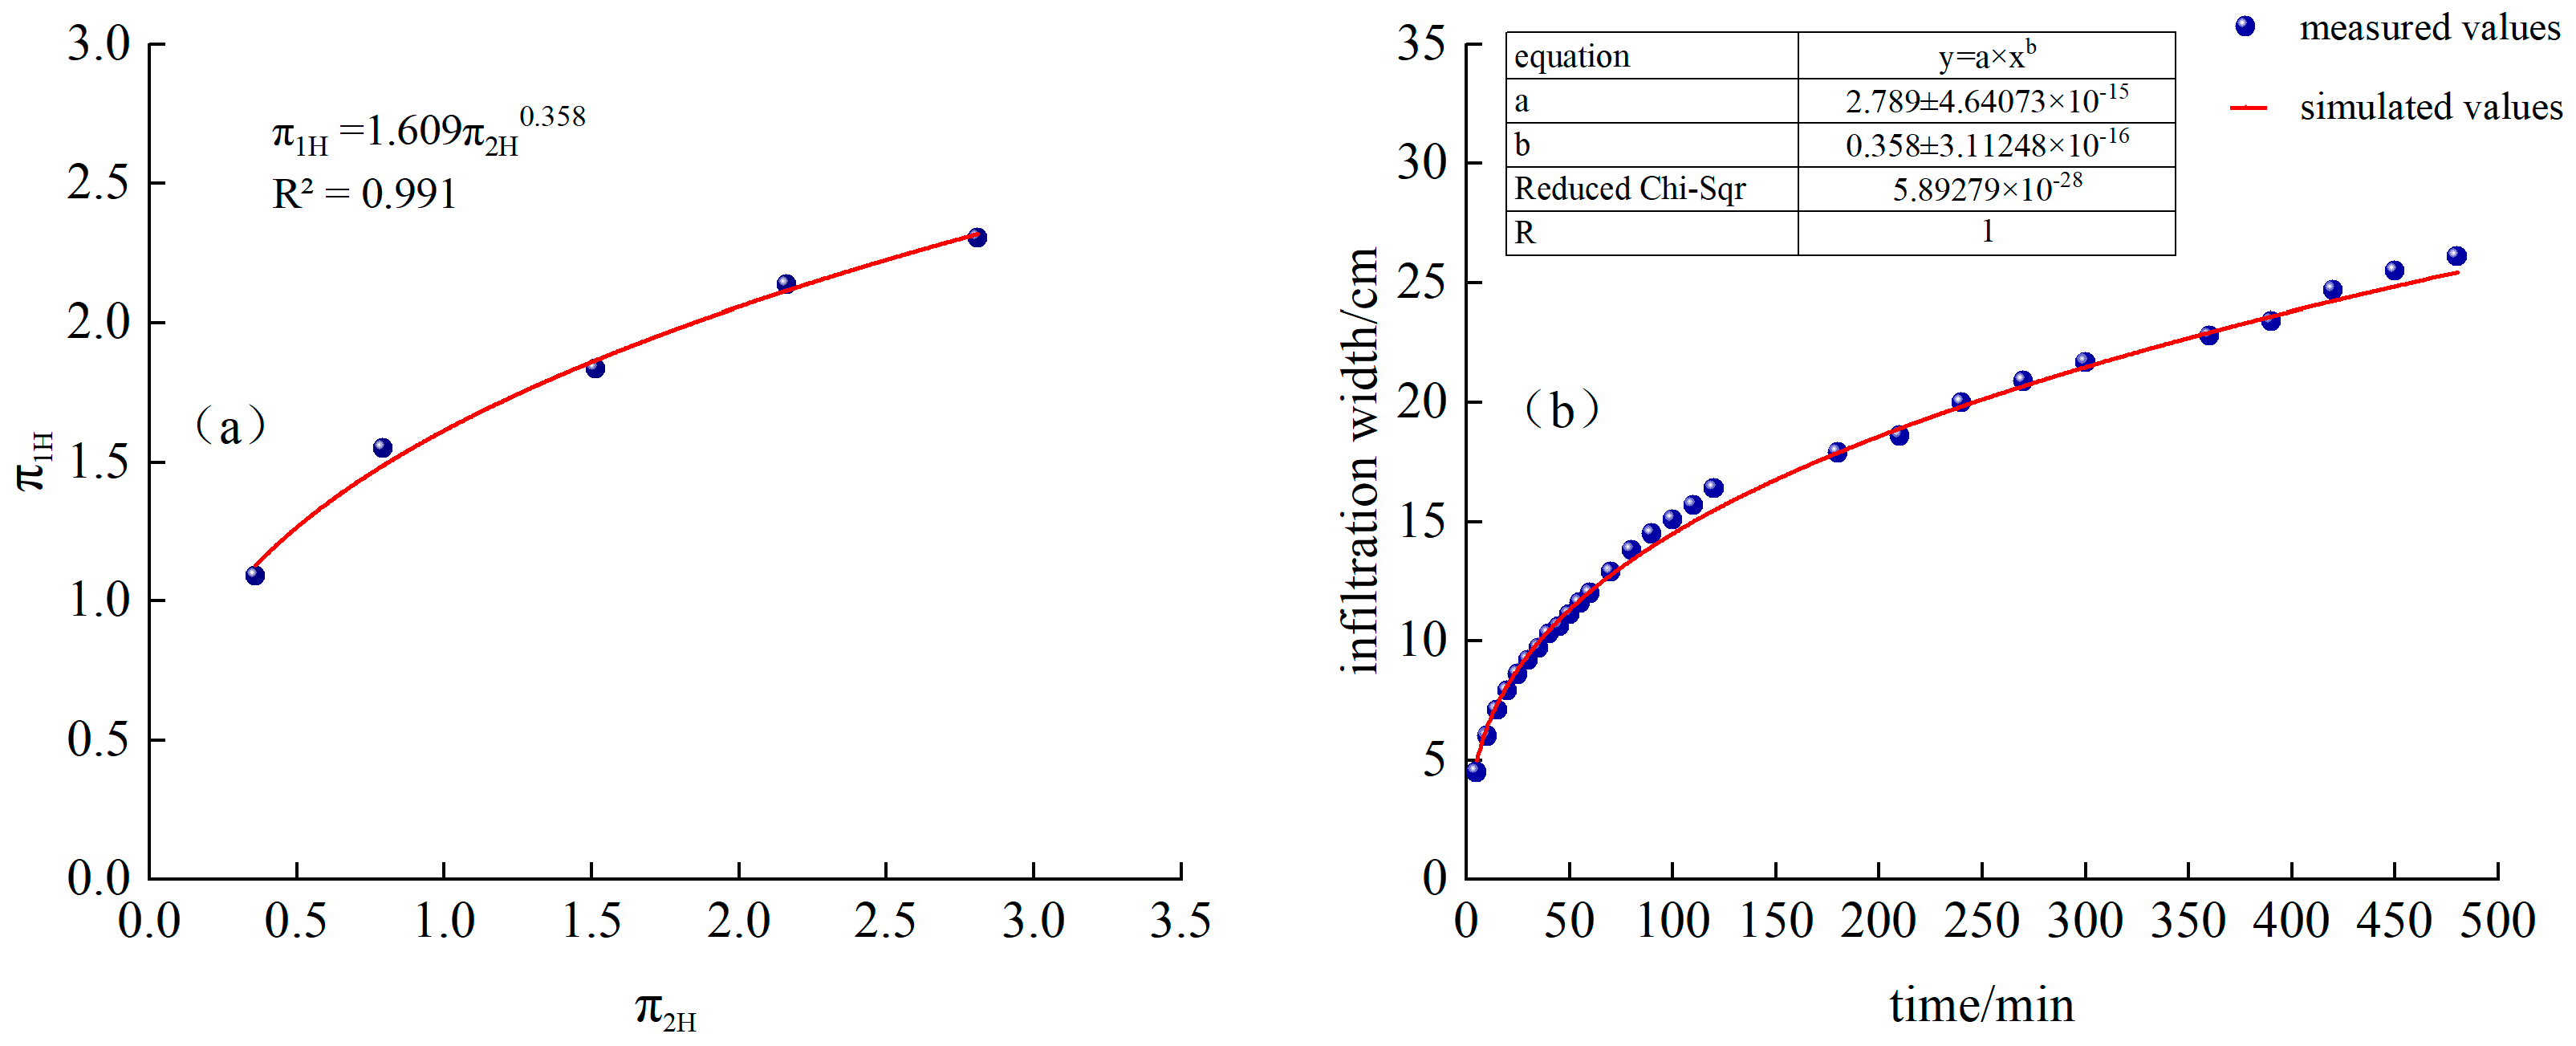
Fitted from measured data, as shown in Figure 9a:
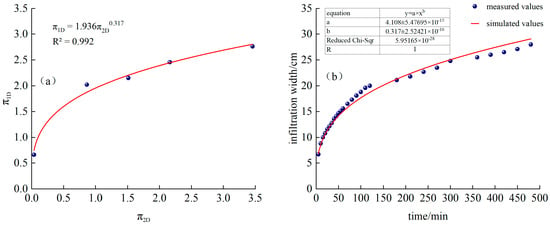
Figure 9.
(a) T2 treatment and fitting function, (b) Comparison of simulated and measured values of infiltration width for T2 treatment.
Substituting into Formula (23), we obtain the following:
The time-varying curves of simulated and measured values are shown in Figure 9b.
It can be seen from Figure 9a to Figure 9b that by introducing the equivalent continuous flow Qc and using the Buckingham π–theorem dimensional analysis, we can better estimate and predict the moistening front under the conditions of a total cycle time of 8 h, irrigation of 2 h with intermittent irrigation of 1 h, and intermittent irrigation of three cycles: penetration depth and width.
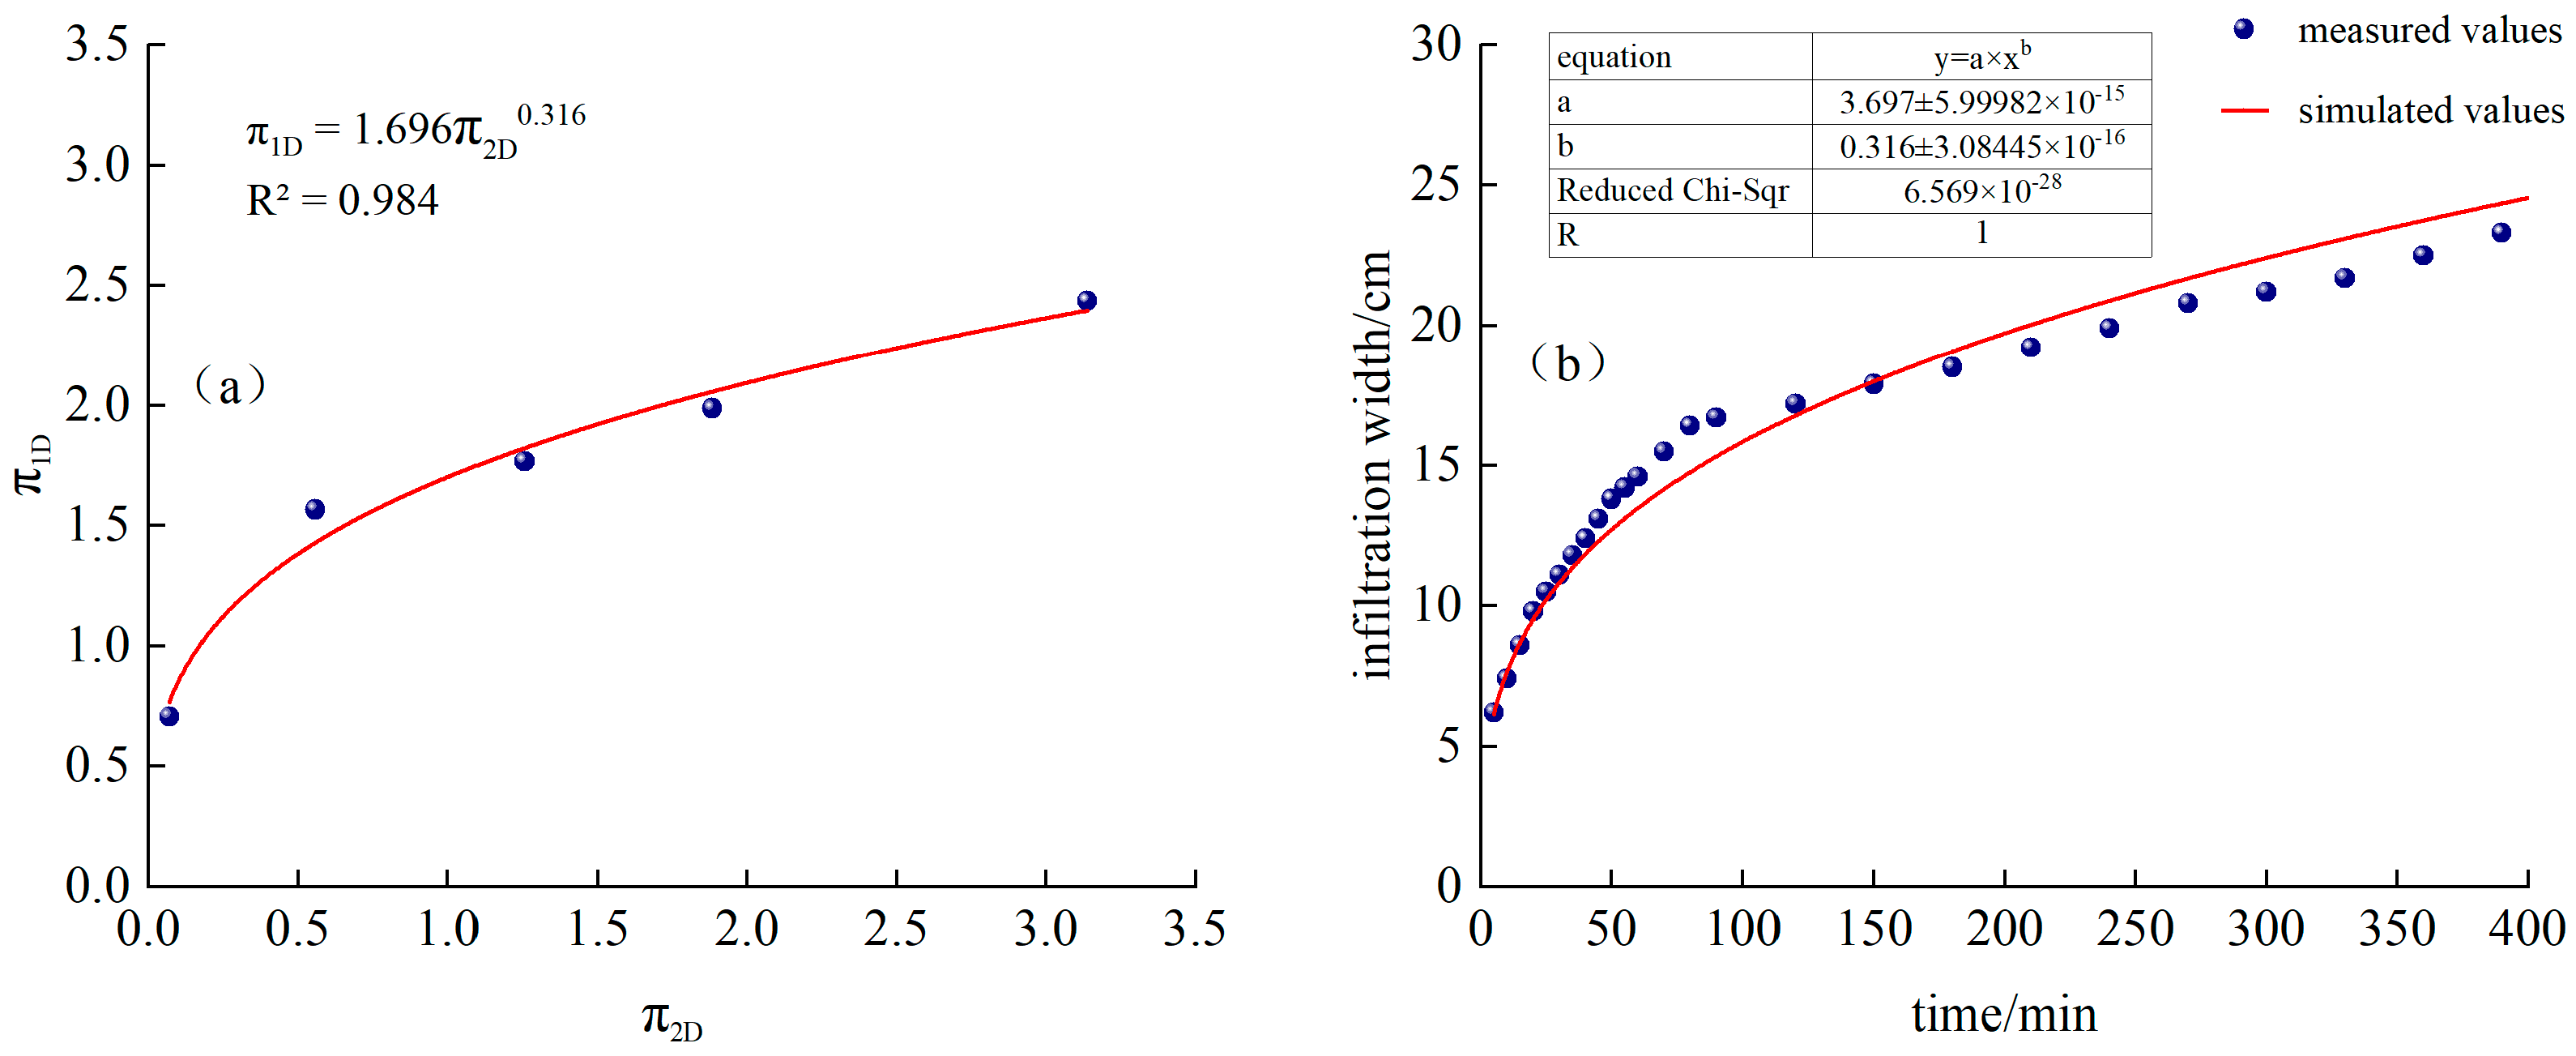
As shown in Figure 10a, T3 processing and is a power function relationship:
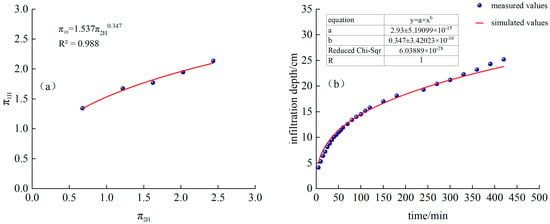
Figure 10.
(a) T3 treatment and fitting function, (b) Comparison of simulated and measured values of infiltration depth for T3 treatment.
Substituting into Formula (22), we obtain the following:
The time-varying curves of simulated and measured values are shown in Figure 10b.
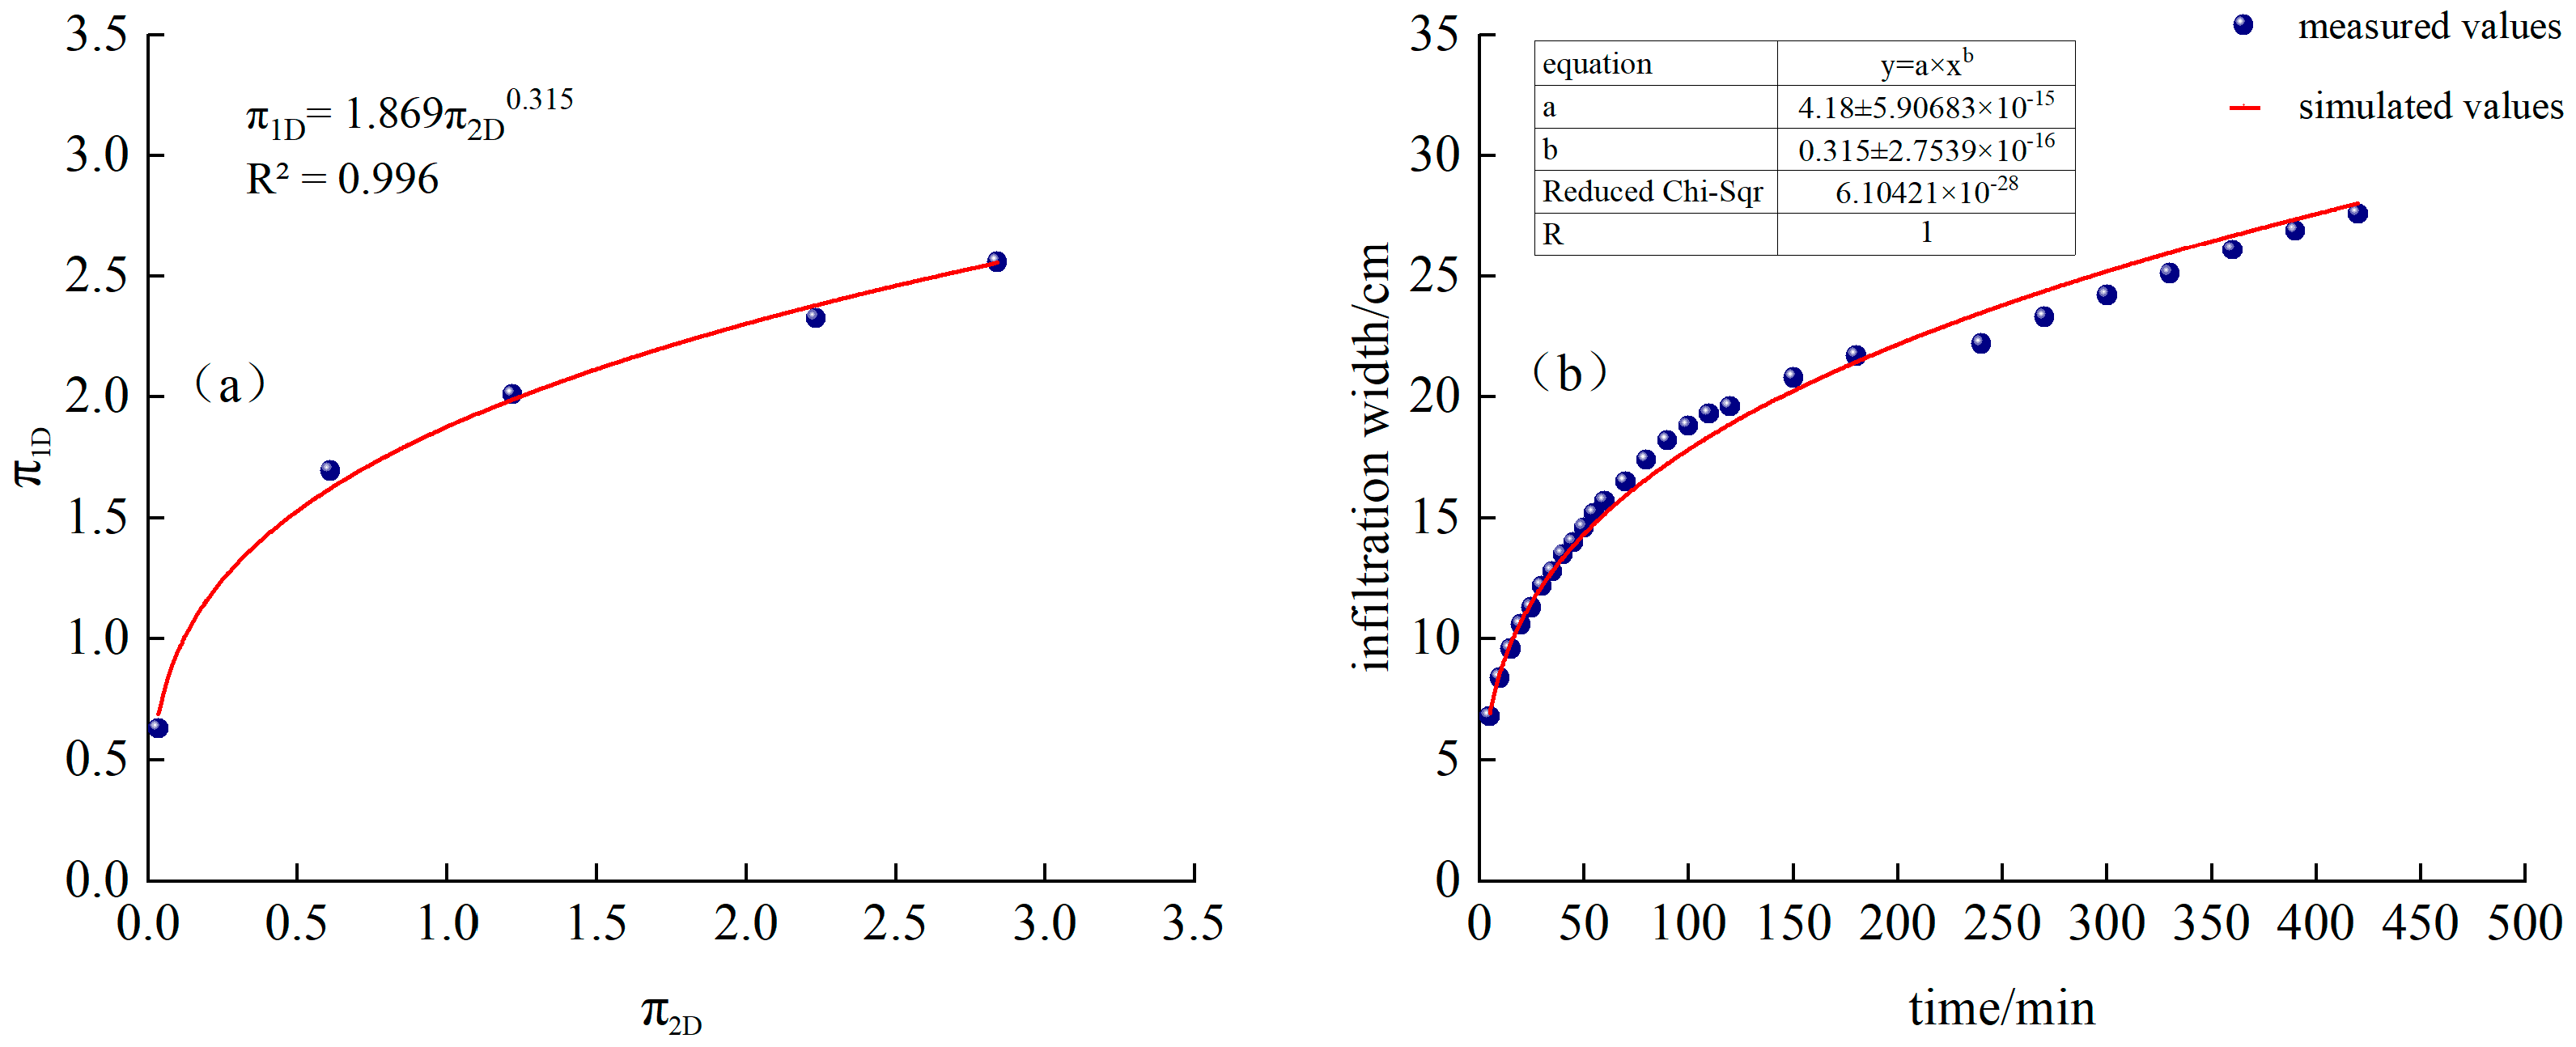
Fitted from measured data, as shown in Figure 11a:
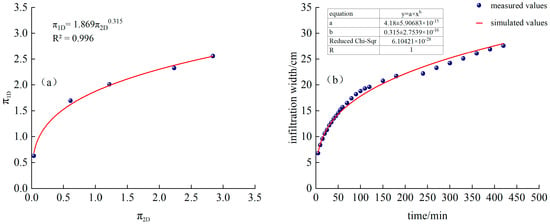
Figure 11.
(a) T3 treatment and fitting function, (b) Comparison of simulated and measured values of infiltration width for T3 treatment.
Substituting into Formula (23), we obtain the following:
The time-varying curves of simulated and measured values are shown in Figure 11b.
It can be seen from Figure 11a,b that by introducing the equivalent continuous flow Qc and performing dimensional analysis of the Buckingham π–theorem, we can better estimate and predict the humidification front under the conditions of a total cycle time of 3 h, irrigation of 3 h with intermittent irrigation of 1 h, and two cycles of intermittent irrigation: penetration depth and width.
As shown in Table 1, the soil wetting front model performance parameters of each treatment and the measured values of infiltration depth and width of each treatment of intermittent irrigation are relatively close to the model calculated values; RMSE and MAE are close to 0, |PBIAS| < 10% and EF is close to 1, indicating that the empirical model has high calculation accuracy and can be used to predict the infiltration depth and width of the moist front in sandy loam soil under different intermittent irrigation systems under intermittent drip irrigation conditions. It can be seen from Figure 4 to Figure 11 that the soil moisture bodies in each treatment are approximate ellipsoids with unequal infiltration depth and infiltration width.

Table 1.
Modeled performance parameters for depth and width of wetted front infiltration.
3.2. Estimation of Effective Water Storage Capacity of Wet Bodies
In existing studies that define the boundaries of moist bodies, moist fronts in all directions are usually used as their outer boundaries. However, for crops, water can only be effectively absorbed and utilized when the soil moisture content reaches a certain threshold. Therefore, soil moisture near the boundary area of the wet body is difficult for crop roots to absorb and utilize and is thus regarded as ineffective water. It is generally believed that the water between the capillary fracture water content and the capillary water holding capacity is easily available water, and 65% of the field water holding capacity (14.95%) is taken as the lower limit of the effective moist body boundary. To more accurately assess the actual demand of crops for soil moisture, it is more reasonable to study the water storage amount in the effective moist body.
Figure 12 shows the isoline distribution of soil moisture content in the wet body after redistribution of each treatment for 24 h. It can be seen from Figure 12 that the moisture content of each treatment showed a gradually decreasing trend from the dripper as the center outward. The intermittent drip irrigation treatment reduced the infiltration depth of the wetting front and increased the infiltration width of the wetting front. As the number of intervals increased, the infiltration depth decreased, and the infiltration width increased. Zhong Yun [36] studied that the soil mass moisture content at any point in the moist front and the moist body can be described by an elliptical equation:

Figure 12.
Soil water content Contour distribution of each treatment.
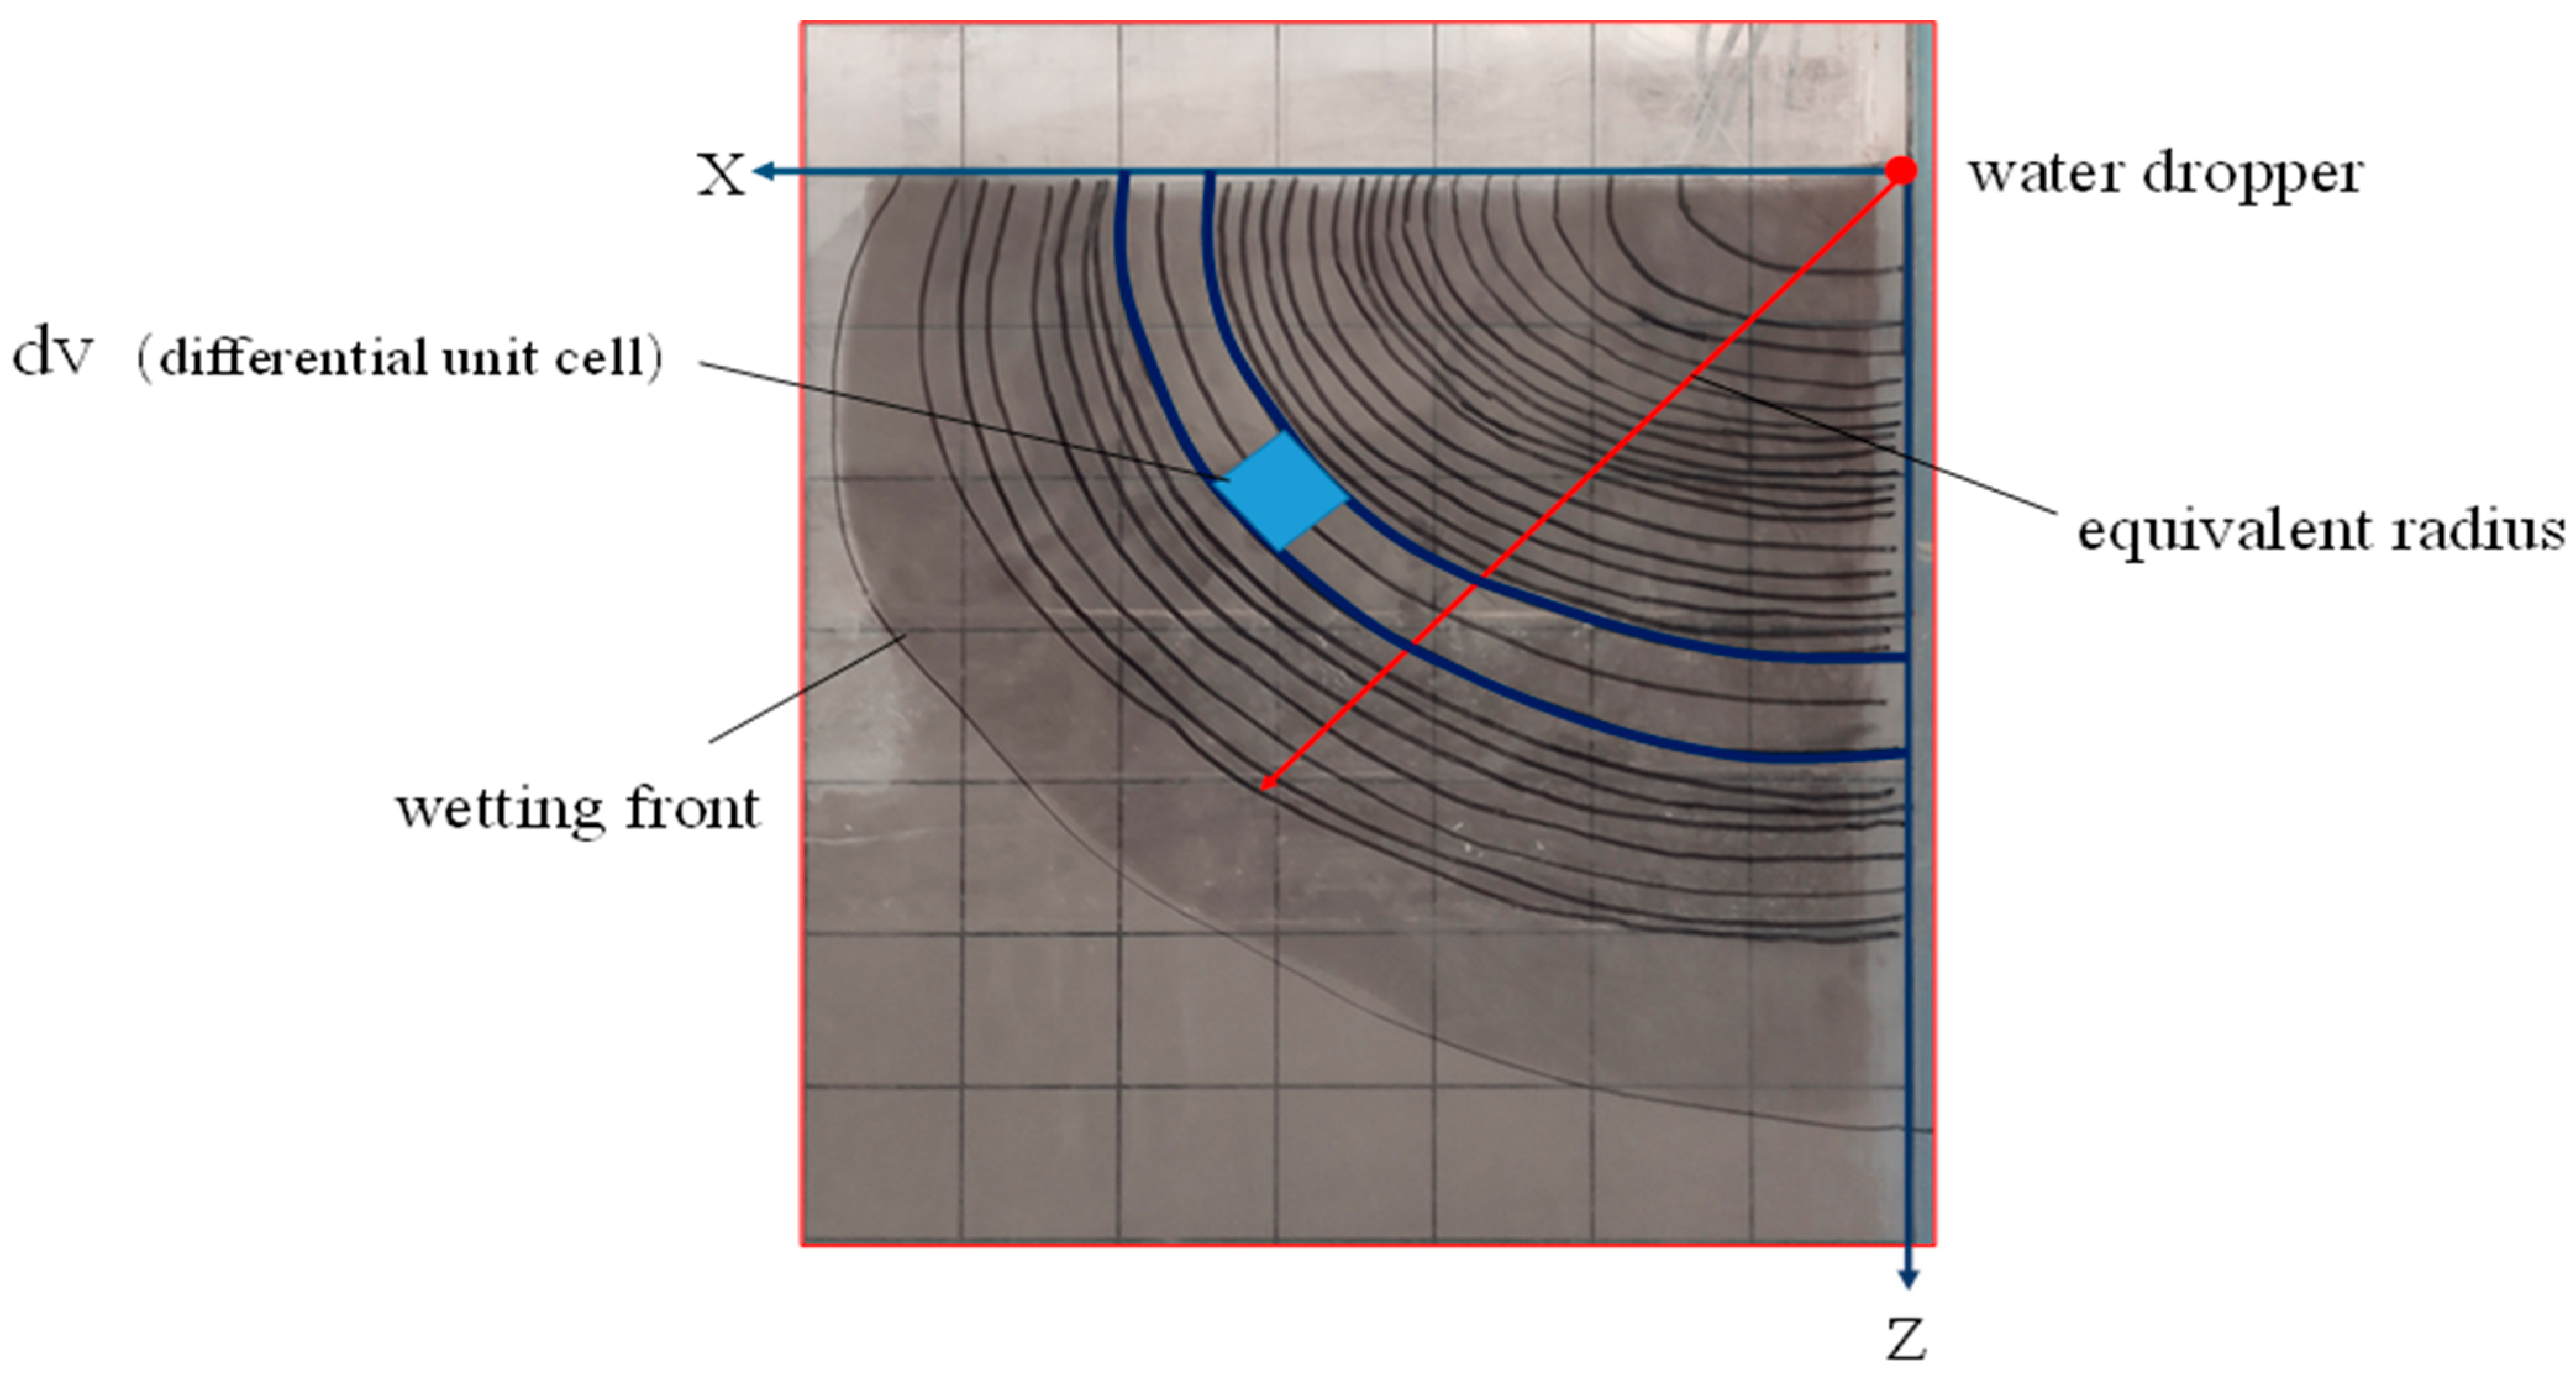
In the formula, is the mass moisture content of the soil at any point in the moist body, %, is the initial mass moisture content of the soil, %, is the field water capacity, %, is the distance between the point on the equivalent radius of the moist body and the dripper, cm, and is the moist Body equivalent radius, cm. The and among them are shown in Figure 13. It can be seen from Figure 13 that as the infiltration time progresses, the soil moisture body at any time is approximately an ellipsoid.
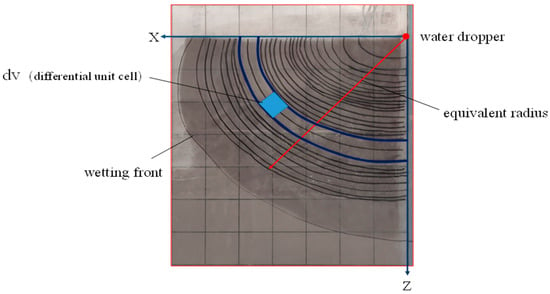
Figure 13.
Soil moisture body diagram.
Sort out Equation (37) and obtain the following:
The effective water storage capacity in the moist body is obtained by integrating the boundary integration of the effective moisture content in the moist body. Taking the dripper as the coordinate origin, the wetted body coordinate system is established, as shown in Figure 13. The change in the amount of soil moisture in any differential unit body in the humid body is as follows:
The boundary integral of effective moisture content in the moist body is as follows:
In the formula, is the effective moist volume fraction range and is the effective water storage volume in the moist body, cm3. By substituting Equation (38) into Equation (40) we obtain the following:
Using the equivalent radius to replace the penetration depth H and penetration width D and substituting the elliptical Equation (37) into Equation (41), we obtain the following:
forming
. When x takes 0, t = 0; when x takes r, , ,
When the infiltration depth H and infiltration width D are known, according to the geometric properties of the ellipsoid, its equivalent radius r can be expressed by the geometric mean. , then the effective water storage capacity in the moist body is Equation (45):
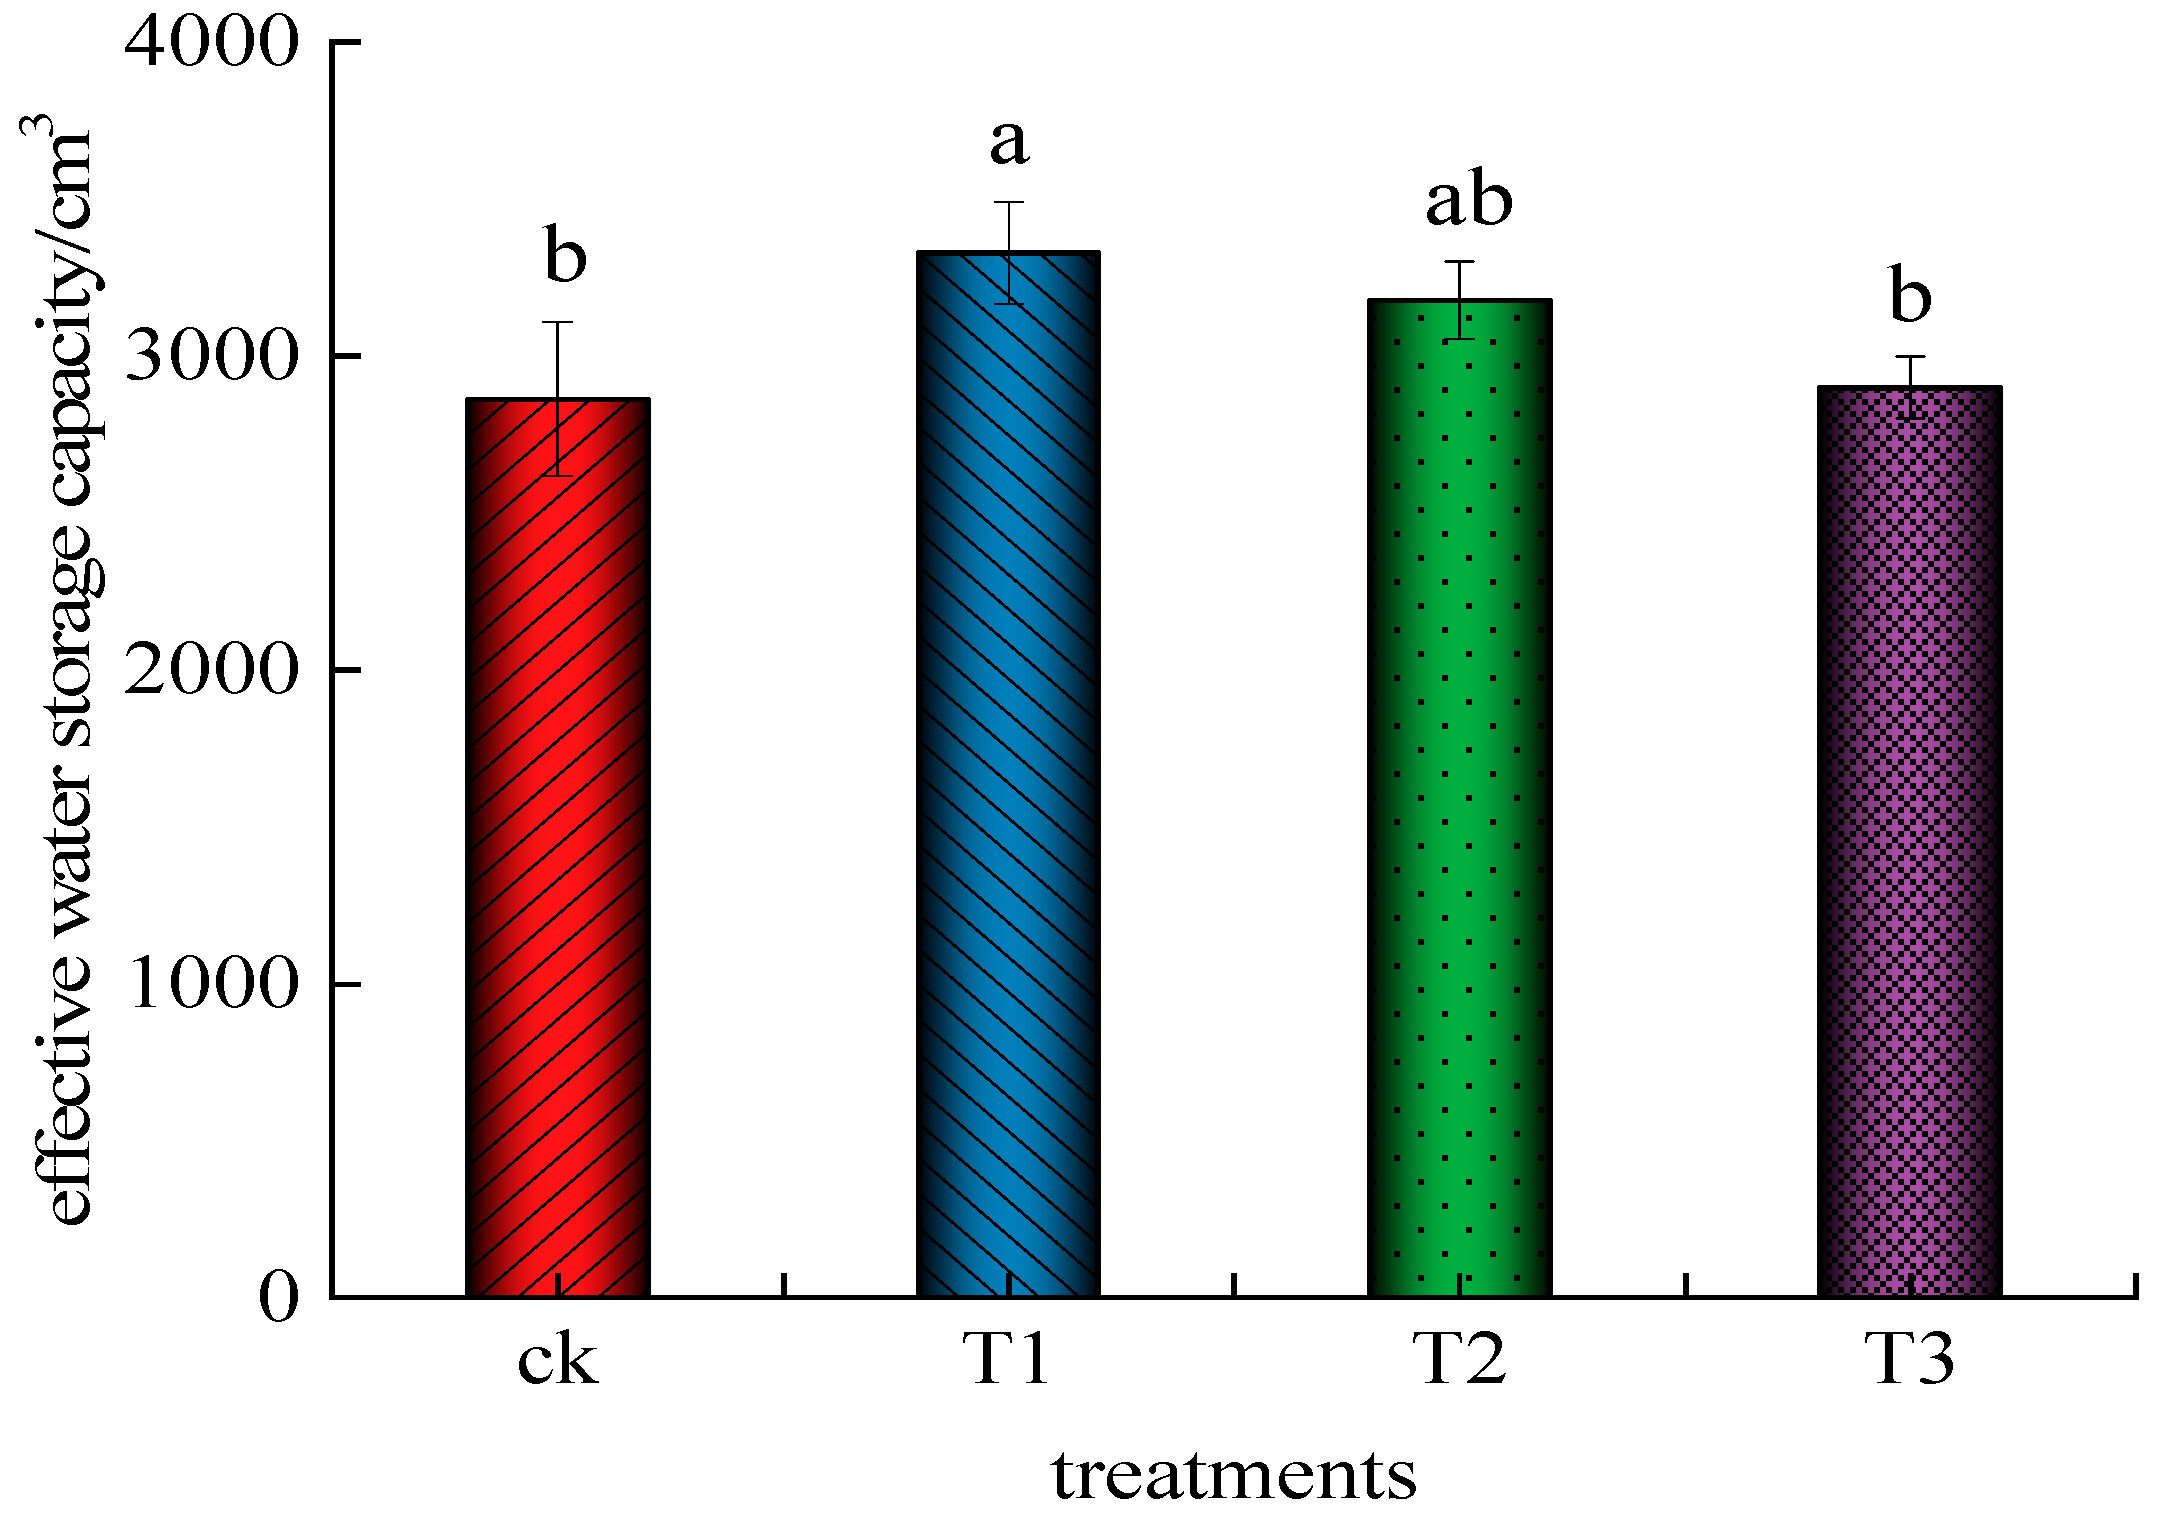
The effective water storage capacity in the wet body of each treatment is calculated based on Equation (45), as shown in Figure 14. The effective water storage capacity in the moist body of treatment T1 is the largest, and the effective water storage capacity in the moist body of treatment CK is the smallest. There is no significant difference between T1 and T2 (p > 0.5), but it is significantly higher than that of CK treatment and T3 treatment (p < 0.5). There is no statistical significance between CK treatment and T3 treatment (p > 0.5). Compared with the CK treatment, the effective water storage capacity in the moist body increased by 16.23%, 10.98%, and 1.25% in the T1, T2, and T3 treatments, respectively.
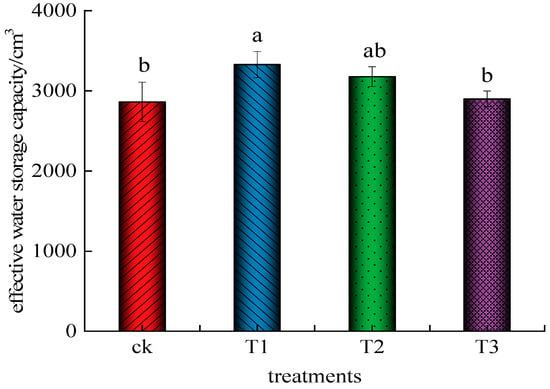
Figure 14.
Effective water storage in the soil moisture body of each treatment. Different letters above bars indicate statistically significant differences between treatments (p < 0.05). Bars sharing the same letter are not significantly different.
4. Discussion
Using the Buckingham π theorem, we reduced the complexity of mathematical expressions and problems by treating variables as dimensionless. Najib A et al. [27] and García-Barrachina et al. [30] developed a dimensionless model for a vacuum membrane distillation system and elucidated the correlation between input parameters and performance indicators. The model prediction is consistent with the experimental results, with a margin of error of ±8%. This study developed a predictive model for moist body infiltration depth and width using dimensional analysis under varying intermittent irrigation systems. The infiltration depth and width depend on the saturated hydraulic conductivity, dripper flow rate, and infiltration time. The continuous irrigation treatment’s infiltration width was overestimated after 2 h, while the intermittent irrigation treatments’ infiltration widths varied between overestimation and underestimation throughout the process. According to multiple statistical indicators’ assessment, the simulated continuous irrigation and intermittent irrigation values closely approximate the measured ones, with RMSE and MAE values approaching zero. With an absolute value below 10% for PBIAS and EF close to 1, the model deviation is controlled, yielding more precise empirical model estimates.
This study serves as a preliminary investigation based on laboratory soil box simulations. While the results provide valuable insights into soil moisture dynamics and irrigation patterns, further validation under field conditions is required. Future research will focus on testing the model across diverse environmental conditions, including varying climates and crop types, to improve its applicability in real-world agricultural systems.
The intermittent irrigation treatment’s soil infiltration process exhibited a substantial, periodic rise, initially slow and then quick, due to its alternating nature, as indicated in Liu Jingyan et al.‘s research [37]. The water loss gradient in surface soils increases when drip irrigation ceases. The redistribution of water in the soil profile caused a gradual increase in infiltration depth and width. Irrigating the wet soil surface again boosts its water conductivity, thereby accelerating infiltration. The wet–dry cycle can alter soil structure, pore distribution, and connectivity. As the infiltration time advances, the soil’s moisture body assumes an ellipsoidal shape, based on research by Chen Shuai et al. [38] and Su Lijun et al. [39]. Intermittent drip irrigation enhanced infiltration depth and width. The significance of this trend amplifies with longer intermittent periods. According to Eid et al. [4], pulse intermittent irrigation saves water and reduces infiltration more effectively than continuous irrigation. The research results reported by Eid et al. [4] also showed that pulse intermittent irrigation has the advantage of saving water and reducing infiltration compared to continuous irrigation.
The soil’s water movement consists of two primary processes: infiltration and redistribution. During the initial infiltration, water seeps into the soil from the surface for the very first time. The matric and gravity potentials primarily drive this process. Following irrigation, the soil undergoes redistribution, equalizing water potential throughout the profile. Twenty-four hours after irrigation, Bai Xueer et al. [40] and Wang Haiyu et al. [41] found that the wetted body diffusion area remains stable in their research on water redistribution. To optimize water usage by crops, Li Si [42] emphasized that soil moisture content should exceed the lower limit of available water. The boundary water of a wet body could not be absorbed and assimilated by the crops. This study compared the effective water storage in each treatment’s humidified body using a lower limit of 65% of field water capacity as the benchmark. In intermittent irrigation, the body retains more water than in continuous irrigation due to humidification. The study by André Maller et al. [33] attributed this difference to its short irrigation cycle, with the longest treatments lasting 70 min and dripper flow rates of 4 L·h−1 and 8 L·h−1, but in this study, the difference occurred with a dripper flow rate of only 0.6 L·h−1. The distribution of soil moisture content becomes consistent between intermittent irrigation and continuous irrigation as time goes on. This difference may be due to the short running time of the irrigation cycle in the study by André Maller et al. [41], with the longest treatment being 70 min, and the larger dripper flow rates of 4 L·h−1 and 8 L·h−1, Yuanda; in this study, it was caused by 0.6 L·h−1. The intermittent drip irrigation system optimally maximizes effective water storage in soil moisture with a 1.5 h interval, 0.5 h interval, and four cycles.
This study evaluated the impact of soil-saturated hydraulic conductivity, dripper flow rate, and irrigation time on the wetting front development in sandy loam soil undergoing initial air-drying. In this study, Ks was selected as the primary hydraulic parameter due to its well-documented effectiveness in characterizing soil permeability, especially in high-moisture conditions. Assouline [43] highlights that Ks provides a reliable estimate for soil water movement in controlled settings, even when full saturation is not consistently achieved. Although we acknowledge that the wetting front may not have achieved complete saturation, previous research supports the use of Ks in similar laboratory models to provide a reliable estimate of infiltration behavior by Castellini et al. [44] and Zhang & Schaap [45]. Under the controlled experimental settings, where soil texture and moisture content are monitored, Ks serves as a robust simplifying parameter, enabling focused insights into infiltration depth and width while minimizing extraneous variability. Future studies will incorporate direct measurements of wetting front saturation levels to enhance model accuracy and account for potential variances in unsaturated conditions
This study did not consider factors such as evaporation, plant water absorption, soil structure, bulk density, texture, and initial moisture content during the wetting front prediction period. While Ks was the primary focus, it is acknowledged that infiltration is influenced by additional soil properties like unsaturated hydraulic conductivity and soil water retention, which play significant roles under unsaturated conditions. Assouline [43] highlights that understanding water dynamics in soil requires attention to these properties, especially in conditions where full saturation is not present. Future studies will benefit from integrating these parameters for a more comprehensive model that accommodates a wider range of infiltration scenarios. The model’s applicability may be restricted in complex scenarios involving intricate initial soil moisture distributions. Future research must optimize the empirical model and include additional factors affecting wetting patterns to enhance the model’s applicability, developing more effective intermittent irrigation methods tailored to varying soil and environmental situations for enhanced water usage. By integrating the expertise of agricultural engineering, soil science, botany, and water resources management, we can assess the full capabilities and constraints of intermittent drip irrigation technology in enhancing agricultural output.
Unlike detailed simulation tools such as HYDRUS 2D Šimůnek et al. [46] and del Vigo et al. [47,48], which are effective for complex field-based irrigation modeling; the model presented here offers several unique advantages for controlled experimental setups. Using the Buckingham π-Theorem allows our model to reduce computational complexity by simplifying variables into dimensionless groups. This approach aligns with Assouline‘s [43] insights, suggesting that models focusing on key parameters, like Ks, can achieve reliable estimates with efficient computation, especially for laboratory-based intermittent irrigation research. Castellini et al. [44] and Zhang and Schaap [45], simplified variables into dimensionless groups. This approach is particularly advantageous for laboratory-based, intermittent drip irrigation experiments, as it allows for a straightforward and efficient analysis of infiltration depth and moisture distribution patterns without requiring extensive computational resources. Additionally, our model is optimized for intermittent drip irrigation, which is challenging to simulate accurately in broader tools but crucial for optimizing water use in arid regions. These advantages make our model especially suited for early-stage research or scenarios with limited resources where rapid and reliable insights are needed.
5. Conclusions
This study developed a predictive model using dimensional analysis to estimate infiltration depth and width under various intermittent drip irrigation systems. The model demonstrated high accuracy for sandy loam soils, particularly in arid environments, as evidenced by the RMSE and MAE values close to zero and an EF value approaching 1 (Table 1). Intermittent irrigation was found to enhance effective water storage, achieving a 16.23% improvement compared to continuous irrigation (Figure 14), and broadened infiltration patterns, optimizing water distribution in the soil. These improvements were influenced by key factors such as soil-saturated hydraulic conductivity, dripper flow rate, and irrigation time, as confirmed by statistical analysis of the results.
Future research is needed to validate the model under more complex field conditions, including factors such as plant water uptake and evaporation, which were not considered in this study. Incorporating these elements will improve the model’s applicability and provide a foundation for more sustainable water management practices in agriculture, especially in water-scarce regions.
Author Contributions
Conceptualization, Z.Z., H.T. and L.Z.; methodology, Z.Z., B.Y. and H.T.; data curation, Z.Z. and B.Y.; writing—original draft preparation, Z.Z., B.Y. and M.W.R.; visualization, Z.Z., H.T., M.W.R., M.S. and A.S.; project administration, Z.Z., H.T., L.Z. and M.W.R. All authors have read and agreed to the published version of the manuscript.
Funding
Survey on changes in water production/demand elements and water security pattern in Tarim River Basin, Survey on spatial distribution and current status of industrial water use in South Xinjiang Corps 2022xjkk0106. Major Science and Technology Project of Corps, Water-saving Salt Washing Technology for Saline Land Improvement in Southern Xinjiang, 2018AA003.
Institutional Review Board Statement
Not applicable.
Informed Consent Statement
Not applicable.
Data Availability Statement
Data is contained within the article.
Acknowledgments
Thanks to Tarim University for the 2024 Central Support for Local Universities’ Water Resources Engineering Discipline Construction Project Grant.
Conflicts of Interest
The authors declare no conflicts of interest.
References
- Fuglie, K.O.; Morgan, S.; Jelliffe, J. World Agricultural Production, Resource Use, and Productivity, 1961–2020. Econ. Inf. Bull.—USDA Econ. Res. Serv. 2024, 54. [Google Scholar] [CrossRef]
- Rasul, F.; Munir, H.; Wajid, A.; Safdar, M.; Salman Ayub, M.; Shahzad, S.; Mehmood, R.; Adnan Shahid, M.; Sarwar, A.; Danish Majeed, M.; et al. Sustainable Irrigation Management for Higher Yield. In Irrigation and Drainage—Recent Advances; Intechopen: London, UK, 2023. [Google Scholar]
- Liu, X.; Gao, P.; Yang, D.; Zhang, Q.; Zhang, Y. Effects of intermittent combined irrigation of brackish and fresh water on soil water and salt transport characteristics in sa-line-alkali cultivated land. J. Soil Sci. 2017, 54, 1404–1413. [Google Scholar]
- Eid, A.R.; Bakry, B.A.; Taha, M.H. Effect of pulse drip irrigation and mulching systems on yield, quality traits and irrigation water use efficiency of soybean under sandy soil conditions. Agric. Sci. 2013, 4, 249–261. [Google Scholar] [CrossRef]
- Li, Y.; Fan, J.; Guan, X.; Liu, H.; Yin, F. Current status and countermeasures of agricultural water-saving development in Xinjiang irrigation areas. J. Huazhong Agric. Univ. 2024, 43, 93–98. [Google Scholar]
- Xu, Q.; Song, Z.; Li, C.; Dong, X.; Huang, T.; Song, Z.; Xiao, F.; Yang, Y. Research on precise nitrogen application in Xinjiang under-film drip irrigation cotton fields based on meta-analysis. J. Cotton 2024, 36, 50–65. [Google Scholar]
- Yan, B.; Xu, Y.; Ma, P.; Gao, Q.; Wang, C.; Zhang, J.; Xue, L.; Sun, L. Effect of sowing date on spring soybean yield and water use efficiency under film drip irrigation in northern Xinjiang. J. China Agric. Univ. 2017, 54, 1404–1413. [Google Scholar]
- Hussein, H.A.; Aldulaimy, S.E. Effect of Surface Drip Irrigation and Polymer Addition on Some Physical Soil Characteristics, Growth and Yield Characteristics of Cauliflower. IOP Conf. Ser. Earth Environ. Sci. 2023, 1222, 12007. [Google Scholar] [CrossRef]
- Rasheed, M.W.; Tang, J.; Sarwar, A.; Shah, S.; Saddique, N.; Khan, M.U.; Imran Khan, M.; Nawaz, S.; Shamshiri, R.R.; Aziz, M.; et al. Soil moisture measuring techniques and factors affecting the moisture dynamics: A comprehensive review. Sustainability 2022, 14, 11538. [Google Scholar] [CrossRef]
- Monjezi, M.S.; Ebrahimian, H.; Liaghat, A.; Moradi, M.A. Soil-wetting front in surface and subsurface drip irrigation. Proc. Inst. Civ. Eng.—Water Manag. 2013, 166, 272–284. [Google Scholar] [CrossRef]
- Wang, J.; Tian, Z.; Yang, T.; Li, X.; He, Q.; Wang, D.; Chen, R. Characteristics of limited flow and soil water infiltration boundary of a subsurface drip irrigation emitter in silty loam soil. Agric. Water Manag. 2024, 291, 108636. [Google Scholar] [CrossRef]
- Rubio, E.; Rubio-Alfaro, M.d.S.; Hernández-Marín, M. Wetting Front Velocity Determination in Soil Infiltration Processes: An Experimental Sensitivity Analysis. Agronomy 2022, 12, 1155. [Google Scholar] [CrossRef]
- Fan, Y.; Shao, X.; Gong, J.; Wang, Y. An empirical model for estimating soil wetting pattern dimensions during film hole irrigation. Arch. Agron. Soil Sci. 2020, 66, 1765–1779. [Google Scholar] [CrossRef]
- Kilic, M. A new analytical method for estimating the 3D volumetric wetting pattern under drip irrigation system. Agric. Water Manag. 2020, 228, 105898. [Google Scholar] [CrossRef]
- Moncef, H.; Khemaies, Z. An analytical approach to predict the moistened bulb volume beneath a surface point source. Agric. Water Manag. 2016, 166, 123–129. [Google Scholar] [CrossRef]
- Li, J.; Jin, H.; Wang, C.; Wang, H. A new method of estimating soil water diffusivity based on variation in the wetting front position and on the principle of stationary action. J. Hydrol. 2022, 612, 128290. [Google Scholar] [CrossRef]
- Karimi, B.; Mohammadi, P.; Sanikhani, H.; Salih, S.Q.; Yaseen, Z.M. Modeling wetted areas of moisture bulb for drip irrigation systems: An enhanced empirical model and artificial neural network. Comput. Electron. Agric. 2020, 178, 105767. [Google Scholar] [CrossRef]
- Fan, Y.; Zhang, C.; Tang, X.; Shi, J.; Liang, J. An Improved Dimensional Model for Calculating the Wetting Pattern in Soil under Drip Irrigation. J. Irrig. Drain. Eng. 2023, 149, 4023020. [Google Scholar] [CrossRef]
- Vishwakarma, D.K.; Kumar, R.; Abed, S.A.; Al-Ansari, N.; Kumar, A.; Kushwaha, N.L.; Yadav, D.; Kumawat, A.; Kuriqi, A.; Alataway, A.; et al. Modeling of soil moisture movement and wetting behavior under point-source trickle irrigation. Sci. Rep. 2023, 13, 14981. [Google Scholar] [CrossRef]
- Vidana Gamage, D.N.; Biswas, A.; Strachan, I.B. Actively heated fiber optics method to monitor three-dimensional wetting patterns under drip irrigation. Agric. Water Manag. 2018, 210, 243–251. [Google Scholar] [CrossRef]
- Al-Ogaidi, A.A.M.; Wayayok, A.; Rowshon, M.K.; Abdullah, A.F. Wetting patterns estimation under drip irrigation systems using an enhanced empirical model. Agric. Water Manag. 2016, 176, 203–213. [Google Scholar] [CrossRef]
- Subbaiah, R. A review of models for predicting soil water dynamics during trickle irrigation. Irrig. Sci. 2013, 31, 225–258. [Google Scholar] [CrossRef]
- Malek, K.; Peters, R.T. Wetting Pattern Models for Drip Irrigation: New Empirical Model. J. Irrig. Drain. Eng. 2011, 137, 530–536. [Google Scholar] [CrossRef]
- Shen, Q.; Liu, Z.; Wang, Z.; Li, H. Simulation of the soil wetting shape under porous pipe sub-irrigation using dimensional analysis. Irrig. Drain. 2007, 56, 389–398. [Google Scholar]
- Solat, S.; Maroufpoor, E.; Karimi, B. Simulation of moisture redistribution pattern on sloping lands under drip irrigation system. J. Water Soil Conserv. 2021, 28, 89–108. [Google Scholar]
- Kisi, O.; Khosravinia, P.; Heddam, S.; Karimi, B.; Karimi, N. Modeling wetting front redistribution of drip irrigation systems using a new machine learning method: Adaptive neuro- fuzzy system improved by hybrid particle swarm optimization—Gravity search algorithm. Agric. Water Manag. 2021, 256, 107067. [Google Scholar] [CrossRef]
- Najib, A.; Orfi, J.; Alansary, H.; Ali, E. Application of the Buckingham π Theorem to Model the Multiple Effect Vacuum Membrane Distillation. J. Therm. Sci. Eng. Appl. 2021, 14, 31003. [Google Scholar] [CrossRef]
- Zamani, S.; Ostad-Ali-Askari, K.; Nafchi, R.F.; Provenzano, G. Assessing a semi-empirical model performance to predict the wetting patterns in subsurface drip irrigation. Clean. Water 2024, 1, 100020. [Google Scholar] [CrossRef]
- Fan, Y.; Yang, Z.; Wei, H. Establishment and verification of the prediction model of soil wetting pattern size in vertical moistube irrigation. Water Supply 2021, 21, 331–343. [Google Scholar] [CrossRef]
- García-Barrachina, L.; Gámez, A.J. Dimensional Analysis of Superplastic Processes with the Buckingham Π Theorem. Metals 2020, 10, 1575. [Google Scholar] [CrossRef]
- Yao, B. Study on Rules and Rugulation of Soil Water-Heat-Salt Spatiotemporal Transfer Under No Winter and Spring Irrigation Cotton Field in Southern Xinjiang. Ph.D. Thesis, China Agricultural University, Beijing, China, 2017. [Google Scholar]
- Zhang, M.; Li, Q.; Shi, X. Soil Science and Agricultural Science; China Water Conservancy and Hydropower Press: Beijing, China, 2007. [Google Scholar]
- Maller, A.; Rezende, R.; Freitas, P.S.L.d.; Seron, C.C.; Hachmann, T.L. Moisture in the soil profile with water applications using pulse drip irrigation. Rev. Ciência Agronômica 2019, 50, 234–241. [Google Scholar] [CrossRef]
- Liu, X.; Yang, D.; Gao, P.; Zhang, Q.; Zhao, Y.; Zhang, Y. Infiltration rules of moderate saline-alkali soil under intermittent combined irrigation. J. Drain. Irrig. Mech. Eng. 2019, 37, 1082–1087. [Google Scholar]
- Wang, C.; Cao, W.; Ma, B.; Li, Z. Analysis and Simulation of Influencing Factors on Soil Saturated Hydraulic Conductivity under Composite Infiltration of Herbaceous Plants with Different Root Architectures and Shrubs. Bull. Soil Water Conserv. 2023, 43, 10–16+43. [Google Scholar]
- Zhong, Y. Study on the Mechanism and Influencing Factors of Infiltration Reduction Under the Border Irrigationand the Film-Hole Irrigation with Muddy Water. Ph.D. Thesis, Xi’an University of Technology, Xi’an, China, 2020. [Google Scholar]
- Liu, J.; Bi, Y.; Sun, X.; Guo, X.; Ma, J.; Yan, Y. Research on infiltration characteristics and soil water-salt distribution under alternate water supply conditions. J. Irrig. Drain. 2015, 34, 55–60. [Google Scholar]
- Chen, S.; Mao, X. Quantitative characterization of soil wetting pattern under surface drip irrigation. J. Agric. Mech. 2018, 49, 285–292. [Google Scholar]
- Su, L.; Lin, S.; Wang, Q.; Wang, K. The impact of soil hydraulic parameters on the wetting pattern shape under point source infiltration. Trans. Chin. Soc. Agric. Eng. 2020, 51, 264–274. [Google Scholar]
- Bai, X.; Ai, D.; Yang, H.; Ge, Y.; Xing, Z.; Hu, X.; Zhou, S. Characteristics of soil wetting pattern and effectiveness evaluation under different initial soil water contents and dripper flow rates in drip irrigation. J. Irrig. Drain. 2019, 38, 73–78. [Google Scholar]
- Wang, H.; Zhang, Y.; Dong, P. The impact of soil compaction on the redistribution of soil water under single point source infiltration. J. Arid Land Resour. Environ. 2019, 33, 146–151. [Google Scholar]
- Li, S. Study of Sandy Soil Drip Irrigation Wetting Characteristic on Different Soil Available Water Boundaries Based on HYDRUS Model. Master’s Thesis, Northwest A&F University, Xianyang, China, 2017. [Google Scholar]
- Assouline, S. Infiltration into soils: Conceptual approaches and solutions. Water Resour. Res. 2013, 49, 1755–1772. [Google Scholar] [CrossRef]
- Castellini, M.; Di Prima, S.; Giglio, L.; Leogrande, R.; Alagna, V.; Autovino, D.; Rinaldi, M.; Iovino, M. Applying a Comprehensive Model for Single-Ring Infiltration: Assessment of Temporal Changes in Saturated Hydraulic Conductivity and Physical Soil Properties. Water 2024, 16, 2950. [Google Scholar] [CrossRef]
- Zhang, Y.; Schaap, M.G. Estimation of saturated hydraulic conductivity with pedotransfer functions: A review. J. Hydrol. 2019, 575, 1011–1030. [Google Scholar] [CrossRef]
- Šimůnek, J.; van Genuchten, M.T.; Šejna, M. Development and Applications of the HYDRUS and STANMOD Software Packages and Related Codes. Vadose Zone J. 2008, 7, 587–600. [Google Scholar] [CrossRef]
- Vigo, Á.D.; Zubelzu, S.; Juana, L. Infiltration models and soil characterisation for hemispherical and disc sources based on Green-Ampt assumptions. J. Hydrol. 2021, 595, 125966. [Google Scholar] [CrossRef]
- del Vigo, Á.; Zubelzu, S.; Juana, L. Numerical routine for soil water dynamics from trickle irrigation. Appl. Math. Model. 2020, 83, 371–385. [Google Scholar] [CrossRef]
Disclaimer/Publisher’s Note: The statements, opinions and data contained in all publications are solely those of the individual author(s) and contributor(s) and not of MDPI and/or the editor(s). MDPI and/or the editor(s) disclaim responsibility for any injury to people or property resulting from any ideas, methods, instructions or products referred to in the content. |
© 2024 by the authors. Licensee MDPI, Basel, Switzerland. This article is an open access article distributed under the terms and conditions of the Creative Commons Attribution (CC BY) license (https://creativecommons.org/licenses/by/4.0/).

