Life Cycle Prediction of Airport Operation Based on System Dynamics


Abstract
1. Introduction
2. Materials and Methods
2.1. Study Area and Data Sources
2.2. Airport Operation Life Cycle Prediction Model
2.3. System Dynamics Prediction Module
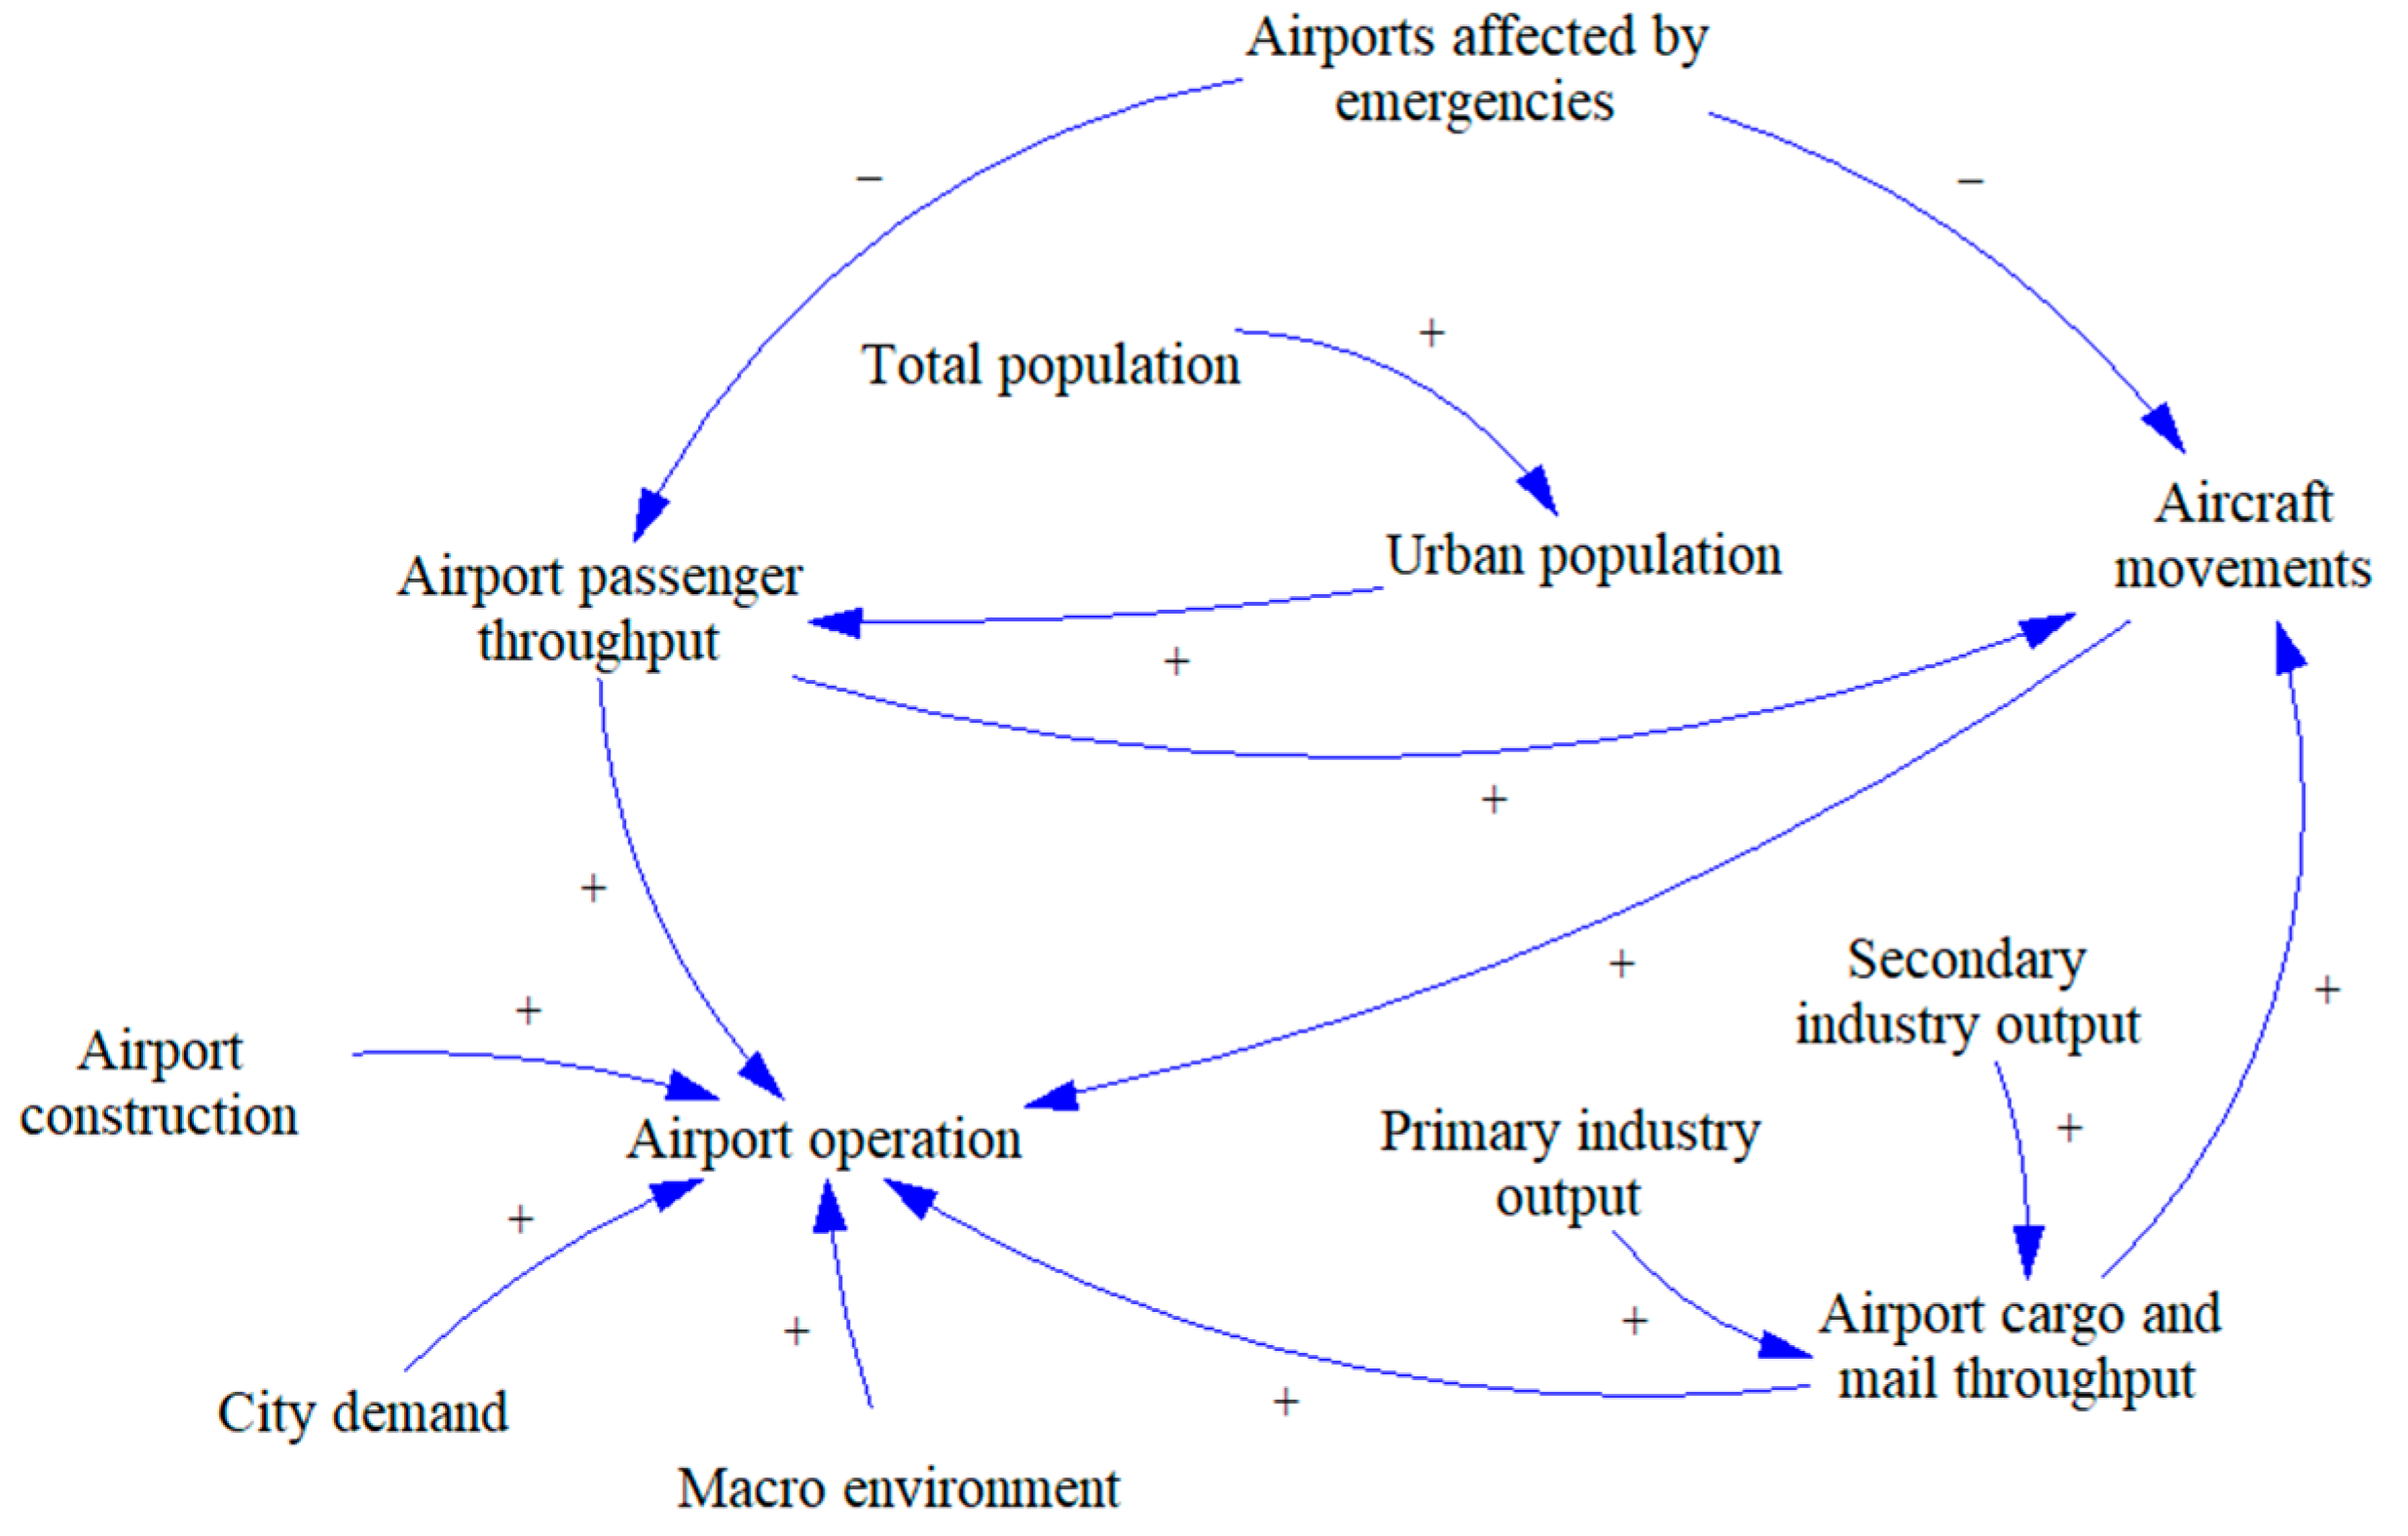
2.3.1. Causal Loop Diagram
- (1)
- Airport Operation Subsystem
- (2)
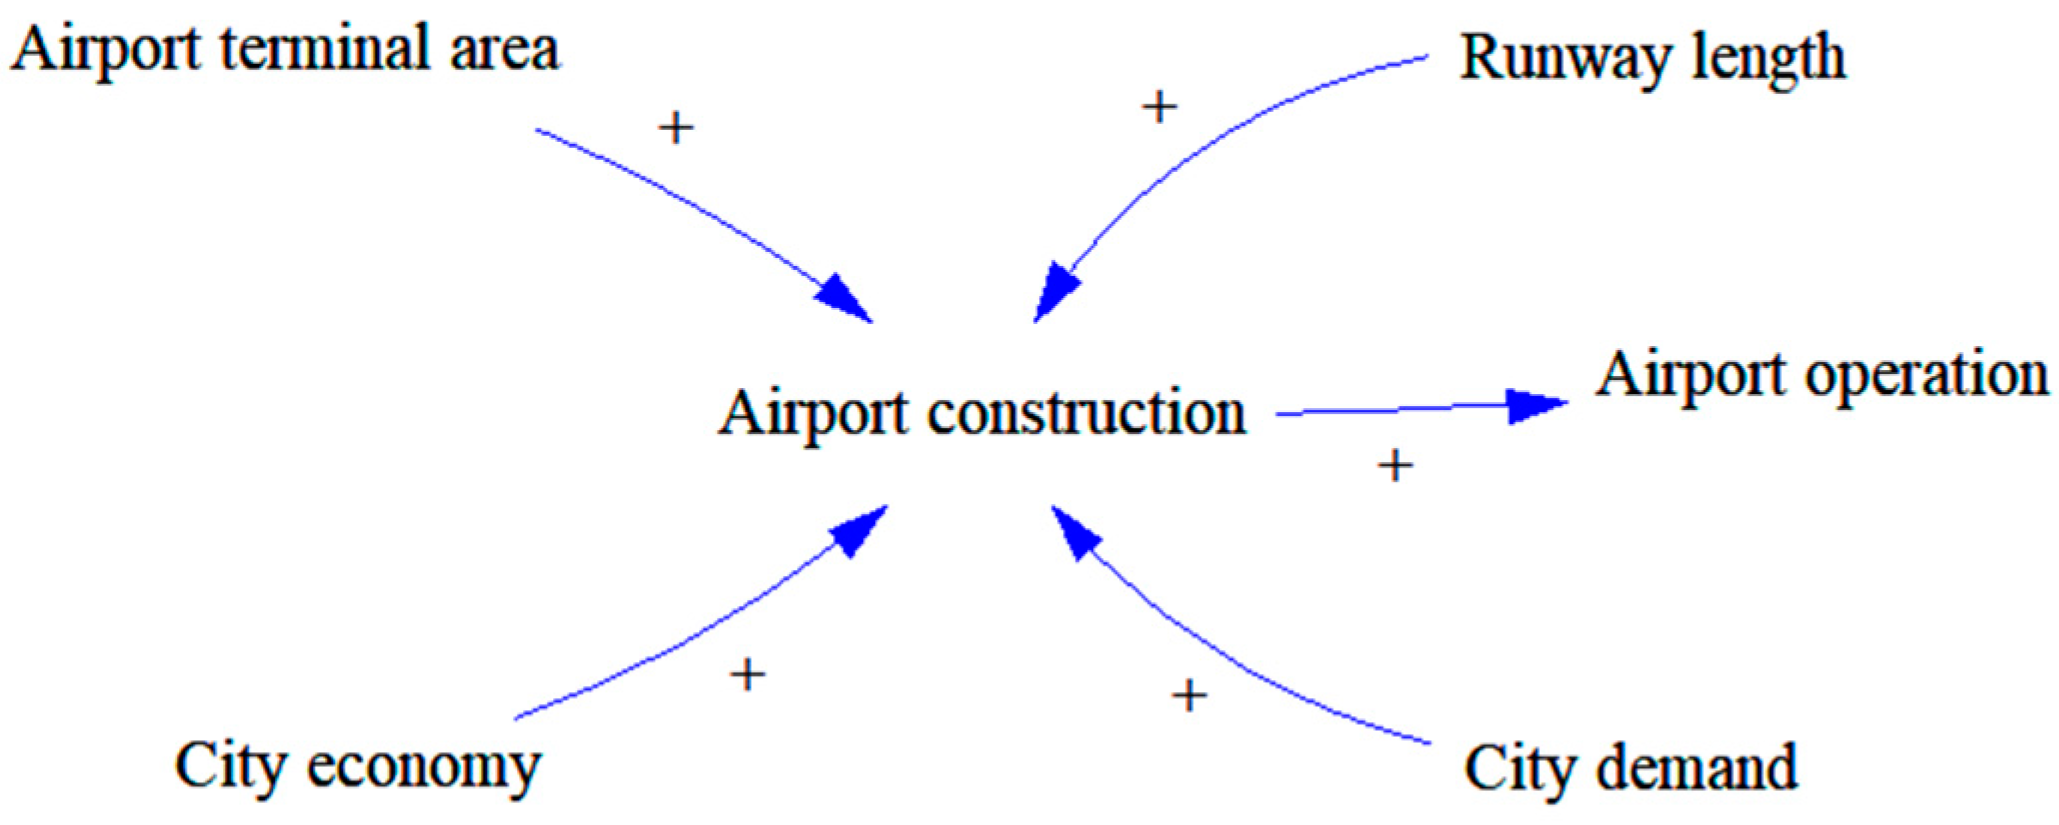
- Airport Construction Subsystem
- (3)
- City Economy Subsystem
- (4)
- City Demand Subsystem
- (5)
- Macro-environment Subsystem
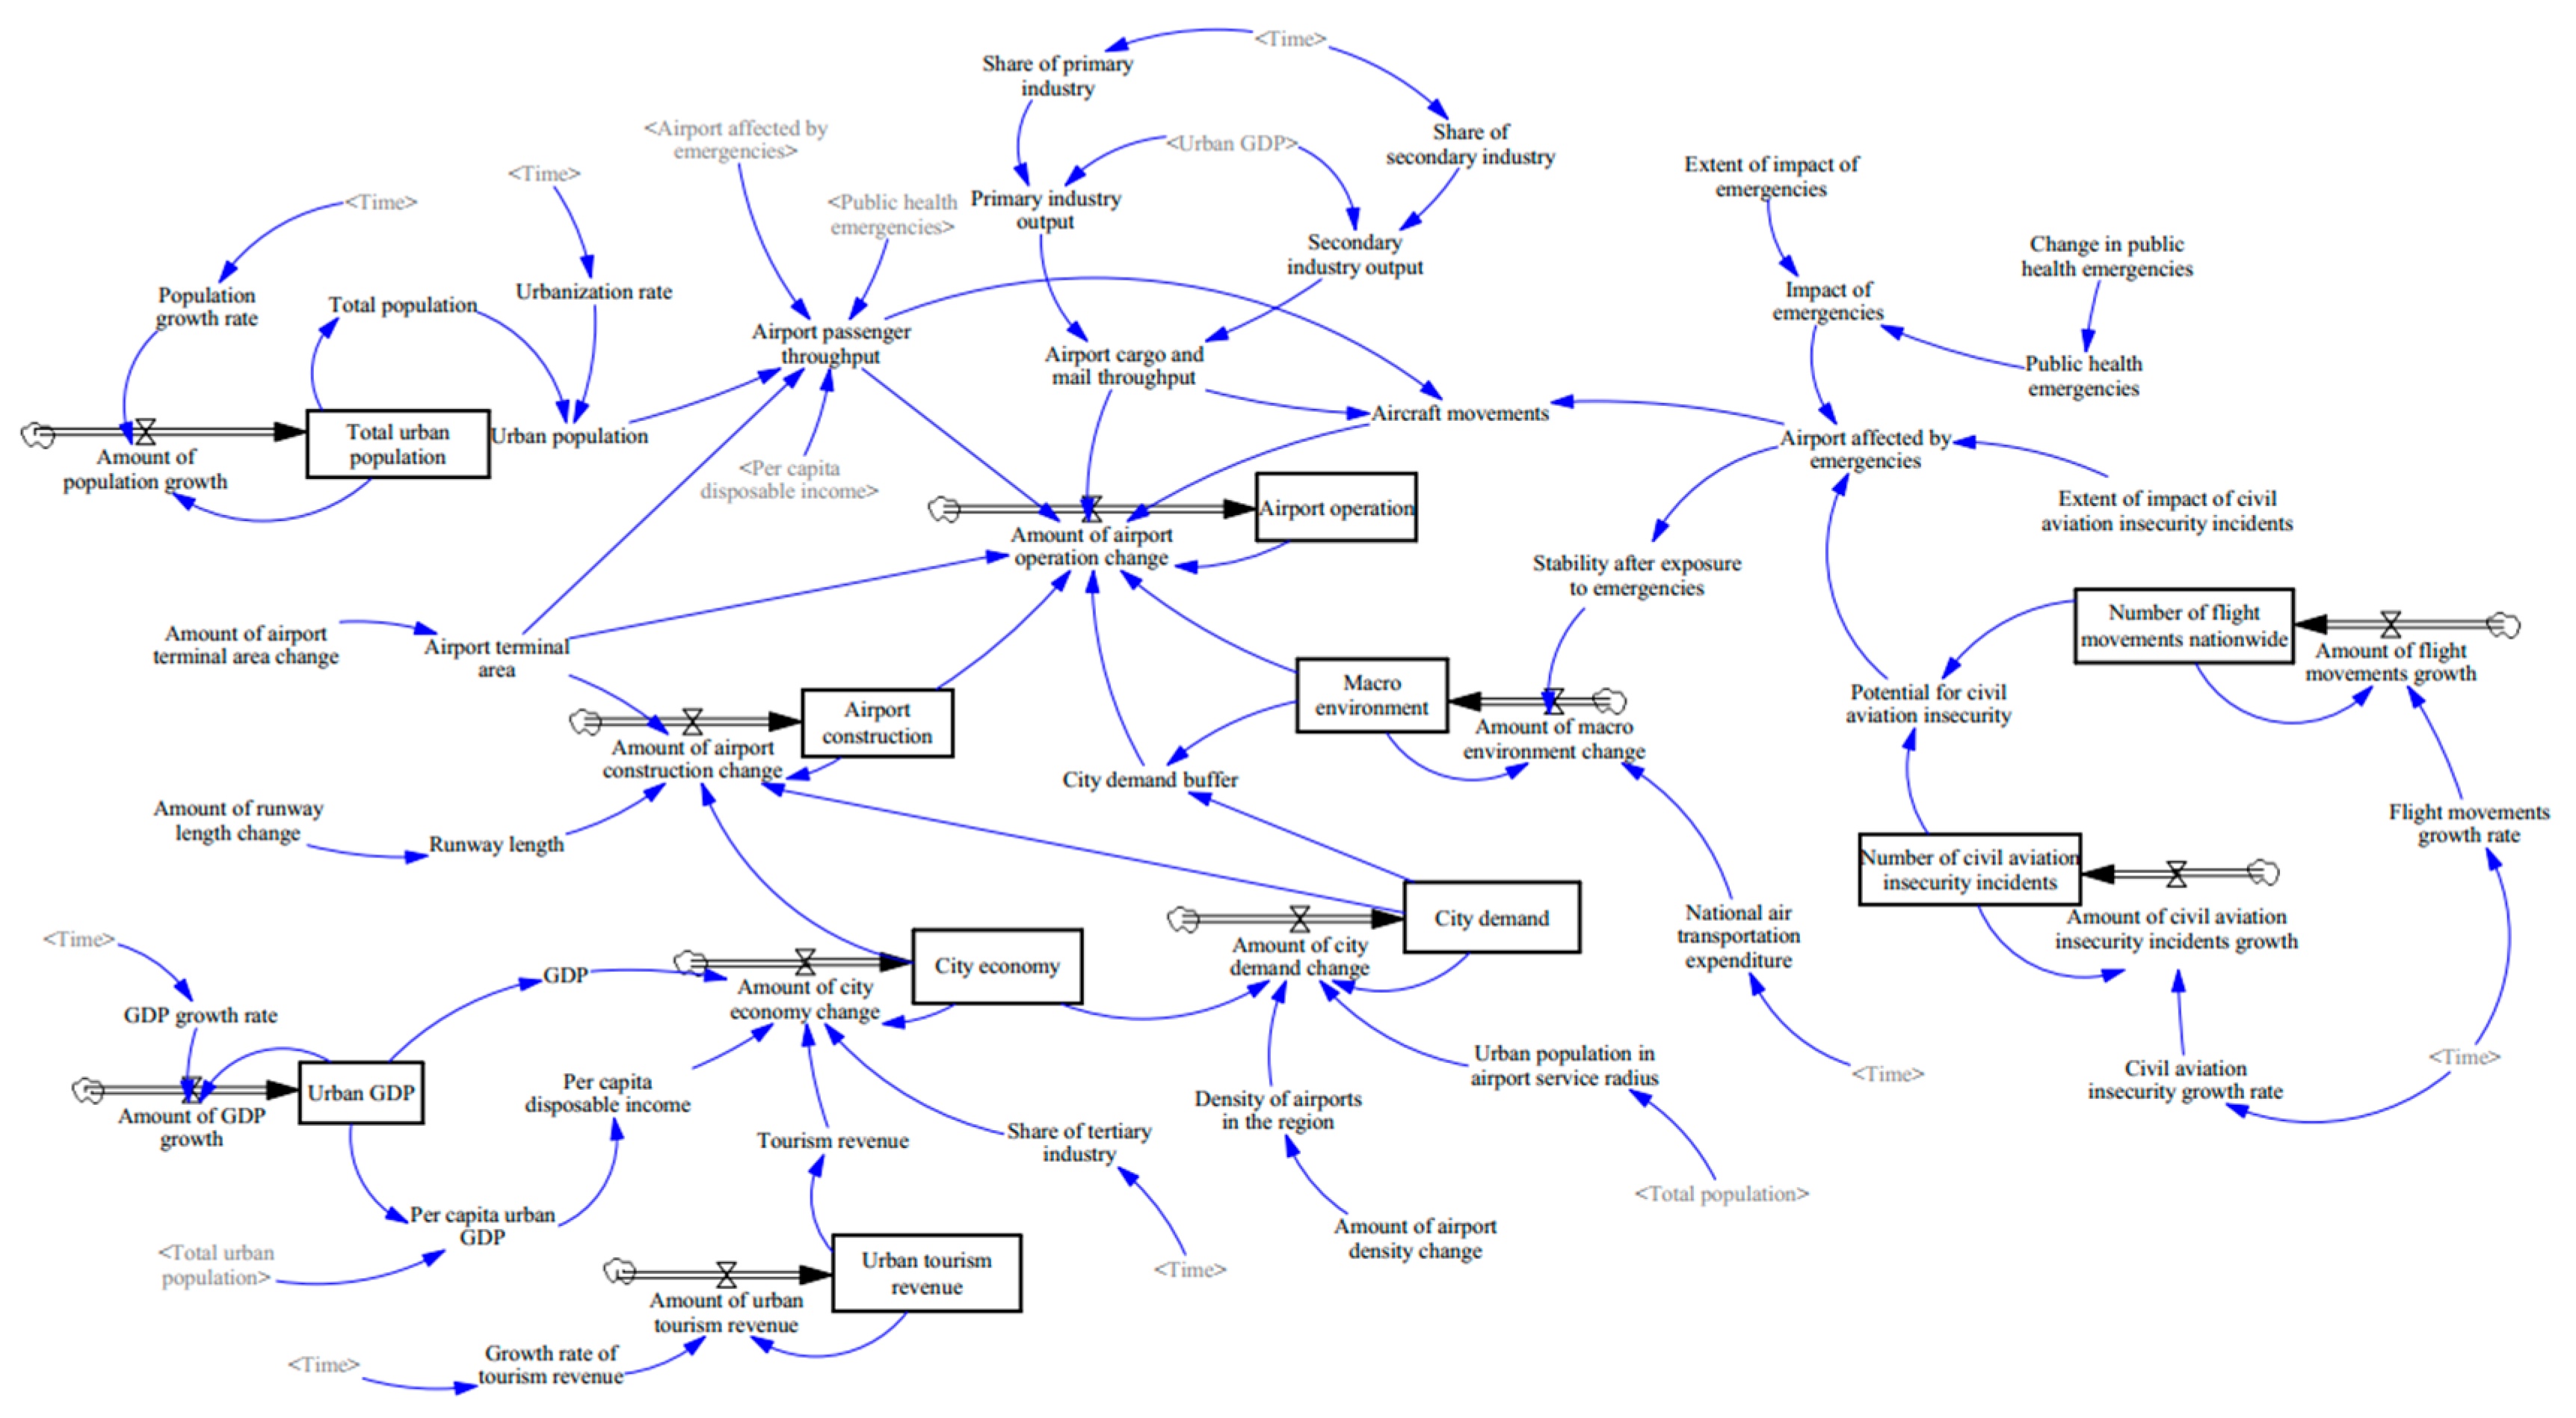
2.3.2. System Flow Diagram and Mathematical Equations
System Flow Diagram
Mathematical Equations
- (1)
- Mathematical Equations Between Subsystems
- (2)
- Mathematical Equations Between Variables
- (3)
- Prediction of time varying variables
2.3.3. Model Test
2.3.4. Airport Operation Scenarios
2.4. Logistic Model Stage Division Module
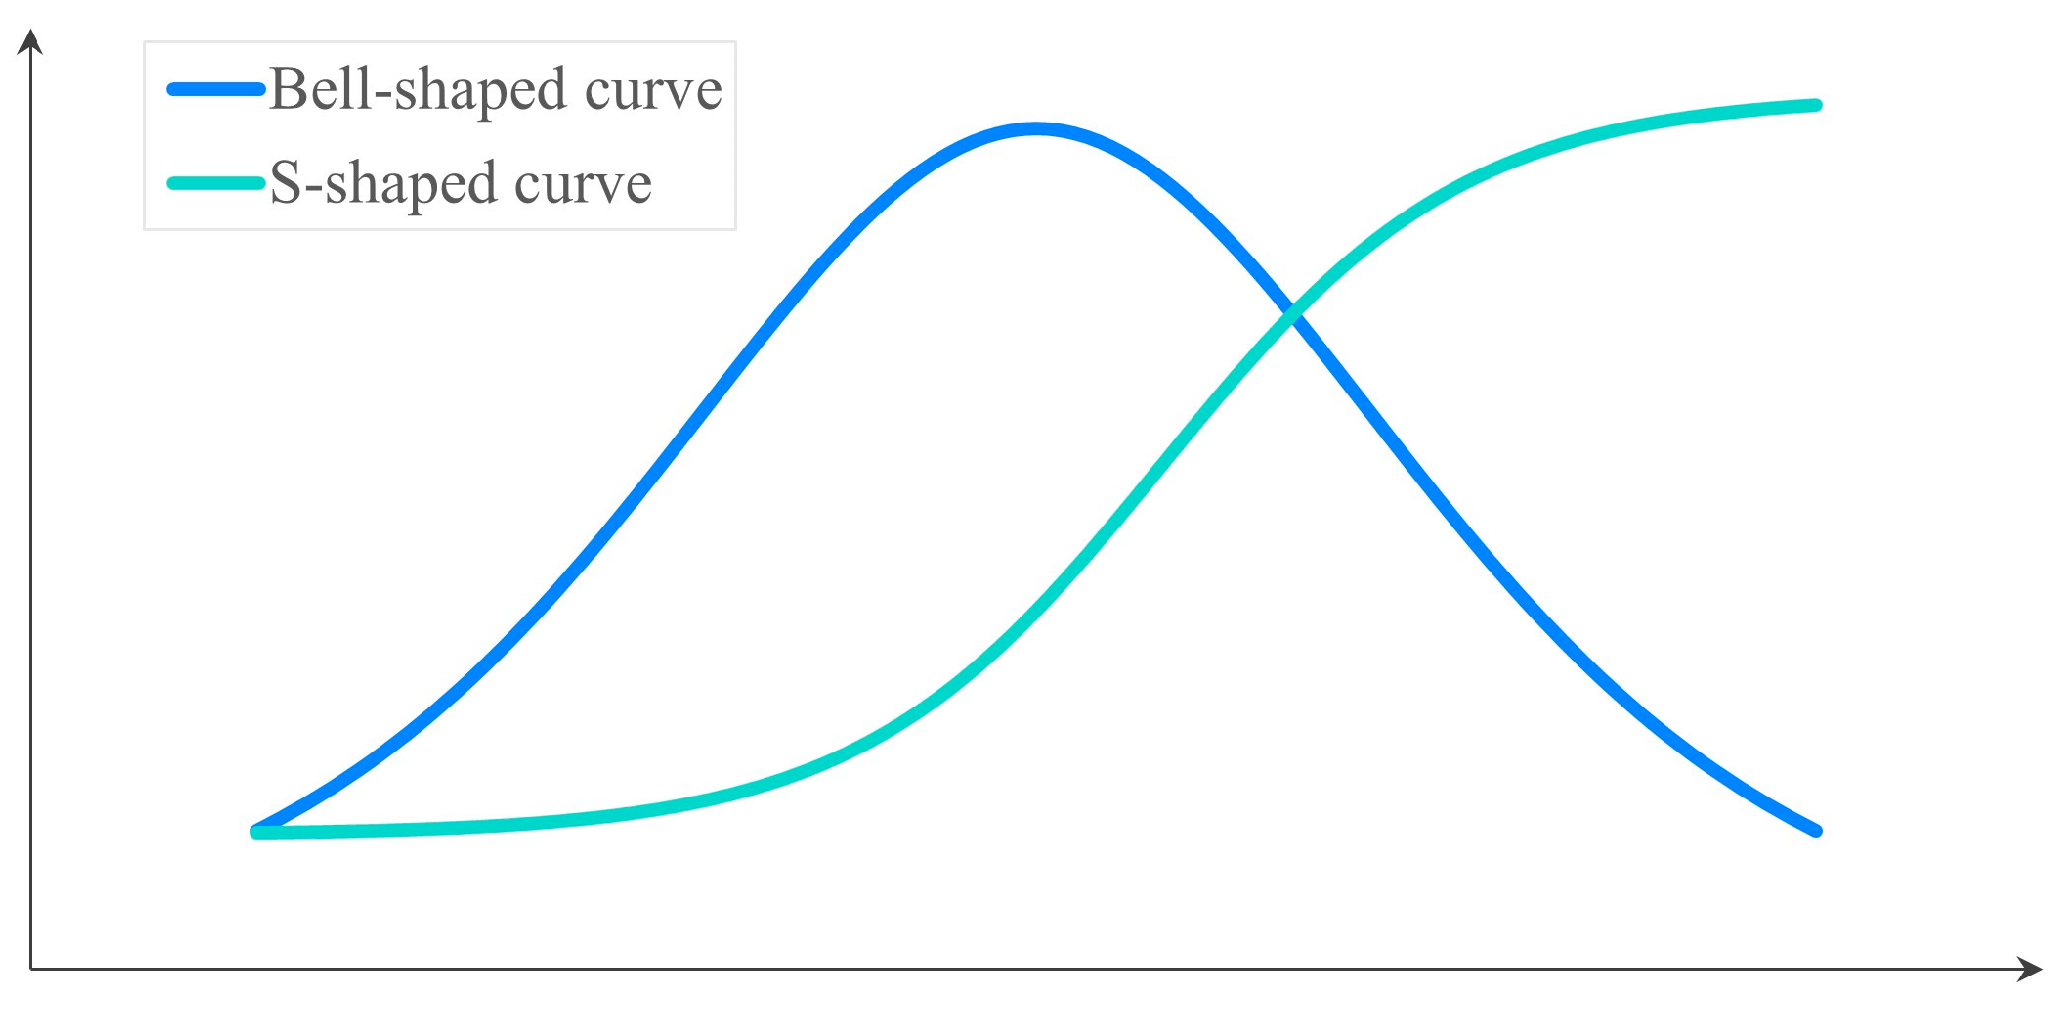
2.4.1. S-Shaped Logistic Modeling
- (1)
- Model Equation
- (2)
- Stage Division
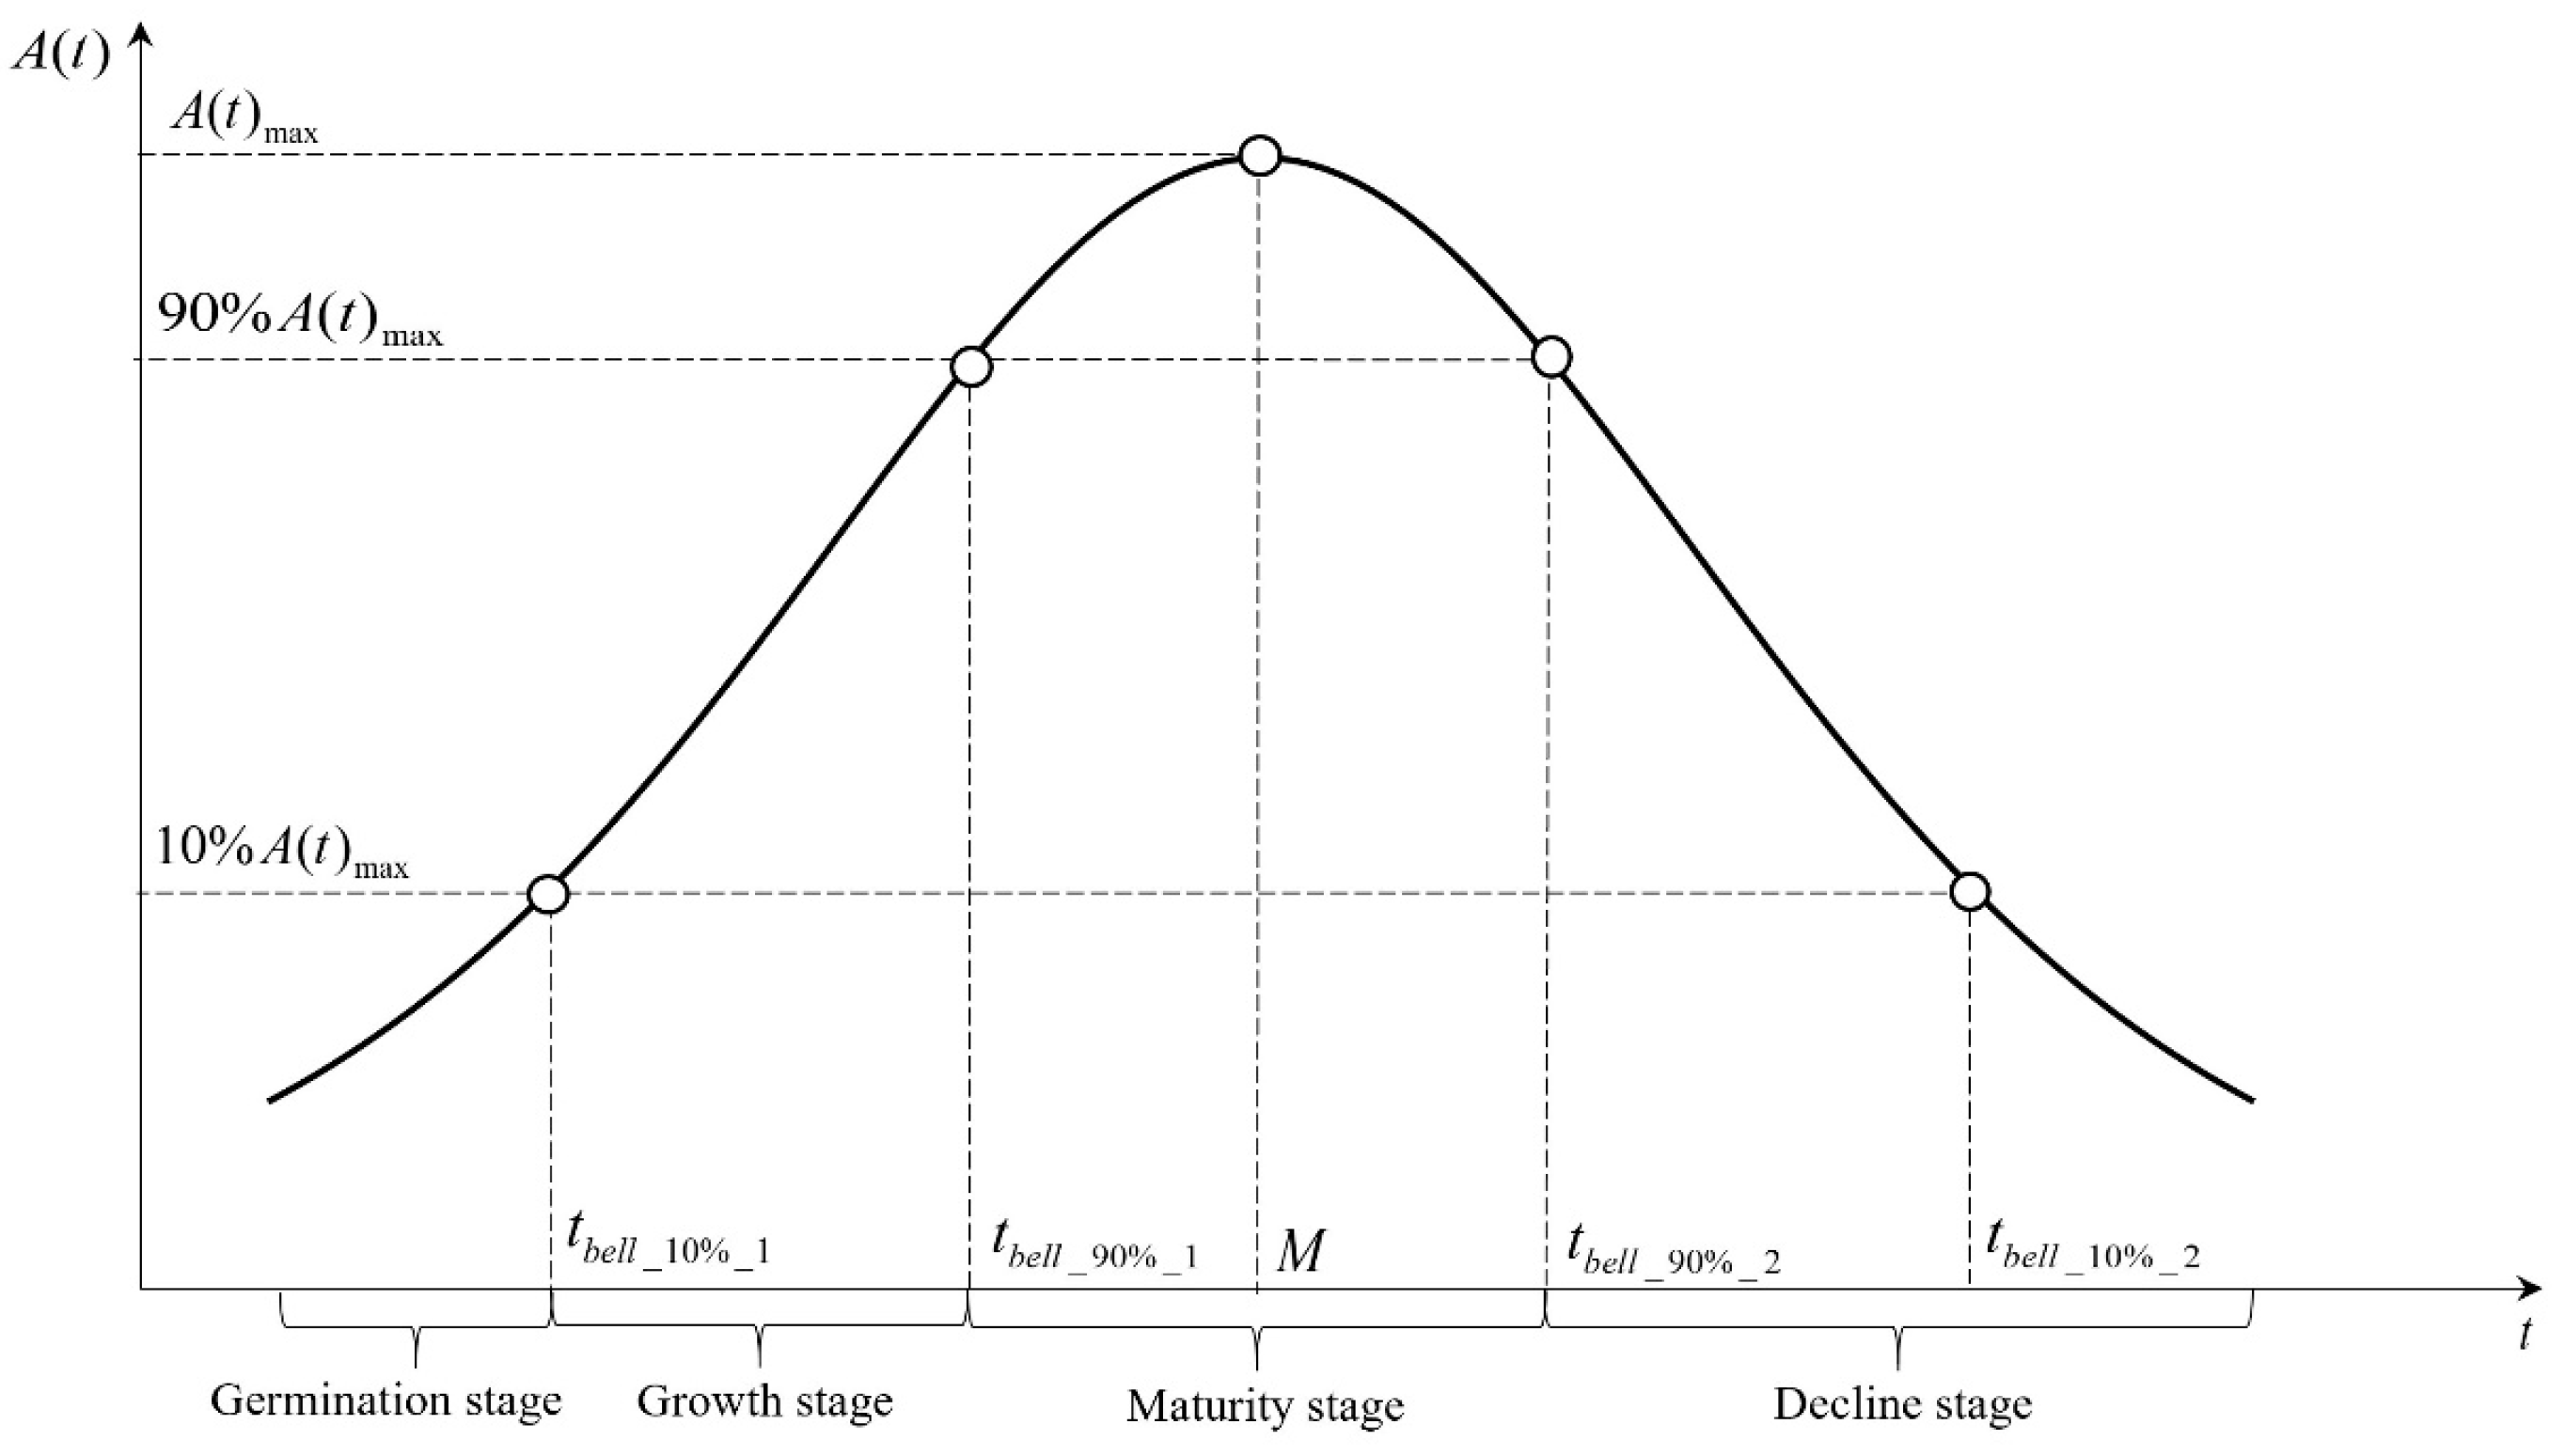
2.4.2. Bell-Shaped Logistic Modeling
- (1)
- Model Equation
- (2)
- Stage Division
3. Results
3.1. System Dynamics Model Predictions
3.1.1. Standard Scenario Simulation
3.1.2. Multi-Scenario Simulations
3.2. Airport Operation Life Cycle Stage Division
3.2.1. Standard Scenario Life Cycle Stages
3.2.2. Multi-Scenario Life Cycle Stage Division
4. Discussion
4.1. Mechanisms for Influencing Factors at Different Levels of Airport Operation
4.2. Policy Recommendations
- Comprehensive airport operation indicators should be incorporated into airport development plans. In the evaluation of airport operations, single indicators such as throughput and delay time only describe specific aspects and fail to capture the overall performance of airport operations. Therefore, in addition to setting individual planning goals for airport operations, comprehensive goals should also be established. For instance, using airport operational capacity, influenced by various factors, as a comprehensive indicator to measure airport development. Setting specific goals will promote the coordinated and sustainable development of airports.
- Airport development planning should prioritize identifying the stages of airport operation development. The different development states of airport operations are shaped by multiple factors. According to the life cycle of airport operations, the characteristics and needs of airports vary at different stages of development. Therefore, specific development plans should be formulated for each stage, addressing the unique requirements of each phase and refining the operational tasks accordingly to further enhance airport operational capacity.
- Airport development planning should emphasize strengthening the connection between city and airport operations. At the current stage, the city’s economy, as the primary external driver of the airport operation system, has a significant impact on airport operations. Therefore, planning should reflect the integration of city and airport development, fully exploring the city’s role in promoting airport operations while laying the groundwork for the future integration of both systems.
- Airport development planning should incorporate response measures for unexpected situations and dynamically adjust development strategies accordingly. In today’s complex and rapidly changing external environment, unexpected situations can significantly impact airport operations. If the airport is unable to effectively respond, it may experience prolonged stagnation, hindering the achievement of airport development goals. Therefore, a detailed contingency plan should be included in airport development planning to address potential emergencies, ensuring the stability and continuity of airport operations.
5. Conclusions
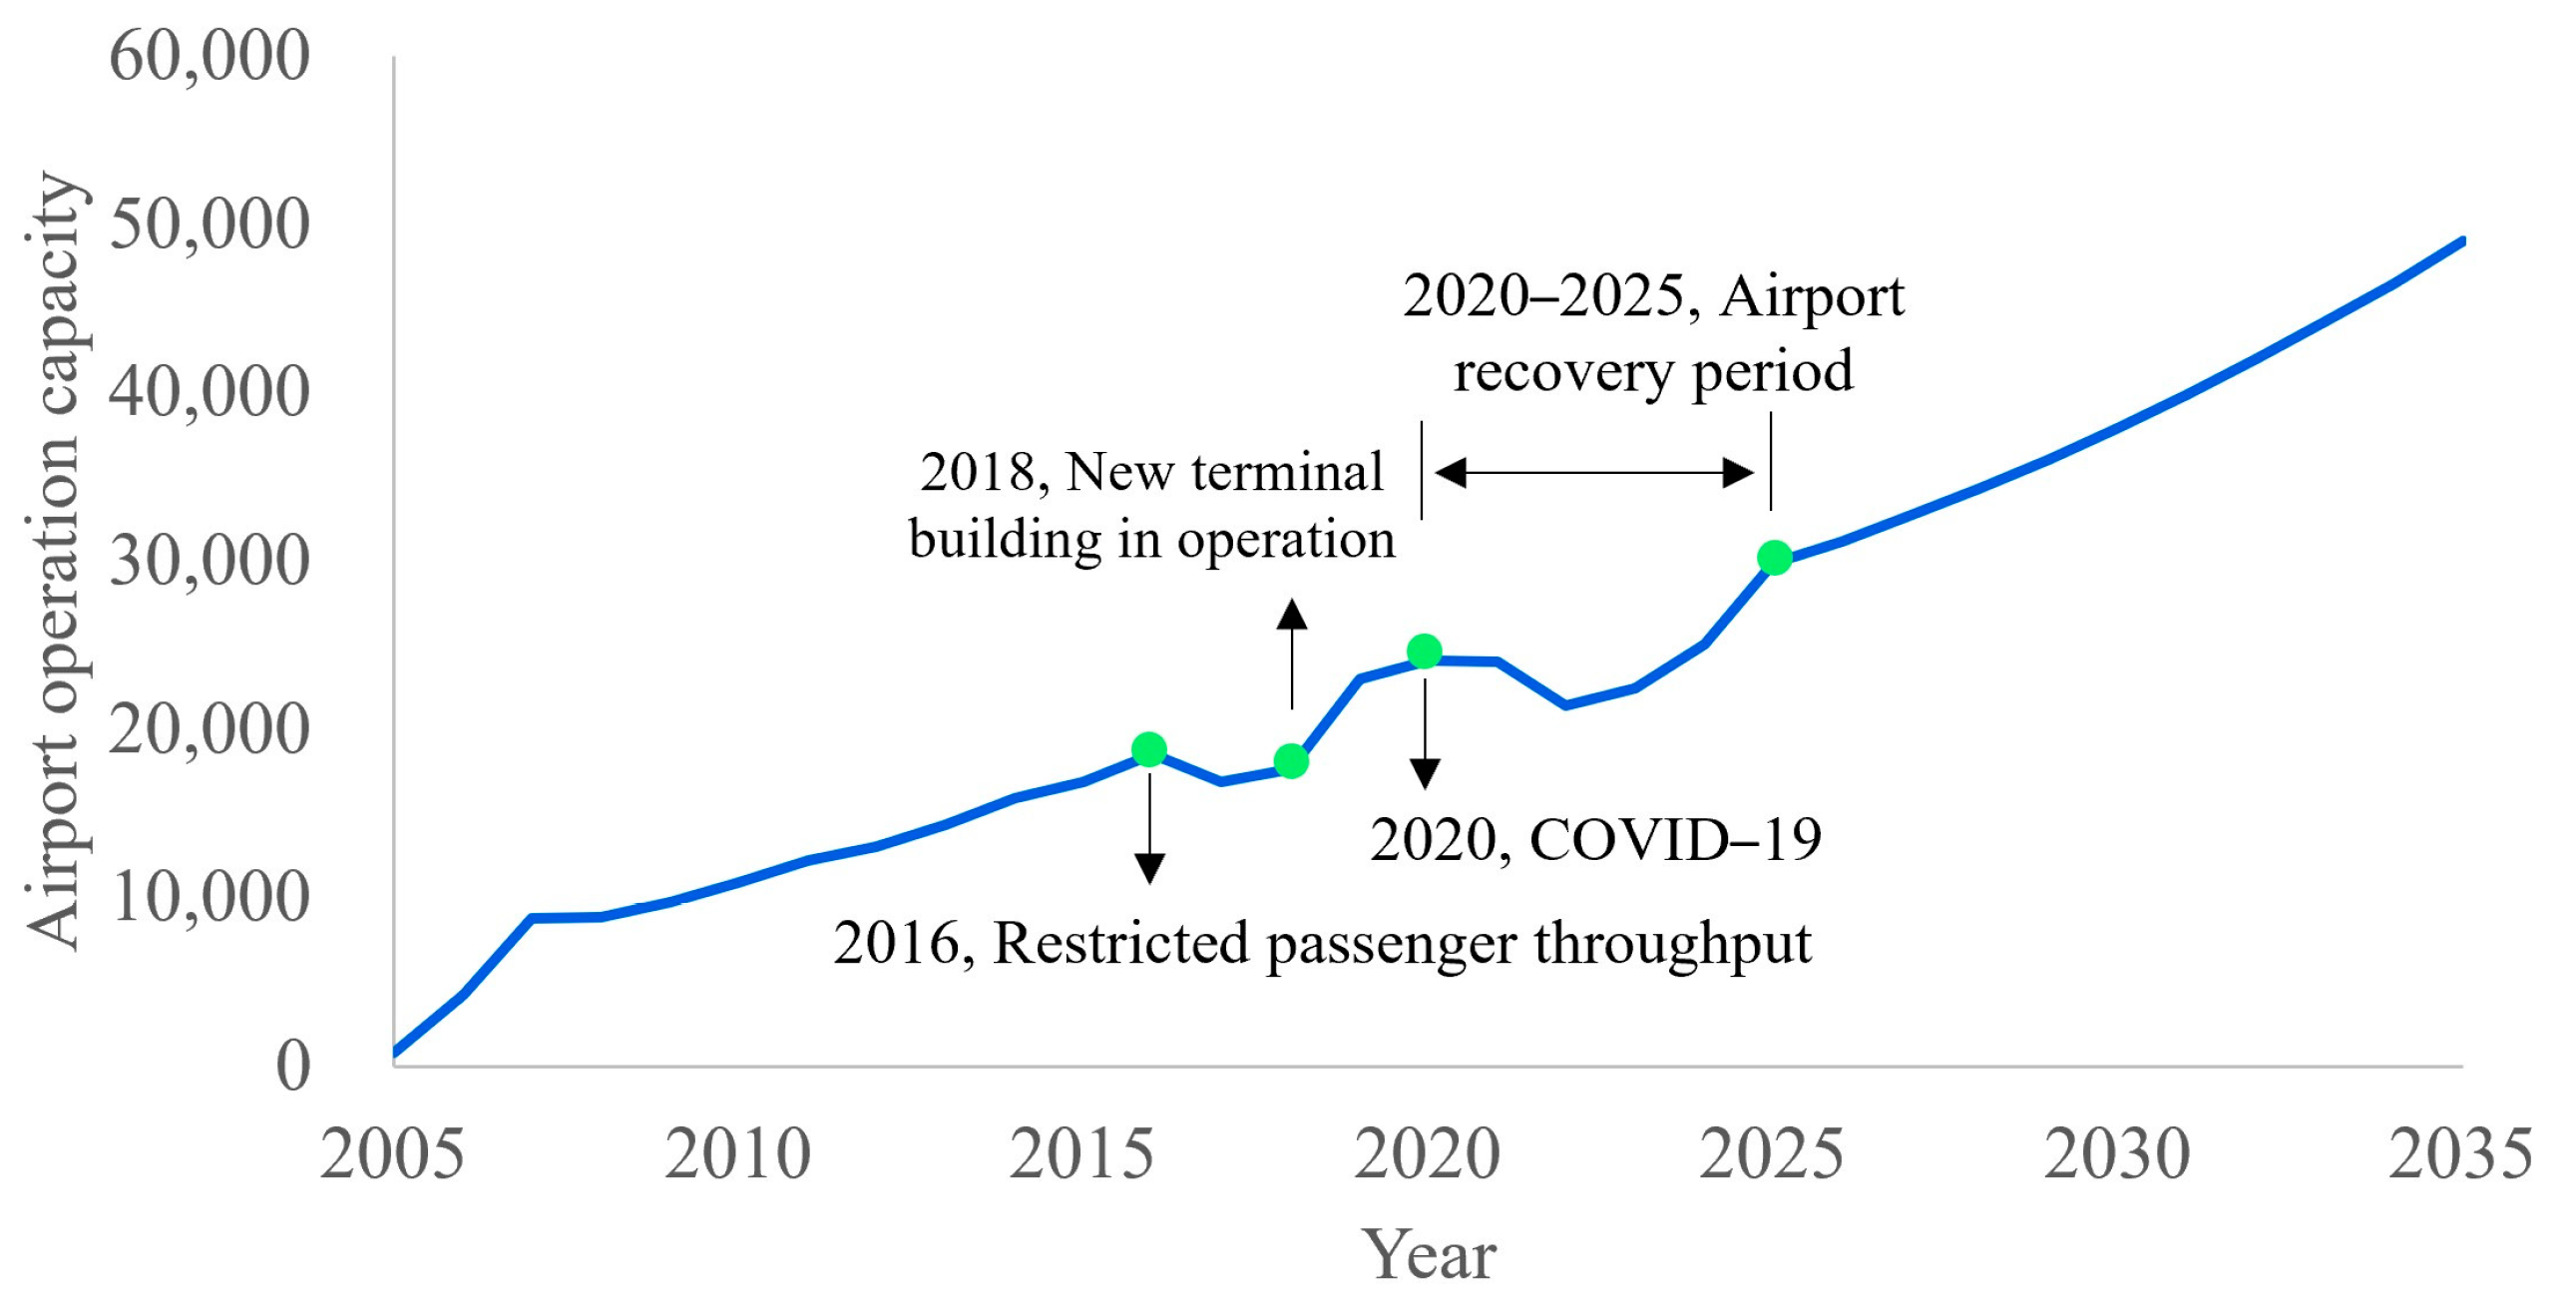
- The operational capacity of Guangzhou Baiyun International Airport shows an overall upward trend, with two declines observed in 2016 and 2020. The decline in operational capacity in 2016 was due to limitations in passenger throughput caused by the size of the terminal building. The capacity returned to an upward trend in 2018 when the expanded terminal building was put into use. The decline in operational capacity in 2020 was caused by a drop in city demand for airport services due to emergencies. Airport operations gradually recovered as the impact of the emergencies diminished.
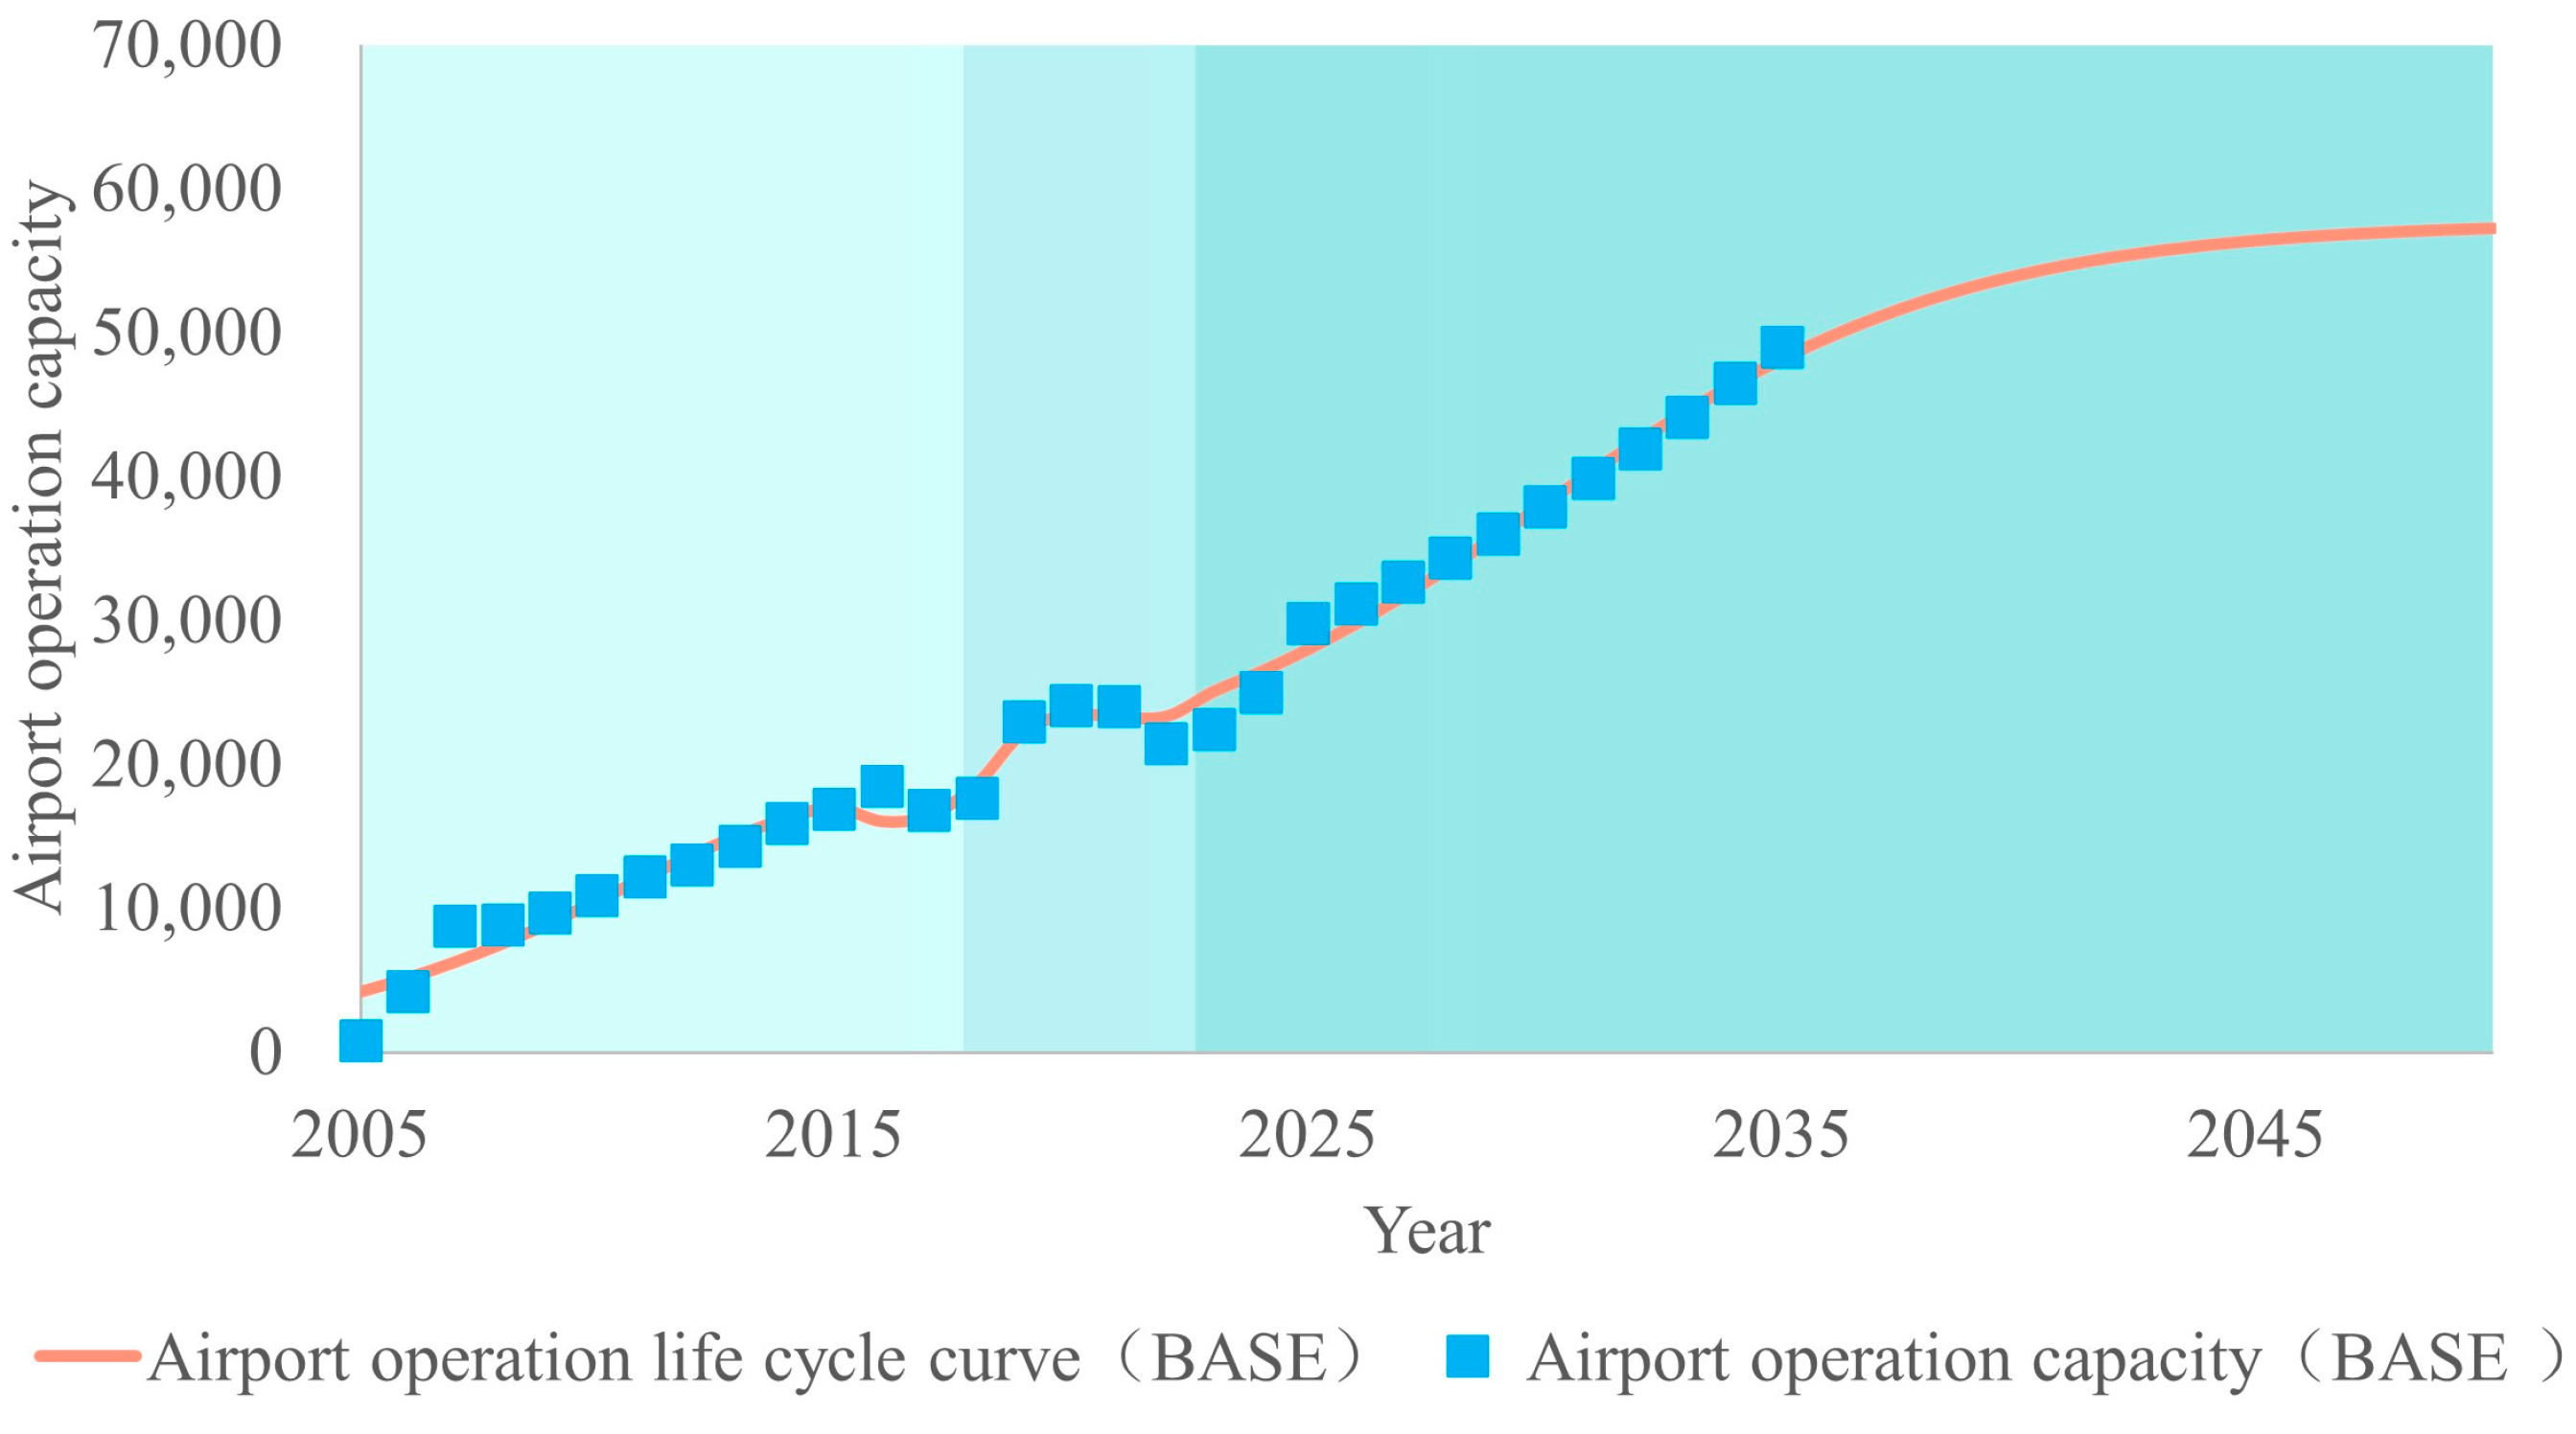
- Based on Logistic curve modeling to predict the operational trend from 2005 to 2050, Guangzhou Baiyun International Airport exhibits three life cycle phases under the standard scenario, reflecting multiple life cycle characteristics. The first and second life cycles follow bell-shaped curves, while the third phase follows an S-shaped curve. Airport operations are in the growth phase from 2022 to 2040, with the rate of change in operational capacity peaking in 2030 and entering the maturity phase around 2040.
- The simulations of airport operations under different scenarios reveal that fluctuations in the city’s economy have a significant impact on changes in airport operations. However, this factor only affects the value of airport operational capacity and does not alter the overall trend in airport operations. In contrast, the occurrence of emergencies can disrupt the airport operation life cycle and accelerate its transition to the next phase.
Author Contributions
Funding
Institutional Review Board Statement
Informed Consent Statement
Data Availability Statement
Conflicts of Interest
References
- Hu, R.; Feng, H.; Witlox, F.; Zhang, J.; Connor, K.O. Airport capacity constraints and air traffic demand in China. J. Air Transp. Manag. 2022, 103, 102251. [Google Scholar] [CrossRef]
- Kwakkel, J.H.; Walker, W.E.; Marchau, V.A.W.J. Adaptive airport strategic planning. Eur. J. Transp. Infrastruct. Res. 2010, 10. [Google Scholar] [CrossRef]
- Sun, X.; Gollnick, V.; Wandelt, S. Robustness analysis metrics for worldwide airport network: A comprehensive study. Chin. J. Aeronaut. 2017, 30, 500–512. [Google Scholar] [CrossRef]
- Wan, L.; Peng, Q.; Wang, J.; Tian, Y.; Xu, C. Evaluation of airport sustainability by the synthetic evaluation method: A case study of Guangzhou Baiyun international airport, China, from 2008 to 2017. Sustainability 2020, 12, 3334. [Google Scholar] [CrossRef]
- Itani, N.; Mason, K. A macro-environment approach to civil aviation strategic planning. Transp. Policy 2014, 33, 125–135. [Google Scholar] [CrossRef]
- Prussi, M.; Laveneziana, L.; Misul, D.; Chiaramonti, D.; Odisio, M.; Restaldo, G. A model-based approach to long-term energy planning: The case-study of the Turin Airport. J. Phys. Conf. Ser. 2023, 2648, 012034. [Google Scholar] [CrossRef]
- Four Characteristics Airport Development Guidelines. Available online: https://www.gov.cn/xinwen/2020-11/04/5557258/files/9af3ba5d2eb84025a50820cb06ffa09a.pdf (accessed on 26 June 2024).
- Cheng, L. A Study of Green Airport’s Full Life Circle and Evaluation Index System; Civil Aviation University of China: Tianjin, China, 2014. [Google Scholar]
- Azzam, M. Evolution of airports from a network perspective–An analytical concept. Chin. J. Aeronaut. 2017, 30, 513–522. [Google Scholar] [CrossRef]
- Hischier, R.; Reale, F.; Castellani, V.; Sala, S. Environmental impacts of household appliances in Europe and scenarios for their impact reduction. J. Clean. Prod. 2020, 267, 121952. [Google Scholar] [CrossRef]
- Ingrao, C.; Messineo, A.; Beltramo, R.; Yigitcanlar, T.; Ioppolo, G. How can life cycle thinking support sustainability of buildings? Investigating life cycle assessment applications for energy efficiency and environmental performance. J. Clean. Prod. 2018, 201, 556–569. [Google Scholar] [CrossRef]
- Onat, N.C.; Kucukvar, M.; Halog, A.; Cloutier, S. Systems thinking for life cycle sustainability assessment: A review of recent developments, applications, and future perspectives. Sustainability 2017, 9, 706. [Google Scholar] [CrossRef]
- Wang, Y.; Shuai, B.; Li, J. Life Cycle Assessment (LCA) of China’s railway network based on growth curve. J. Transp. Syst. Eng. Inf. Technol. 2015, 15, 23. [Google Scholar]
- Liu, Y.; Ju, W.; Zhao, J.; Gao, J.; Zheng, J.; Jiang, A. Product life cycle based demand forecasting by using artificial bee colony algorithm optimized two-stage polynomial fitting. J. Intell. Fuzzy Syst. 2016, 31, 825–836. [Google Scholar]
- Tattershall, E.; Nenadic, G.; Stevens, R.D. Modelling trend life cycles in scientific research using the Logistic and Gompertz equations. Scientometrics 2021, 126, 9113–9132. [Google Scholar] [CrossRef]
- Cherp, A.; Vinichenko, V.; Tosun, J.; Gordon, J.A.; Jewell, J. National growth dynamics of wind and solar power compared to the growth required for global climate targets. Nat. Energy 2021, 6, 742–754. [Google Scholar] [CrossRef]
- Zhang, B.; Yu, X.; Zhang, R. Emerging technology identification based on a dynamic framework: A lifecycle evolution perspective. Technol. Anal. Strateg. Manag. 2024, 36, 378–392. [Google Scholar] [CrossRef]
- Zhao, Y.; Wan, J. Analysis of development and evolution rules of civil aviation in China based on life cycle theory. PLoS ONE 2019, 14, e0212338. [Google Scholar] [CrossRef]
- Dong, J.; Xu, Y.; Hwang, B.-G.; Ren, R.; Chen, Z. The impact of underground logistics system on urban sustainable development: A system dynamics approach. Sustainability 2019, 11, 1223. [Google Scholar] [CrossRef]
- Wen, L.; Bai, L. System dynamics modeling and policy simulation for urban traffic: A case study in Beijing. Environ. Model. Assess. 2017, 22, 363–378. [Google Scholar] [CrossRef]
- Shepherd, S.P. A review of system dynamics models applied in transportation. Transp. B Transp. Dyn. 2014, 2, 83–105. [Google Scholar] [CrossRef]
- Rassaf, A.A.; Ostadi Jafari, M.; Javanshir, H. An Appraisal of sustainable urban transportation: Application of a system dynamics model. Int. J. Transp. Eng. 2014, 2, 47–66. [Google Scholar]
- Yu, B.; Zhang, C.; Kong, L.; Bao, H.-L.; Wang, W.-S.; Ke, S.; Ning, G. System dynamics modeling for the land transportation system in a port city. Simulation 2014, 90, 706–716. [Google Scholar] [CrossRef]
- Liu, P.; Liu, C.; Du, J.; Mu, D. A system dynamics model for emissions projection of hinterland transportation. J. Clean. Prod. 2019, 218, 591–600. [Google Scholar] [CrossRef]
- Du, Y.; Yang, C. Statistics and Fluctuation Characteristics Analysis of Civil Aviation Unsafe Events. J. Civ. Aviat. Flight Univ. China 2022, 33, 21–25. [Google Scholar]
- Peng, Q.; Wan, L.; Zhang, T.; Wang, Z.; Tian, Y. A system dynamics prediction model of airport environmental carrying capacity: Airport development mode planning and case study. Aerospace 2021, 8, 397. [Google Scholar] [CrossRef]
- Moradi, A.; Vagnoni, E. A multi-level perspective analysis of urban mobility system dynamics: What are the future transition pathways? Technol. Forecast. Soc. Chang. 2018, 126, 231–243. [Google Scholar] [CrossRef]
- Wan, L.; Peng, Q.; Zhang, T.; Wang, Z.; Tian, Y. Evaluation of Airport Environmental Carrying Capacity: A Case Study in Guangzhou Baiyun International Airport, China. Discret. Dyn. Nat. Soc. 2021, 2021, 5580313. [Google Scholar] [CrossRef]
- Severino, M.R.; De Moura, F.H.S.; Caetano, M. Airport competitiveness analysis from aircraft and passenger movement. J. Transp. Logist. 2020, 5, 143–157. [Google Scholar]
- Ren, J. Advanced Operations Management for Complex Systems Analysis; Springer International Publishing: Berlin/Heidelberg, Germany, 2020. [Google Scholar]
- Liang, X.; Li, J.; Liu, J.; Qiao, H.; Yin, H. Study on the Multilayer Airport System in China Based on Evaluation of Airport Competitiveness. Manag. Rev. 2016, 28, 116–126. [Google Scholar]
- Zhang, F.; Graham, D.J. Air transport and economic growth: A review of the impact mechanism and causal relationships. Transp. Rev. 2020, 40, 506–528. [Google Scholar] [CrossRef]
- Cui, Q.; Kuang, H.-B.; Wu, C.-Y.; Li, Y. Dynamic formation mechanism of airport competitiveness: The case of China. Transp. Res. Part A Policy Pract. 2013, 47, 10–18. [Google Scholar] [CrossRef]
- Jimenez, E.; Claro, J.; de Sousa, J.P. The airport business in a competitive environment. Procedia-Soc. Behav. Sci. 2014, 111, 947–954. [Google Scholar] [CrossRef]
- Tan, Y.; Jiao, L.; Shuai, C.; Shen, L. A system dynamics model for simulating urban sustainability performance: A China case study. J. Clean. Prod. 2018, 199, 1107–1115. [Google Scholar] [CrossRef]
- Zhang, Q.; Li, J. Building carbon peak scenario prediction in China using system dynamics model. Environ. Sci. Pollut. Res. 2023, 30, 96019–96039. [Google Scholar] [CrossRef]
- Du, L.; Li, X.; Zhao, H.; Ma, W.; Jiang, P. System dynamic modeling of urban carbon emissions based on the regional National Economy and Social Development Plan: A case study of Shanghai city. J. Clean. Prod. 2018, 172, 1501–1513. [Google Scholar] [CrossRef]
- Harris, T.M.; Devkota, J.P.; Khanna, V.; Eranki, P.L.; Landis, A.E. Logistic growth curve modeling of US energy production and consumption. Renew. Sustain. Energy Rev. 2018, 96, 46–57. [Google Scholar] [CrossRef]
- Banerjee, A.; Duflo, E.; Qian, N. On the road: Access to transportation infrastructure and economic growth in China. J. Dev. Econ. 2020, 145, 102442. [Google Scholar] [CrossRef]
- Kong, Z.; Guo, X.; Hou, J.; Dei, Y. Characters of Rail Transit Network Life Cycle in Big Cities. Urban Mass Transit 2013, 16, 32–38. [Google Scholar]


| Dependent Variables | Independent Variables | |
|---|---|---|
| Causal relationships between subsystems | Amount of airport construction change | Airport terminal area, Runway length, City demand, City economy, Airport construction. |
| Amount of city economy change | GDP, Per capita disposable income, Tourism revenue, Share of tertiary industry, City economy. | |
| Amount of city demand change | Density of airports in the region, Urban population in airport service radius, City economy, City demand. | |
| Amount of macro-environment change | Stability after exposure to emergencies, National air transportation expenditure, Macro-environment. | |
| City demand buffer | Macro-environment, City demand. | |
| Amount of airport operation change | Airport passenger throughput, Airport terminal area, Airport cargo and mail throughput, Aircraft movements, Macro-environment, City demand buffer, Airport construction, Airport operation. | |
| Causal relationships between variables | Airport passenger throughput | Public health emergency, Per capita disposable income, Urban population, Airport affected by emergencies, Airport terminal area. |
| Airport cargo and mail throughput | Primary industry output, Secondary industry output. | |
| Aircraft movements | Airport passenger throughput, Airport cargo and mail throughput, Airport affected by emergencies. | |
| Per capita disposable income | Per capita urban GDP. | |
| Urban population in airport service radius | Total population. |
| Year | Share of Primary Industry | Share of Secondary Industry | Share of Tertiary Industry | Population Growth Rate | Urbanization Rate | National Air Transportation Expenditure | Density of Airports in the Region | Growth Rate of Tourism Revenue |
|---|---|---|---|---|---|---|---|---|
| 2005 | 2.51 | 39.84 | 57.65 | −0.016996 | 0.8151 | 7.3326 | 3 | 0.1420 |
| 2006 | 2.10 | 40.31 | 57.59 | 0.049469 | 0.8204 | 7.6824 | 3 | 0.1210 |
| 2007 | 2.08 | 39.80 | 58.12 | 0.056539 | 0.8217 | 7.8410 | 3 | 0.1390 |
| 2008 | 1.85 | 39.15 | 59.00 | 0.059192 | 0.8223 | 7.4522 | 3 | 0.0500 |
| 2009 | 1.70 | 37.83 | 60.47 | 0.064223 | 0.8378 | 7.0670 | 3 | 0.1866 |
| 2010 | 1.58 | 38.09 | 60.33 | 0.070760 | 0.8379 | 6.1610 | 4 | 0.2621 |
| 2011 | 1.48 | 37.97 | 60.55 | 0.059294 | 0.8383 | 7.1370 | 4 | 0.2998 |
| 2012 | 1.41 | 36.17 | 62.42 | 0.051407 | 0.8385 | 6.7080 | 4 | 0.1719 |
| 2013 | 1.30 | 35.34 | 63.36 | 0.040063 | 0.8388 | 5.9270 | 4 | 0.1524 |
| 2014 | 1.24 | 35.00 | 63.76 | 0.038567 | 0.8397 | 6.6510 | 4 | 0.1450 |
| 2015 | 1.19 | 33.30 | 65.51 | 0.043119 | 0.8422 | 7.9560 | 4 | 0.1389 |
| 2016 | 1.16 | 31.32 | 67.52 | 0.052309 | 0.8435 | 9.0940 | 5 | 0.1201 |
| 2017 | 1.11 | 29.69 | 69.20 | 0.040450 | 0.8441 | 8.3150 | 5 | 0.1235 |
| 2018 | 1.09 | 29.09 | 69.82 | 0.029698 | 0.8475 | 11.8800 | 5 | 0.1090 |
| 2019 | 1.04 | 27.30 | 71.66 | 0.018397 | 0.8513 | 9.7440 | 5 | 0.1114 |
| 2020 | 1.14 | 26.79 | 72.07 | 0.023383 | 0.8619 | 2.7860 | 5 | 0.1204 |
| 2021 | 1.06 | 27.41 | 71.53 | 0.003751 | 0.8646 | 5.9662 | 5 | 0.1242 |
| 2022 | 1.10 | 27.43 | 71.47 | −0.004067 | 0.8648 | 9.7844 | 6 | 0.1245 |
| 2023 | 1.08 | 25.94 | 73.04 | −0.003306 | 0.8663 | 8.1846 | 6 | 0.1233 |
| 2024 | 1.00 | 24.98 | 73.99 | −0.002546 | 0.8682 | 7.3284 | 6 | 0.1215 |
| 2025 | 0.92 | 24.93 | 74.15 | −0.001785 | 0.8708 | 8.0437 | 6 | 0.1195 |
| 2026 | 0.84 | 24.11 | 75.16 | −0.001025 | 0.8735 | 8.2517 | 6 | 0.1173 |
| 2027 | 0.76 | 22.62 | 76.65 | −0.000264 | 0.8761 | 8.0547 | 6 | 0.1151 |
| 2028 | 0.69 | 22.08 | 77.17 | 0.000496 | 0.8787 | 8.0876 | 7 | 0.1128 |
| 2029 | 0.61 | 21.91 | 77.55 | 0.001257 | 0.8814 | 8.2075 | 7 | 0.1106 |
| 2030 | 0.53 | 20.71 | 78.90 | 0.002018 | 0.8840 | 8.2401 | 7 | 0.1083 |
| 2031 | 0.45 | 19.45 | 80.07 | 0.002778 | 0.8866 | 8.2606 | 7 | 0.1060 |
| 2032 | 0.37 | 19.21 | 80.37 | 0.003539 | 0.8893 | 8.3106 | 7 | 0.1038 |
| 2033 | 0.29 | 18.73 | 81.12 | 0.004299 | 0.8919 | 8.3593 | 7 | 0.1015 |
| 2034 | 0.21 | 17.33 | 82.57 | 0.005060 | 0.8945 | 8.3990 | 8 | 0.0992 |
| 2035 | 0.13 | 16.43 | 83.35 | 0.005820 | 0.8972 | 8.4406 | 8 | 0.0970 |
| Variables | RMSE | MAE |
|---|---|---|
| Share of primary industry | 0.09778 | 0.057414 |
| Share of secondary industry | 0.689045 | 0.619341 |
| Share of tertiary industry | 0.645432 | 0.582114 |
| Population growth rate | 0.0185 | 0.011812 |
| Urbanization rate | 0.003912 | 0.002801 |
| National air transportation expenditure | 1.520321 | 1.061325 |
| Density of airports in the region | 0.231149 | 0.194581 |
| Growth rate of tourism revenue | 0.056048 | 0.040024 |
| Airport | Time Period | Flight Movements Growth Rate | GDP Growth Rate | Civil Aviation Insecurity Growth Rate |
|---|---|---|---|---|
| Guangzhou Baiyun International Airport | Year of data unknown—2025 | 6.5% | 5% | 15% |
| 2025–2030 | 9% | 5.5% | 10% | |
| 2030–2035 | 12% | 6% | 5% |
| Year | Airport Passenger Throughput | Airport Cargo and Mail Throughput | Aircraft Movements | GDP | Per Capita Disposable Income | Tourism Revenue | Urban Population in Airport Service Radius | Number of Civil Aviation Insecurity Incidents | Number of Flight Movements Nationwide |
|---|---|---|---|---|---|---|---|---|---|
| 2005 | 5.61 | 17.51 | 3.85 | 0.00 | 28.18 | 0.00 | 0.59 | 0.00 | 0.00 |
| 2006 | 1.79 | 7.76 | 3.69 | 0.04 | 12.17 | 0.03 | 0.99 | 0.03 | 0.06 |
| 2007 | 4.63 | 0.93 | 0.91 | 0.05 | 2.83 | 0.07 | 1.69 | 0.04 | 0.01 |
| 2008 | 0.32 | 18.99 | 2.01 | 0.09 | 2.67 | 0.03 | 2.56 | 0.05 | 0.02 |
| 2009 | 1.42 | 0.24 | 1.44 | 0.05 | 0.73 | 0.03 | 3.24 | 0.05 | 0.01 |
| 2010 | 0.62 | 0.56 | 1.01 | 0.07 | 6.35 | 0.03 | 3.86 | 0.06 | 0.01 |
| 2011 | 2.01 | 11.32 | 3.19 | 0.05 | 9.15 | 0.03 | 1.61 | 0.06 | 0.01 |
| 2012 | 1.27 | 6.36 | 1.24 | 0.09 | 4.48 | 0.03 | 0.29 | 0.05 | 0.01 |
| 2013 | 2.31 | 14.76 | 2.92 | 0.13 | 8.96 | 0.03 | 1.75 | 0.05 | 0.01 |
| 2014 | 3.04 | 13.89 | 2.44 | 0.11 | 12.76 | 0.04 | 2.96 | 0.05 | 0.01 |
| 2015 | 7.90 | 9.02 | 7.62 | 0.10 | 9.50 | 0.04 | 3.45 | 0.05 | 0.01 |
| 2016 | 4.65 | 1.95 | 5.41 | 0.11 | 4.21 | 0.04 | 4.30 | 0.05 | 0.02 |
| 2017 | 0.50 | 8.74 | 3.29 | 0.11 | 1.84 | 0.03 | 4.11 | 0.04 | 0.02 |
| 2018 | 1.66 | 12.36 | 3.68 | 0.12 | 1.75 | 0.03 | 3.51 | 0.05 | 0.01 |
| 2019 | 4.27 | 17.66 | 2.83 | 0.08 | 7.51 | 0.03 | 2.38 | 0.06 | 0.03 |
| 2020 | 6.08 | 8.86 | 3.48 | 0.09 | 7.54 | 0.03 | 11.96 | 0.06 | 0.04 |
| Scenario | Scenario Description | Parameter Settings |
|---|---|---|
| Scenario 1 (S1) | Airport expansion + Rapid economic development | Airport terminal area increased by 50% from the original; Runway length increased by 3600 m; GDP growth rate increased by 20% from the original |
| Scenario 2 (S2) | Airport expansion + Slow economic development | Airport terminal area increased by 50% from the original; Runway length increased by 3600 m; GDP growth rate reduced by 20% from the original |
| Scenario 3 (S3) | Rapid economic development + Macro-environment changes | The GDP growth rate is increased by 20% from the original, adjusted to 10% when affected by emergencies; One emergency occurs |
| Scenario 4 (S4) | Slow economic development + Macro-environment changes | The GDP growth rate is reduced by 20% from the original, adjusted to 30% when affected by an emergency; One emergency occurs |
| Logistic Modeling | First Logistic Curve | Second Logistic Curve | Third Logistic Curve |
|---|---|---|---|
| Time period | 2005–2017 | 2017–2022 | 2022–2050 |
| H | 463,046.33 | 869,202.33 | 57,724.77 |
| L | 173,063.79 | 627,820.81 | 18,235.92 |
| W | 4.18 | 2.50 | 4.43 |
| M | 2016.13 | 2020.37 | 2029.89 |
| Logistic Modeling | Germination Stage | Growth Stage | Maturity Stage | Decline Stage | Growth Time/Year |
|---|---|---|---|---|---|
| First (Bell-shaped) | \ | 2005–2013 | 2013–2017 | \ | 8.39 |
| Second (Bell-shaped) | \ | 2017–2019 | 2019–2022 | \ | 1.73 |
| Third (S-shaped) | \ | 2022–2040 | 2040–2050 | \ | 17.62 |
| Scenario | Logistic Modeling | Time Period | H | L | W | M |
|---|---|---|---|---|---|---|
| Scenario 1 (S1) | First (Bell-shaped) | 2005–2017 | 463,046.33 | 173,063.79 | 4.18 | 2016.13 |
| Second (Bell-shaped) | 2017–2022 | 869,202.33 | 627,820.81 | 2.50 | 2020.37 | |
| Third (S-shaped) | 2022–2050 | 64,794.59 | 18,454.56 | 4.25 | 2030.61 | |
| Scenario 2 (S2) | First (Bell-shaped) | 2005–2017 | 463,046.33 | 173,063.79 | 4.18 | 2016.13 |
| Second (Bell-shaped) | 2017–2022 | 869,202.33 | 627,820.81 | 2.50 | 2020.37 | |
| Third (S-shaped) | 2022–2050 | 51,011.48 | 15,998.31 | 3.83 | 2027.36 | |
| Scenario 3 (S3) | First (Bell-shaped) | 2005–2017 | 463,046.33 | 173,063.79 | 4.18 | 2016.13 |
| Second (Bell-shaped) | 2017–2022 | 869,202.33 | 627,820.81 | 2.50 | 2020.37 | |
| Third (Bell-shaped) | 2022–2028 | −477,727.96 | −912,382.06 | 3.52 | 2026.78 | |
| Fourth (S-shaped) | 2028–2050 | 55,406.35 | 26,056.58 | 2.17 | 2031.32 | |
| Scenario 4 (S4) | First (Bell-shaped) | 2005–2017 | 463,046.33 | 173,063.79 | 4.18 | 2016.13 |
| Second (Bell-shaped) | 2017–2022 | 869,202.33 | 627,820.81 | 2.50 | 2020.37 | |
| Third (Bell-shaped) | 2022–2028 | 1,107,056.74 | 672,698.72 | 3.52 | 2026.78 | |
| Fourth (S-shaped) | 2028–2050 | 46,237.25 | 27,627.83 | 1.69 | 2030.48 |
| Scenario | Logistic Modeling | Growth Stage | Maturity Stage | Growth Time/Year |
|---|---|---|---|---|
| Scenario 1 (S1) | First (Bell-shaped) | 2005–2013 | 2013–2017 | 8.39 |
| Second (Bell-shaped) | 2017–2019 | 2019–2022 | 1.73 | |
| Third (S-shaped) | 2022–2040 | 2040–2050 | 17.95 | |
| Scenario 2 (S2) | First (Bell-shaped) | 2005–2013 | 2013–2017 | 8.39 |
| Second (Bell-shaped) | 2017–2019 | 2019–2022 | 1.73 | |
| Third (S-shaped) | 2022–2036 | 2036–2050 | 13.78 | |
| Scenario 3 (S3) | First (Bell-shaped) | 2005–2013 | 2013–2017 | 8.39 |
| Second (Bell-shaped) | 2017–2019 | 2019–2022 | 1.73 | |
| Third (Bell-shaped) | 2022–2024 | 2024–2028 | 2.48 | |
| Fourth (S-shaped) | 2028–2036 | 2036–2050 | 8.09 | |
| Scenario 4 (S4) | First (Bell-shaped) | 2005–2013 | 2013–2017 | 8.39 |
| Second (Bell-shaped) | 2017–2019 | 2019–2022 | 1.73 | |
| Third (Bell-shaped) | 2022–2024 | 2024–2028 | 2.47 | |
| Fourth (S-shaped) | 2028–2034 | 2034–2050 | 6.19 |
Disclaimer/Publisher’s Note: The statements, opinions and data contained in all publications are solely those of the individual author(s) and contributor(s) and not of MDPI and/or the editor(s). MDPI and/or the editor(s) disclaim responsibility for any injury to people or property resulting from any ideas, methods, instructions or products referred to in the content. |
© 2024 by the authors. Licensee MDPI, Basel, Switzerland. This article is an open access article distributed under the terms and conditions of the Creative Commons Attribution (CC BY) license (https://creativecommons.org/licenses/by/4.0/).
Share and Cite
Wan, L.; Shan, Z.; Jiang, X.; Wang, Z.; Lv, Y.; Xu, S.; Huang, J. Life Cycle Prediction of Airport Operation Based on System Dynamics. Sustainability 2024, 16, 9596. https://doi.org/10.3390/su16219596
Wan L, Shan Z, Jiang X, Wang Z, Lv Y, Xu S, Huang J. Life Cycle Prediction of Airport Operation Based on System Dynamics. Sustainability. 2024; 16(21):9596. https://doi.org/10.3390/su16219596
Chicago/Turabian StyleWan, Lili, Zhanpeng Shan, Xinyue Jiang, Zhan Wang, Yangyang Lv, Shumeng Xu, and Jiahui Huang. 2024. "Life Cycle Prediction of Airport Operation Based on System Dynamics" Sustainability 16, no. 21: 9596. https://doi.org/10.3390/su16219596
APA StyleWan, L., Shan, Z., Jiang, X., Wang, Z., Lv, Y., Xu, S., & Huang, J. (2024). Life Cycle Prediction of Airport Operation Based on System Dynamics. Sustainability, 16(21), 9596. https://doi.org/10.3390/su16219596