Article

Enhancing Construction Management Digital Twins Through Process Mining of Progress Logs

by
Yongzhi Wang
1,
Shaoming Liao
1,*,
Zhiqun Gong
2,
Fei Deng
3 and
Shiyou Yin
4
1
Department of Geotechnical Engineering, Tongji University, Shanghai 200092, China
2
China Construction Infrastructure Co., Ltd., Beijing 100044, China
3
School of Geodesy and Geomatics, Wuhan University, Wuhan 430079, China
4
Shanghai Tongzhu Information Technology Co., Ltd., Shanghai 201100, China
*
Author to whom correspondence should be addressed.
Sustainability 2024, 16(22), 10064; https://doi.org/10.3390/su162210064
Submission received: 23 September 2024 / Revised: 14 November 2024 / Accepted: 15 November 2024 / Published: 19 November 2024

Abstract

:
Large-scale infrastructure projects involve numerous complex processes, and even small construction management (CM) deficiencies can lead to significant resource waste. Digital twins (DTs) offer a potential solution to the management side of the problem. The current DT models focus on real-time physical space mapping, which causes the fragmentation of process data in servers and limits lifecycle algorithm implementation. In this paper, we propose a DT framework that integrates process twins to achieve process discovery through process mining and that serves as a supplement to DTs. The proposed framework was validated in a highway project. Based on BIM, GIS, and UAV physical entity twins, construction logs were collected, and process discovery was performed on them using process mining techniques, achieving process mapping and conformance checking for the process twins. The main conclusions are as follows: (1) the process twins accurately reflect the actual construction process, addressing the lack of process information in CM DTs; (2) process variants can be used to analyze abnormal changes in construction methods and identify potential construction risks in advance; (3) sudden changes in construction nodes during activities can affect resource allocation across multiple subsequent stages; (4) process twins can be used to visualize construction schedule risks, such as lead and lag times. The significance of this paper lies in the construction of process twins to complement the existing DT framework, providing a solution to the lost process relationships in DTs, enabling better process reproduction, and facilitating prediction and optimization. In future work, we will concentrate on conducting more in-depth research on process twins, drawing from a wider range of data sources and advancing intelligent process prediction techniques.

1. Introduction

Construction management (CM) is crucial to the success of construction projects. A rough CM model can lead to a waste of resources and, in severe cases, casualties [1,2]. Engineering accidents are often caused by management issues rather than technical problems [3,4]. A current emerging trend is the application of various data analysis methods to solve persistent management issues and enhance the integration of information and communication technologies in various construction activities [5]. In addition, extensive research has shown that digitalization can effectively improve management efficiency [6,7,8]. New disruptive technologies and concepts, such as the Internet of Things (IoT), big data analytics, and artificial intelligence (AI), are rapidly emerging and have immense potential for value creation in complex infrastructure systems. However, the lack of integration between digital and physical spaces has led to generally low efficiency and collaboration levels in construction industry management. Digital twins (DTs) create digital models that correspond to physical objects for simulation, monitoring, analysis, and decision making throughout their lifecycles, and they are considered an effective solution for improving engineering management capabilities [9,10,11,12,13].
It is widely believed that the concept of the DT first appeared in 2011 in Michael Grieves and John Vickers’ work Virtually Perfect: Driving Innovative and Lean Products Through Product Lifecycle Management [14]. However, this concept can be traced back to as early as 2003 during NASA’s Apollo project [15]. From 2003 to 2011, DTs remained in the conceptual model stage, primarily based on Michael Grieves’ notion of “a virtual digital representation equivalent to a physical product”, which includes a conceptual model built on the following foundation: (1) the physical product in real space; (2) the virtual product in virtual space; (3) the connection of data and information linking virtual and real products [16]. DTs (precise, virtual replicas of machines or systems) are revolutionizing the industry. Driven by real-time data collection from sensors, these complex computer models reflect nearly every aspect of a product, process, or service [17]. The value of DTs has been recognized by researchers, enterprises, and other stakeholders across various fields, including healthcare, agriculture, urban science, aerospace engineering, marine engineering, and even Earth systems [2,18].
DTs have gained a certain degree of popularity in the manufacturing industry, partly due to the sector’s commitment to the technological demands of Industry 4.0, which, along with digital transformation, can enhance productivity and reduce energy consumption. DTs’ key area enables the application of technology for Industry 4.0 in the construction sector and can address its inherent challenges, such as complex project management, delays, quality control, safety issues, and environmental impacts, thereby significantly improving it [19,20]. However, recent literature reviews indicate that the practical application of DTs in the architecture, engineering, and construction (AEC) fields is still largely in its infancy [21,22,23]. The industry and academia are currently working to reconcile the various contentious DT definitions and unclear DT development processes [23]. Opoku et al. (2021) conducted a literature review showing that DTs have significant potential in addressing many challenges faced by the construction industry [24]. Su et al. (2022) found that DTs are highly compatible with many emerging technologies, and in the construction industry, the integration of DTs with BIM, the IoT, and AI has demonstrated significant advantages [22].
As a relatively mature technology in the construction field, BIM (Building Information Modeling) is favored by many researchers for the construction of models through its enhancement. Song et al. (2023) proposed a DT-enhanced BIM framework from the perspective of bridge engineering to promote the implementation of lifecycle digital bridge engineering [25]. Zhou et al. (2023) proposed a construction DT framework utilizing BIM to incorporate a video camera as input, addressing the dimensional, coordinate system, and object inconsistencies between the BIM and a video camera [26]. Arsiwala A, Elghaish F, and Zoher M (2023) proposed a digital twin solution that integrates the IoT, BIM, and AI for automatically monitoring and controlling the equivalent carbon dioxide (eCO2) emissions of existing assets, and they further validated its feasibility through a practical application case analysis [27]. The output of the entire solution is displayed in the form of an interactive dashboard for observing trends and patterns, allowing stakeholders to implement effective data-driven transformation strategies. Pan and Zhang (2021) constructed a closed-loop DT framework integrating BIM, the IoT, and data mining technology, using a fuzzy miner to foresee potential bottlenecks in the current processes [28]. As mentioned in the literature, DTs place greater emphasis on the existence of physical counterparts than BIM [22].
Additionally, a considerable number of researchers have constructed different DT frameworks to address various practical issues, including physical space detection, prediction, and control. Lu et al. (2020) provided a DT anomaly detection system and data integration method based on an extended Industrial Foundation Class (IFC) for efficient and automated asset monitoring in daily operation and maintenance management [29]. In addition, Wang et al. (2024) proposed a DT framework based on reduced-order models for spatial structures. By compressing experimental design samples, they reduced multi-dimensional, high-order physical models to multiple approximate low-order models to construct a DT model, enabling real-time computation covering all components [30]. Li et al. (2024) proposed an improved conceptual framework tailored for tunnels to address the inherent complexities and uncertainties of tunnel construction [21]. A more detailed presentation of the engineering construction literature is shown in Table 1.
The lifecycle characteristics of DTs naturally provide effective support for multi-process management tasks in engineering projects. Lee et al. (2021) developed an integrated DT and blockchain framework for traceable data communication, ensuring that all data transactions are traceable [40]. Liu et al. (2023) proposed a six-dimensional DT framework that integrates the green factors of prefabricated buildings into the model evolution framework and mechanisms. The results show that the energy consumption and pollution were reduced compared to in the pre-construction plans, and the model evolution method optimized the green management measures, improving the on-site green construction management [34]. Pan and Zhang (2021) proposed a closed-loop DT framework that integrates BIM, the IoT, and data mining technologies and can foresee potential bottlenecks in current processes [28].
DTs have already achieved considerable implementation in engineering project construction and management. However, the research indicates that while programs, technologies, and data models such as BIM can standardize semantic representations of building components and systems, DTs provide a more comprehensive socio-technical and process-oriented description of complex artifacts by leveraging the bidirectional data flow of cyber–physical systems [42]. The construction of DT models requires a holistic, scalable semantic approach that takes into account dynamic data at different levels [42]. For example, during a project’s lifecycle, numerous participants need to share information, which is often an inefficient and error-prone process [43]. At different stages, the information faces issues such as loss, misinterpretation, changes in the data structure and storage locations, or even missing data structures. This information fragmentation not only hinders the decision-making process but also makes it more time-consuming and less intuitive [44]. While many of the current DT models can achieve the bidirectional mapping of physical spaces, they involve a considerable technology stack, including various sensors, and their service-driven engines are often dispersed throughout the twin system and can monitor and predict single physical entities. Regarding the crucial aspect of progress management in engineering project management, the complex activities of the construction process are fragmented and stored on cloud servers, which is detrimental to lifecycle analysis algorithms. To address this issue, Pan and Zhang (2021) explored process mining through BIM logs, analyzing the potential resource allocation issues during the construction process [28,45]. Process mining can be used to extract valuable information from event logs, supplementing the existing process management methods. And unlike data mining, focuses on discovering process models [46], providing an effective technical means to address the aforementioned issues.
The specific goal of this study is to build a practical DT framework that incorporates process information to address the data fragmentation in twin systems that prevents its display. The key approach is the achievement of process mapping through process mining, thereby forming the process twin. The main research areas are as follows: (1) the construction of a schedule process twin model from scattered schedule logs in the physical twin and (2) a comparison of the four indicators—the fitness, precision, generalization, and simplicity—of different process models. Based on this, we further assessed (1) the time bottlenecks in the construction process; (2) the issues of schedule advancement and delays in a real construction process; (3) consistency between the process model of the schedule and construction activities; and (4) the limitations of this study and directions for future research.

2. Preliminaries

2.1. Process Mining

Process mining, also known as workflow mining, is a key technology used in workflow redesign and analysis methods that reconstructs a workflow process model based on the execution information of the process instances recorded in logs, ensuring that all the traces recorded in the logs conform to one instance of this process model [47]. Processes can be modeled and visualized using different notations and modeling languages, such as Petri nets and BPMN (Business Process Modeling Notation). The core goals of process mining are to capture event data, discover the actual processes, and gain insights about them [48]. The aim of this data-driven approach is to replace the traditional methods used by organizations, which often rely on judgment, imagination, or heuristics to identify process issues.

2.2. The Event Log

The starting point for process mining is the event log, which is a collection of events categorized as traces, which describe what happened and when. Each event is related to a case and each event is associated with an activity, with all events corresponding to the specific case being ordered. In other words, each case is described by a sequence of events. In addition to the activity names, events can be characterized by various attributes. For example, an event may have a timestamp, correspond to an activity (such as a process step, software method, or statement), represent a start or completion, involve resource allocation or related costs, and so on. Table 2 shows a fragment of an event log where each row records an event’s occurrence for a particular activity. Different event logs may contain different data attributes, and they are collections of traces, with each trace consisting of the process steps to be executed. For example, the log in Table 2 shows three traces: [<Event-22, Event-23, Event-25>, <Event-24, Event-27>, <Event-26>].

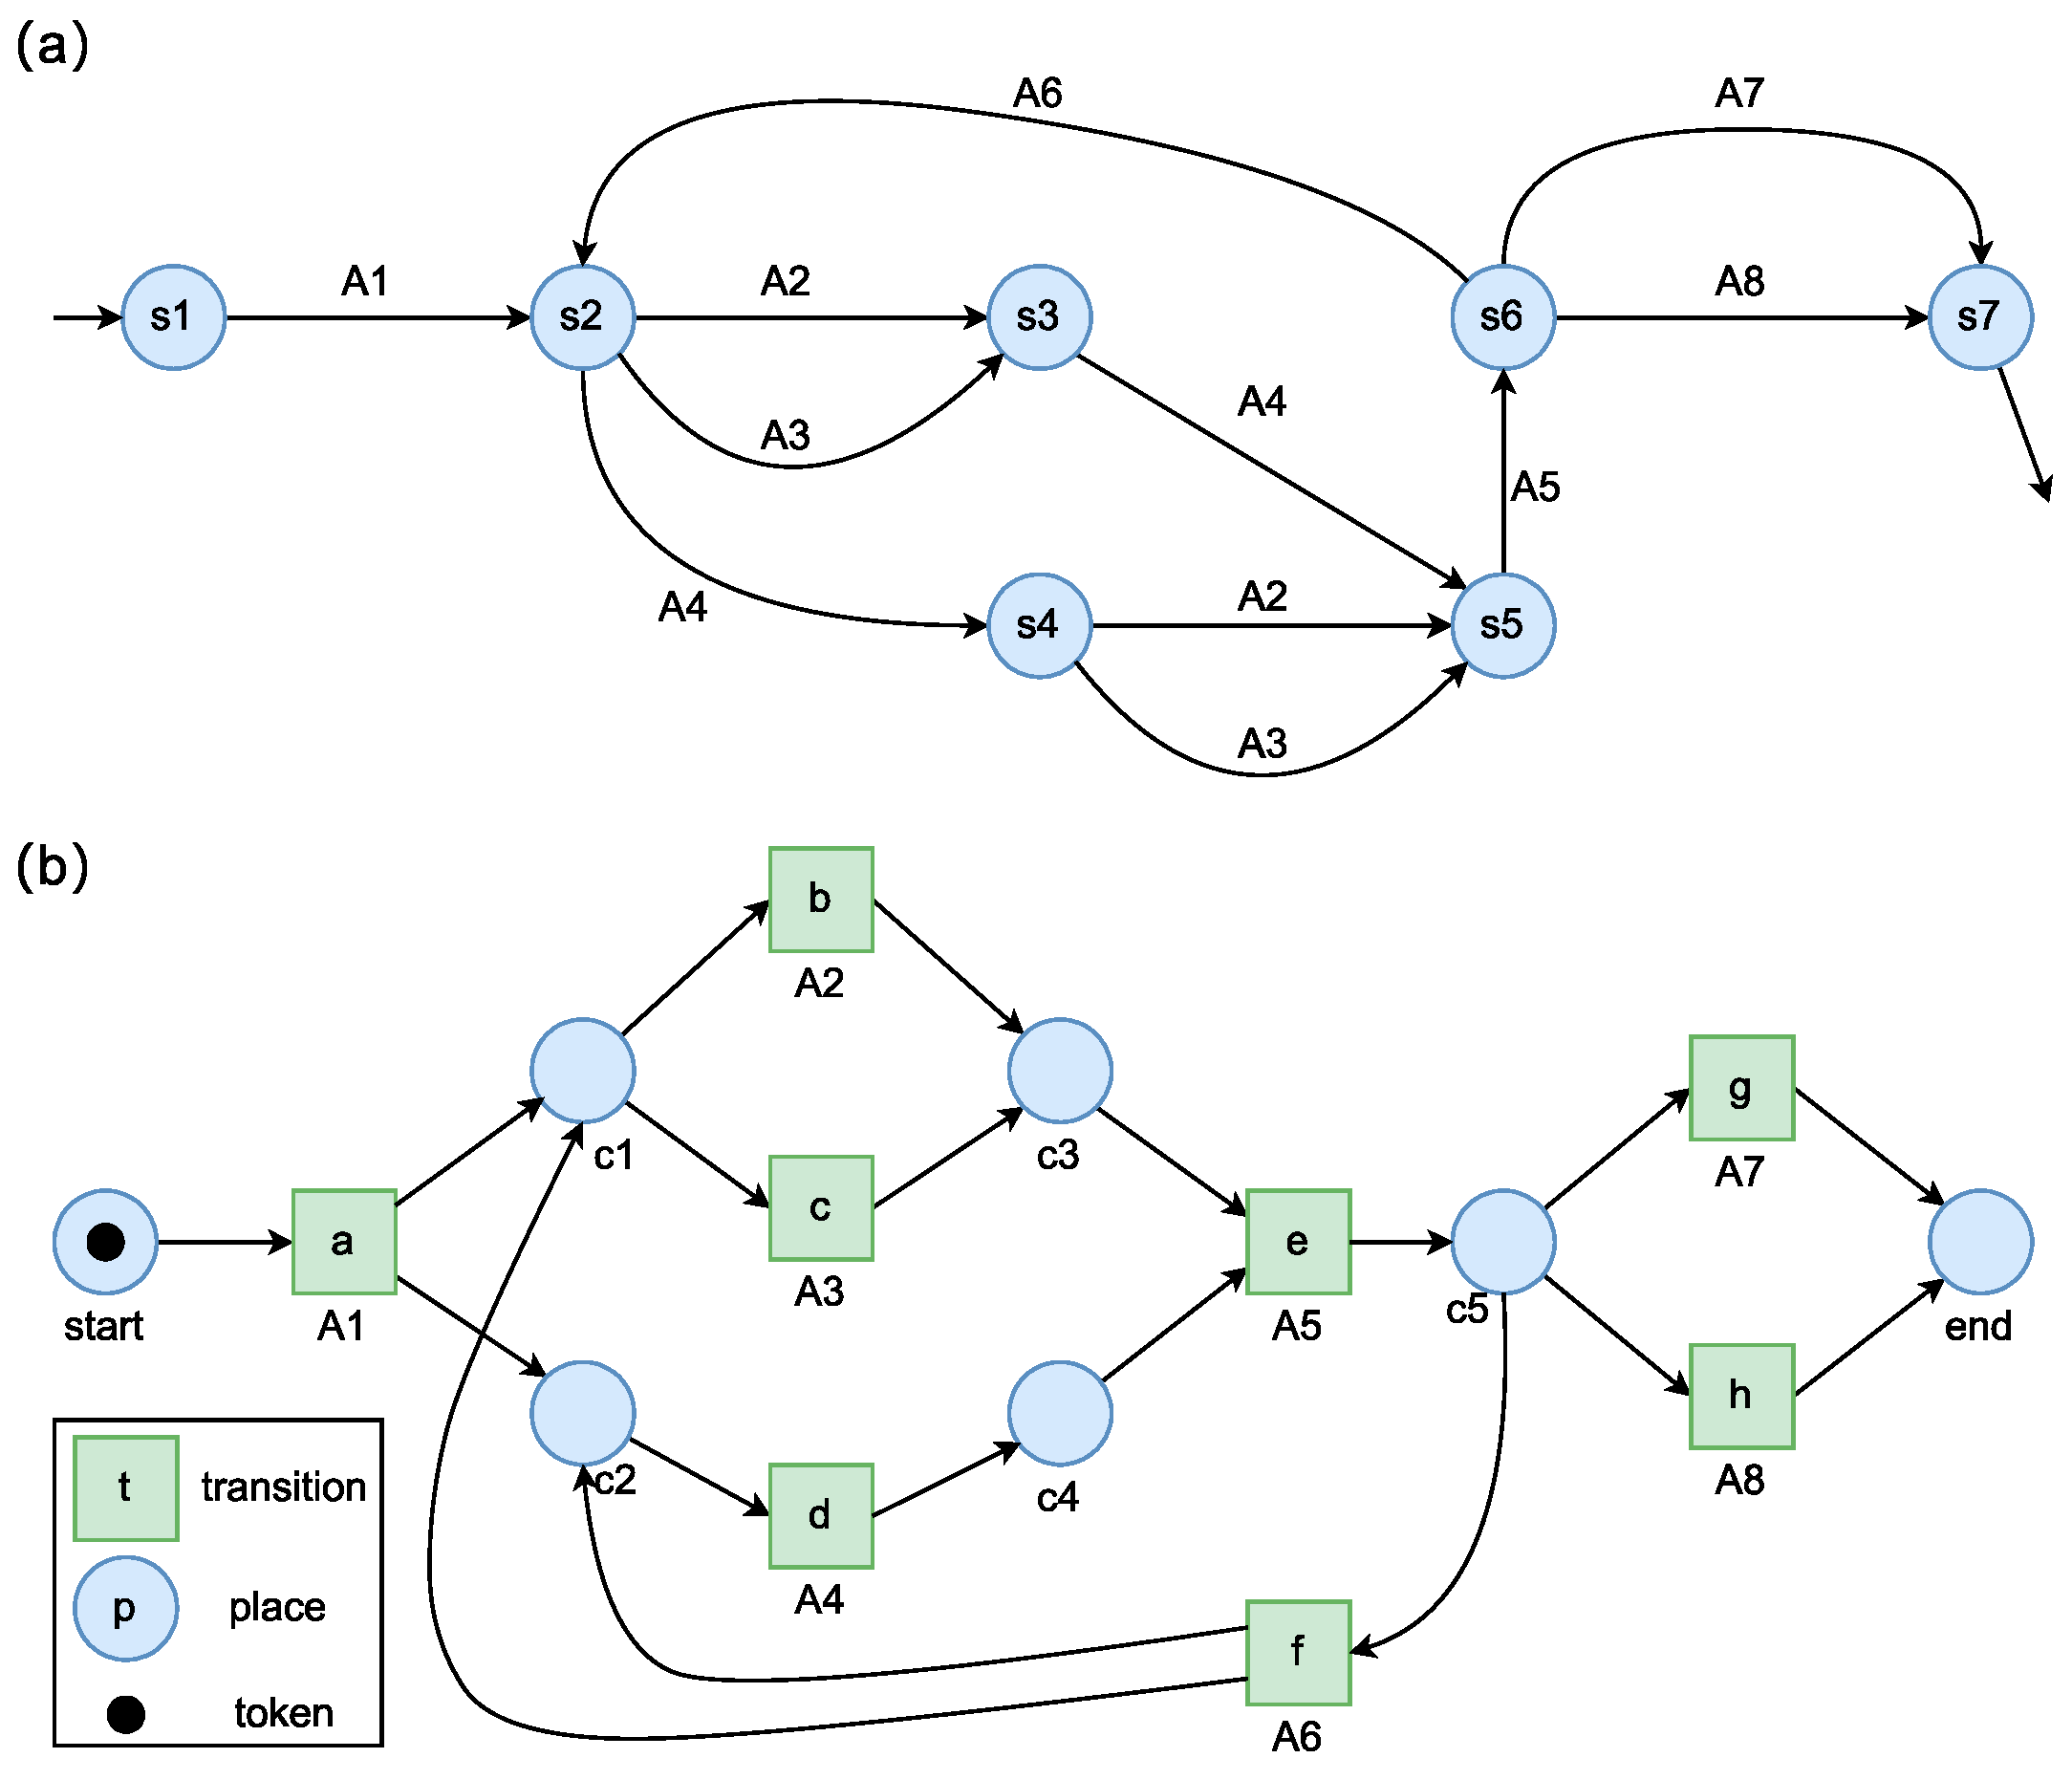
2.3. The Process Model

In process mining, modeling forms with clear semantics are typically used, such as Petri nets and transition models. Process mining algorithms generally generate formalized, high-level process models that include constructs such as concurrency, inclusive choice, and interleaving [49]. However, some algorithms may return unsound models (e.g., α, Split Miner, BPMN Miner, Fodina), require significant computation times (e.g., Evolutionary Tree Miner), or overgeneralize behavior (e.g., Inductive Miner) [50]. Transition systems and Petri nets are more suitable for complex processes, while for simpler business processes, the aforementioned process discovery techniques may require generalization to fit representational biases or return models with deadlocks or other anomalies, leading to the uninterpretability or ambiguity of the Petri nets or BPMN.
A transition system is a fundamental process modeling notation that consists of states and the transitions between them, which correspond to the activities being executed [46]. A transition system is defined as a triplet TS = (S, A, T), where S is the set of states, A is the set of activities, and TS×A×S is the set of transitions. SstartS is the set of initial states, and SendS is the set of final states. Figure 1a shows a transition system with single initial and final states. The circles represent the states, with s1 and s2 denote the initial and final states, respectively. Each state has a unique label as an identifier. The transitions are represented by arcs, each connecting two states and labeled with an activity name, and the transition system has a clear mathematical representation. According to the definition, the transition system in Figure 1a can be represented as follows: S = {s1, s2, s3, s4, s5, s6, s7}, Sstart = {s1}, Send = {s7}, A = {A1, A2, A3, A4, A5, A6, A7, A8}, T={(s1, A1, s2), (s2, A2, s3), (s2, A3, s3), (s2, A4, s4), (s3, A4, s5), (s4, A2, s5), (s4, A3, s5), (s5, A5, s6), (s6, A6, s2), (s6, A7, s7), (s6, A8, s7)}.
A Petri net is a directed graph that is composed of places that can contain tokens [46], as shown in Figure 1b. The presence of tokens determines the state of the net, and transitions change the state of the net by consuming and producing tokens from/to connected places and emitting the associated activities. In a Petri net, there are a single place without an incoming transition and a single place without an outgoing transition, with every place and transition lying on a directed path between these two places. If all the transitions in the workflow net can be triggered and the final state is accessible from every reachable state, then the network is sound.

2.4. Research on Process Mining in AEC
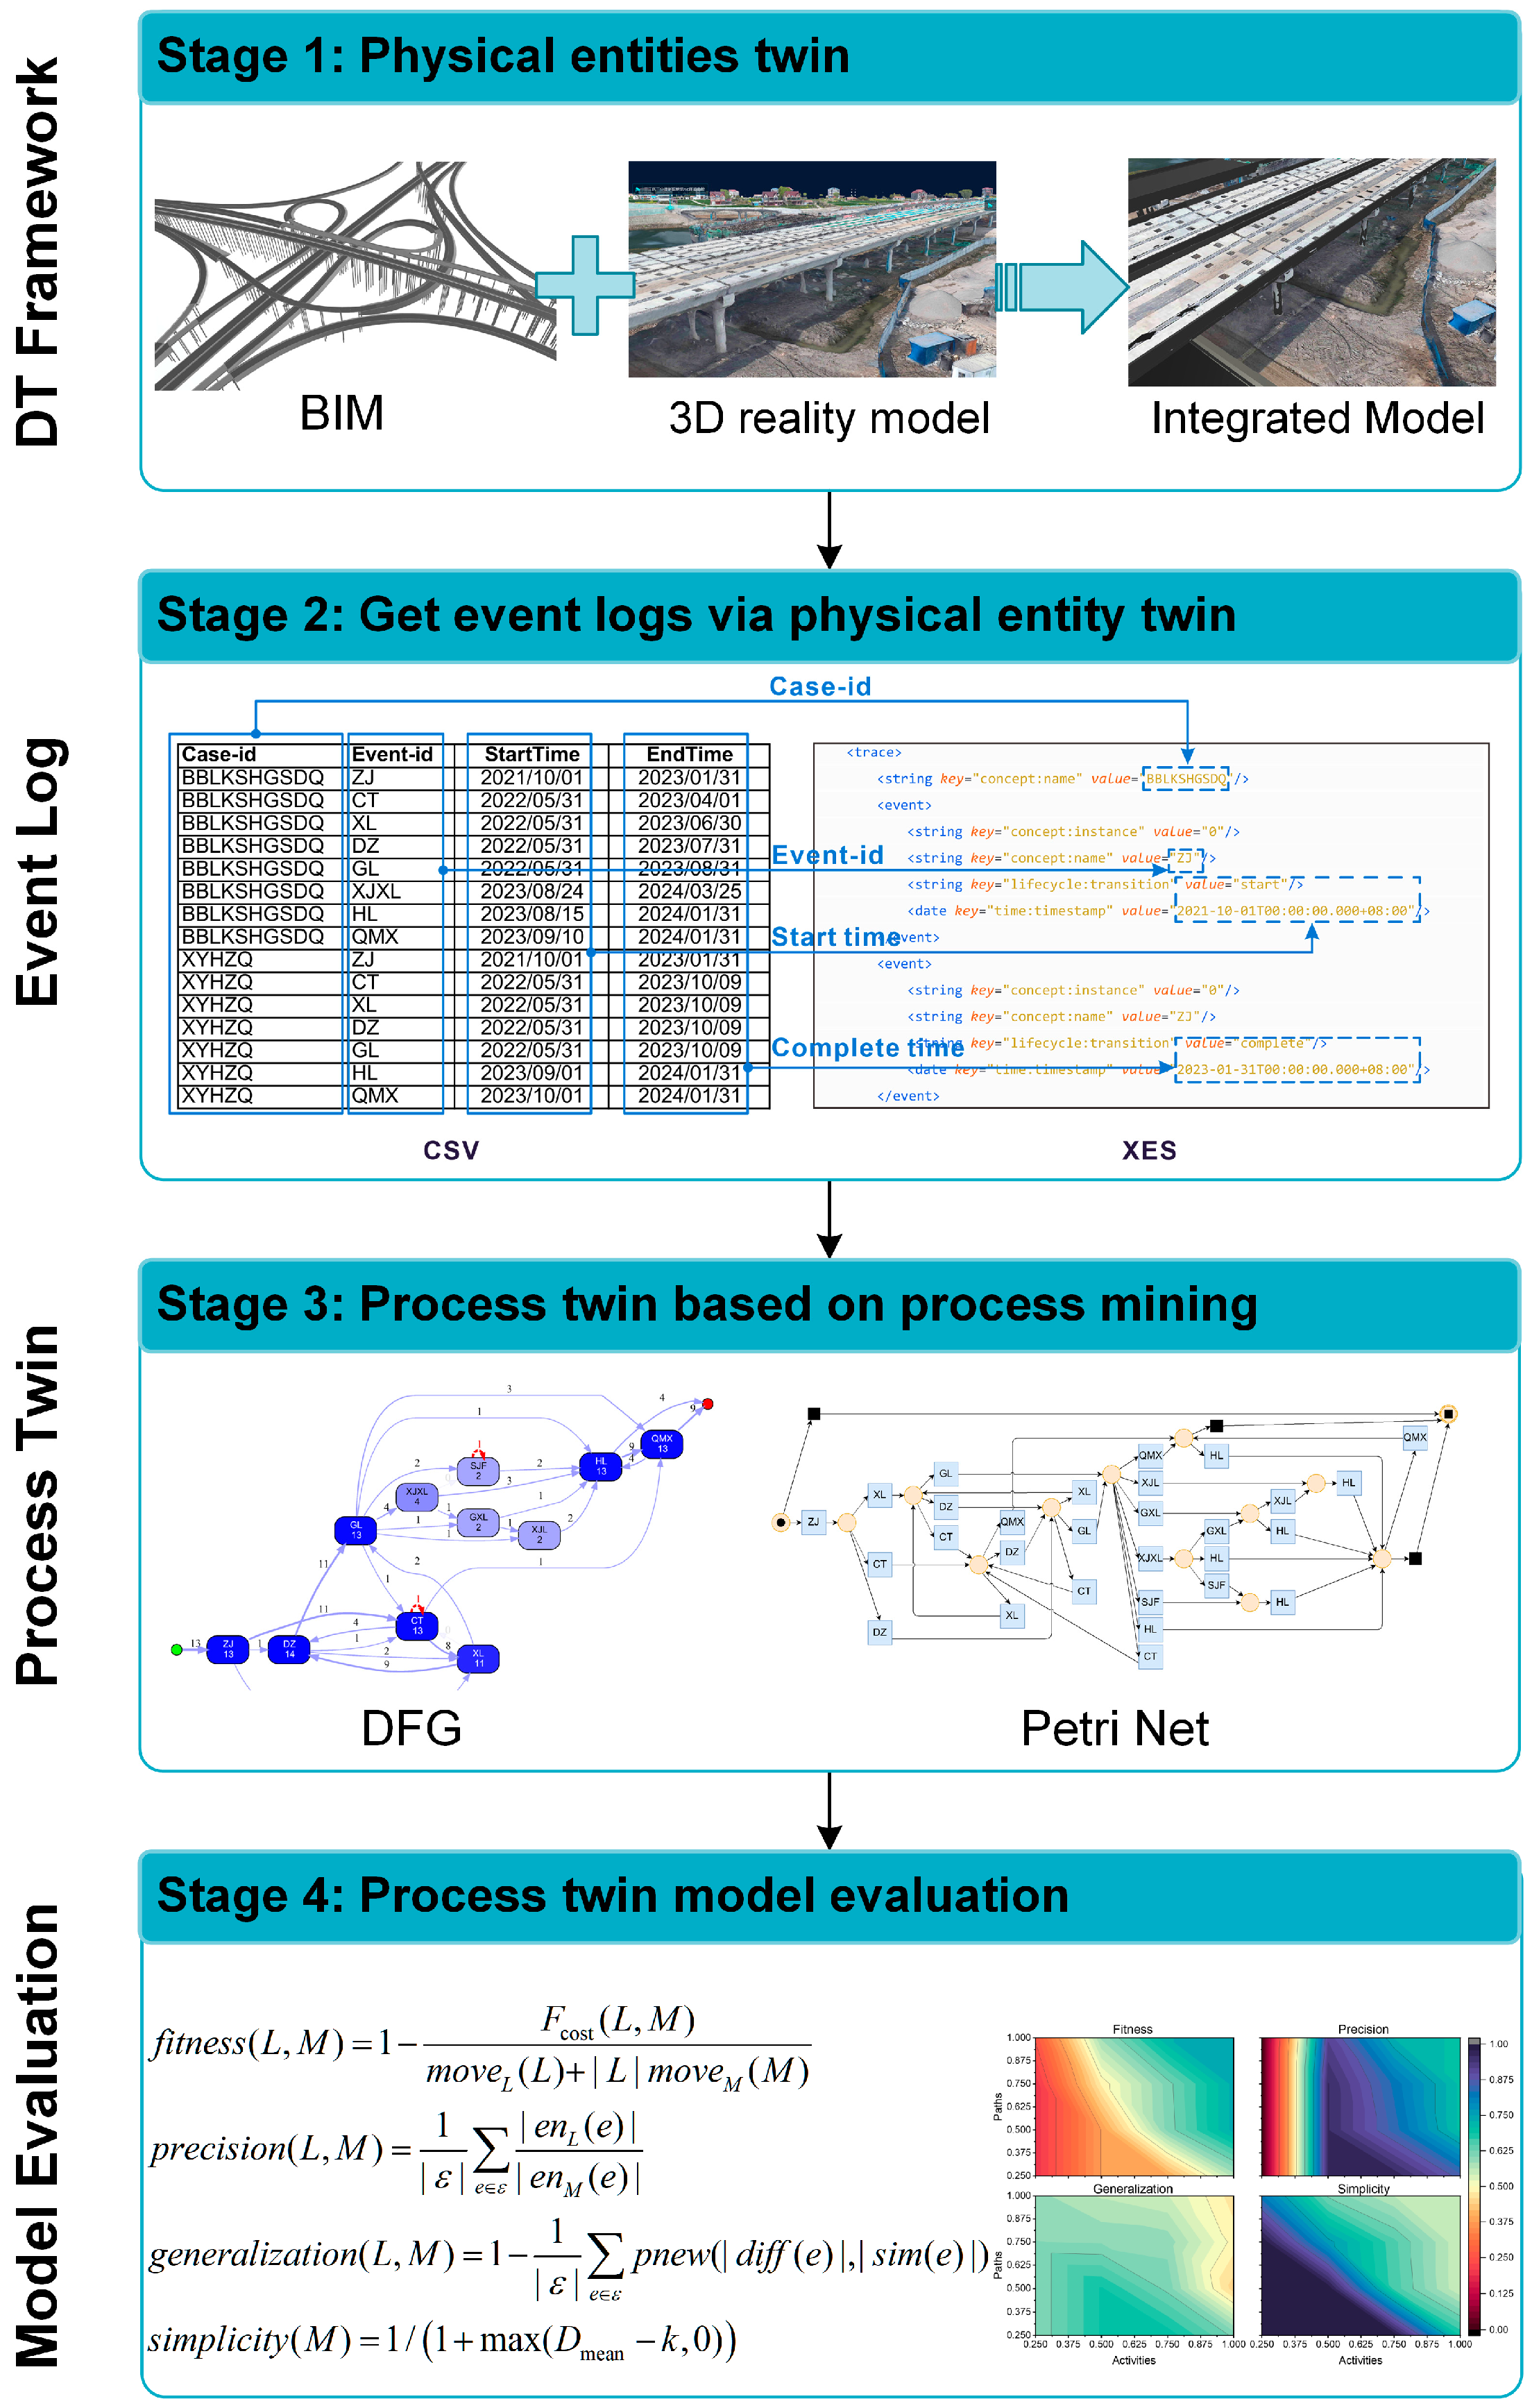
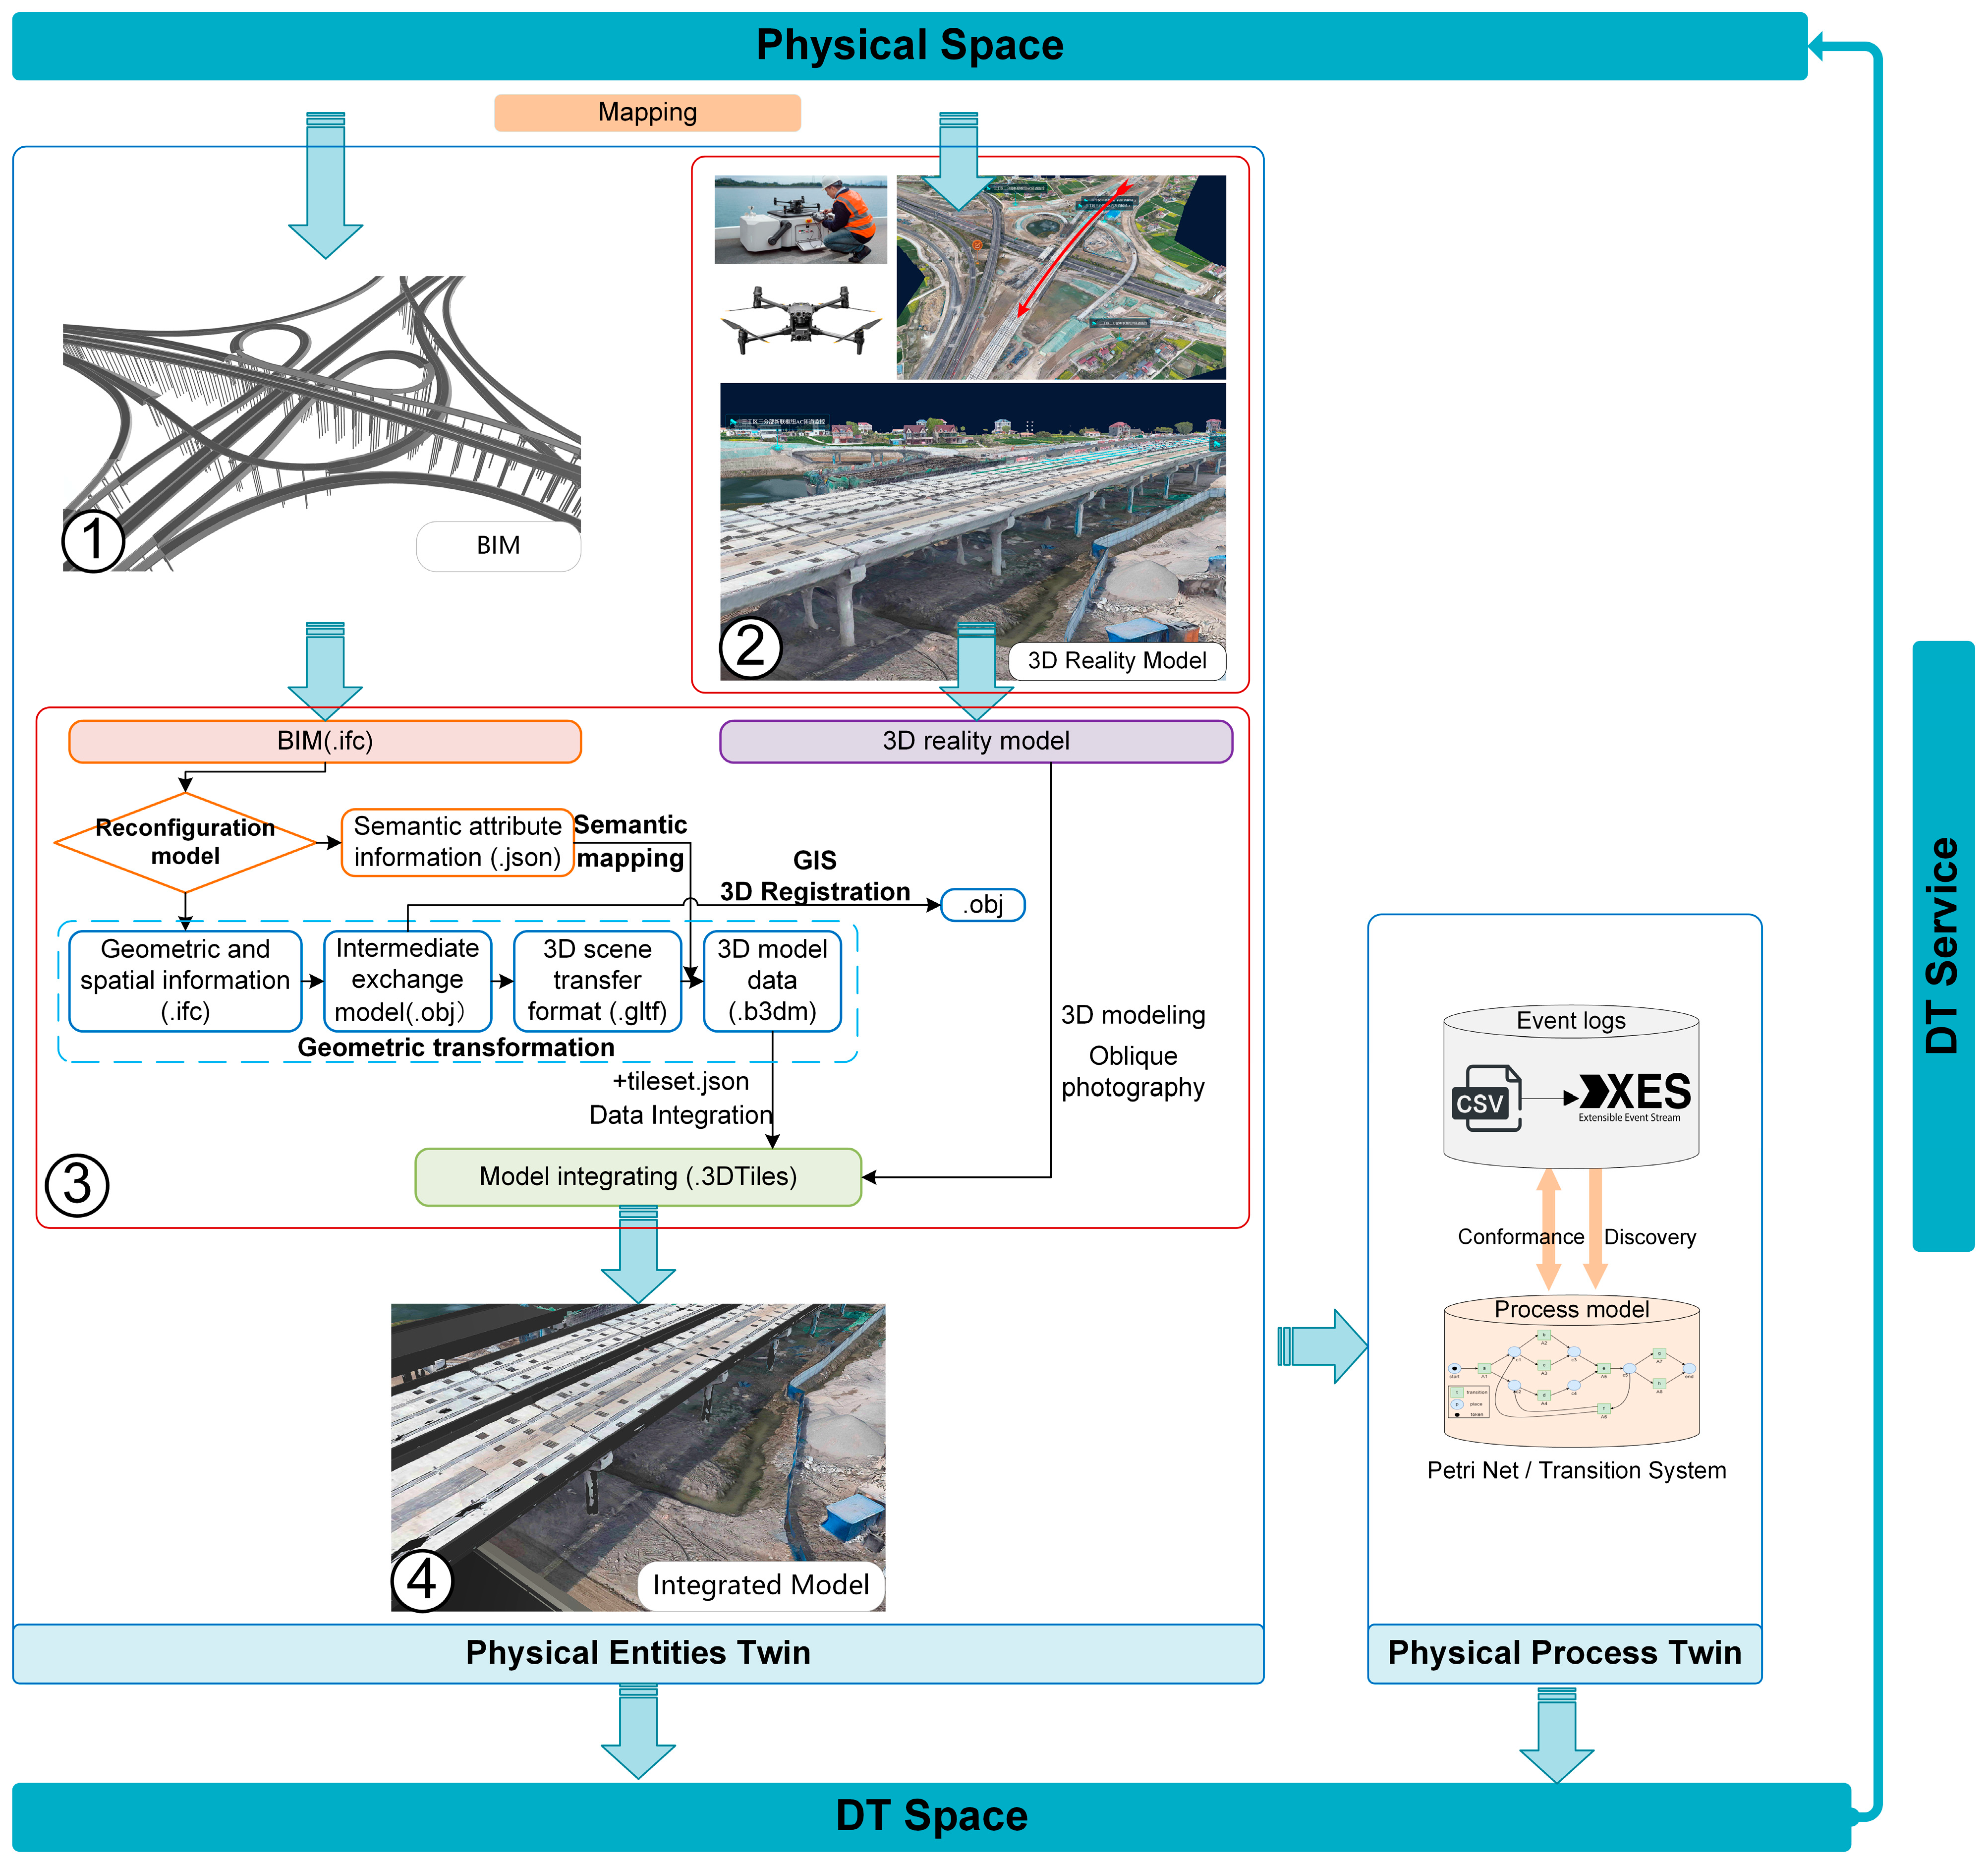
The research on process mining in architecture, engineering, and construction (AEC) industries has mainly focused on BIM. In 2016, van Schaijk studied how process mining and BIM can be used to identify bottlenecks and shorten construction projects [51], demonstrating that event logs from previous projects can be reused to provide recommendations for construction planners and identify risks in the early stages of new construction projects. Subsequent research has largely focused on obtaining event logs from BIM and has developed various methods for retrieving BIM logs. For example, Yarmohammadi et al. (2017) studied BIM log file information and proposed a new method to extract meaningful patterns from unstructured design log data with timestamps, thereby expanding the existing knowledge [52]. Kouhestani (2019) developed an “IFC-archiving algorithm” for generating BIM event logs [53]. Forcael et al. (2020) designed a process to collect, sort, and select data from log files generated by BIM software [54]. Jang and Lee (2023) developed a BIM recorder as a tool for capturing and reproducing the BIM creation process [55]. Additionally, Gao et al. (2021) proposed a new data structure to retrieve command object graphs from 3D modeling event logs [56], and they used machine learning to mine the event logs generated during the modeling process for behavioral sequence clustering [57].
Furthermore, researchers have conducted a series of process mining analyses on BIM event logs to explore their potential in real-world applications. Based on BIM logs, Zhang et al. (2018) further proposed a pattern retrieval algorithm to identify the most common design sequence patterns in building design projects [58]. Kouhestani (2018, 2019) applied process mining to BIM event logs to help managers document and evaluate the business processes and workflows of project teams [48,59]. Pan and Zhang (2021) developed a novel framework for automatically discovering processes from BIM event logs, showing that extensive process mining investigations can support data-driven decision making, strategically streamlining construction processes and increasing collaboration opportunities, which also help reduce the risk of project failure in advance [28]. Gao et al. (2022) pointed out that command prediction based on BIM logs is an important computer-aided design (CAD) method that helps avoid design errors, especially in the early AEC design stages. Accordingly, intelligent CAD tools for high-precision command prediction in the 3D modeling design process can be further developed [60].
Process mining from BIM event logs to achieve process analysis has made some breakthroughs, but the relevant research literature is still relatively limited. The application of BIM log mining is still in its early stages, and if information specific to the model elements is added, then it holds significant potential for other project phases [61].

3. Methodology

CM differs significantly from many other management fields, as construction projects are characterized by complexity and uncertainty and project improvement tasks often involve many conflicting factors. Tasks related to project improvement, such as design, scheduling, and safety management, are inherently focused on resolving conflicts between these objectives to achieve a better performance.
DTs for CM require the construction of twin spaces for both physical entities and physical processes in the physical space. The twin of physical entities is the primary prerequisite for the DT, enabling data-driven analysis, prediction, and decision making within the twin model. Additionally, based on the twin of physical entities, process twins are constructed to address the missing mappings of the construction process (the importance of process studies in the field of management cannot be overlooked).
The twin of the physical entities generates a large volume of event logs that record the process changes of the physical entities but do not contribute to process reproduction. Therefore, we built a DT of physical entities or the entities themselves and then used process mining techniques to achieve process discovery from the event logs generated by the physical twin, leading to the formation of process twin models based on models such as DFGs (direct-follow graphs) and Petri nets, which provide strong semantic process representation and offer a solid foundation for subsequent analyses. Given the flexibility of the process mining models, further evaluation was necessary to assess their practical utility. The overall research process is shown in Figure 2 and mainly consisted of four parts: (1) construction of the DT framework; (2) event log acquisition, where construction activity log information was obtained through a comparative analysis of the BIM and 3D reality model; (3) the process twin, where transition systems and Petri nets were used to achieve the twin mapping of physical processes, enabling the construction of the process twin; and (4) model evaluation, where the model was assessed based on four indicators: its fitness, precision, generalization, and simplicity.

3.1. Physical Entity Twins

The mapping of the DT to the physical space requires specific solutions for its different components. Based on a recently launched project, the DT for highway CM is being explored [62,63] based on the Nantong Ring Expressway project in China. The expressway starts at Chonghai Junction and ends at the Xinlian Hub of the Hutong Bridge North Connector, with a total length of approximately 65.4 kilometers, as shown in Figure 3.
Based on the five-dimensional DT model, a DT model for CM is proposed, as shown in Figure 4. The constructed DT framework is divided into three parts: the physical space, the DT space, and DT services. The physical space and DT space are linked through intelligent perception and virtual physical mapping, where the DT space enables twin applications through data-driven models. DT applications manage the physical space through supervisory interaction and command control. The linkage and interaction between these three components of the digital twin enable refined management throughout the entire DT lifecycle.
The construction of a DT involves the intelligent perception and digital mapping of various parts of the physical space. For highways, the intelligent perception of the physical space requires the digital extraction of the key parameters from the aforementioned components. Currently, BIM is widely used as the foundational technology for constructing DTs in CM. Similarly, in this study, BIM was used to digitally map the overall planning, design, and CM of the highway, as shown in part ① of Figure 4. However, whereas DTs emphasize the existence of a physical counterpart, BIM does not necessarily require a physical entity. In the construction of DT models for highway CM, GIS and UAV technologies are used to address the BIM limitations. The process of achieving the DT of physical entities includes the following two steps.
First, a 3D reality model of the physical entities in the construction process is created using UAVs (as shown in part ② of Figure 4). The UAVs digitally map the physical entities according to a pre-set route. The process of establishing the 3D reality model from UAV visual images includes four technologies: (1) cross-view, multi-temporal image matching technology; (2) robust multi-source image orientation and distributed aerial triangulation technology; (3) feature-driven 3D reconstruction technology; and (iv) automatic and seamless viewpoint-related texture mapping technology.
For more detailed information on 3D reconstruction technology, please refer to the relevant literature by one of the authors of this paper, Fei Deng [64,65,66,67,68]. One important aspect of the 3D reconstruction process is the application of GIS, which offers significant advantages in determining the spatial positions of engineering and environmental elements. The integration of UAV aerial images with close-range images captured on the ground enables joint orientation and the automatic generation of high-resolution true 3D construction site models, improving their quality and accuracy. With the spatial-positioning information provided by the GIS, the UAV 3D reality model can achieve a precise mapping between the 3D reality model and the actual physical space.
Secondly, DT integration with BIM as the data carrier (as shown in part ③ of Figure 4) is performed. The main process includes four aspects: (1) model reconstruction; (2) geometric transformation; (3) spatial position registration; and (4) semantic mapping.

3.2. Process Twins

The previous discussion focused on the DT of physical entities, but CM is more concerned with scheduling issues. Throughout the CM lifecycle, various construction logs with timestamps for phase-specific tasks are generated; however, they are often scattered and stored in fragmented ways. This lack of intuitive and cohesive relationships limits macro-level analysis in CM. Therefore, it is necessary to conduct process mining and construct a process twin mapping supported by models, such as Petri nets and transition systems, to further compensate for the missing real processes. By presenting events in the form of logs, process mining can be used to discover the process model from fragmented events, and consistency analysis can be applied to verify the reliability of the model, resulting in a process twin model represented by Petri nets, transition systems, and direct-follow graphs.

3.2.1. Event Log Acquisition

In actual construction, process management involves many aspects, among which schedule management is very important for managers. The construction schedule is the most typical event record with timestamps in CM. Traditional BIM is more focused on planning attributes, and its time information often reflects the planned rather than the actual status. Although 4D-BIM can be used to record scheduling information, its practicality on the construction site is limited, resulting in time information that is often incomplete, inaccurate, and unreliable. The strength of BIM lies in its detailed description of building structures, with clearly readable semantics. The recording of real construction information on-site is facilitated by frequent UAV patrols. The 3D reality model based on UAV imagery is a true reflection of the actual construction site. Through semantic segmentation algorithms, the physical components are identified and compared with the physical components marked in the BIM. This process records real events at key construction milestones, including the actual start and end timestamps of various construction tasks, thereby forming the construction event log.
Information related to the event log can be accessed online through the cloud database of the DT platform, which provides a favorable data foundation for the subsequent process twin based on process mining. The table on the left in Figure 5 presents a fragment of an event log, where each row records the occurrence of a particular activity in an event. Different event logs may contain different data attributes, and they are collections of traces, with each trace consisting of process steps to be executed.
Twin data are often stored in the form of databases or are generated in comma separated values (CSVs) format for professionals to review. However, this format poses readability challenges for process mining programs, often requiring manual definitions of the data attributes. The eXtensible Event Stream (XES) is an XML-based event log standard designed to define a format for exchanging log files across different tools and application domains [69]. The XES file format is widely supported by process mining programs such as ProM, Disco, PM4Py, and Apromore [70]. Event logs need to be standardized, and ProM provides a convenient conversion plugin (Convert CSV to XES) for this, as shown in Figure 5.

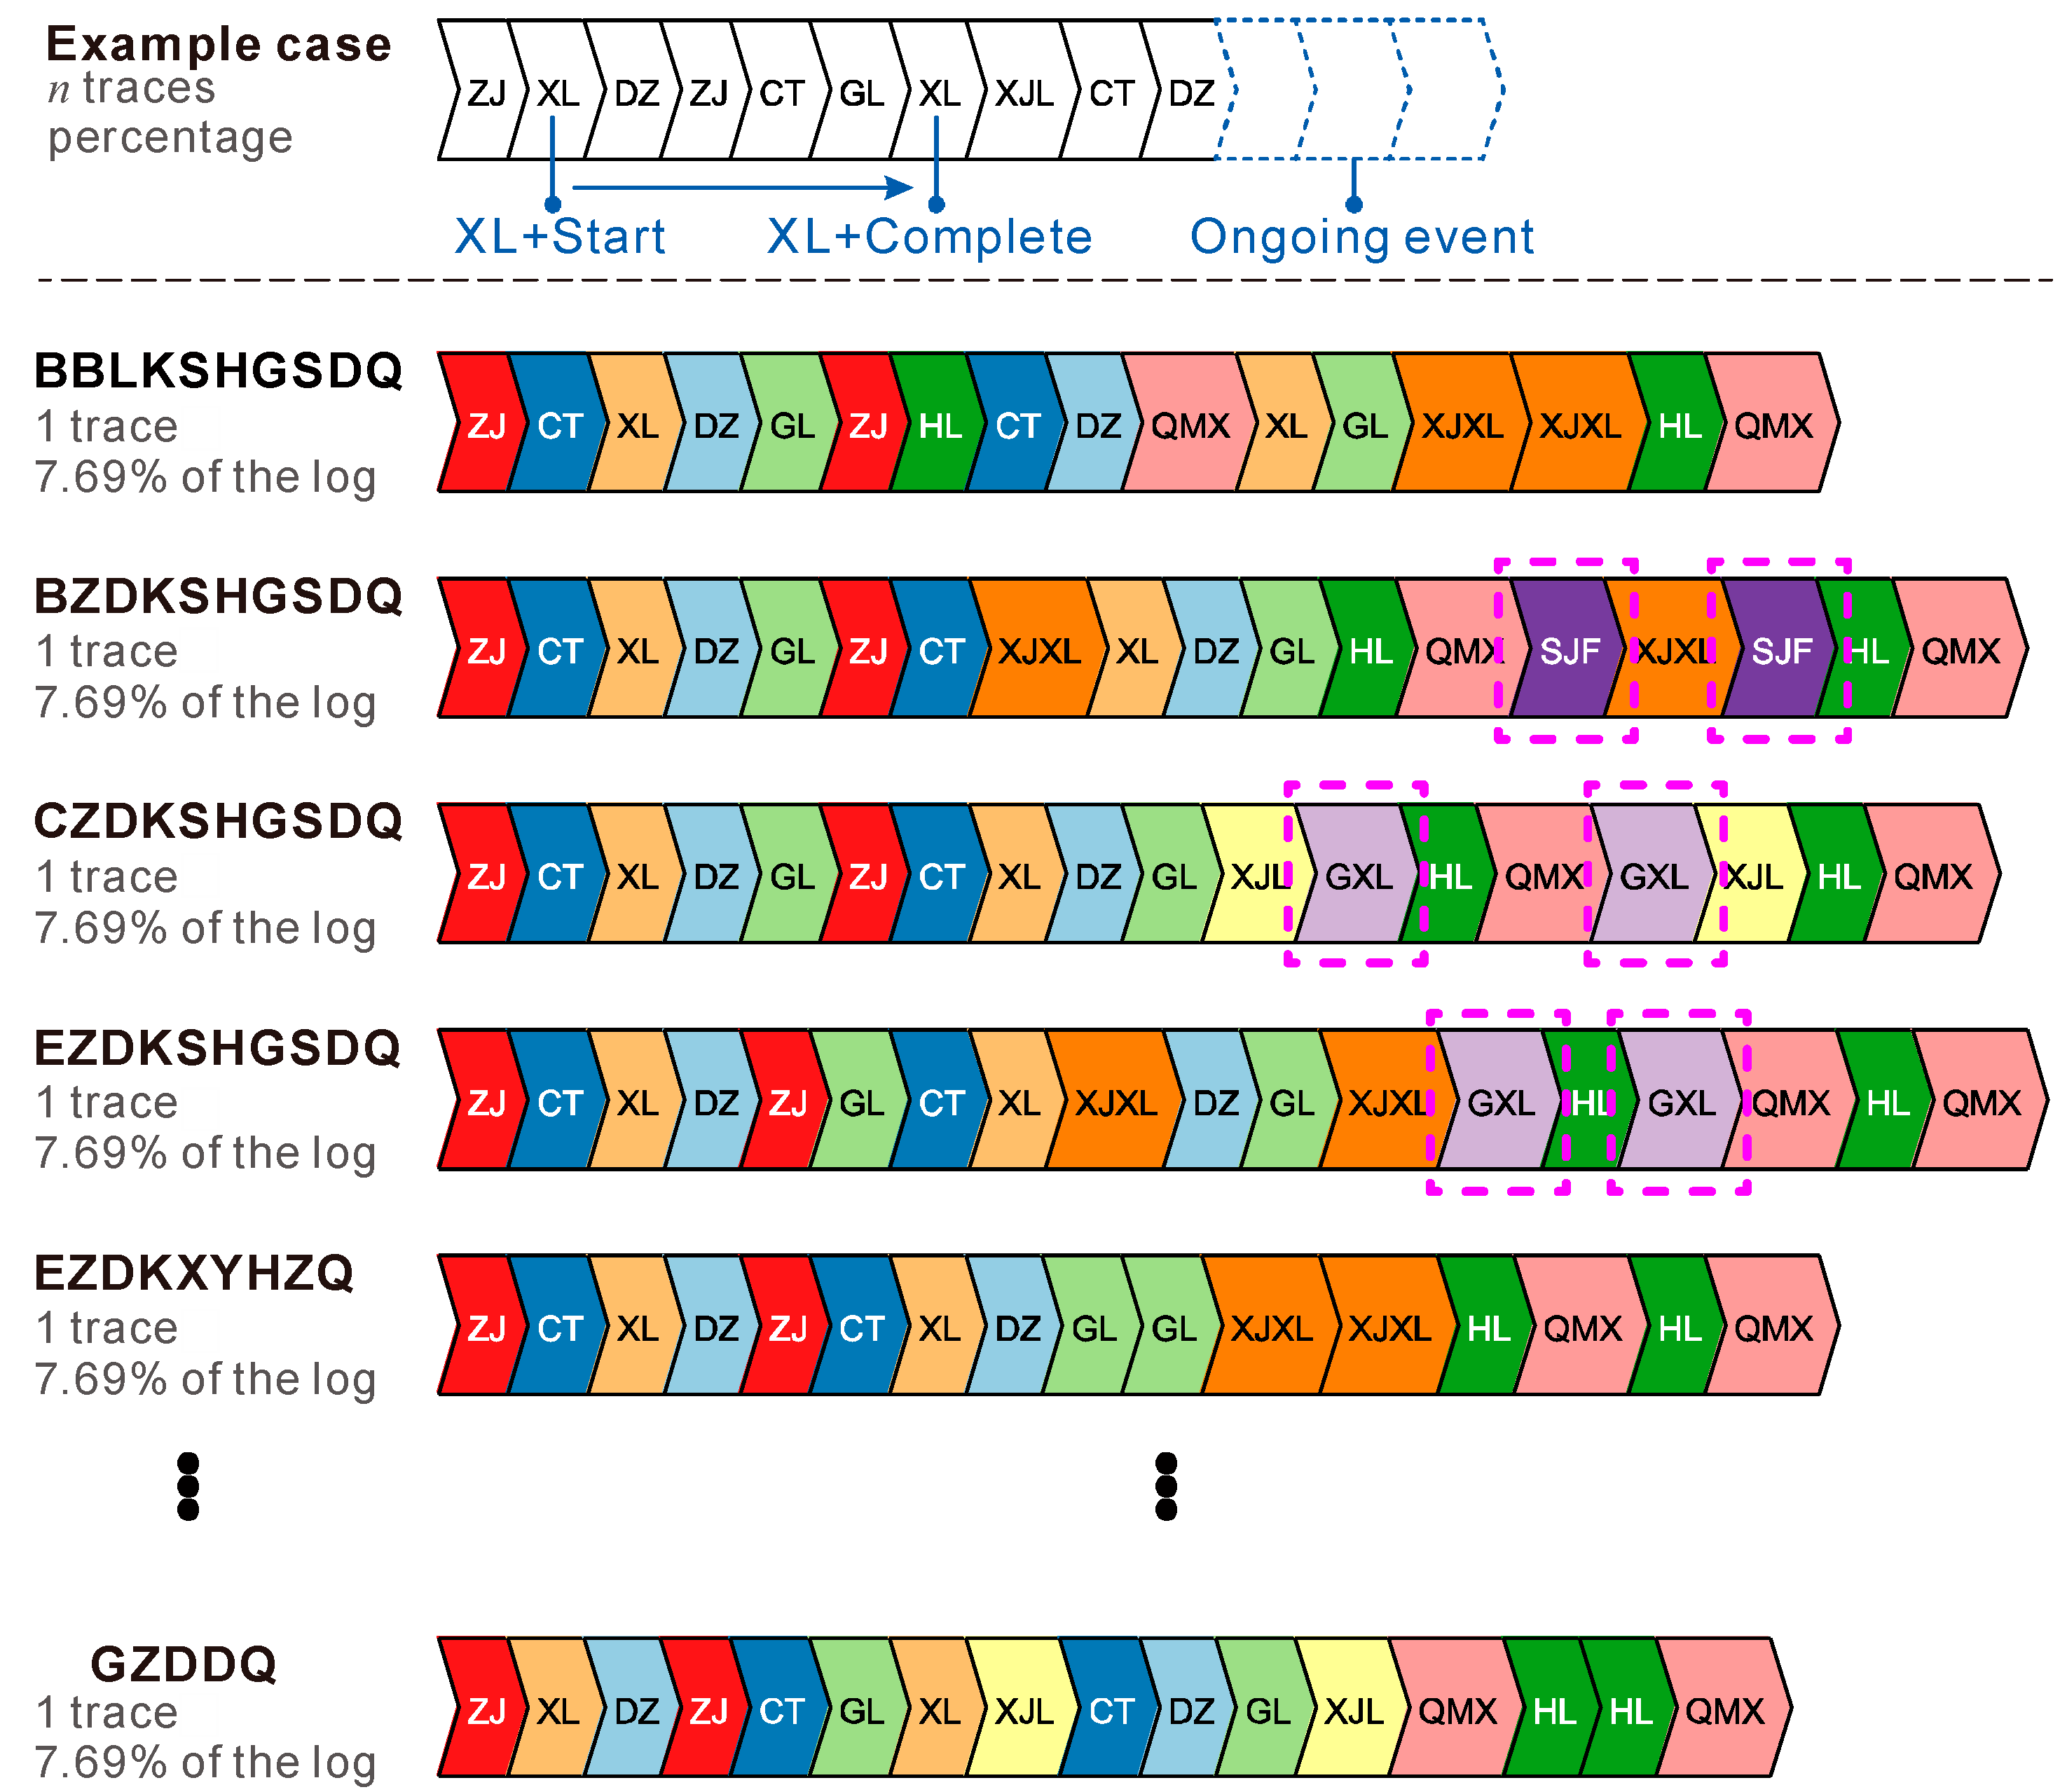
3.2.2. Event Process Variants

A process variant is the unique path from the start to the end of a process. Selecting variants within the process provides insights into good (or poor) performance patterns, which further promotes the achievement of better and more consistent process performances by the high-performing variables. From the perspective of a manager, the consideration of a series of steps when analyzing typical process execution patterns makes them easier to understand. The variants reflect the number of changes in a process, and following standard procedures is crucial for delivering consistent quality and efficient services. The frequencies of the variants reflect how often specific execution patterns occur, allowing for the distinction between mainstream and anomalous variants. Through variant analysis, the data quality can be examined, and incomplete cases can be identified and filtered before the analysis. To intuitively reflect the construction process, we used the “Explore Event Log” plugin in the ProM program to extract variants from a highway bridge construction event log.

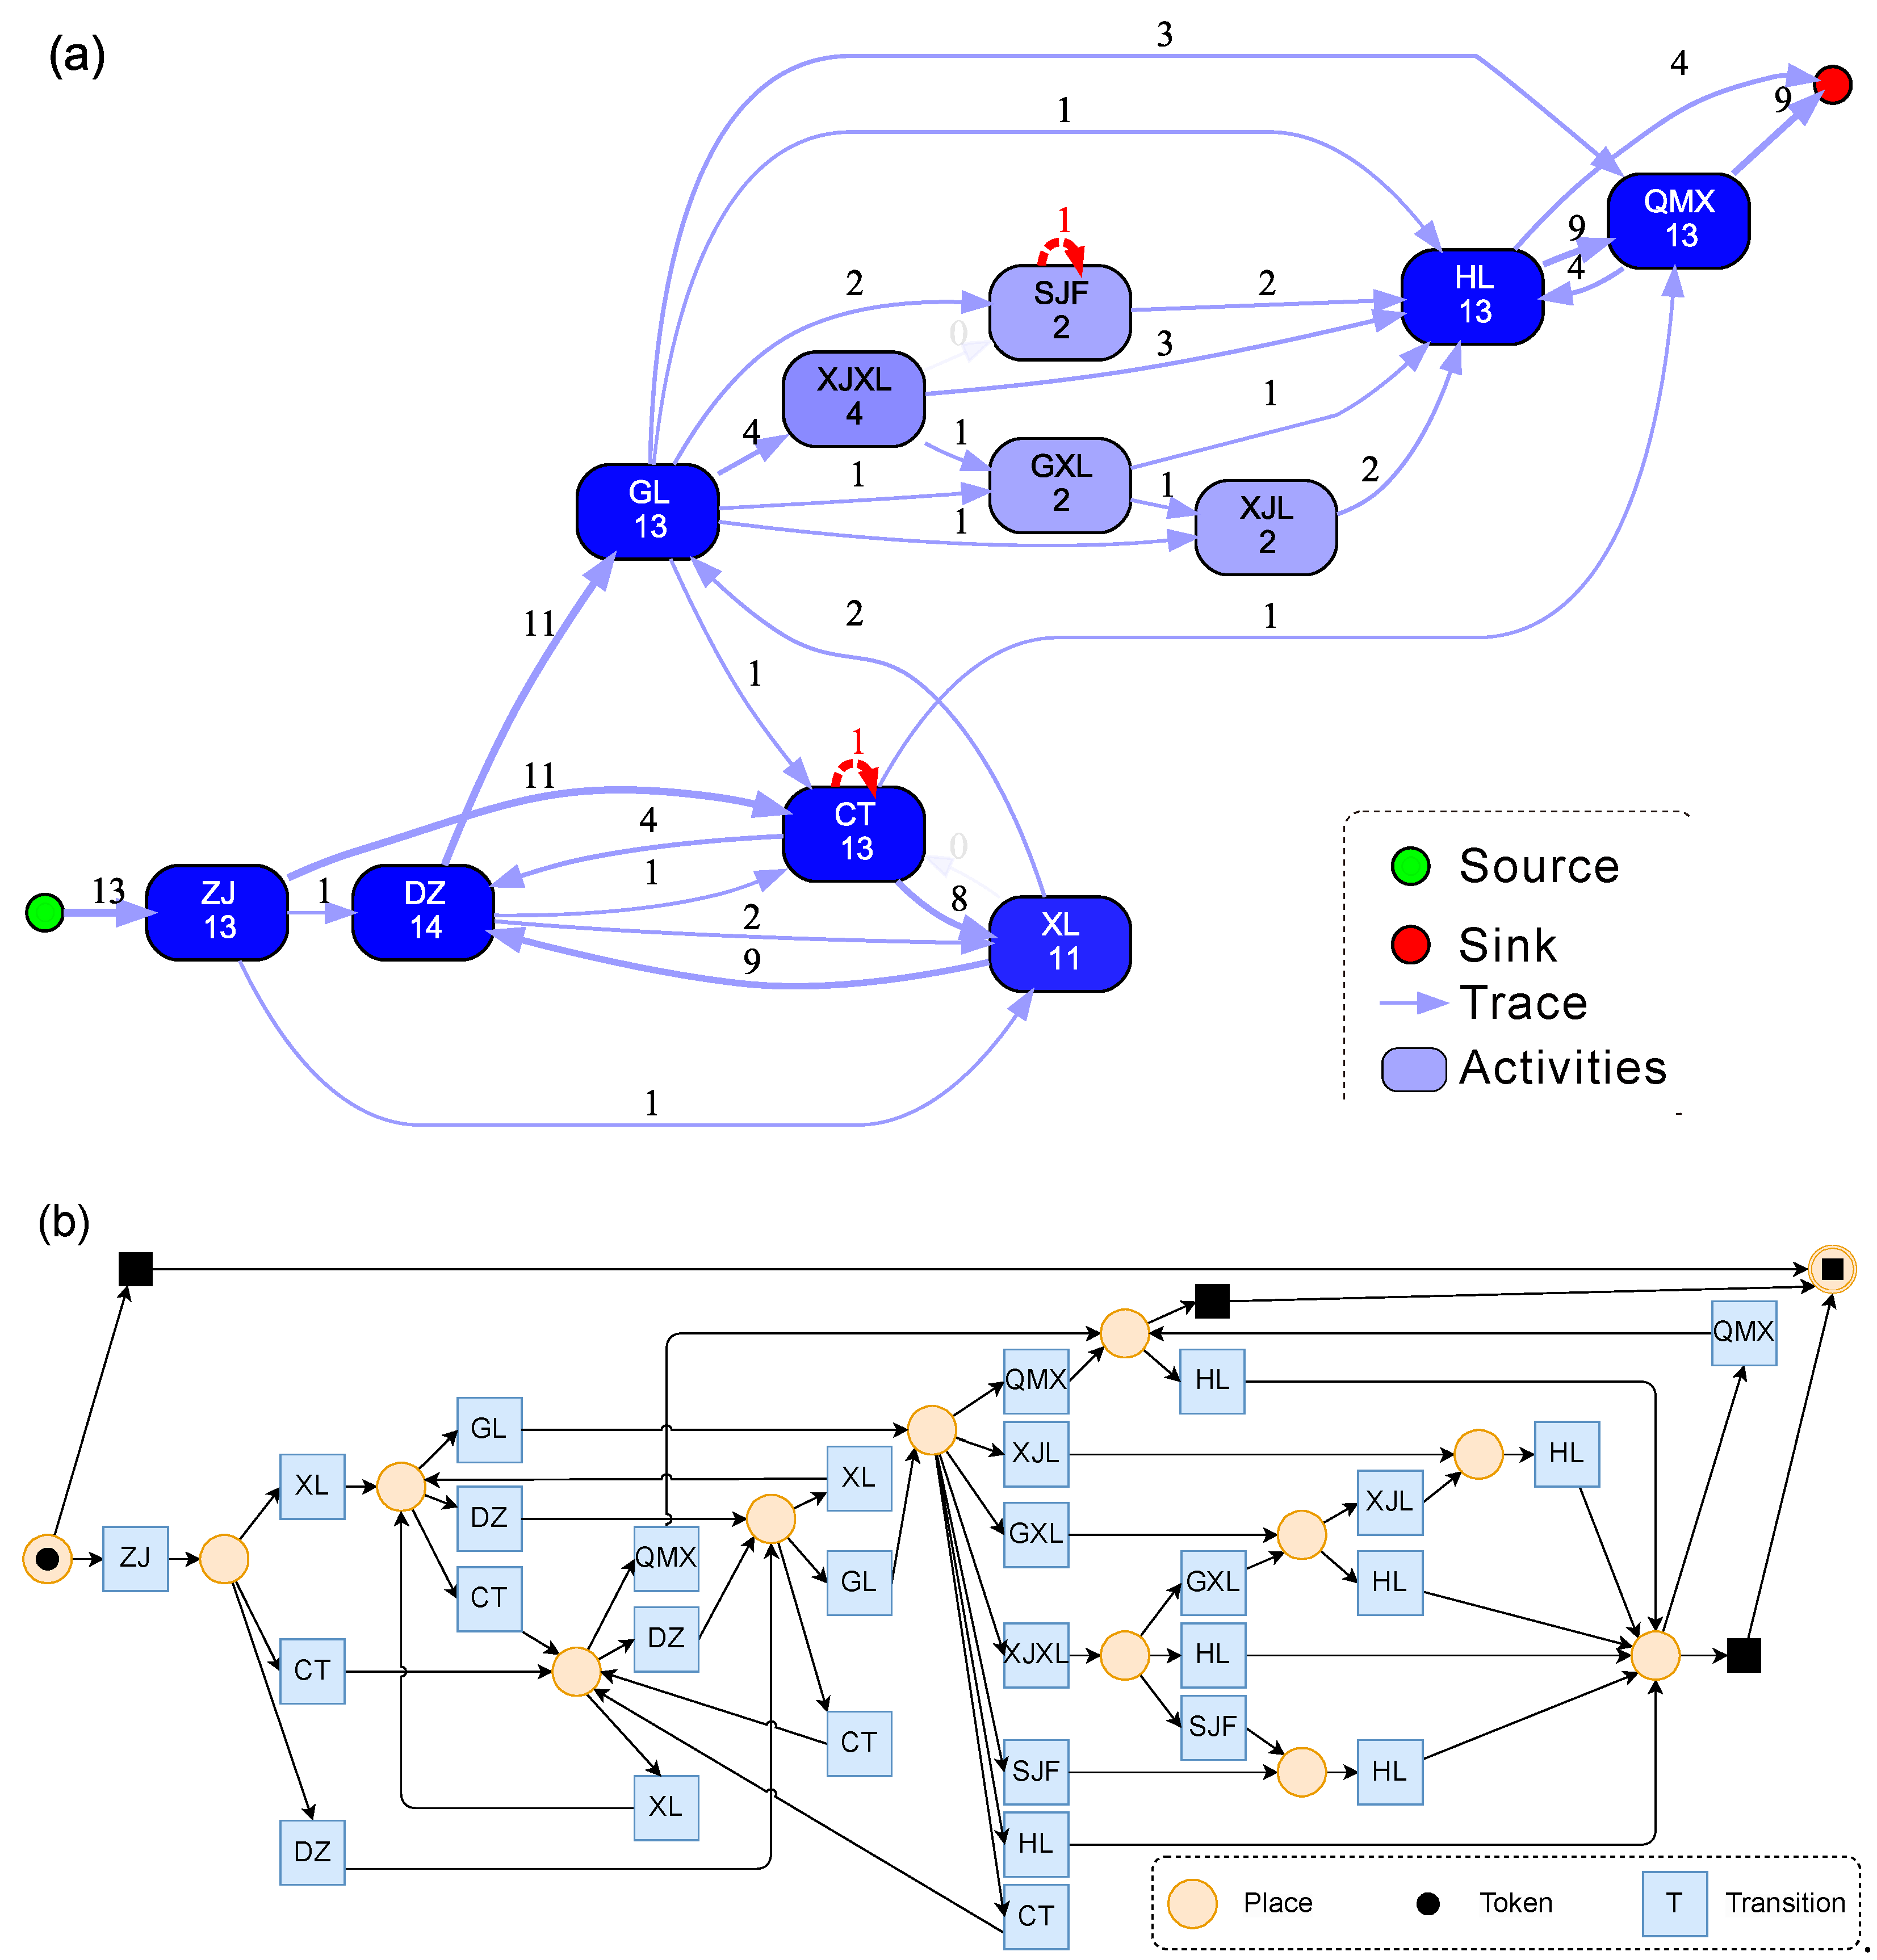
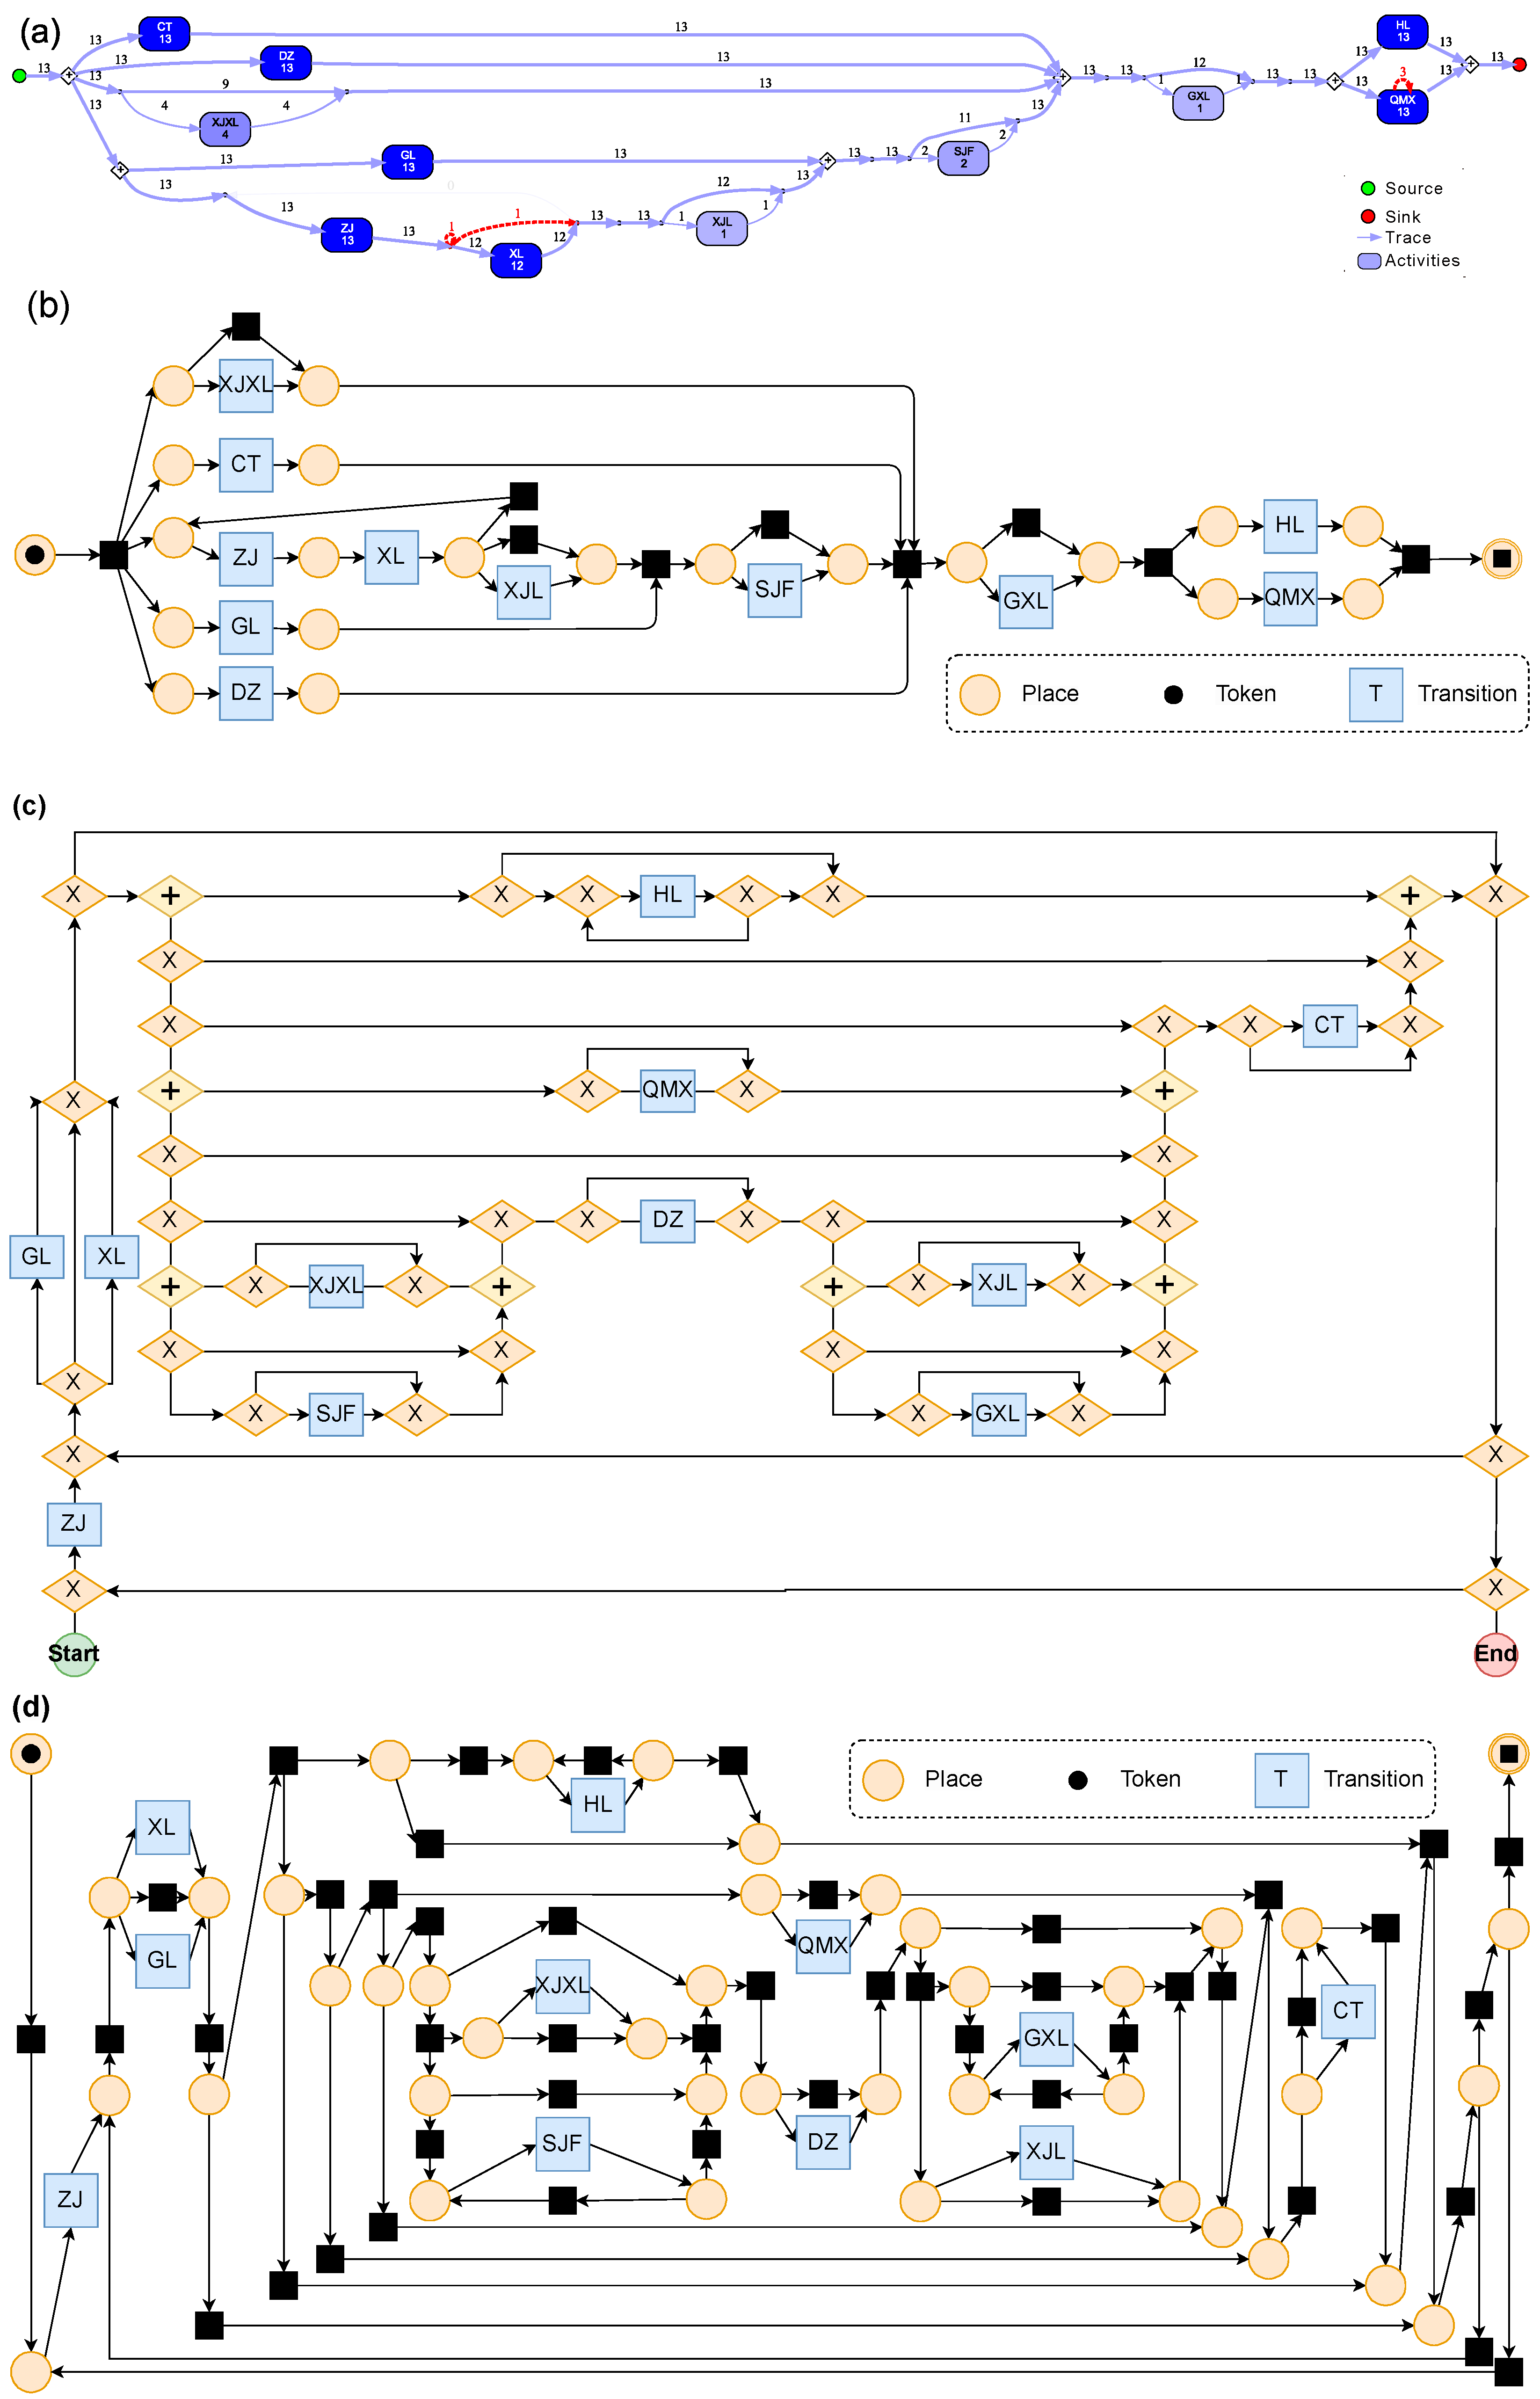
3.2.3. Process Twins Based on Process Mining

In this study, we used the direct-follow model (DFM) for the process mining, which is an improvement on the transition system and lies between the transition system and high-level languages. The main difference between the transition system and the DFM is that the DFM focuses on the sequence of activities, while the transition system emphasizes the process states [71]. In contrast, for engineering project management, process models built directly on the direct-follow relationships between activities are more interpretable. Although the DFM is simple, it tends to generate large models, and the complexity is usually reduced through abstraction and aggregation. However, this may lead to potential semantic ambiguity; thus, certain model evaluation measures need to be taken.
The DFM can be visualized through a direct-follow graph (DFG). A DFG is a directed graph wherein each vertex represents an activity in the process and each edge represents the fact that, in at least one trace of the process, the target activity immediately follows the source activity [72]. In this case study, the DFM was used for the process mining and was represented in the form of a DFG, creating a process twin based on the process model. For the highway interchange, the “direct-follows miner” tool in the “Inductive Visual Miner” plugin of ProM will be used to mine the DFM. The program allows for the selection of different activities and path counts, and the resulting DFM and DFG will vary depending on the numbers of activities and paths chosen. Subsequent evaluations were performed through consistency analysis.

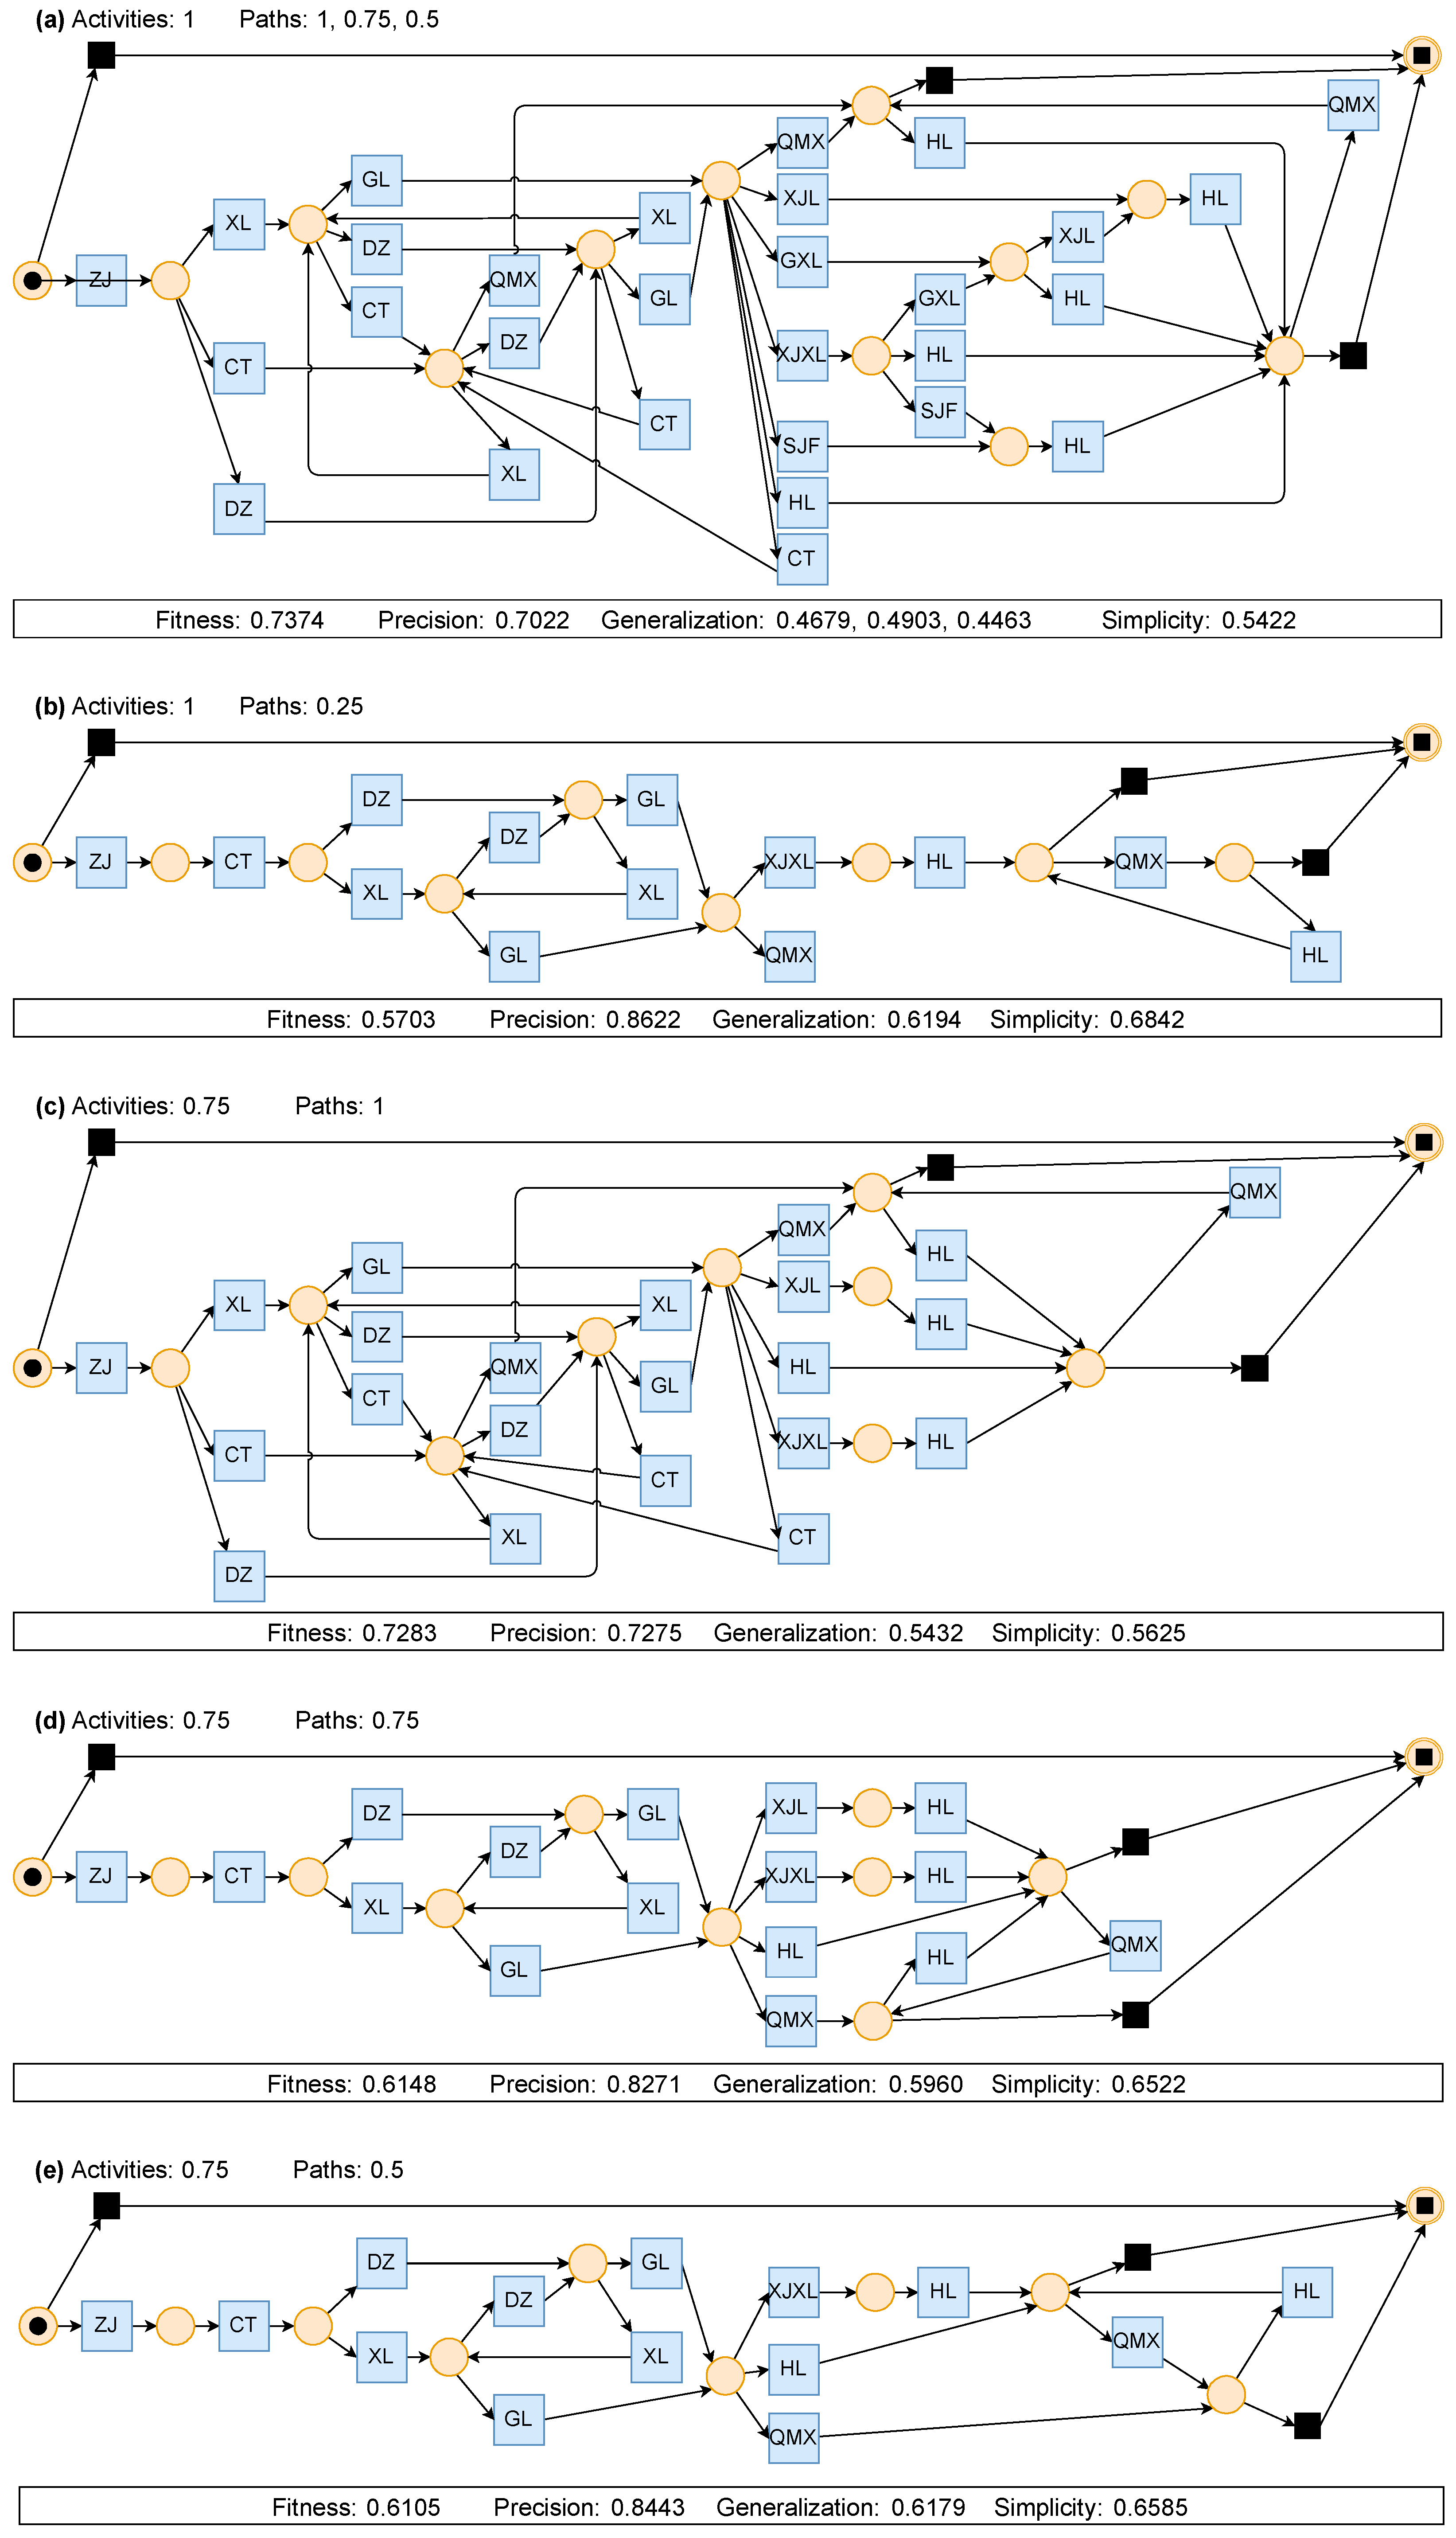
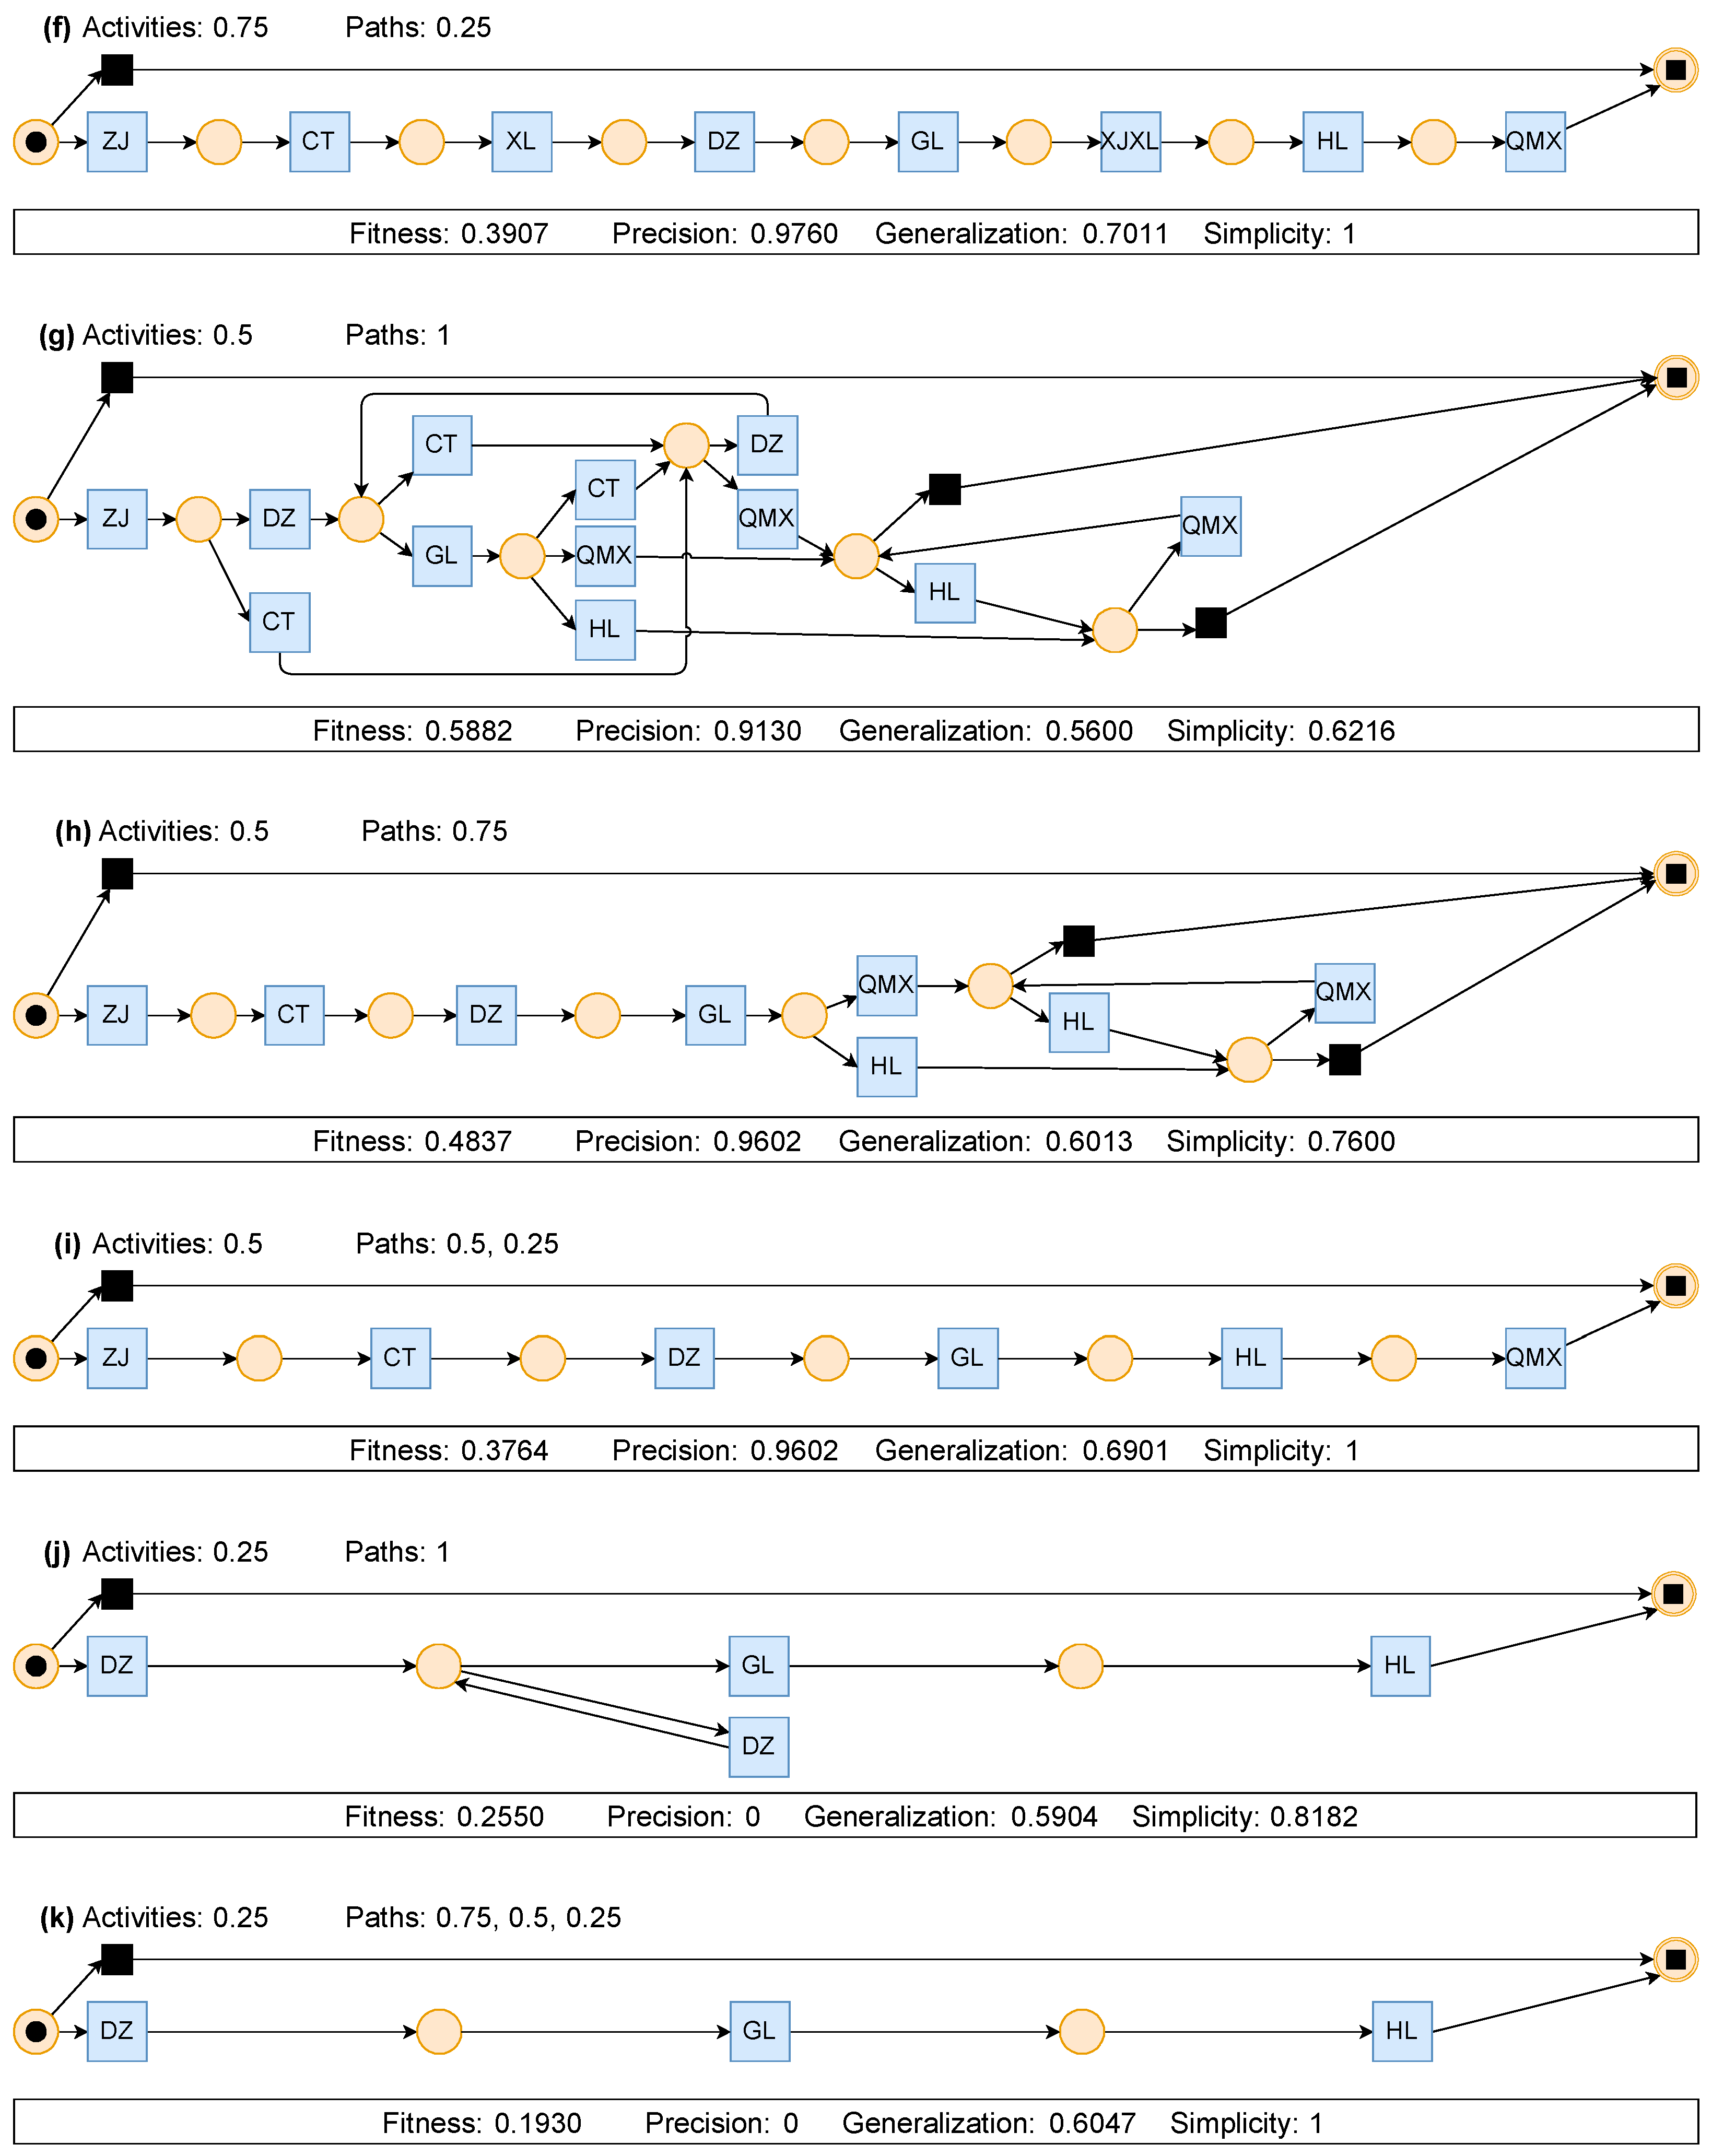
3.3. Process Twin Model Evaluation

The basic idea of process mining is the automatic construction of a suitable process model that “describes the behavior seen in the log” given an event log containing a collection of traces. However, given the characteristics of event logs in real life, learning useful process models from such logs is challenging. Event logs contain only example behaviors and do not explicitly indicate what is impossible. Moreover, the fact that an event log does not contain a specific trace does not mean that the trace is impossible [73]. Therefore, to determine whether a process twin can serve as a reasonable mapping of the process, a compliance check of the process model is necessary. Conformance checking is used to associate the events in the event log with the activities in the process model and to compare the model with the log to find commonalities and differences between the modeled and observed behavior. According to a source [46], a process model needs to strike a balance between four quality criteria: its fitness (the ability to explain observed behavior), precision (avoiding underfitting), generalization (avoiding overfitting), and simplicity (Occam’s razor).
The fitness determines how much of the behavior observed in the log is allowed by the process model and includes two methods: the token replay-based and alignment-based methods [74]. For DFM, the alignment-based method is more appropriate [75] and refers to aligning the event log with the process model, meaning that the events in the event log need to be associated with the elements in the model, and vice versa. Equation (1) provides the fitness calculation method based on alignment replay [74], which is represented as a number between 0 and 1, with 0 indicating very poor fitness and 1 indicating perfect fitness:
f i t n e s s ( L , M ) = 1 F cos t ( L , M ) m o v e L ( L ) + | L | m o v e M ( M )
where Fcost(L, M) represents the total alignment cost between the event log (L) and model (M); moveL(L) is the total cost of the moves that occur in the log but not in the model; and moveM(M) is the total cost of the moves that occur only in the model.
Although one effective way to improve the fitness is to include more parts in the process model, this may also increase the probability of overfitting. Therefore, it is advisable to avoid behaviors in the process model that are not observed in the log whenever possible [45,74]. The construction of prefix automata can be used to examine the difference between the behaviors allowed by the process model and those actually observed in the event log [76]. Consequently, the precision is reflected by the ratio of the number of activities (|enL(e)|) actually executed in the log (L) to the number of activities (|enM(e)|) enabled in the model (M). If all behaviors allowed by the model can be observed in the log, then precision(L, M) = 1. By taking the average value of all the events, the precision of the process model can be determined [74], as shown in Equation (2):
p r e c i s i o n ( L , M ) = 1 | ε | e ε | e n L ( e ) | | e n M ( e ) |
where |enM(e)| represents the number of activities enabled in the model (M), |enL(e)| represents the number of activities actually executed in the event log (L) under similar conditions, eε is an event, and |ε| is the number of events in the log (L).
A model that does not generalize is “overfitted”, which is a problem when generating a very specific model and means that the process model should not restrict the behaviors to only the examples shown in the log. Clearly, logs contain only example behaviors, meaning that the model explains the specific sample log but is unlikely to explain another sample log of the same process well. The existing research provides a specific definition for evaluating generalization [74], as shown in Equation (3). If new events are likely to exhibit previously unseen behavior, then generalization(L, M) approaches 0, and if the next event is unlikely to display new behavior, then generalization(L, M) approaches 1:
g e n e r a l i z a t i o n ( L , M ) = 1 1 | ε | e ε p n e w ( | d i f f ( e ) | , | s i m ( e ) | )
where pnew(w, n) is the estimated probability that the next visit to state s = stateM(e) will reveal a new path not seen before; w = |diff(e)| is the number of unique activities observed leaving state s; and n = |sim(e)| is the number of times state s has been visited in the event log.
The simplicity is the fourth dimension for analyzing process model; and, in this context, only Petri net models are considered. For the simplicity, the standard used is anti-aliasing, as introduced in the literature [77]. The average degree (Dmean) is considered, which is defined as the sum of the numbers of input and output arcs. If all places have at least one input arc and one output arc, this number is at least 2. A number (k) is chosen between 0 and infinity, and then the simplicity based on anti-aliasing is defined as in Equation (4) [78,79]. The simplicity value ranges from 0 to 1, with higher values indicating a simpler model:
s i m p l i c i t y ( M ) = 1 1 + max ( D mean k , 0 )
In summary, fitness indicates that any trace appearing in the event log is a possible sequence in the process model and that the resulting model should allow the behaviors reflected in the event log to occur, precision means that the resulting model should not allow behaviors unrelated to those reflected in the event log, generalization implies that the resulting model should generalize the example behaviors in the event log, and simplicity suggests that the resulting model should be as simple as possible. These four quality criteria are often contradictory, and a process model may not simultaneously satisfy all of them, necessitating the determination of importance weights among them.

4. Results

4.1. Construction Progress Log

The event log for this case study was the construction progress log for the Xinlian Hub of the Nantong Ring Expressway in China. The Xinlian Hub mainly consists of bridges, and the event log includes data on the construction of 13 them (Figure 3). Using these 13 bridges as cases, each bridge’s respective sub-projects were treated as event activities. The case names were based on the codes from the BIM model to improve the model compatibility and are as follows: ZXKSHGSDQ; BZDKSHGSDQ; EZDKSHGSDQ; CZDKSHGSDQ; LXHZQ; DYHHEHZQ; GZDDQ; EZDKXYHZQ; IZDKXYHZQ; HZDKXYHZQ; FZDKXYHZQ; BBLKSHGSDQ; and XYHZQ (Figure 3). Similarly, event activities were exported from the BIM system, and the representative core tasks of the bridges (a total of 102 events) are selected to reduce complexity. The activities included pile foundations (ZJ), caps (CT), tie beams (XL), piers (DZ), cap beams (GL), wet joints (SJF), guardrails (HL), bridge deck systems (QMX), cast-in-place tie beams (XJXL), cast-in-place beams (XJL), and steel box girders (GXL). Because the UAV working time granularity is in “days”, the event timestamps are recorded in dates, which is sufficient for highway construction. An overview of the construction event log is shown in Table 3.

4.2. Highway Construction Process Variants

Figure 6 shows some of the variants of the highway bridge construction process. Through the physical twin cloud database, construction event logs generally store logs for the same date. Traditionally, construction logs are handwritten daily records of work, but this method makes it relatively difficult to understand the construction process of a specific bridge. From the project manager’s perspective, a series of steps related to the process execution would be more intuitive and easier to read. For example, in the first variant shown in Figure 6, ZJ+Start → CT+Start → XL+Start → DZ+Start → GL+Start → ZJ+Complete → HL+Start → … → HL+Complete → QMX+Complete. This variant records the various stages of the construction case and separately displays the start and end of the same task, intuitively showing the actual task status.
The number of construction variants reflects the number of different construction processes. Following standardized construction processes can reduce unnecessary additional risks and improve the construction quality. At the same time, the construction variants frequencies reflect the prevalence of specific construction workflows, distinguishing mainstream construction processes from anomalies. Because this case involved interchanging the bridge with differences in bridge size and structure, each bridge’s construction process varied to some extent. Therefore, each variant represents a trace, which can also be understood as the number of cases. If projects are similar, ideally, the same variant would be presented. If other variants appear, the differences in the actual construction process can be analyzed to identify the construction risks.
High-frequency variants can be managed uniformly, while low-frequency variants can be managed with targeted strategies. For example, the BZDKSHGSDQ case has a unique wet joint event (SJF), and the CZDKSHGSDQ/EZDKSHGSDQ cases involve steel box girder construction (GXL), which require separate management. Additionally, variant analysis can be used to determine whether there are incomplete construction tasks, prompting further reminders. For instance, if a variant ends with bridge deck systems, then the project may be complete, and if it ends with a non-bridge deck system, then the project is likely still ongoing, as shown in the example variant in Figure 6.

4.3. Highway Construction Process Twins

The presented DFG in Figure 7 is the result of process mining under the following conditions: activity = 1 (100%) and path = 1 (100%). In Figure 7a, the green dot on the left and the red dot on the right represent the start and end, respectively. In this process mining, based on the construction logs, specific construction tasks were treated as event activities, which are represented as rounded rectangles in the figure. The color intensities of these rectangles indicate the numbers of times the activities were performed. For example, ZJ was performed 13 times and GXL was performed 2 times. The arcs represent the potential direct-follow relationships discovered in the mining process, and the thickness of the arcs indicates the number of variants that followed this path, such as 11 instances for ZJ→CT. The DFG provides a clear visualization of the actual process, with its high readability being one of its key advantages. However, for computer operations, Petri nets offer better mathematical expression. Therefore, converting the DFG into a Petri net is essential for subsequent analyses. This conversion from the DFG to a Petri net can be achieved through PM4Py (a Python library for process mining) [80], as shown in Figure 7b. For comparison, we also attempted other mining algorithms using the inductive mining model for process mining, as shown in Figure 8a,b. BPMN (Business Process Modeling Notation) models are commonly used in the field of management and were also explored for comparison in this study (Figure 8c,d).
Additionally, CM is divided into different levels, with different managers focusing on varying degrees of granularity in construction activities. Senior managers tend to focus on more holistic, macro-level processes, while lower-level managers are more concerned with detailed processes. Therefore, during the process mining, models ranging from complex to simple were extracted. Figure 9 shows Petri nets with different granularities. In the figure, the different activities represent the frequencies of their occurrence within the event. Based on this, the event log could be filtered, meaning that infrequently occurring activities could be removed. Different paths indicate the filtering of the DFM, either by removing infrequent traces before mining or by deleting infrequent paths after discovery, typically removing the edges that appeared the least number of times. Through the mining of the DFM and the visualization of Petri nets, the process twin creation for the fragmented event logs in the cloud database of the highway interchange project demonstrated a certain degree of feasibility.

4.4. Process Twin Evaluation

In the process mining, Petri nets with different granularities were obtained by adjusting the proportions of the activity and path counts. The activity count parameters were set to 1, 0.75, 0.5, and 0.25; and the path count parameters were set to 1, 0.75, 0.5, and 0.25. As the proportions of the activity and path counts decreased, the DFG became simpler. A quantitative evaluation of the process models was conducted using the four key evaluation metrics for the process performance, as shown in Table 4. The results indicate that the DFM with activity and path count proportions of 1 achieved a fitness and precision scores above 0.7, while the generalization and simplicity were around 0.5. Additionally, a model mined using the inductive mining algorithm was also evaluated for comparison with the DFM, and its fitness, precision, generalization, and simplicity scores were 0.7148, 0.2284, 0.7128, and 0.7049, respectively, while the four evaluation metrics for the BPMN model were 1, 0.2135, 0.6855, and 0.6757, respectively.

5. Discussion

5.1. Construction Progress Evaluation

Time and resource allocation issues are often the primary considerations in CM. By discovering process models, the key activities and time consumption in the bridge construction process can be understood, allowing for the further diagnosis of the most common construction activity bottlenecks and the interdependencies between the activities, reducing scheduling risks and improving the construction efficiency. A DFG with time information was generated, as shown in Figure 10. The times above and below the activities in the figure represent the average waiting time and average service time (sojourn time), respectively, the definitions of which are presented in the legend.
The bridge deck system (QMX) and guardrail (HL) were the activities with longer waiting times at 305 days and 197 days, respectively. The construction of the bridge deck system and guardrail are completed later in the bridge construction process, generally requiring the full completion of the preceding works. The figure shows that the guardrail activity has many preceding construction activities, reflecting this point. Due to the uneven completion times of the preceding works, the bottleneck effect will impact the implementation of the guardrail activity. For example, the unexpected long retention time of 394 days for the wet joint activity will directly affect the subsequent construction activities. Ensuring the timely implementation of the guardrail construction activity is one of the schedule risks that managers need to focus on controlling.
The longer waiting time for the bridge deck system is also shown by the model. From the construction process perspective, the bridge deck system generally refers to the auxiliary facilities of the bridge, such as the deck paving, which differ significantly from earlier construction processes. The possible reason for the longer waiting time for the bridge deck system could be the irrational allocation of resources due to changes in the construction processes, such as different types of work and construction equipment, or the concentrated scheduling of special processes for the bridge deck system. Additionally, the cap beam is shown to be in a critical position in the DFG, with many subsequent construction activities. Cap beam construction delays impact the overall construction schedule. These critical construction activities are also key points for progress risk consideration.
The service time directly reflects the duration of the current activity. Among these activities, the pile foundation (ZJ), cast-in-place tie beams (XJXL), wet joints (SJF), and bridge deck system (QMX) have longer durations. The duration is directly related to the amount of work and resource allocation and whether there is a risk or cannot be directly determined from the figure. However, in traditional construction, the progress is often planned in advance so that it can be compared with the planned time to make a judgment. This comparison and analysis are conducted in the subsequent section.
In summary, sudden changes at various construction nodes can affect the resource allocation planning for the subsequent stages. From the perspective of the DFG, it is important to minimize the critical nodes in key positions and to reduce the node degree to improve the overall resilience of the construction process. Project managers can use process discovery models to adjust the schedule planning and reduce the progress risks.
BIM has practical planning characteristics. In the Xinlian Hub project of this case, BIM provided the early planning for the construction progress, which reflects the existing knowledge of experienced engineers and has a high degree of rationality. By comparing the actual construction logs with the construction planning, construction activity delays can be identified, allowing for a further diagnosis of the causes and making adjustments. For the comparison analysis, we used the “Process Comparator” plugin in ProM, and the results are represented by transition systems, which have the advantage of strong comparability [81]. The comparison results are shown in Figure 11, where XA and XB represent the planned and actual variants, respectively.
In Figure 11a, the blue or red arc between two nodes (representing activities) highlights the waiting time between the completion of one activity and the start of another. The different shades of blue and red visually display the magnitude of the differences (the darker the color, the greater the difference). The red arcs, such as [GL]→[XL], [XL]→[XJL], and [XJL]→[QMX], indicate that the actual construction waiting time is longer than the planned time, showing delays in the actual construction process. The blue arcs, such as [XL]→[CT], [DZ]→[CT], and [GL]→[XJXL], indicate that the actual construction waiting time is shorter than the planned time, showing an ahead-of-schedule construction process. In Figure 11b, the nodes (representing activities) are highlighted in blue or red, indicating the service times of the activities. The blue nodes, such as [GL] and [DZ], indicate that the actual construction time consumed for the task was shorter than the planned time, meaning that the construction task duration was reduced.
The process comparison analysis highlights the differences between actual and planned construction activities, which can be understood as reflections of the irrationality of the existing knowledge or as progress risks arising from the actual construction. Therefore, relying solely on 4D-BIM for process twins has limitations, and model mining and reconstruction need to be carried out using actual construction logs.

5.2. Process Model Selection

Process mining involves modeling event logs, and discrepancies with the actual logs are inevitable. The significant advantage of the “Inductive Visual Miner” plugin is its ability to compare the model with the actual process in the event logs. Qualitative conformance checking can be performed through log moves. The deviations between the model and log (indicated by the red arcs in Figure 12) show that an event appeared in the log, but the model did not allow it. There are only two discrepancies between the model and log, which is acceptable for 13 cases. By filtering the logs, we found that one of the discrepancies belonged to the GZDDQ case. A further comparison of the DFG with the variant corresponding to this case revealed that the model was missing the XL activity. An examination of the construction technology for the bridge associated with the GZDDQ case revealed that not all the pile foundations were linked by tie beams, and only a few contained them, a discrepancy that might be due to deviations in the actual construction progress recorded by the UAVs.

5.3. The Weighting of the Four Evaluation Indicators

The fitness refers to the ability of the process model to reproduce the event log, making this metric particularly important. As shown in Figure 9i–k, only the most frequent traces were modeled, which did not adequately reproduce the event log. However, when a model exhibits good fitness, two scenarios can arise: overfitting and underfitting, and the process model needs to strike a balance between the two.
Overfitting occurs if a model does not generalize and only allows the behaviors recorded in the log to occur, and it is characterized by very high precision and very low generalization. The models shown in Figure 9g,h are overfitted.
The other extreme is underfitting, where the precision is very low, but the event log can be perfectly reproduced, resulting in high fitness. For example, the models mined using the Inductive Miner (Figure 8a,b) have a precision of only 0.2284; the BPMN models (Figure 8c,d) have a fitness of 1, meaning that all events were reproduced, but the precision is only 0.2135, with an acceptable generalization capability. However, such overly generalized models are of no value for process twins.
Therefore, when selecting a model, it is crucial to consider all the evaluation metrics and find a balance between underfitting and overfitting.
When determining whether the observed deviations are acceptable, it is necessary to comprehensively consider the fitness, precision, generalization, and simplicity based on the management level. For example, inductive mining performs well in terms of fitness, generalization, and simplicity but has very low precision, indicating overgeneralization, which makes it unsuitable for constructing process twin models. To visually reflect the trends of the four metrics, each metric is visualized, as shown in Figure 13. According to the figure, there is a trade-off between the fitness and precision within a certain range. At the point at which the fitness is the highest, the precision is not (approximately 0.7), and when the precision is at its maximum (approximately 0.9), the fitness is only approximately 0.4. The generalization remains moderate (between 0.45 and 0.70), with no extreme highs or lows. The simplicity is evaluated based on the degree of the model’s network structure, independent of the log, and simpler models with higher simplicity tend to have lower fitness.
When selecting an appropriate model, it is necessary to comprehensively consider the applicable scenarios and choose the relevant metrics for evaluation.

5.4. Limitations and Future Research Work

In this study, we developed a process mining-based approach to exploring the twin mapping of construction activities, focusing on modeling only a small part of the digital twin to assess the feasibility of this research path.
Of course, process twins have certain limitations. Process mining is highly dependent on the quality of the input data, which may include incomplete or noisy data, potentially leading to inaccurate analysis results. The initial attempt at modeling a twin system may require the careful consideration of the four quality standards and data filtering, which could present potential issues. In addition, the data quality issues encountered in data mining need to be addressed in process twins as well, such as data standardization, diversity, and heterogeneity and large computational loads.
In this study, a process twin was established for the construction progress. However, physical twins are relatively complex, and this process twin might involve the entire lifecycle. As a result, process twins could evolve into process-level twins, which is a digital twin granularity issue that needs to be considered not only in process twins but also in physical twins. In this study, the data acquisition and modeling were demand driven to reduce the modeling complexity and improve the modeling speed.
From an engineering perspective, the integration of resources such as manual labor and machinery at various stages needs to be incorporated into the model. Future phases, such as project acceptance and operation, also need to be considered, which requires more complex process models. A subject for further research is the application of the “networks of networks” concept to investigate whether embedded models can be constructed, such as process models of processes.
Currently, construction projects generally adhere to unified technical specifications, and similar projects exhibit similarities in their construction processes. Process mining provides a mathematical expression that is more suitable for computer language understanding for construction processes. For instance, the mathematical logic of Petri nets has been rigorously proven. In this case, the process mining of the highway construction progress clearly outlined multiple process variants. Identical processes have the same variants, and the number of cases is reflected in the occurrence probability of the variants, which provides a convenient data foundation for subsequent artificial intelligence training. Our team is conducting deep neural network training based on process models and variants, focusing on automatically generating subsequent activities and predicting their timing based on preceding construction activities to assist construction management. In the medical field, Kempa-Liehr et al. (2020) designed a process mining pipeline using the process mining software ProM and used a machine learning method based on probabilistic programming to explore the pathway features that affect patient recovery times [81]. Additionally, the recent preprint literature has already explored related research, such as the integration of large language models (LLMs) such as ChatGPT into process mining tools [82]. Colonna et al. (2024) studied the vector representation of Petri nets (PetriNet2Vec), which can learn their structure and the main attributes used to simulate dataset process models [83], providing a convenient tool for AI training in process mining.
Returning to CM, could the extensive learning of process models enable the prediction of the completion and service times for construction activities? Could historical project process models be used to automatically generate progress plans? A process model can be understood as a directed graph, and from the perspective of network science, the resilience of such networks becomes a topic of interest [84]. For CM, based on system dynamics theory, the resilience of a construction process model can be assessed to quantify the risk of one construction activity impacting the progress of other activities and the overall project, enabling more long-term risk warnings. The above research questions could bring about revolutionary improvements to the bidirectional mapping, control, and early warning capabilities of DTs.

6. Conclusions

In this paper, we addressed the issue of missing progress management in the construction process within a DT of CM, proposing a process twin based on process mining to supplement the DT and presenting a DT framework, including the process twins that is suitable for CM. Using a highway hub project as an example, we constructed a progress process model from scattered construction progress logs in the physical twin, evaluated the consistency of the model, and analyzed the bottlenecks and lead-lag issues in the construction activities. The main conclusions are as follows:
  • A DT model suitable for highway CM was constructed.
  • Process mining was used to map the construction activities to the DT, establishing a process twin distinct from the physical entity twin and thereby addressing the deficiency of the process information in CM DTs.
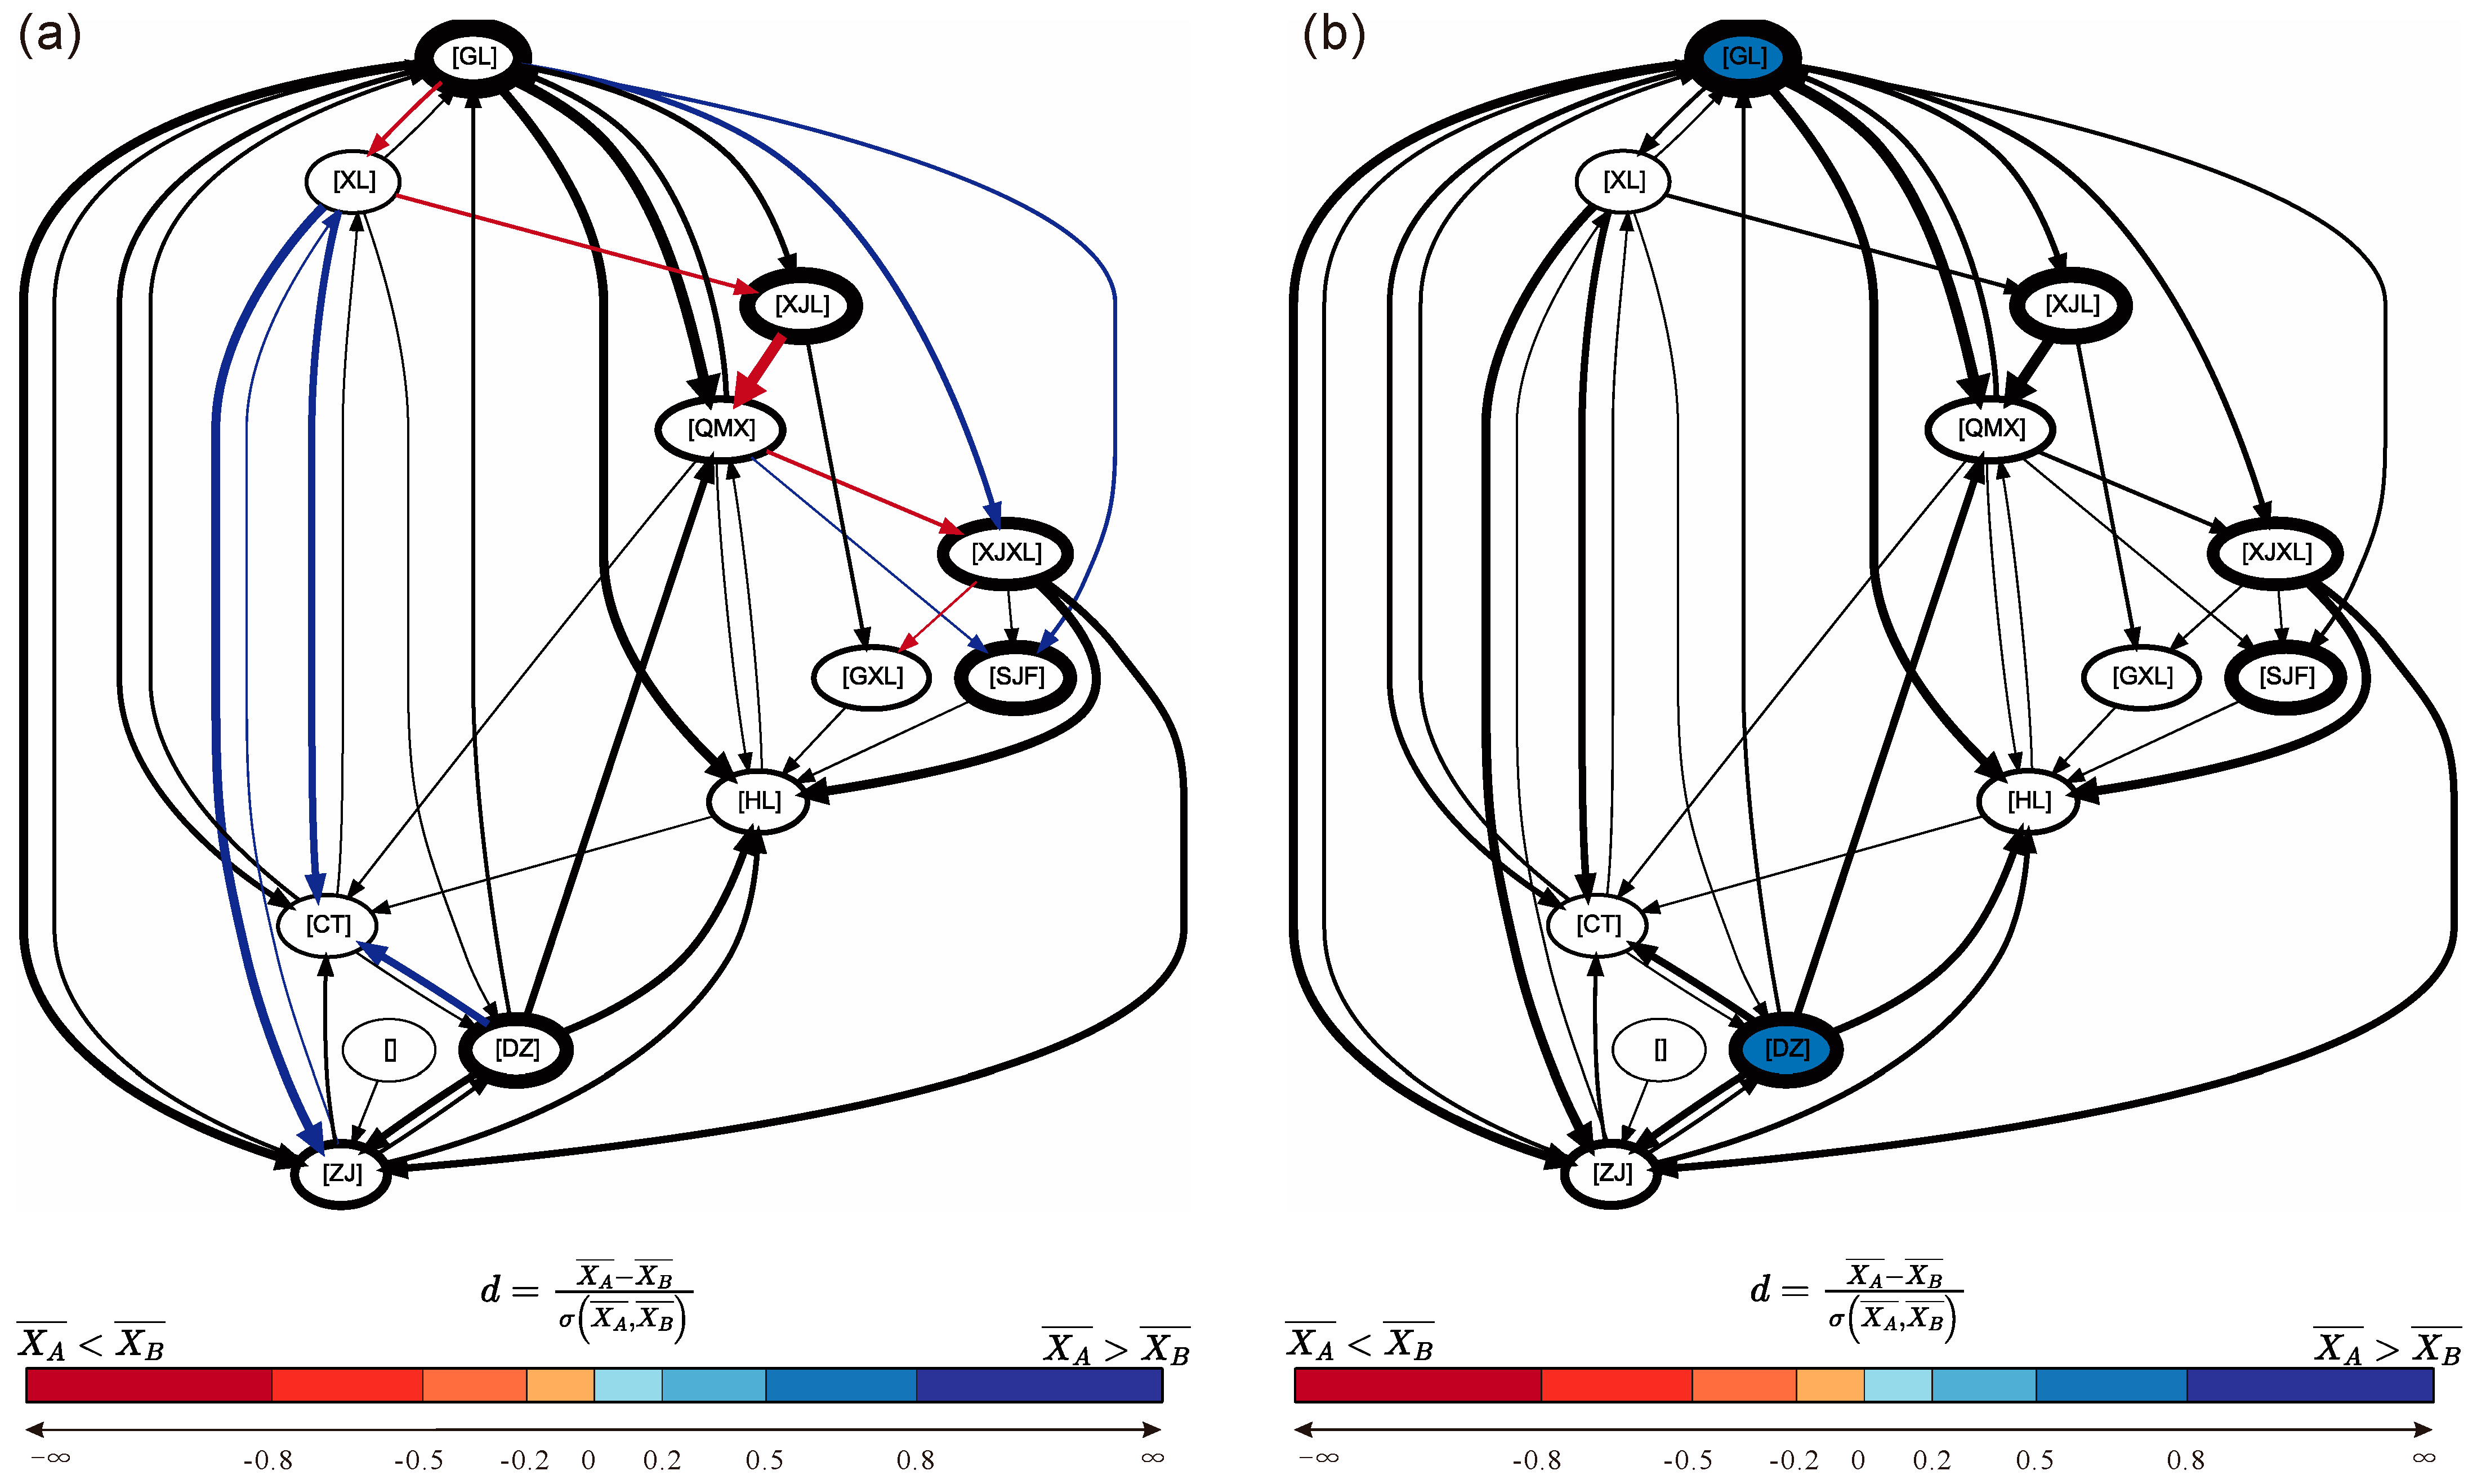
  • Abnormal changes in construction processes can be analyzed through process variants, enabling the early detection of potential construction risks.
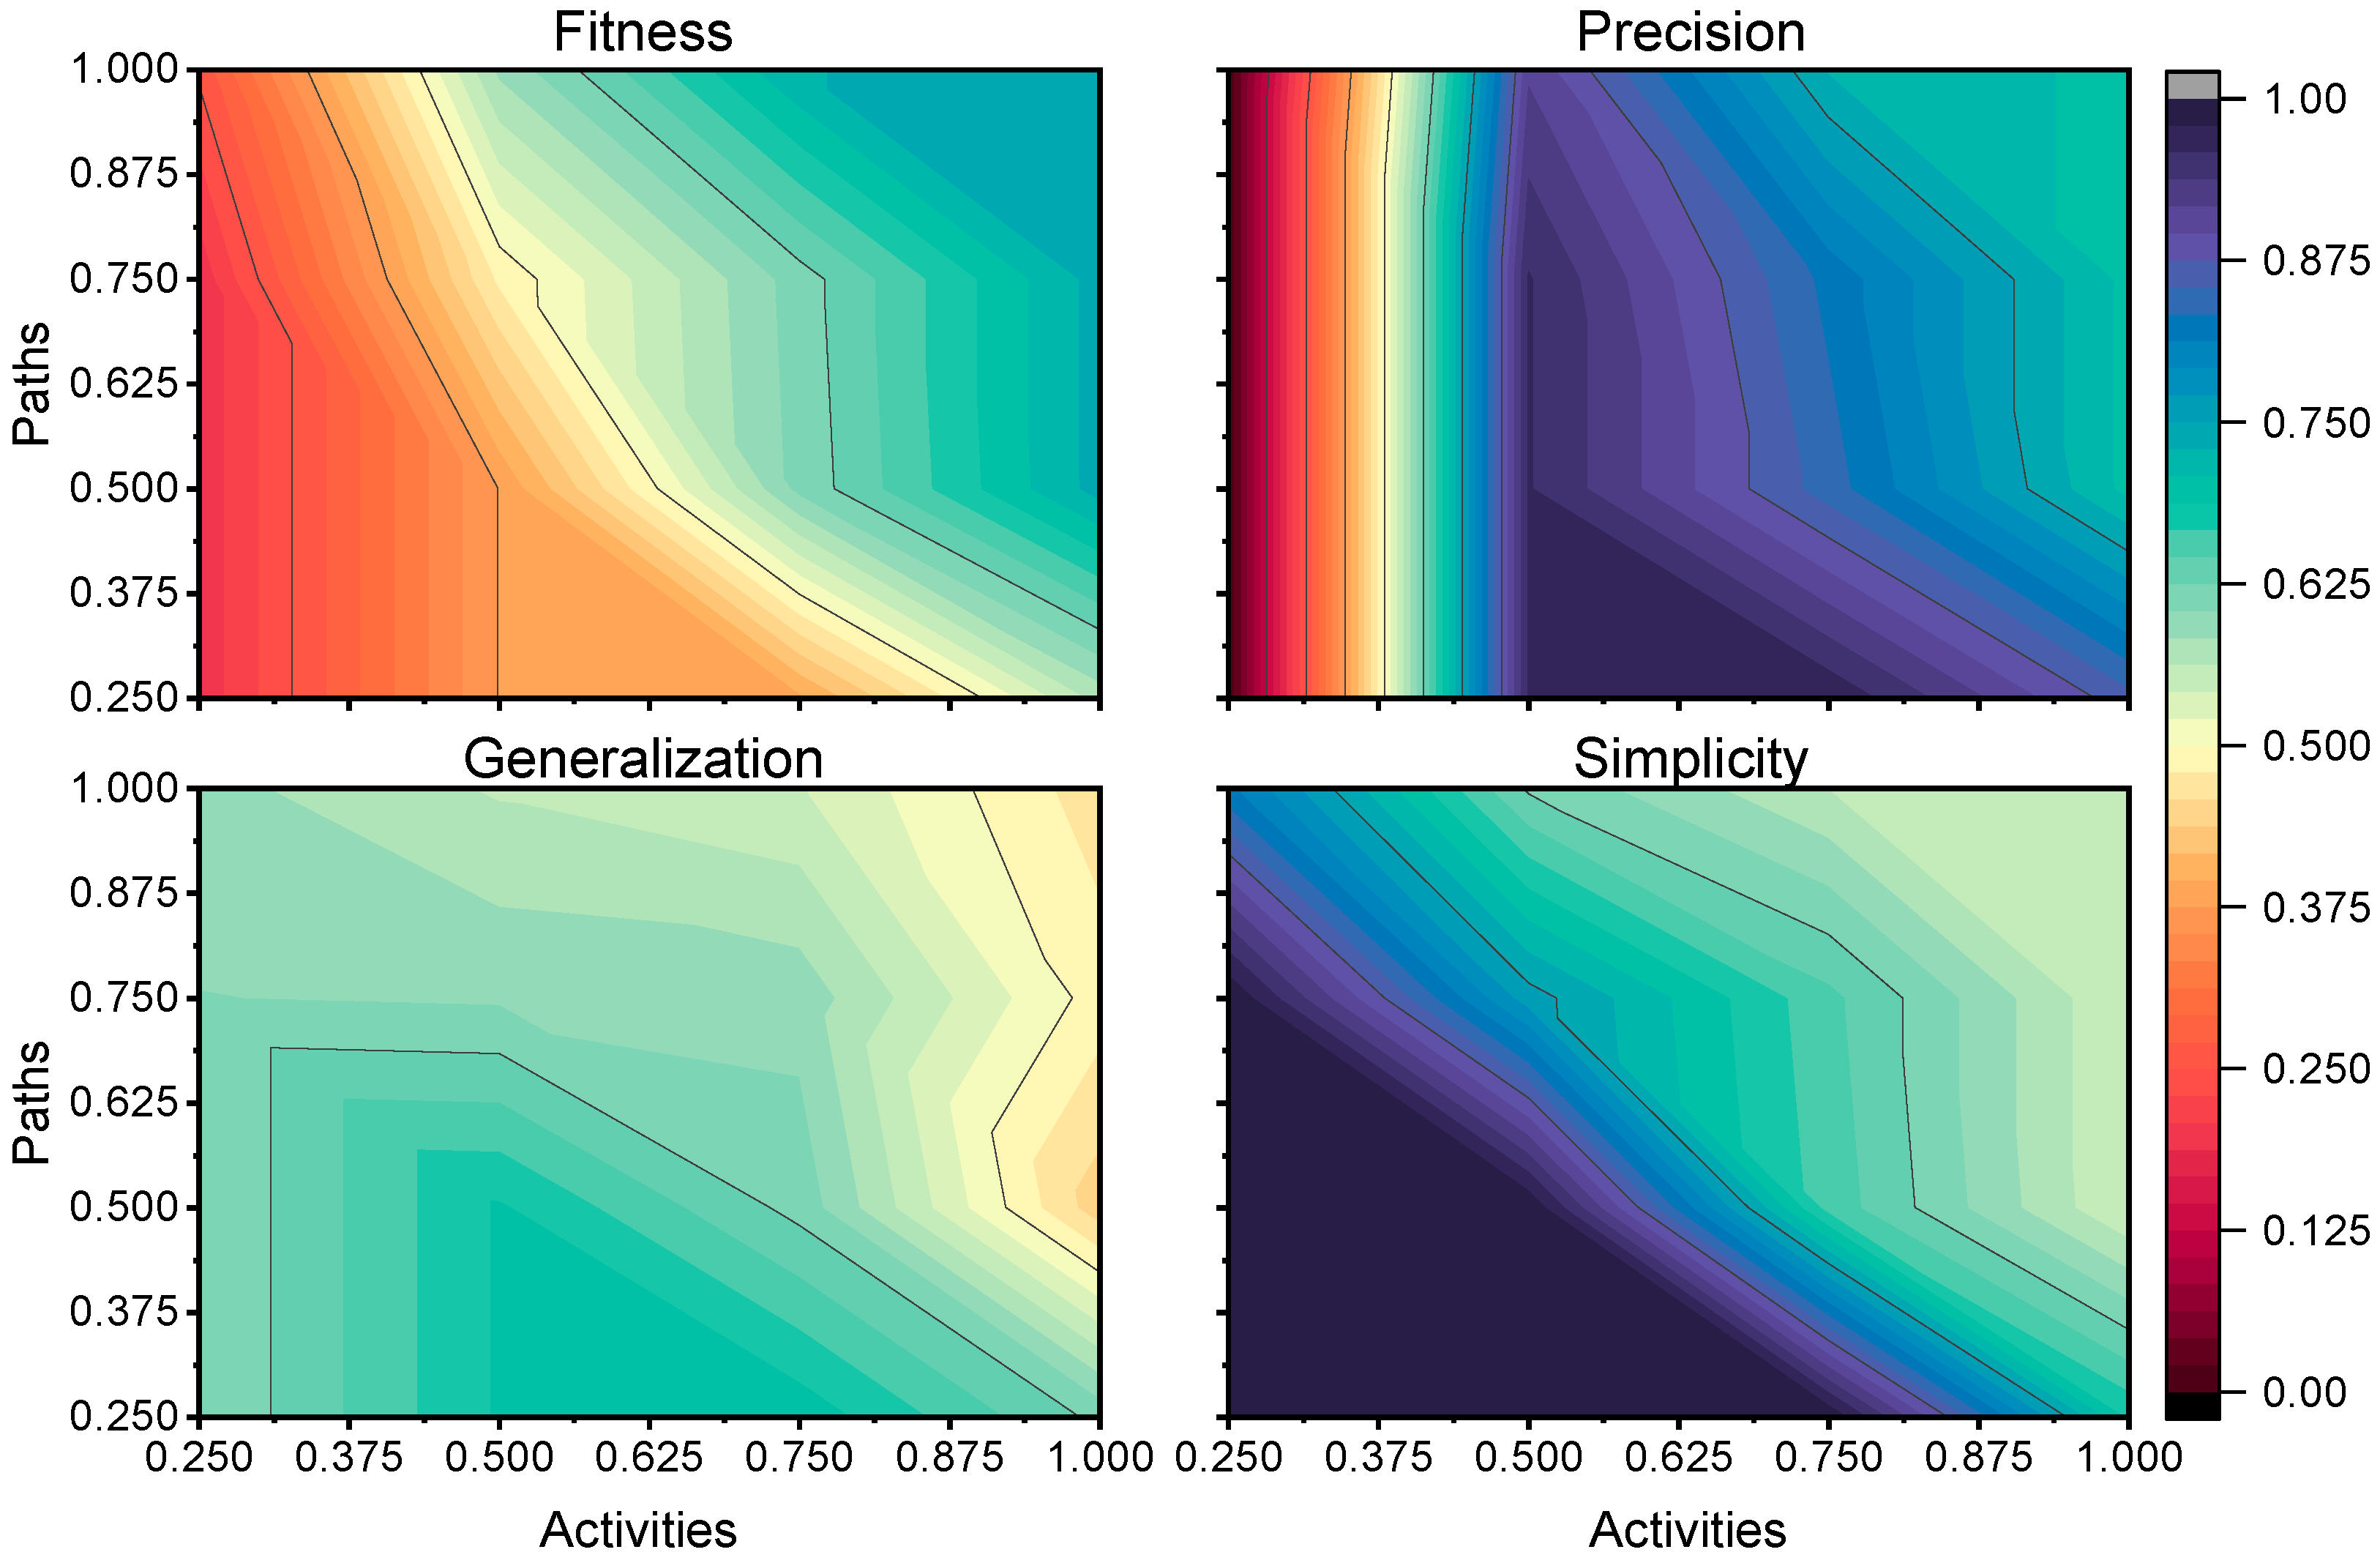
  • Compared with inductive mining models, the DFM more intuitively shows the relationships between construction activities and offers better interpretability. In this study, the fitness, precision, generalization, and simplicity of the DFG are: 0.74, 0.702233, 0.47, and 0.54, respectively.
  • Sudden changes at various construction nodes during construction activities can affect the resource allocation planning in the subsequent multi-phase stages. Efforts should be made to reduce the number of critical nodes in key positions and lower the node degree, thereby enhancing the overall resilience of the construction process.
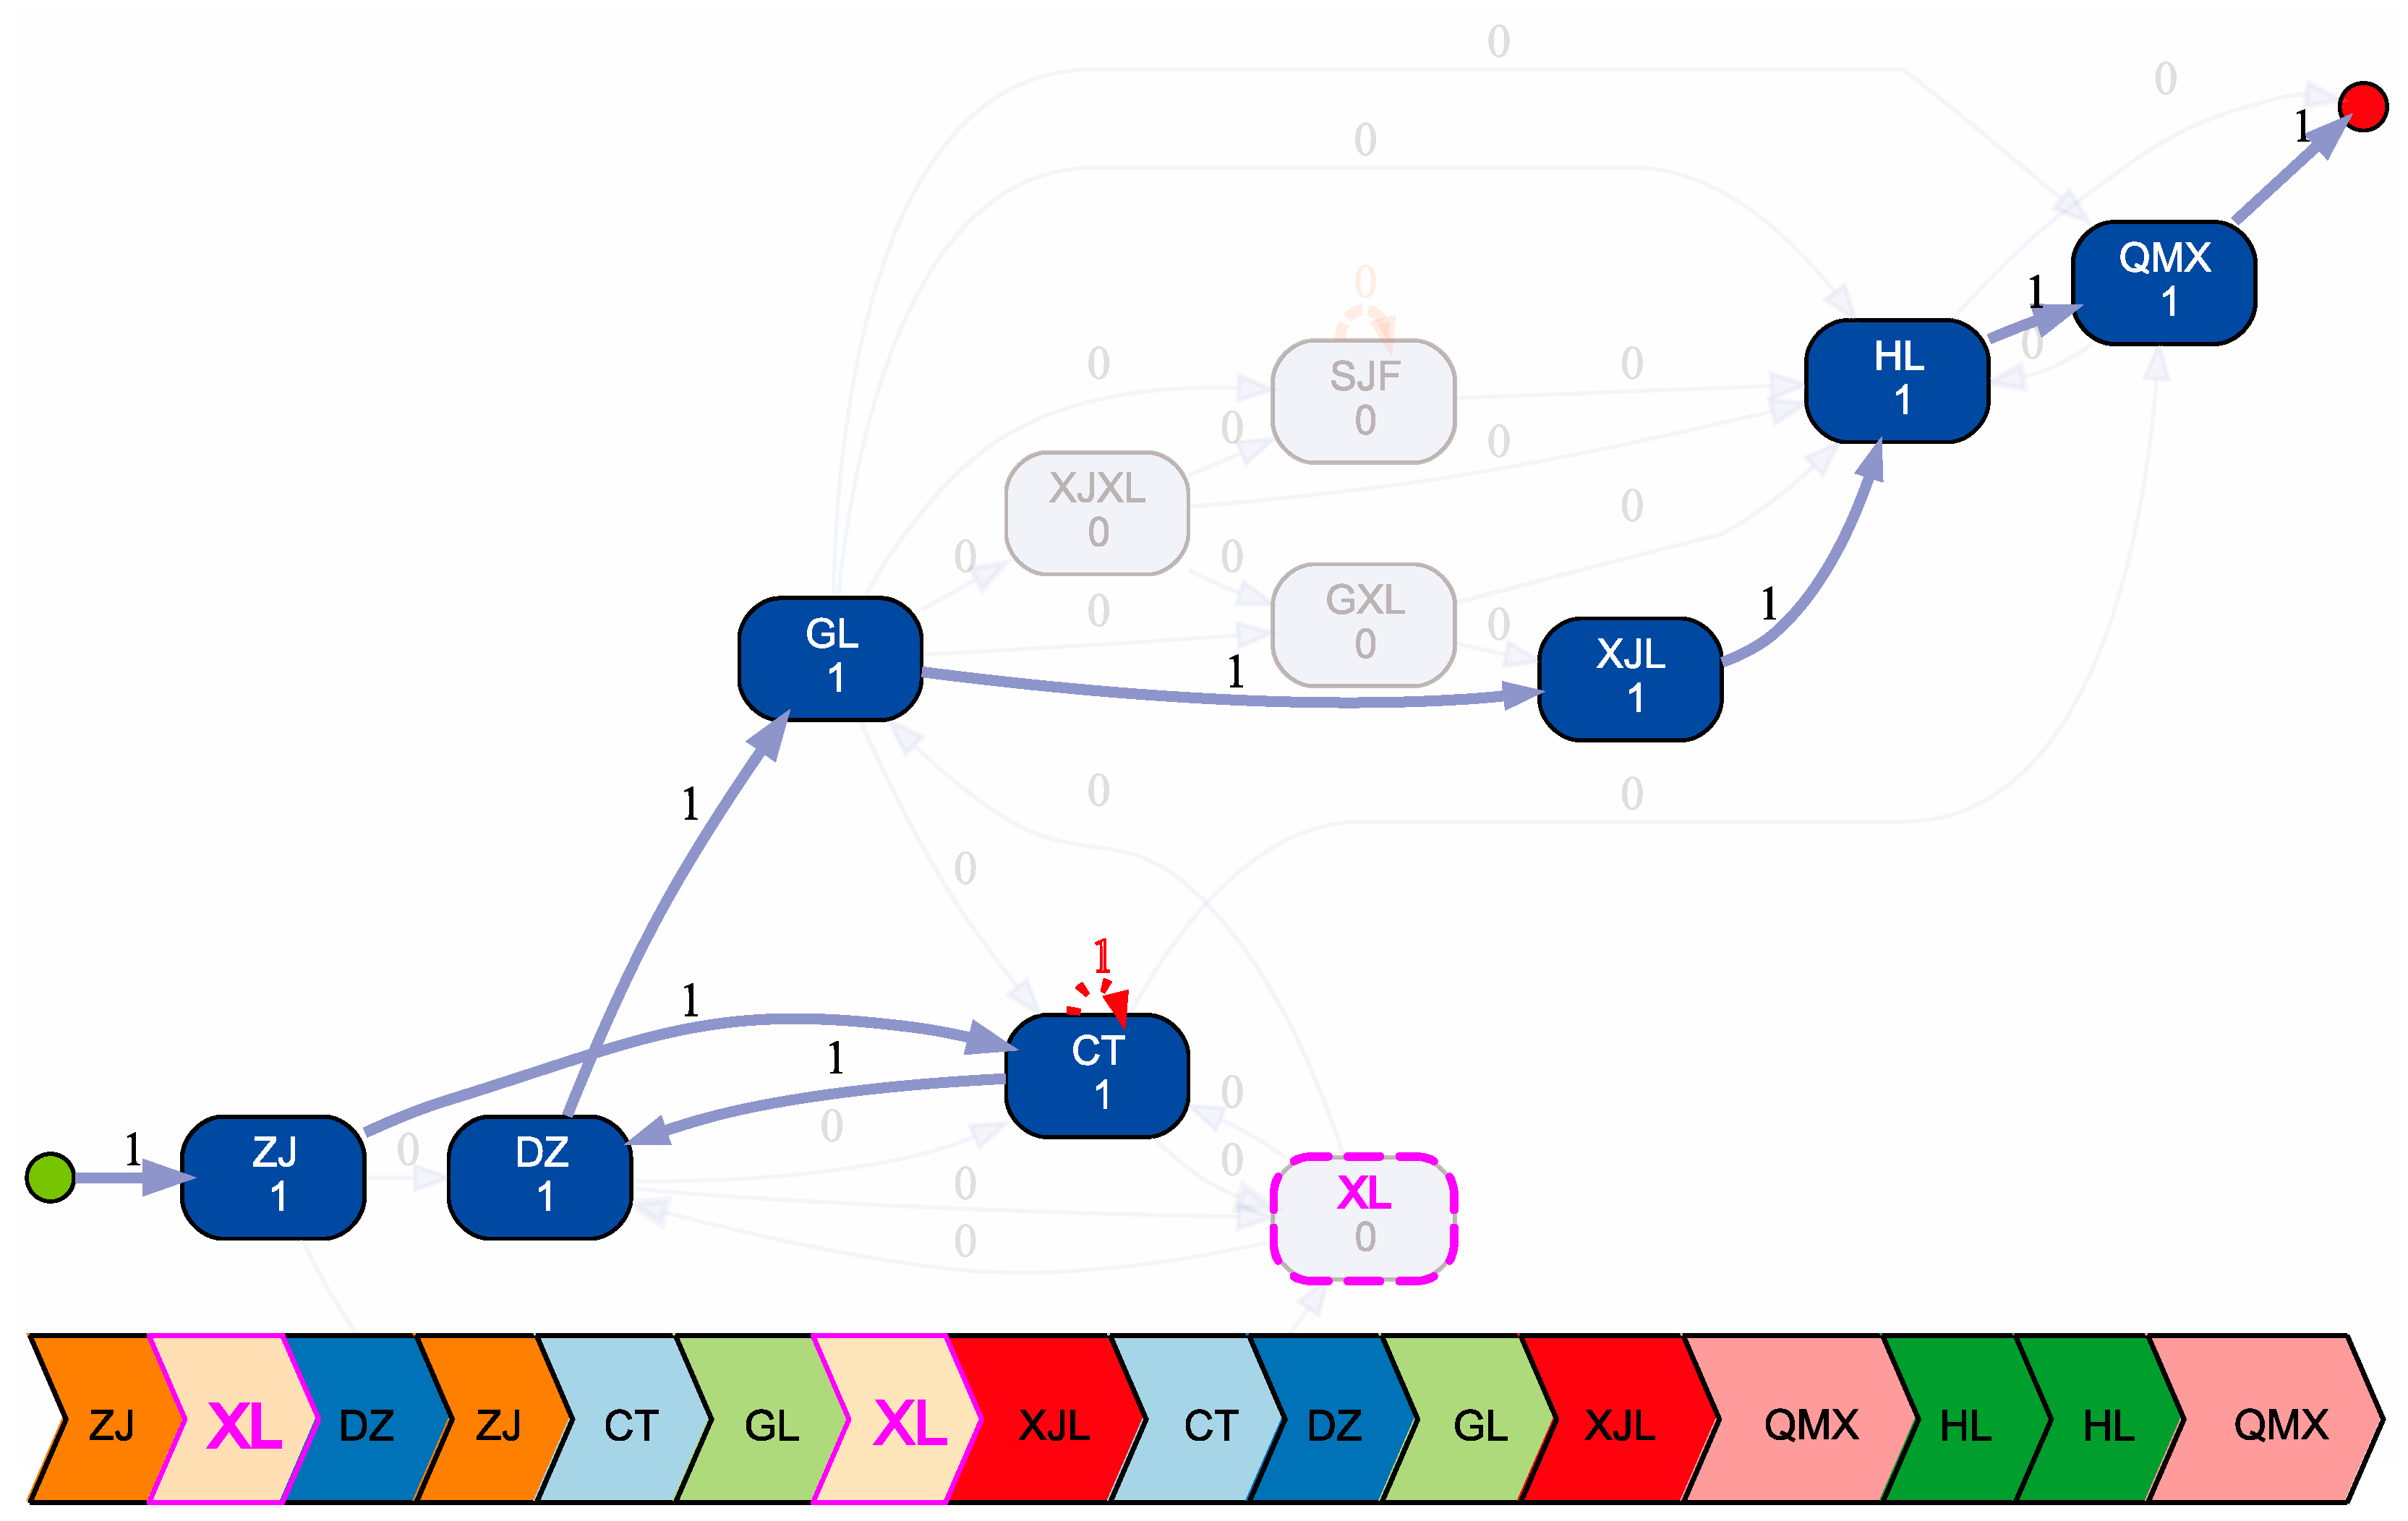
  • The twin model based on process mining can be used to macroscopically visualize the lead-lag relationship between the actual construction process and the construction plan (i.e., the construction progress risks).
The future advantages of the process twin realized by the process model are as follows: the precise mathematical semantics of the process model can provide standardized data for AI training; the serialized structure of the process variants lays the foundation for the intelligent generation of construction progress plans; and for CM, the network structure of the process model allows for a quantitative evaluation of the construction process resilience.

Author Contributions

Y.W.: Conceptualization, methodology, formal analysis, writing-original draft. S.L.: Methodology, writing-reviewing and editing, supervision, funding acquisition. Z.G.: Resources, supervision, funding acquisition. F.D.: Resources, data curation, writing-reviewing and editing. S.Y.: Resources, data curation. All authors have read and agreed to the published version of the manuscript.

Funding

This research was funded by the China Construction Infrastructure Technology R&D Project, grant numbers CSCIC-2021-KT-04 and CSCIC-2023-KT-01.

Institutional Review Board Statement

Not applicable.

Informed Consent Statement

Informed consent was obtained from all subjects involved in this study.

Data Availability Statement

The raw data supporting the conclusions of this article will be made available by the authors on request.

Conflicts of Interest

The funding sponsors had no role in the design of the study; in the collection, analyses, or interpretation of data; in the writing of the manuscript, and in the decision to publish the results.

References

  1. Peterson, F.; Hartmann, T.; Fruchter, R.; Fischer, M. Teaching Construction Project Management with BIM Support: Experience and Lessons Learned. Autom. Constr. 2011, 20, 115–125. [Google Scholar] [CrossRef]
  2. Rauf, M.; Guan, Z.; Mumtaz, J.; Yue, L.; Wang, H. Digital Twin-Based Smart Manufacturing System for Project-Based Organizations: A Conceptual Framework. In Proceedings of the CIE49 Proceedings, Beijing, China, 21 October 2019; p. 281. [Google Scholar]
  3. Williams, C.E., Jr.; Johnson, P.W. Johnson Inadequate Design Management Compared with Unprecedented Technical Issues as Causes for Engineering Failure. J. Perform. Constr. Facil. 2015, 29, 04014031. [Google Scholar] [CrossRef]
  4. Woodward, J. Civil Engineering Management. Int. J. Proj. Manag. 1985, 3, 105–108. [Google Scholar] [CrossRef]
  5. Jin, R.; Zuo, J.; Hong, J. Scientometric Review of Articles Published in ASCE’s Journal of Construction Engineering and Management from 2000 to 2018. J. Constr. Eng. Manag. 2019, 145, 06019001. [Google Scholar] [CrossRef]
  6. Rauf, M.; Guan, Z.; Yue, L.; Guo, Z.; Mumtaz, J.; Ullah, S. Integrated Planning and Scheduling of Multiple Manufacturing Projects Under Resource Constraints Using Raccoon Family Optimization Algorithm. IEEE Access 2020, 8, 151279–151295. [Google Scholar] [CrossRef]
  7. Ding, L.; Guan, Z.; Rauf, M.; Yue, L. Multi-Policy Deep Reinforcement Learning for Multi-Objective Multiplicity Flexible Job Shop Scheduling. Swarm Evol. Comput. 2024, 87, 101550. [Google Scholar] [CrossRef]
  8. Chen, Y.; Zhang, J.; Rauf, M.; Mumtaz, J.; Huang, S. Dynamic Scheduling of Hybrid Flow Shop Problem with Uncertain Process Time and Flexible Maintenance Using NeuroEvolution of Augmenting Topologies. IET Collab. Intell. Manuf. 2024, 6, e12119. [Google Scholar] [CrossRef]
  9. Zhang, J.; Cheng, J.C.P.; Chen, W.; Chen, K. Digital Twins for Construction Sites: Concepts, LoD Definition, and Applications. J. Manag. Eng. 2022, 38, 04021094. [Google Scholar] [CrossRef]
  10. Tan, Y.; Chen, P.; Shou, W.; Sadick, A.-M. Digital Twin-Driven Approach to Improving Energy Efficiency of Indoor Lighting Based on Computer Vision and Dynamic BIM. Energy Build. 2022, 270, 112271. [Google Scholar] [CrossRef]
  11. Chacón, R.; Posada, H.; Ramonell, C.; Jungmann, M.; Hartmann, T.; Khan, R.; Tomar, R. Digital Twinning of Building Construction Processes. Case Study: A Reinforced Concrete Cast-in Structure. J. Build. Eng. 2024, 84, 108522. [Google Scholar] [CrossRef]
  12. Speiser, K.; Teizer, J. Automatic Creation of Personalised Virtual Construction Safety Training in Digital Twins. Proc. Inst. Civ. Eng. Manag. Procure. Law 2024, 177, 173–183. [Google Scholar] [CrossRef]
  13. Xu, J.; Shu, X.; Qiao, P.; Li, S.; Xu, J. Developing a Digital Twin Model for Monitoring Building Structural Health by Combining a Building Information Model and a Real-Scene 3D Model. Measurement 2023, 217, 112955. [Google Scholar] [CrossRef]
  14. Grieves, M. Virtually Perfect: Driving Innovative and Lean Products Through Product Lifecycle Management; Space Coast Press: Melbourne, FL, USA, 2011; ISBN 978-0-9821380-0-7. [Google Scholar]
  15. Rosen, R.; von Wichert, G.; Lo, G.; Bettenhausen, K.D. Bettenhausen About The Importance of Autonomy and Digital Twins for the Future of Manufacturing. IFAC-Pap. 2015, 48, 567–572. [Google Scholar] [CrossRef]
  16. Grieves, M. Digital Twin: Manufacturing Excellence through Virtual Factory Replication 2015. Available online: https://www.3ds.com/fileadmin/PRODUCTS-SERVICES/DELMIA/PDF/Whitepaper/DELMIA-APRISO-Digital-Twin-Whitepaper.pdf (accessed on 1 June 2024).
  17. Tao, F.; Qi, Q. Make More Digital Twins. Nature 2019, 573, 490–491. [Google Scholar] [CrossRef]
  18. Tao, F.; Zhang, H.; Zhang, C. Advancements and Challenges of Digital Twins in Industry. Nat. Comput. Sci. 2024, 4, 169–177. [Google Scholar] [CrossRef]
  19. Sepasgozar, S.M.E. Differentiating Digital Twin from Digital Shadow: Elucidating a Paradigm Shift to Expedite a Smart, Sustainable Built Environment. Buildings 2021, 11, 151. [Google Scholar] [CrossRef]
  20. Wang, W.; Xu, K.; Song, S.; Bao, Y.; Xiang, C. From BIM to Digital Twin in BIPV: A Review of Current Knowledge. Sustain. Energy Technol. Assess. 2024, 67, 103855. [Google Scholar] [CrossRef]
  21. Li, T.; Li, X.; Rui, Y.; Ling, J.; Zhao, S.; Zhu, H. Digital Twin for Intelligent Tunnel Construction. Autom. Constr. 2024, 158, 105210. [Google Scholar] [CrossRef]
  22. Jiang, F.; Ma, L.; Broyd, T.; Chen, K. Digital Twin and Its Implementations in the Civil Engineering Sector. Autom. Constr. 2021, 130, 103838. [Google Scholar] [CrossRef]
  23. Pregnolato, M.; Gunner, S.; Voyagaki, E.; De Risi, R.; Carhart, N.; Gavriel, G.; Tully, P.; Tryfonas, T.; Macdonald, J.; Taylor, C. Towards Civil Engineering 4.0: Concept, Workflow and Application of Digital Twins for Existing Infrastructure. Autom. Constr. 2022, 141, 104421. [Google Scholar] [CrossRef]
  24. Opoku, D.-G.J.; Perera, S.; Osei-Kyei, R.; Rashidi, M. Digital Twin Application in the Construction Industry: A Literature Review. J. Build. Eng. 2021, 40, 102726. [Google Scholar] [CrossRef]
  25. Song, H.; Yang, G.; Li, H.; Zhang, T.; Jiang, A. Digital Twin Enhanced BIM to Shape Full Life Cycle Digital Transformation for Bridge Engineering. Autom. Constr. 2023, 147, 104736. [Google Scholar] [CrossRef]
  26. Zhou, X.; Sun, K.; Wang, J.; Zhao, J.; Feng, C.; Yang, Y.; Zhou, W. Computer Vision Enabled Building Digital Twin Using Building Information Model. IEEE Trans. Ind. Inf. 2023, 19, 2684–2692. [Google Scholar] [CrossRef]
  27. Arsiwala, A.; Elghaish, F.; Zoher, M. Digital Twin with Machine Learning for Predictive Monitoring of CO2 Equivalent from Existing Buildings. Energy Build. 2023, 284, 112851. [Google Scholar] [CrossRef]
  28. Pan, Y.; Zhang, L. A BIM-Data Mining Integrated Digital Twin Framework for Advanced Project Management. Autom. Constr. 2021, 124, 103564. [Google Scholar] [CrossRef]
  29. Lu, Q.; Xie, X.; Parlikad, A.K.; Schooling, J.M. Digital Twin-Enabled Anomaly Detection for Built Asset Monitoring in Operation and Maintenance. Autom. Constr. 2020, 118, 103277. [Google Scholar] [CrossRef]
  30. Wang, L.; Liu, H.; Zhang, F.; Guo, L.; Chen, Z. Spatial Structure Digital Twins: Application in Intelligent Health Monitoring of Cable Dome Structures. Autom. Constr. 2024, 165, 105489. [Google Scholar] [CrossRef]
  31. Yang, Y.; Li, M.; Yu, C.; Zhong, R.Y. Digital Twin-Enabled Visibility and Traceability for Building Materials in on-Site Fit-out Construction. Autom. Constr. 2024, 166, 105640. [Google Scholar] [CrossRef]
  32. Adeagbo, M.O.; Wang, S.-M.; Ni, Y.-Q. Revamping structural health monitoring of advanced rail transit systems: A paradigmatic shift from digital shadows to digital twins. Adv. Eng. Inf. 2024, 61, 102450. [Google Scholar] [CrossRef]
  33. Kang, T.W.; Mo, Y. A Comprehensive Digital Twin Framework for Building Environment Monitoring with Emphasis on Real-Time Data Connectivity and Predictability. Dev. Built Environ. 2024, 17, 100309. [Google Scholar] [CrossRef]
  34. Liu, Z.; Zhu, Z.; Sun, Z.; Li, A.; Ni, S. A Digital Twin-Based Green Construction Management Method for Prefabricated Buildings. Digit. Twin 2023, 3, 8. [Google Scholar] [CrossRef]
  35. Li, X.; Tang, L.; Ling, J.; Chen, C.; Shen, Y.; Zhu, H. Digital-Twin-Enabled JIT Design of Rock Tunnel: Methodology and Application. Tunn. Undergr. Space Technol. 2023, 140, 105307. [Google Scholar] [CrossRef]
  36. Ye, Z.; Ye, Y.; Zhang, C.; Zhang, Z.; Li, W.; Wang, X.; Wang, L.; Wang, L. A Digital Twin Approach for Tunnel Construction Safety Early Warning and Management. Comput. Ind. 2023, 144, 103783. [Google Scholar] [CrossRef]
  37. Jiang, Y.; Li, M.; Li, M.; Liu, X.; Zhong, R.Y.; Pan, W.; Huang, G.Q. Digital Twin-Enabled Real-Time Synchronization for Planning, Scheduling, and Execution in Precast on-Site Assembly. Autom. Constr. 2022, 141, 104397. [Google Scholar] [CrossRef]
  38. Rogage, K.; Mahamedi, E.; Brilakis, I.; Kassem, M. Beyond Digital Shadows: A Digital Twin for Monitoring Earthwork Operation in Large Infrastructure Projects. AI Civ. Eng. 2022, 1, 7. [Google Scholar] [CrossRef] [PubMed]
  39. Wu, H.; Zhu, Q.; Guo, Y.; Zheng, W.; Zhang, L.; Wang, Q.; Zhou, R.; Ding, Y.; Wang, W.; Pirasteh, S.; et al. Multi-Level Voxel Representations for Digital Twin Models of Tunnel Geological Environment. Int. J. Appl. Earth Obs. Geoinf. 2022, 112, 102887. [Google Scholar] [CrossRef]
  40. Lee, D.; Lee, S.H.; Masoud, N.; Krishnan, M.S.; Li, V.C. Integrated Digital Twin and Blockchain Framework to Support Accountable Information Sharing in Construction Projects. Autom. Constr. 2021, 127, 103688. [Google Scholar] [CrossRef]
  41. Yu, G.; Wang, Y.; Mao, Z.; Hu, M.; Sugumaran, V.; Wang, Y.K. A Digital Twin-Based Decision Analysis Framework for Operation and Maintenance of Tunnels. Tunn. Undergr. Space Technol. 2021, 116, 104125. [Google Scholar] [CrossRef]
  42. Boje, C.; Guerriero, A.; Kubicki, S.; Rezgui, Y. Towards a Semantic Construction Digital Twin: Directions for Future Research. Autom. Constr. 2020, 114, 103179. [Google Scholar] [CrossRef]
  43. Hoeber, H.; Alsem, D. Life-Cycle Information Management Using Open-Standard BIM. Eng. Constr. Archit. Manag. 2016, 23, 696–708. [Google Scholar] [CrossRef]
  44. Motamedi, A.; Hammad, A.; Asen, Y. Knowledge-Assisted BIM-Based Visual Analytics for Failure Root Cause Detection in Facilities Management. Autom. Constr. 2014, 43, 73–83. [Google Scholar] [CrossRef]
  45. Pan, Y.; Zhang, L. Automated Process Discovery from Event Logs in BIM Construction Projects. Autom. Constr. 2021, 127, 103713. [Google Scholar] [CrossRef]
  46. van der Aalst, W.M.P. Process Mining: Discovery, Conformance and Enhancement of Business Processes; Springer: Berlin, Heidelberg, 2011; ISBN 978-3-642-19344-6. [Google Scholar]
  47. Zeng, Q. A Survey of Research Issues and Approaches on Process Mining. J. Syst. Simul. 2007, 19, 275–280. [Google Scholar]
  48. Kouhestani, S.; Nik-Bakht, M. IFC-Based Process Mining for Design Authoring. Autom. Constr. 2020, 112, 103069. [Google Scholar] [CrossRef]
  49. Leemans, S.J.J.; Poppe, E.; Wynn, M.T. Directly Follows-Based Process Mining: Exploration & a Case Study. In Proceedings of the 2019 International Conference on Process Mining (ICPM), Aachen, Germany, 24–26 June 2019; pp. 25–32. [Google Scholar]
  50. van der Aalst, W.M.P.; De Masellis, R.; Di Francescomarino, C.; Ghidini, C. Learning Hybrid Process Models from Events. In Proceedings of the Business Process Management, Barcelona, Spain, 10–15 September 2017; Carmona, J., Engels, G., Kumar, A., Eds.; Springer International Publishing: Cham, Switzerland, 2017; pp. 59–76. [Google Scholar]
  51. van Schaijk, S. Building Information Model (BIM) Based Process Mining: Enabling Knowledge Reassurance and Fact-Based Problem Discovery Within the Architecture, Engineering, Construction and Facility Management Industry. Master’s Thesis, Eindhoven University of Technology, Eindhoven, The Netherlands, 2016. [Google Scholar]
  52. Yarmohammadi, S.; Pourabolghasem, R.; Castro-Lacouture, D. Mining Implicit 3D Modeling Patterns from Unstructured Temporal BIM Log Text Data. Autom. Constr. 2017, 81, 17–24. [Google Scholar] [CrossRef]
  53. Kouhestani, S. Integration of Building Information Modeling (BIM) and Process Mining for Design Authoring Processes. Master’s Thesis, Concordia University, Montreal, QC, Canada, 2019. [Google Scholar]
  54. Forcael, E.; Martínez-Rocamora, A.; Sepúlveda-Morales, J.; García-Alvarado, R.; Nope-Bernal, A.; Leighton, F. Behavior and Performance of BIM Users in a Collaborative Work Environment. Appl. Sci. 2020, 10, 2199. [Google Scholar] [CrossRef]
  55. Jang, S.; Lee, G. Improving BIM Authoring Process Reproducibility with Enhanced BIM Logging 2023. arXiv 2023, arXiv:2305.18032. [Google Scholar]
  56. Gao, W.; Wu, C.; Huang, W.; Lin, B.; Su, X. A Data Structure for Studying 3D Modeling Design Behavior Based on Event Logs. Autom. Constr. 2021, 132, 103967. [Google Scholar] [CrossRef]
  57. Gao, W.; Zhang, X.; Huang, W.; Shi, S. Command2Vec: Feature Learning of 3D Modeling Behavior Sequence—A Case Study on “Spiral-Stair”. In Proceedings of the 2021 DigitalFUTURES; Yuan, P.F., Chai, H., Yan, C., Leach, N., Eds.; Springer: Berlin/Heidelberg, Germany, 2022; pp. 45–54. [Google Scholar]
  58. Zhang, L.; Wen, M.; Ashuri, B. BIM Log Mining: Measuring Design Productivity. J. Comput. Civ. Eng. 2018, 32, 4017071. [Google Scholar] [CrossRef]
  59. Kouhestani, S.; Nik-Bakht, M. Towards Level 3 BIM Process Maps with IFC & XES Process Mining. In eWork and eBusiness in Architecture, Engineering and Construction; Karlshoj, J., Scherer, R., Eds.; CRC Press: London, UK, 2018; pp. 103–112. ISBN 978-0-429-50621-5. [Google Scholar]
  60. Gao, W.; Zhang, X.; He, Q.; Lin, B.; Huang, W. Command Prediction Based on Early 3D Modeling Design Logs by Deep Neural Networks. Autom. Constr. 2022, 133, 104026. [Google Scholar] [CrossRef]
  61. Jang, S.; Lee, G.; Shin, S.; Roh, H. Lexicon-Based Content Analysis of BIM Logs for Diverse BIM Log Mining Use Cases. Adv. Eng. Inf. 2023, 57, 102079. [Google Scholar] [CrossRef]
  62. Gong, Z.; Wang, Y.; Liao, S. Digitalization of construction engineering project management based on the digital twin. China Civ. Eng. J. 2024, 57, 106–128. [Google Scholar] [CrossRef]
  63. Wang, Y.; Liao, S.; Gong, Z.; Deng, F. Digital Twin Practice for Long Linear Engineering Management: A Case Study of Nantong Ring Expressway. In Proceedings of the 18th Conference of the Associated Research Centers for the Urban Underground Space; Wu, W., Leung, C.F., Zhou, Y., Li, X., Eds.; Springer Nature: Berlin/Heidelberg, Germany, 2024; pp. 267–272. [Google Scholar]
  64. Kang, J.; Deng, F.; Li, X.; Wan, F. Automatic Texture Reconstruction of 3d City Model from Oblique Images. In ISPRS—International Archives of the Photogrammetry, Remote Sensing and Spatial Information Sciences; Copernicus GmbH: Göttingen, Germany, 2016; Volume XLI-B1, pp. 341–347. [Google Scholar]
  65. Yang, J.; Liu, L.; Lu, L.; Deng, F. Image Registration and Selection for Unmanned Aerial Vehicle Image Stitching. J. Appl. Remote Sens. 2020, 14, 46512. [Google Scholar] [CrossRef]
  66. Xv, J.; Deng, F. 3D Point Cloud Instance Segmentation Considering Global Shape Contour Constraints. Remote Sens. 2023, 15, 4939. [Google Scholar] [CrossRef]
  67. Xiao, T.; Yan, Q.; Ma, W.; Deng, F. Progressive Structure from Motion by Iteratively Prioritizing and Refining Match Pairs. Remote Sens. 2021, 13, 2340. [Google Scholar] [CrossRef]
  68. Deng, F.; Kang, J.; Li, P.; Wan, F. Automatic True Orthophoto Generation Based on Three-Dimensional Building Model Using Multiview Urban Aerial Images. J. Appl. Remote Sens. 2015, 9, 95087. [Google Scholar] [CrossRef]
  69. Verbeek, H.M.W.; Buijs, J.C.; Van Dongen, B.F.; Van Der Aalst, W.M. XES, XESame, and ProM 6. In Proceedings of the Information Systems Evolution: CAiSE Forum 2010, Hammamet, Tunisia, 7–9 June 2010; Soffer, P., Proper, E., Eds.; Springer: Berlin, Heidelberg, 2011; pp. 60–75. [Google Scholar]
  70. van Dongen, B.F.; de Medeiros, A.K.A.; Verbeek, H.M.W.; Weijters, A.J.M.M.; van der Aalst, W.M.P. The ProM Framework: A New Era in Process Mining Tool Support. In Proceedings of the Applications and Theory of Petri Nets 2005, Miami, FL, USA, 20–25 June 2005; Ciardo, G., Darondeau, P., Eds.; Springer: Berlin, Heidelberg, 2005; pp. 444–454. [Google Scholar]
  71. Leemans, S.; Poppe, E.; Wynn, M. Directly Follows-Based Process Mining: A Tool. In Proceedings of the ICPM Demo Track 2019 (CEUR Workshop Proceedings, Volume 2374); Burattin, A., van Zelst, S., Polyvyanyy, A., Eds.; Sun SITE Central Europe: Franfurt Am Main, Germany, 2019; Volume 2374, pp. 9–12. Available online: http://www.ceur-ws.org/ (accessed on 1 June 2024).
  72. Chapela-Campa, D.; Dumas, M.; Mucientes, M.; Lama, M. Efficient edge filtering of directly-follows graphs for process mining. Inf. Sci. 2022, 610, 830–846. [Google Scholar] [CrossRef]
  73. Fahland, D.; van der Aalst, W.M.P. Model Repair—Aligning Process Models to Reality. Inf. Syst. 2015, 47, 220–243. [Google Scholar] [CrossRef]
  74. van der Aalst, W.; Adriansyah, A.; van Dongen, B. Replaying History on Process Models for Conformance Checking and Performance Analysis. WIREs Data Min. Knowl. Discov. 2012, 2, 182–192. [Google Scholar] [CrossRef]
  75. Leemans, S.J.J.; Fahland, D.; van der Aalst, W.M.P. Scalable Process Discovery and Conformance Checking. Softw. Syst. Model. 2018, 17, 599–631. [Google Scholar] [CrossRef]
  76. Muñoz-Gama, J.; Carmona, J. A Fresh Look at Precision in Process Conformance. In Proceedings of the Business Process Management; Hull, R., Mendling, J., Tai, S., Eds.; Springer: Berlin, Heidelberg, 2010; pp. 211–226. [Google Scholar]
  77. Blum, F. Metrics in Process Discovery. University of Chile, Santiago, Chile, Report. 2015. pp. 1–21. Available online: https://api.semanticscholar.org/CorpusID:15882411 (accessed on 1 June 2024).
  78. Pm4py—Process Mining for Python. Available online: https://processintelligence.solutions/ (accessed on 24 June 2024).
  79. Vázquez-Barreiros, B.; Mucientes, M.; Lama, M. ProDiGen: Mining Complete, Precise and Minimal Structure Process Models with a Genetic Algorithm. Inf. Sci. 2015, 294, 315–333. [Google Scholar] [CrossRef]
  80. Berti, A.; van Zelst, S.; Schuster, D. PM4Py: A Process Mining Library for Python. Softw. Impacts 2023, 17, 100556. [Google Scholar] [CrossRef]
  81. Bolt, A.; de Leoni, M.; van der Aalst, W.M.P. Process Variant Comparison: Using Event Logs to Detect Differences in Behavior and Business Rules. Inf. Syst. 2018, 74, 53–66. [Google Scholar] [CrossRef]
  82. Kermani, M.A.M.A.; Seddighi, H.R.; Maghsoudi, M. Revolutionizing Process Mining: A Novel Architecture for ChatGPT Integration and Enhanced User Experience through Optimized Prompt Engineering 2024. arXiv 2024, arXiv:2405.10689. [Google Scholar]
  83. Colonna, J.G.; Fares, A.A.; Duarte, M.; Sousa, R. Process Mining Embeddings: Learning Vector Representations for Petri Nets. arXiv 2024, arXiv:2404.17129. [Google Scholar] [CrossRef]
  84. Gao, J.; Barzel, B.; Barabási, A.-L. Universal Resilience Patterns in Complex Networks. Nature 2016, 530, 307–312. [Google Scholar] [CrossRef]
Figure 1. Process models: (a) transition system; (b) Petri net.
Sustainability 16 10064 g001
Figure 2. Research workflow.
Sustainability 16 10064 g002
Figure 3. Xinlian Hub and event case distribution location.
Sustainability 16 10064 g003
Figure 4. DT model for CM.
Sustainability 16 10064 g004
Figure 5. Event log example and log standardization.
Sustainability 16 10064 g005
Figure 6. Construction process variants.
Sustainability 16 10064 g006
Figure 7. Highway construction process model: (a) DFG and (b) DFM represented by Petri net. Note: ZJ: pile foundations; CT: caps; XL: tie beams; DZ: piers; GL: cap beams; SJF: wet joints; HL: guardrails; QMX: bridge deck systems: XJXL: cast-in-place tie beams; XJL: cast-in-place beams; and GXL: steel box girders.
Sustainability 16 10064 g007
Figure 8. Process model: (a) Inductive Miner; (b) Induction Miner represented by Petri net; (c) BPMN; (d) BPMN represented by Petri net. Note: ZL; pile foundations; CT: caps; XL: tie beams; DZ: piers; GL: cap beams; SJF: wet joints; HL: guardrails; QMX: bridge deck systems; XJXL: cast-in-place tie beams; XJL: cast-in-place beams; GXL: steel box girders.
Sustainability 16 10064 g008
Figure 9. Petri nets with different granularities.
Sustainability 16 10064 g009aSustainability 16 10064 g009b
Figure 10. Average waiting and service times for construction activities.
Sustainability 16 10064 g010
Figure 11. Comparison of differences between actual and planned activities.
Sustainability 16 10064 g011
Figure 12. Deviations between model and log.
Sustainability 16 10064 g012
Figure 13. Cloud plot of model rating indicators for different activities and paths.
Sustainability 16 10064 g013
Table 1. Research on DTs in the engineering construction field.
YearsReferencesPhysical entityPhaseModeling technologyTwin service
2024[31]Prefabricated constructionDecoration constructionIoT, AIAbnormal event identification
2024[32]Rail transitOperation and Maintenance phaseIoT, FEM, AIStructural health monitoring
2024[30]Building (Stadium Dome)Operation and Maintenance phaseIoTStructural health monitoring
2024[33]BuildingConstruction phaseIoT, BIMConstruction monitoring and management
2024[21]TunnelConstruction phaseIoT, CV, NLPConstruction monitoring and forecasting
2023[26]BuildingConstruction phaseBIM, CVMulti-source data fusion
2023[27]BuildingOperation and Maintenance phaseIoT, BIM, AIDetection and prediction
2023[34]Prefabricated constructionConstruction phaseIoT, CVConstruction monitoring and management
2023[35]TunnelConstruction phaseIoT, CVConstruction monitoring and forecasting
2023[36]TunnelConstruction phaseIoT, CVEarly warning and management
2022[37]Prefabricated constructionConstruction phaseIoTPlanning, scheduling and execution
2022[38]HighwayConstruction phaseIoT, BIM, AIConstruction monitoring and management
2022[39]TunnelConstruction phase3D geologyGeological information reconstruction
2021[19]BuildingConstruction phaseIoT, BIM, GIS, VRDecision-making and supervision
2021[40]BuildingConstruction phaseIoT, BIM, BlockchainInformation sharing
2021[41]TunnelOperation and Maintenance phaseBIM, CVDecision analysis
2021[28]BuildingConstruction phaseIoT, BIM, CVForecasting and Management
2020[29]Building Operations AssetsOperation and Maintenance phaseIFCAbnormal event identification
Note: IoT: Internet of Things; AI: Artificial Intelligence; FEM: Finite Element Method; BIM: Building Information Modeling; CV: Computer Vision; NLP: Natural Language Processing; GIS: Geographic Information System; VR: Virtual Reality.
Table 2. Simple example of an event log.
Case-idEvent-idActivity NameStarting TimeFinishing Time
Case-2Event–22Analyze Defect1 April 2024 8:101 April 2024 8:15
Case–2Event–23Repair1 April 2024 9:001 April 2024 9:50
Case–3Event–24Test Repair1 April 2024 9:551 April 2024 10:15
Case–2Event–25Archive Repair1 April 2024 10:301 April 2024 10:56
Case–4Event–26Register1 April 2024 11:271 April 2024 11:49
Case–3Event–27Repair1 April 2024 12:511 April 2024 13:50
Table 3. Overview of construction event log.
Case-IDEvent-IDStart TimeComplete Time
ZXKSHGSDQZJ1 October 20219 August 2022
ZXKSHGSDQCT20 November 202124 September 2022
BZDKSHGSDQHL15 February 20239 April 2024
BZDKSHGSDQQMX25 February 202320 April 2024
EZDKSHGSDQZJ1 October 202130 May 2022
EZDKSHGSDQCT25 October 202120 June 2022
BBLKSHGSDQHL15 August 202310 May 2024
BBLKSHGSDQQMX10 September 202331 May 2024
XYHZQZJ1 October 20218 June 2022
XYHZQDZ31 May 202229 October 2023
BZDKSHGSDQXJXL1 October 202229 March 2024
Table 4. Fitness, precision, generalization, and simplicity of different process models.
Petri NetActivitiesPathsFitnessPrecisionGeneralizationSimplicity
Figure 9a110.7374080.7022330.4679480.542169
Figure 9a10.750.7374080.7022330.4902810.542169
Figure 9a10.50.7374080.7022330.4462660.542169
Figure 9b10.250.5703600.8621910.6194250.684211
Figure 9c0.7510.7283270.7275060.5434220.5625
Figure 9d0.750.750.6147740.8271190.5959570.652174
Figure 9e0.750.50.6105010.8442910.6178670.658537
Figure 9f0.750.250.3907200.9760.7011211
Figure 9g0.510.5882170.9130430.5599640.621622
Figure 9h0.50.750.4837450.9601770.6013140.76
Figure 9i0.50.50.3763740.9601770.6900621
Figure 9i0.50.250.3763740.9601770.6900621
Figure 9j0.2510.25496000.5904080.818182
Figure 9k0.250.750.19299500.6046961
Figure 9k0.250.50.19299500.6046961
Figure 9k0.250.250.19299500.6046961
Figure 8bInductive mining0.71480.22840.71280.7049
Figure 8cBPMN10.21350.68550.6757
Disclaimer/Publisher’s Note: The statements, opinions and data contained in all publications are solely those of the individual author(s) and contributor(s) and not of MDPI and/or the editor(s). MDPI and/or the editor(s) disclaim responsibility for any injury to people or property resulting from any ideas, methods, instructions or products referred to in the content.

