Article

Cost Performance Comparison of Road Construction Projects Considering Bidding Condition and Project Characteristics

Post-Construction Evaluation and Management Center, Department of Construction Policy Research, Korea Institute of Civil Engineering and Building Technology, Goyang-si 10223, Republic of Korea
Sustainability 2024, 16(22), 10083; https://doi.org/10.3390/su162210083
Submission received: 10 September 2024 / Revised: 5 November 2024 / Accepted: 8 November 2024 / Published: 19 November 2024

Abstract

:
Developing road infrastructure facilities is important because it directly affects national competitiveness and has significant socio-economic ripple effects throughout the country. However, road construction projects are vulnerable to various risks and prone to cost overruns because they are funded by large-scale national budgets and conducted over long time periods. Therefore, tracking the changes in construction costs from planning to completion and providing insights for similar future projects is essential for successful project planning and management. Considering the bidding conditions and project characteristics of road construction projects, this study comparatively analyzed the construction cost growth of 170 road construction projects based on the bid award rate and facility-specific project characteristics, such as construction type, contract method, facility capacity, and construction cost components. This study analyzed the differences in cost performance between various sample groups using non-parametric tests (Mann–Whitney U test and Kruskal–Wallis test), considering the non-normality of the collected sample. In addition, this study conducted multiple regression analysis to examine the causal relationship between all variables used in the analysis and cost performance and to identify critical factors. The results indicated that the construction cost growth of the group with a bid award rate of less than 70% was higher compared to that of other groups. Furthermore, the differences in construction cost growth based on project characteristics were more pronounced in the following groups: construction types (expansion/renovation and complex), contract method (long-term continuous), road length (≥7.5 km), % of bridge/tunnel length (<10%), construction cost (≤USD 100 mil.), % of direct construction cost (≥70%), and % of bridge/tunnel cost (both less and more than 50%). Furthermore, the regression model showed that % of direct construction cost, bid award rate, total road length, and contract method were shown to be critical factors in construction cost growth, which implies the importance of indirect cost management, PDS selection decisions that affect bid award rates, and risk management for complex projects from the perspective of construction cost growth management. These results empirically demonstrate that bidding conditions and project characteristics are key to understanding the pattern of construction cost growth in road construction projects. Hence, this study provides significant references that can be used by policy makers and clients to estimate cost buffers for future road projects.

1. Introduction

The development of road infrastructure is closely related to national competitiveness and has significant socio-economic ripple effects, affecting urbanization, industrialization, job creation, and real estate development [1,2]. According to the Global Infrastructure Investor Association’s (GIIA) Global Infrastructure Index, road networks rank as the fifth highest priority for global infrastructure needs, following solar energy, water supply/sewerage, flood defenses, and new housing supply [3]. However, global infrastructure satisfaction falls short of 50% (global country average: 39%), with particularly low figures in Latin America (29%), North America (32%), and Europe (38%), indicating an urgent need for improvement [4].
Road construction projects require a significant amount of national budget and are conducted over long time periods, exposing them to various internal and external risks [2]. Road projects typically follow a five-step process: planning, design, bidding, contract award, and final construction. Furthermore, cost overruns frequently occur due to uncertainty in the project life cycle [5]. Therefore, policy makers and clients involved in road projects are interested in tracking the cost changes from planning to completion.
The cost-effectiveness of construction projects is academically evaluated from the perspectives of project delivery systems (PDSs), bidding conditions, and change orders. As construction projects become larger and more complex, the performance of various PDS types (e.g., design–bid–build, design–build, and construction manager at risk) has been compared [6]. The bid award rate resulting from competition among multiple bidders in the contractor selection process significantly impacts change orders and overall cost performance [7]. Meanwhile, individual facilities, such as transportation and buildings, have specific project characteristics (e.g., facility capacity and construction cost components), which affect cost performance [2,6]. However, a lack of individual facility-level data has resulted in a shortage of academic approaches that consider both bidding conditions and project characteristics.
In this study, a cost performance analysis was conducted based on bidding conditions and project characteristics, particularly focusing on road construction projects. This study was conducted in the following four stages. First, prior studies on the cost performance analysis of road construction projects are reviewed. Second, a methodology that encompasses the research process, characteristics of sample data, performance indicators (construction cost growth and bid award rate), and analysis techniques (normality and non-parametric tests) is presented. This study analyzed the cost performance of 170 road construction projects based on bidding conditions and project characteristics, such as construction type, contract method, facility capacity, and construction cost components. In addition, this study conducted multiple regression analysis to examine the causal relationship between all variables used in the analysis and cost performance and to identify critical factors. Finally, the implications of the analysis results and potential directions for future research are discussed.

2. Background

Until recently, quantitative performance analysis of road construction projects has been limited owing to the difficulty in collecting national/industry-level sample data [2,8,9,10]. Most previous studies primarily analyzed the cost and schedule performance of mixed building and civil projects rather than focusing on individual facilities [2,6,7]. In these studies, important project attributes, such as PDS, bidding conditions, and change order, were considered, with the impact of each attribute on cost overrun or schedule delay analyzed from multiple perspectives. From the perspective of PDS, the performance of different PDS types, such as design–bid–build, design–build, construction manager at risk, and integrated project delivery, has been compared [2,6,7]. However, owing to the characteristics of the sample data used, consensus on which PDS is superior remains lacking. Furthermore, from the perspective of bidding conditions, the bid award rate resulting from competition among multiple bidders in the contractor selection process of construction clients significantly impacts change orders and overall cost performance [7].
The procurement methods for contractor selection can be broadly classified into sole source selection, qualifications-based selection, best value selection, and low-bid selection, and these methods consider technology and cost competitiveness as important factors [11,12]. Particularly in cases such as low-bid selection, projects procured at a low bidding price have shown high growth in costs owing to multiple change orders [11]. Jahren and Ashe [13] presented project size, bid award rate, construction type, and level of competition as the major factors influencing change orders. Williams [14] analyzed the impact of bid price patterns on cost overruns and argued that when bid prices were extremely low, contractors increased project costs to compensate for their losses. Gkritza and Labi [5] utilized bid comparison variables, such as the number of bidders and bid amounts, as intermediate factors, in addition to project type, contract size, and contract period, to predict the level of cost overrun in highway projects.
More recently, the scope of research has been expanded in relation to the topic of construction project performance analysis and management, and analysis techniques have also been advanced, such as risk-based causal analysis and prediction. Regarding the expansion of the research scope, Fathi and Shrestha [15] extended the scope of PDS for highways to public–private partnerships and argued that public–private partnerships are superior to traditional design–build in terms of construction intensity and cost growth. In addition, international comparisons of construction project performance have recently emerged. Ling [16] compared four major cities (Beijing, Hong Kong, Singapore, and Sydney) and found significant cost and schedule growths in common, although there were some differences between the cities, and Mejía et al. [17] compared confidence intervals of project cost overruns by geographical region (Africa, Asia, Europe, Latin America, North America, and Oceania) based on previous research results. Regarding the bid evaluation and pricing, studies have been conducted on topics incorporating environmental weights to promote the sustainability of highway projects [18], developing a stochastic programming model to determine the optimal bidding price [19], and analyzing the impact of risks inherent in pre-bid request for information on project prices [20]. Regarding the change order, studies have been conducted on topics developing a performance assessment model for change order management [21] and analyzing the impact of change order occurrence time on project performance (change order frequency and cost/schedule growths) [22]. Regarding the analysis technique, the following studies were conducted to improve risk analysis and management practices: causal relationship analysis between cost performance and influencing factors using structural equation modeling [23], a mathematical/statistical model for predicting cost/schedule performance based on project risk information [24], and classification and regression tree models for deriving quantitative thresholds that can define successful projects [25].
To summarize, previous studies on quantitative analysis of construction project performance have analyzed the impact of key attributes on project performance from various perspectives, contributing to an improved understanding of construction project performance management. However, owing to the difficulty in collecting sample data, research on facility-specific analysis and project attributes considering bidding conditions remains lacking. Therefore, this study conducted a cost performance comparison considering bidding conditions (bid award rate) and facility-specific project characteristics (construction type, contract method, facility capacity, and construction cost components), particularly focusing on road construction projects.

3. Methodology

3.1. Research Process

This section provides detailed information on the overall research process, characteristics of sample data, performance indicators, and analysis methods. First, this study utilized the performance information of road construction projects registered in the Construction Continuous Acquisitions and Life-cycle Support (Construction CALS) [26]. This study reviewed project-specific detailed design reports and supervision/completion reports and created and utilized a database of 170 road construction projects completed between 2000 and 2015. This database includes bidding conditions, project characteristics, and performance information related to construction costs (e.g., bid award rate, construction type, contract method, facility capacity, construction cost components, and planned/actual construction cost). Second, this study measured the level of construction cost growth for each road project by comparing the planned and actual performance data. Third, this study conducted a comparative analysis of construction costs based on various project characteristics and bidding conditions, with statistical techniques utilized to test the normality of each sample group and analyze the differences between groups. In addition, this study conducted multiple regression analysis to examine the causal relationship between all variables used in the analysis and cost performance and to identify critical factors. Finally, the differentiated performance results based on bidding conditions and project characteristics are interpreted, and the limitations and directions for future research are discussed. Figure 1 details the above-mentioned research process and the corresponding descriptions.

3.2. Sample Data Characteristics

Table 1 presents the distribution of 170 sample data according to construction type, contract method, facility capacity (total road length and % of bridge/tunnel length), and construction cost components (size of construction cost, % of direct construction cost, and % of structure/tunnel cost). The Construction CALS standard was adopted as the grouping criteria for project characteristics in the case of construction type and contract method [26]. Furthermore, the facility capacity and construction cost components were divided into two groups, considering the sample distribution based on both bidding conditions and project characteristics. Regarding the construction types, new construction (51.8%) had the highest percentage, followed by expansion/renovation (31.2%) and complex (15.9%). When classified by the contract method, the ongoing expenditure and long-term continuous costs accounted for 53.5% and 33.5%, respectively. In South Korea, according to the Act on Contracts to Which the State is a Party, construction projects were conducted using the ongoing expenditure contract method if the public client had secured the entire project budget; otherwise, the long-term continuous contract method was used [27].
In addition, Table 2 shows facility-specific characteristics of the sample projects. In terms of the number of lanes, four lanes (71.5%) and two lanes (22.3%) accounted for 93.8% of the total sample, and the lane width ranges for each group were as follows: two lanes (9.5–16.2 m), four lanes (18.5–23.4 m), six lanes (27.0–35.0 m), and eight lanes (34.0 m). The types of bridge superstructures were concrete bridges (e.g., precast beam, reinforced concrete Rahmen, and increment prestressed concrete girder) at 73.7%, steel bridges (e.g., steel box girder and preflex beam) at 23.9%, special bridges (e.g., arch and cable-stayed) at 1.7%, and others at 0.7%. The tunnel construction method consisted of the new Austrian tunneling method (NATM) (64.0%), the NATM and Opencut (33.0%), the tunnel boring machine (TBM) and NATM (3.0%), and the new tabular roof (NTR) (2.0%). The type of intersection consisted of at-grade (60.3%), grade-separated (37.2%), and others (2.5%).

3.3. Analysis Methods

This study aimed to comparatively analyze construction cost growth based on bidding conditions and project characteristics of road construction projects. In this context, bidding conditions for each project were measured by the bid award rate, which represents the ratio of the contractor’s winning bid price to the government estimate price (Equation (1)). Furthermore, the project characteristics were identified and differentiated through the classification system presented in Table 1. The construction cost growth, used as the dependent variable, refers to the rate of change in construction costs from the time of contract to the time of completion and is calculated by Equation (2).
B i d   a w a r d   r a t e = C o n t r a c t o r s   w i n n i n g   b i d   p r i c e G o v e r n m e n t   e s t i m a t e   p r i c e × 100 ( % )
C o n s t r u c t i o n   c o s t   g r o w t h = F i n a l   c o n s t r u c t i o n   c o s t C o n t r a c t   a w a r d   a m o u n t C o n t r a c t   a w a r d   a m o u n t × 100 ( % )
This study utilized sample normality and non-parametric testing to comparatively analyze the construction cost growth of various project groups. The sample normality was assessed with the Kolmogorov–Smirnov and Shapiro–Wilk tests. Among the 16 sample groups (including the entire sample and 15 sample groups from Table 1), only one group (construction type: complex) followed a normal distribution at a significance level of 0.05. Non-parametric tests were used to analyze the differences in construction cost growth among various sample groups. For two or three sub-sample groups, the Mann–Whitney U test and the Kruskal–Wallis test were used for each group, respectively. The Bonferroni correction method was used for post hoc comparisons. In addition, this study conducted multiple regression analysis to examine the causal relationship between all variables used in the analysis and cost performance and to identify critical factors.

4. Results

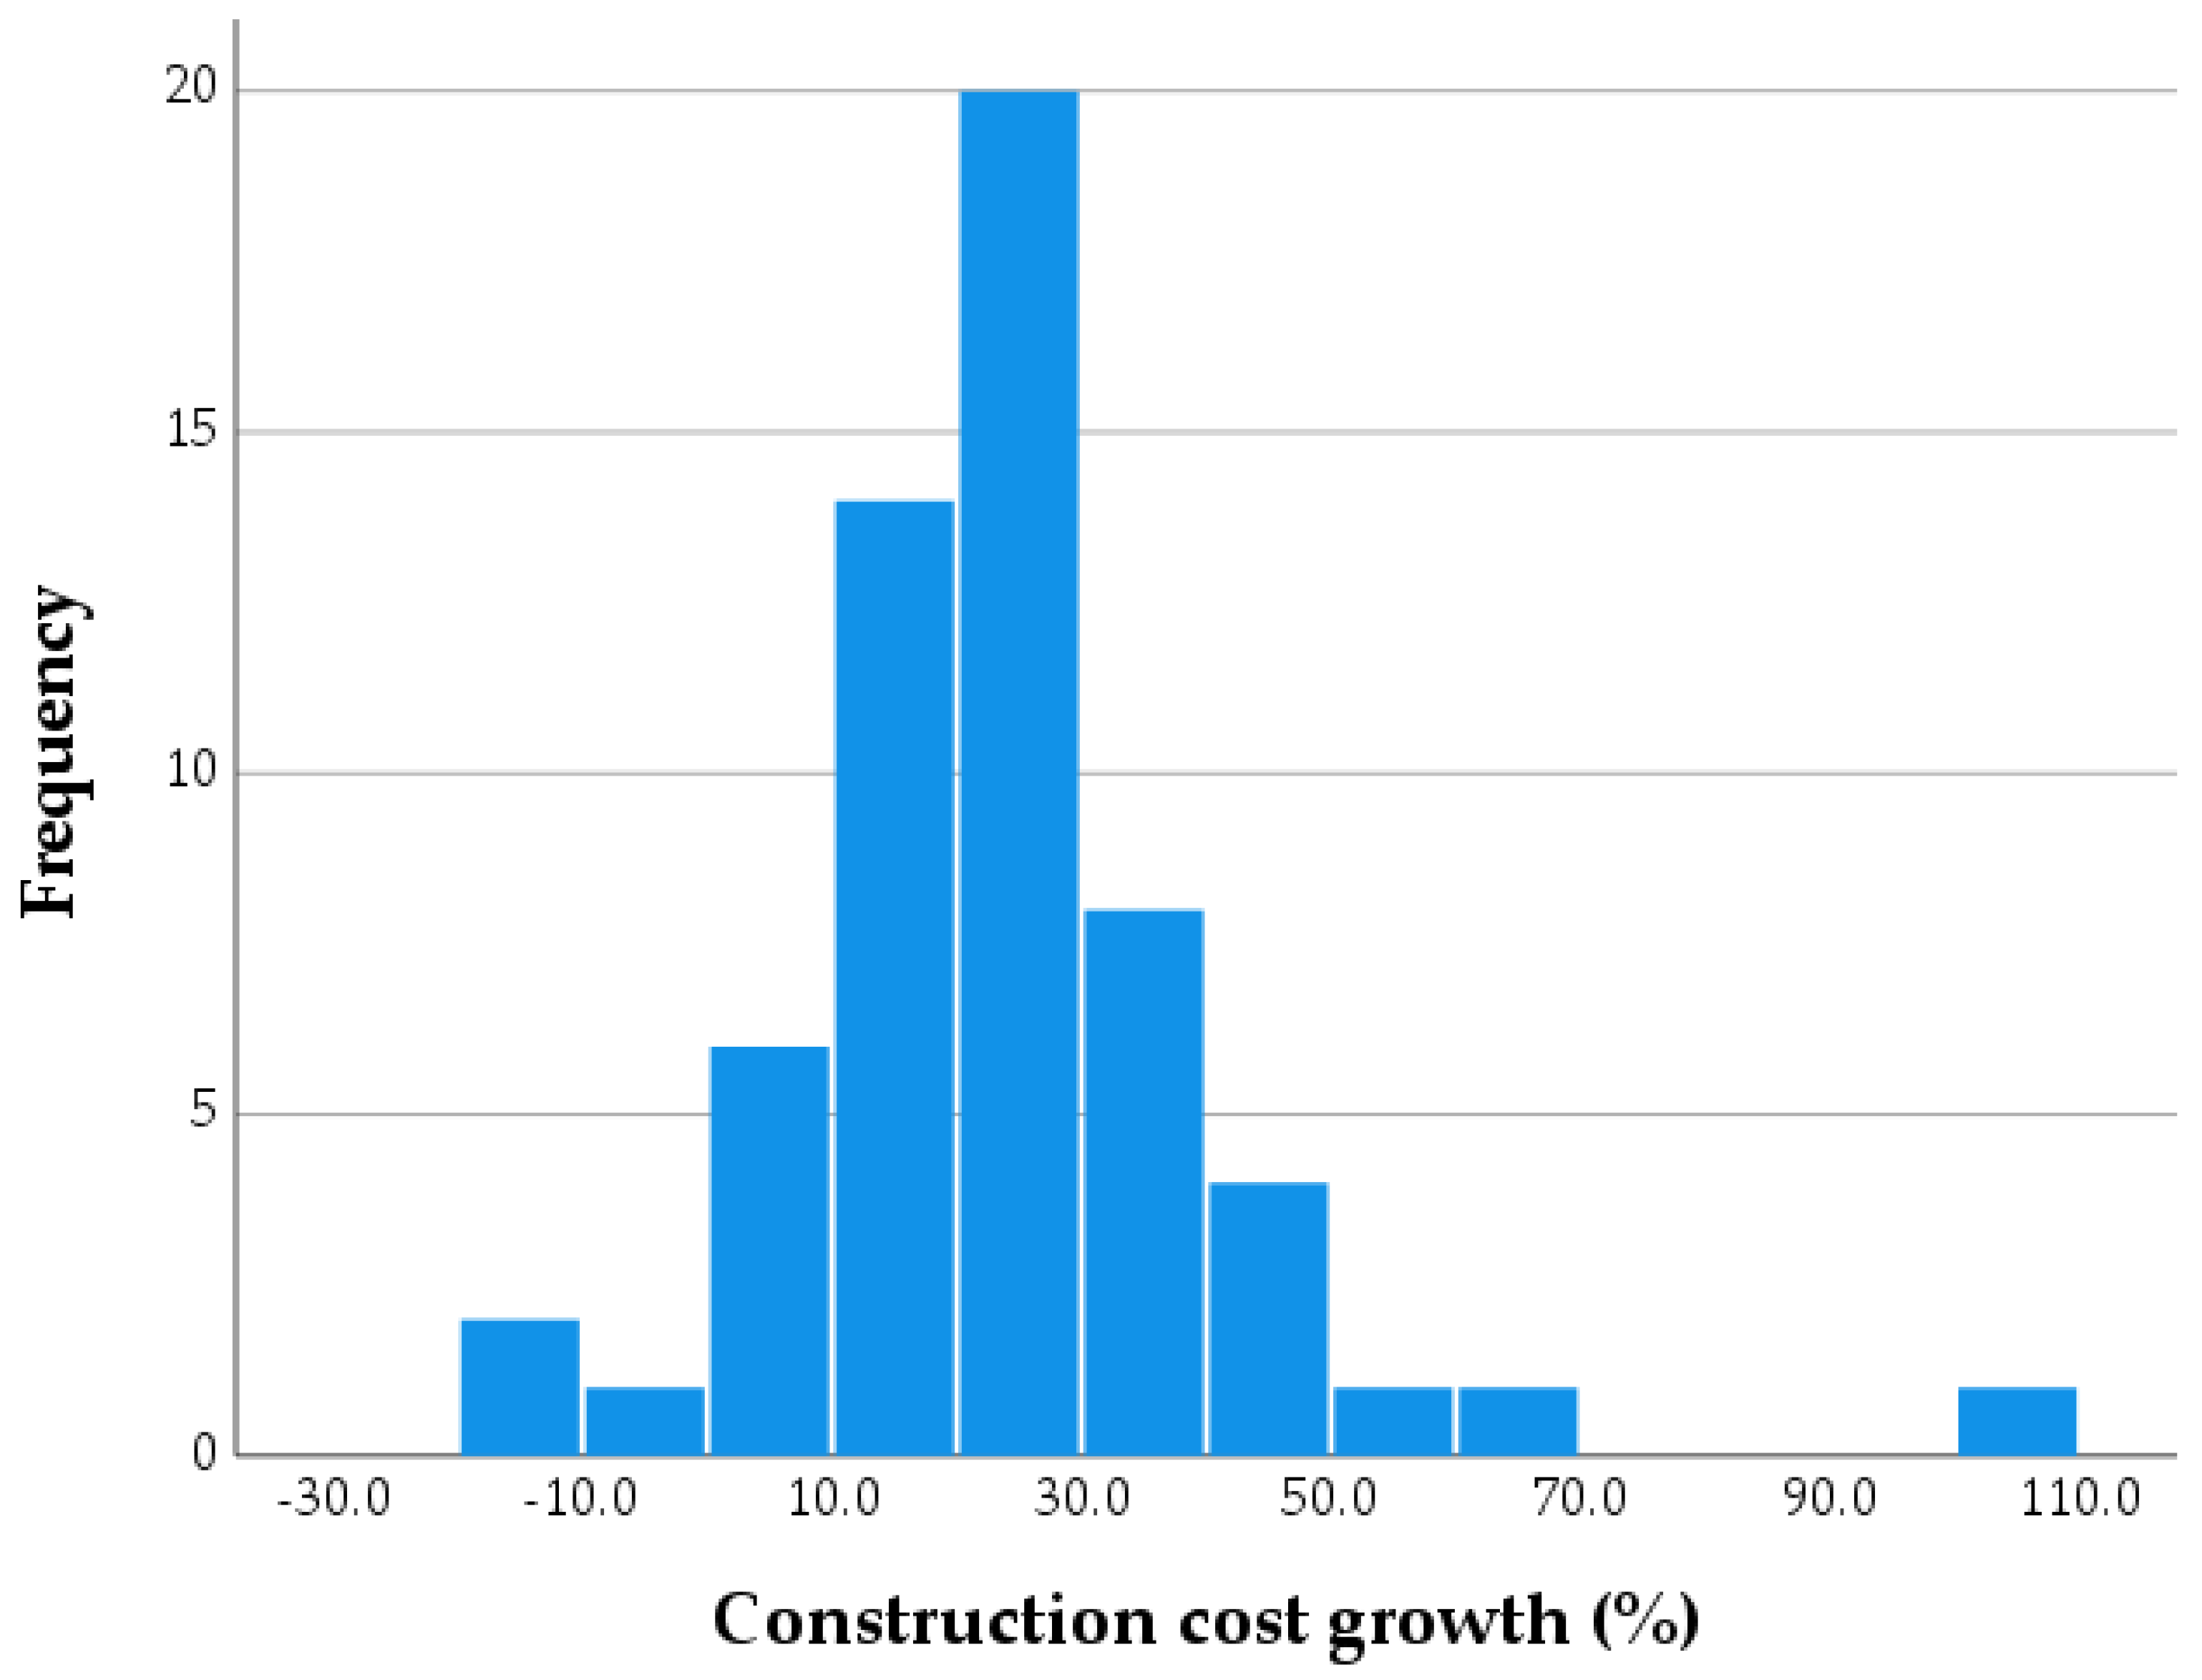
4.1. Cost Performance of the Total Sample

This section analyzes the distribution of construction cost growth based on various project characteristics and bidding conditions (bid award rate) before comparing between sub-groups. First, Figure 2, Figure 3 and Figure 4 display histograms depicting the construction cost growth by bid award rate intervals. When the bid award rate is less than 70% (Figure 2), the average construction cost growth for 58 projects is 23.93%, with a median of 22.36% and a standard deviation (S.D.) of 18.33%. When the bid award rate is between 70 and 80% (Figure 3), the average construction cost growth for 79 projects is 16.99%, with a median of 14.26% and an S.D. of 16.62%. When the bid award rate is above 80% (Figure 4), the average construction cost growth for 33 projects is 21.43%, with a median of 18.54% and an S.D. of 17.83%. These results indicate that the distribution of construction cost growth in the group with a bid award rate of less than 70% is higher and wider compared to that of other groups. As shown in Table 3 and Table 4, the Kruskal–Wallis test results indicate that the construction cost growth in the group with a bid award rate of less than 70% is significantly higher compared to the group with a bid award rate of 70–80%, at a significance level of 0.01.
Table 5 presents descriptive statistics on the distribution of construction cost growth based on road project characteristics (construction type, contract method, facility capacity, and construction cost components). In terms of construction type, the average and median values of expansion/renovation are slightly lower compared to those of new construction and complex. However, the S.D. is relatively higher. Regarding the contract method, the average and S.D. of ongoing expenditure are both higher than those of the long-term continuous method, indicating a more dispersed distribution. In terms of facility capacity, the total road length and percentage of bridge and tunnel length both exhibit a spread distribution in the longer length group (i.e., high average and S.D.). Regarding the scale of construction costs, groups with a budget of over USD 100 million tend to have higher median and S.D. values. In terms of construction cost components, the group with a high proportion of structural and tunnel costs shows relatively higher average and median values, while the proportion of direct construction costs is low. Since these descriptive statistics do not demonstrate statistical significance, more detailed analysis results regarding the differences between sub-groups will be presented in the following section.

4.2. Performance Comparisons Based on Project Characteristics

4.2.1. Construction Type

As mentioned in Section 3.3, the Kruskal–Wallis and Mann–Whitney U tests were conducted in this study, considering the number of different sub-groups. No significant differences were observed in the construction cost growth between groups in terms of construction type, as indicated by Table 6 ( χ 2 = 2.470 , p = 0.291 ). Table 7 and Table 8 display the results of the statistical test on the difference in construction cost growth based on bid award rate levels. For the expansion/renovation ( Z = 1.672 , p = 0.095 ) and complex ( Z = 2.184 , p = 0.029 ) cases, a significant difference in construction cost growth was observed based on bid award rate levels. However, no significant difference was observed in new construction projects. In particular, both expansion/renovation and complex projects exhibited high construction cost growth for projects with a bid award rate of less than 70%.

4.2.2. Contract Method

Table 9 shows that in terms of the contract method, the construction cost growth of ongoing expenditure is significantly higher than that of long-term continuous at a significance level of 0.01 ( Z = 2.849 , p = 0.004 ). Table 10 and Table 11 display the results of the statistical test on the difference in construction cost growth based on bid award rate levels. Significant differences in construction cost growth were observed across bid award rate levels in the long-term continuous method ( Z = 3.328 , p = 0.001 ), while no significant differences in construction cost growth were observed in the ongoing expenditure method. The long-term continuous method is implemented without securing the total construction cost, which results in frequent delays in the construction schedule and increased indirect costs due to budget shortages [27]. The phenomenon of increasing construction costs in this long-term continuous method is more pronounced in the group with a bid award rate of less than 70%.

4.2.3. Total Road Length

Table 12 shows that the construction cost growth of the group with a longer road length is significantly higher in terms of total road length, at a significance level of 0.05 ( Z = 2.547 , p = 0.011 ). Table 13 and Table 14 display the test results for the difference in construction cost growth based on bid award rate levels. With respect to road length, a significant difference is observed in construction cost growth based on bid award rate levels in the group of 7.5 km or more ( Z = 2.057 , p = 0.040 ). However, no significant difference is observed in the less-than-7.5 km group. The average road length by group is 11.4 km for the 7.5 km+ group and 5.1 km for the less-than-7.5 km group. In summary, the group with longer road lengths shows a larger construction cost growth when the bid award rate is less than 70%.

4.2.4. Percentage of Bridge and Tunnel Length

As shown in Table 15, the percentage of bridge/tunnel length does not show a significant difference in construction cost growth between the groups ( Z = 1.042 , p = 0.297 ). Table 16 and Table 17 show the results of Kruskal–Wallis tests and post hoc comparisons for the construction cost growth by bid award rate level. In terms of the proportion of bridge/tunnel length, the difference in construction cost growth by bid award rate level is significant in the group with less than 10% ( χ 2 = 7.030 , p = 0.030 ). In particular, the construction cost growth of projects with a bid award rate of less than 70% was greater than that of projects with bid award rates between 70 and 79.9% (Table 17). Similar trends were observed in the 10%+ group, but they are not statistically significant. The average percentage of bridge/tunnel length by group was 4.2% for the group with less than 10% and 31.6% for the group with 10%+. In summary, the difference in construction cost growth based on bid award rate level was more evident in the group with a lower proportion of bridge/tunnel length.

4.2.5. Size of Construction Cost

Table 18 shows that in terms of the size of construction cost, no significant difference is observed in construction cost growth between groups ( Z = 0.091 , p = 0.927 ). Table 19 and Table 20 display the results of Kruskal–Wallis tests and post hoc comparisons regarding the differences in construction cost growth based on bid award rate levels. From a construction cost perspective, a significant difference is observed in construction cost growth based on bid award rate levels in the group with construction costs of USD 100 million or less ( χ 2 = 13.775 , p = 0.001 ). However, no significant difference is observed in the group with construction costs of over USD 100 million. The average construction cost is USD 57.4 million for the group, with construction costs of USD 100 million or less, while it is USD 185.6 million for the group with construction costs exceeding USD 100 million. In summary, the difference in construction cost growth by bid award rate levels (less than 70% and 70–79.9%) is more pronounced in the group with lower construction costs.

4.2.6. Percentage of Direct Construction Cost

Table 21 shows that the group with a lower percentage of direct construction cost exhibits a significantly higher construction cost growth at a significance level of 0.01 ( Z = 3.977 , p = 0.000 ). Table 22 and Table 23 display the test results for the difference in construction cost growth based on bid award rate levels. In terms of the proportion of direct construction cost, a significant difference was observed in construction cost growth by bid award rate levels in the group with a proportion of 70% or higher ( Z = 2.188 , p = 0.029 ). However, the group with a proportion of less than 70% did not show a statistically significant difference. The average percentage of direct construction cost by group is 64.1% for the group with less than 70% and 73.8% for the group with 70% and more. In summary, the difference in construction cost growth based on bid award rate levels is more pronounced in a group where the proportion of direct construction cost is higher.

4.2.7. Percentage of Structure and Tunnel Cost

Table 24 shows no significant difference in the construction cost growth between groups in terms of the percentage of structure/tunnel cost ( Z = 0.651 , p = 0.515 ). Table 25 presents the results of the Mann–Whitney U test, showing the differences in construction cost growth based on bid award rate levels. In terms of the proportion of structure/tunnel cost, there were significant differences in construction cost growth based on bid award rate levels in both groups: less than 50% ( Z = 1.872 , p = 0.061 ) and 50%+ ( Z = 1.753 , p = 0.080 ). The average percentage of structure/tunnel cost for the group with less than 50% is 34.8%, and it is 64.0% for the group with 50% and more. In summary, regardless of the proportion of structure/tunnel costs, a bid award rate under 70% is associated with significantly higher construction cost growth.

4.3. Causal Relationship Between Variables and Cost Performance

In this section, multiple regression analysis is additionally conducted to examine the causal relationship between the variables analyzed above and cost performance. Because the purpose of the regression analysis is to analyze the overall causal relationship between independent variables and dependent variables rather than to accurately predict the dependent variable (construction cost growth), the categories of independent variables presented in Section 4.2 are utilized. The dependent variable (construction cost growth) is divided into four scales based on the quartiles in the distribution of the entire sample presented in Table 5: 1 ( < 10.75%), 2 (10.75 17.58%), 3 (17.58 27.03%), and 4 ( 27.03%). The overall explanatory power of the regression model, R-squared, is somewhat low at 0.264. This is because the factors affecting construction cost growth are extensive, including not only bidding conditions and project characteristics but also uncertainties caused by various project stakeholders (e.g., the client, design consultants, contractors, and third parties) [2,28]. In addition, the variance inflation factor ( < 2.0), F-test ( F = 3.938 , p = 0.001 ), and the Durbin–Watson statistic (1.932), which indicate the appropriateness of the regression model, all indicate satisfactory values. Table 26 shows the regression coefficient estimates by variables of the proposed model. Similar to the results in Section 4.2, the percentage of direct construction cost ( B e t a = 0.395 , p = 0.000 ), bid award rate ( B e t a = 0.202 , p = 0.051 ), total road length ( B e t a = 0.190 , p = 0.054 ), and contract method ( B e t a = 0.181 , p = 0.081 ) had a relatively large effect on construction cost growth compared to other variables and showed statistical significance as well.

5. Discussions and Conclusions

This study comparatively analyzed construction cost growth based on bidding conditions and project characteristics of 170 road construction projects. Specifically, this study conducted an in-depth analysis of differences in construction cost growth by project attributes, such as bid award rate, construction type, contract method, facility capacity, and construction cost components. Considering the difficulty of data collection, which limits the quantitative performance analysis of a single specific facility, the empirical results presented in this paper offer several useful insights from both academic and practical perspectives.
Consistent with previous studies, this study observed a general trend of increasing construction costs in 170 road projects, similar to the planned completion point, with the average growth rate found to be 20.22%. Specifically, the construction cost growth of the group with a bid award rate of less than 70% showed a significantly higher level compared to that of other groups; the difference was statistically significant ( p < 0.01 ). Furthermore, according to the project characteristics, the differences in the construction cost growth by the bid award rate level appeared more distinct in the following groups: construction type (expansion/renovation and complex), contract method (long-term continuous), road length (≥7.5 km), % of bridge/tunnel length (<10%), construction cost (≤USD 100 mil.), % of direct construction cost (≥70%), and % of bridge/tunnel cost (both less and more than 50%). In addition, in the regression model that analyzed the causal relationship between variables, % of direct construction cost, bid award rate, total road length, and contract method were shown to be critical factors in construction cost growth, which implies the importance of indirect cost management, PDS selection decisions that affect bid award rates, and risk management for complex projects from the perspective of construction cost growth management. Due to the difficulty of collecting sufficient samples, this study could not compare the performance by PDS type (163 design–bid–build projects, 7 design–build projects); however, the average bid award rate of design–bid–build was 71.55%, and that of design–build was 91.98%, showing a significant difference, confirming the need for further research. Nonetheless, while previous comparative studies on road project performance focused on individual aspects of construction type (new construction, reconstruction, etc.) [10], project size [29], and project characteristics (facility type, bid type, contract type, etc.) [2], this study is significant in that it took into account bidding condition and facility-specific project characteristics in a more comprehensive manner.
These findings empirically demonstrate that bidding conditions and project characteristics are crucial factors in understanding the pattern of construction cost growth in road construction projects—a significant result because it provides a reference that road policy makers and clients can use to estimate the cost buffer for future similar projects. In South Korea, assuming the initial government estimate price of a construction project is 100%, applying the bid award rate results in a decrease in the prime contract amount to 73.68% and the subcontract amount to 66.31% [30]. In such circumstances, contractors tend to abandon or avoid bidding on construction projects because of a low bid award rate, which leads to a decline in profitability, intensified price competition among contractors, and numerous change orders. Hence, construction policy makers and clients should systematically manage the appropriate bid award rate and cost buffer based on project attributes, and relevant research should be continued to promote a sustainable construction industry. The author plans to conduct an in-depth qualitative study on the causes of the findings obtained in this study. Furthermore, the research scope will be expanded to consider the impact of project bidding conditions on other aspects, such as safety performance [31].
Meanwhile, the 170 road projects analyzed in this study were limited to a single country (Korea) and completed between 2000 and 2015, which limits their ability to reflect the performance of other countries and recent trends (the impact of the COVID-19 pandemic). The COVID-19 pandemic has caused significant disruption to construction projects, disrupting global supply chains, limiting labor availability, and creating contractual issues [32,33,34]. In particular, Ling et al. [32] argued that Singapore construction projects have suffered significant cost overruns (more than 5%), schedule delays (by an average of 46%), quality degradation, and productivity loss due to the COVID-19 pandemic, and they have anticipated that bid prices for new projects will continue to rise. Although this trend may differ somewhat by country, it is expected to show similar patterns not only in Singapore but also in other countries, and further research on country-specific project environments and performance is required. In this context, international comparative studies of construction project performance are meaningful [16,17], and the author plans to improve the generality of follow-up research results by supplementing sample data and analysis frameworks in the future. In light of the above discussion, the author proposes the following follow-up research topics related to construction project performance analysis and management: (1) in-depth analysis of cost change mechanisms by bid award rate level; (2) analysis of the impact of bidding condition on overall project performance (cost, schedule, quality, safety, etc.); (3) comparative analysis of project performance before and after the COVID-19 pandemic, and (4) international comparison of project performance considering country-specific factors.

Funding

This research was carried out under the Korea Institute of Civil Engineering and Building Technology (KICT) Research Program (Project No. 20240074-001, Operation of Post-Construction Evaluation and Management Center), funded by the Ministry of Land, Infrastructure, and Transport (MOLIT) of Korea.

Institutional Review Board Statement

Not applicable.

Informed Consent Statement

Not applicable.

Data Availability Statement

Data are contained within the article.

Conflicts of Interest

The author declares no conflicts of interest.

References

  1. Li, H.; Liu, Y.; Peng, K. Characterizing the relationship between road infrastructure and local economy using structural equation modeling. Transp. Policy 2018, 61, 17–25. [Google Scholar] [CrossRef]
  2. Lee, K.W.; Kim, K.H. Analyzing Cost and Schedule Growths of Road Construction Projects, Considering Project Characteristics. Sustainability 2021, 13, 13694. [Google Scholar] [CrossRef]
  3. Global Infrastructure Investor Association (GIIA). Global Infrastructure Index 2023. Available online: https://giia.net/sites/default/files/2023-09/GIIA%20and%20Ipsos%20public%20attitudes%20tracker%202023%20GB.pdf (accessed on 13 June 2024).
  4. Global Infrastructure Investor Association (GIIA). Global Infrastructure Index 2021. Available online: https://www.ipsos.com/sites/default/files/ct/news/documents/2021-10/Global%20Infrastructure%202021%20-%20US%20Version%20.pdf (accessed on 13 June 2024).
  5. Gkritza, K.; Labi, S. Estimating cost discrepancies in highway contracts: Multistep econometric approach. J. Constr. Eng. Manag. 2008, 134, 953–962. [Google Scholar] [CrossRef]
  6. Sullivan, J.; El Asmar, M.; Chalhoub, J.; Obeid, H. Two decades of performance comparisons for design-build, construction manager at risk, and design-bid-build: Quantitative analysis of the state of knowledge on project cost, schedule, and quality. J. Constr. Eng. Manag. 2017, 143, 04017009. [Google Scholar] [CrossRef]
  7. Moon, H.; Kim, K.; Lee, H.S.; Park, M.; Williams, T.P.; Son, B.; Chun, J.Y. Cost performance comparison of design-build and design-bid-build for building and civil projects using mediation analysis. J. Constr. Eng. Manag. 2020, 146, 04020113. [Google Scholar] [CrossRef]
  8. Shrestha, P.P.; O’Connor, J.T.; Gibson, G.E. Performance comparison of large design-build and design-bid-build highway projects. J. Constr. Eng. Manag. 2012, 138, 1–13. [Google Scholar] [CrossRef]
  9. Minchin, R.E.; Li, X.; Issa, R.R.; Vargas, G.G. Comparison of cost and time performance of design-build and design-bid-build delivery systems in Florida. J. Constr. Eng. Manag. 2013, 139, 04013007. [Google Scholar] [CrossRef]
  10. Tran, D.Q.; Diraviam, G.; Minchin, R.E. Performance of highway design-bid-build and design-build projects by work types. J. Constr. Eng. Manag. 2018, 144, 04017112. [Google Scholar] [CrossRef]
  11. Wardani, M.A.E.; Messner, J.I.; Horman, M.J. Comparing procurement methods for design-build projects. J. Constr. Eng. Manag. 2006, 132, 230–238. [Google Scholar] [CrossRef]
  12. Chen, Q.; Jin, Z.; Xia, B.; Wu, P.; Skitmore, M. Time and cost performance of design-build projects. J. Constr. Eng. Manag. 2016, 142, 04015074. [Google Scholar] [CrossRef]
  13. Jahren, C.T.; Ashe, A.M. Predictors of cost-overrun rates. J. Constr. Eng. Manag. 1990, 116, 548–552. [Google Scholar] [CrossRef]
  14. Williams, T.P. Bidding ratios to predict highway project costs. Eng. Constr. Archit. Manag. 2005, 12, 38–51. [Google Scholar] [CrossRef]
  15. Fathi, M.; Shrestha, P.P. Public-private partnership project performance analysis compared to design-build in highway projects. J. Constr. Eng. Manag. 2022, 148, 04022118. [Google Scholar] [CrossRef]
  16. Ling, F.Y.Y. International comparison of performance of public projects. Built Environ. Proj. Asset Manag. 2018, 8, 281–292. [Google Scholar] [CrossRef]
  17. Mejía, G.; Bohórquez, J.; Rivera, T.E. Benefits of using confidence intervals in reports of project cost overrun. In Construction Research Congress; ASCE: Reston, VA, USA, 2020; pp. 711–720. Available online: https://ascelibrary.org/doi/10.1061/9780784482889.075 (accessed on 1 November 2024).
  18. Somboonpisan, J.; Limsawasd, C. Environmental weight for bid evaluation to promote sustainability in highway construction projects. J. Constr. Eng. Manag. 2021, 147, 04021013. [Google Scholar] [CrossRef]
  19. Rastegar, H.; Shirani, B.A.; Mirmohammadi, S.H.; Bajegani, E.A. Stochastic programming model for bidding price decision in construction projects. J. Constr. Eng. Manag. 2021, 147, 04021025. [Google Scholar] [CrossRef]
  20. Shrestha, R.; Ko, T.; Lee, J. Uncertainties prevailing in construction bid documents and their impact on project pricing through the analysis of prebid requests for information. J. Manag. Eng. 2023, 39, 04023040. [Google Scholar] [CrossRef]
  21. Naji, K.K.; Gunduz, M.; Naser, A.F. An adaptive neurofuzzy inference system for the assessment of change order management performance in construction. J. Manag. Eng. 2022, 38, 04021098. [Google Scholar] [CrossRef]
  22. Oh, J.; Touran, A.; D’Angelo, D.; Clark, T.; Gaskins, C.; Ashuri, B. A comprehensive analysis of change orders based on project progress in design-build highway construction. In Construction Research Congress; ASCE: Reston, VA, USA, 2024; pp. 135–145. [Google Scholar] [CrossRef]
  23. Mathew, S.A.; Tran, D.Q.; Nguyen, P.H.D. Evaluation of cost growth factors in design-build highway projects using structural equation modeling. J. Constr. Eng. Manag. 2021, 147, 04021070. [Google Scholar] [CrossRef]
  24. Assaad, R.; El-Adaway, I.H.; Abotaleb, I.S. Predicting project performance in the construction industry. J. Constr. Eng. Manag. 2020, 146, 04020030. [Google Scholar] [CrossRef]
  25. Aboseif, E.; Hanna, A.S. Defining the success status of construction projects based on quantitative performance metrics thresholds. J. Manag. Eng. 2023, 39, 04022073. [Google Scholar] [CrossRef]
  26. Construction Continuous Acquisitions and Life-Cycle Support (Construction CALS). Ministry of Land, Infrastructure and Transport. Available online: http://www.calspia.go.kr/portal/ (accessed on 3 June 2024).
  27. Cho, Y. Systematic improvement for effective operation of long-term continuous construction contracts. Korean J. Constr. Eng. Manag. 2019, 20, 3–10. [Google Scholar] [CrossRef]
  28. Alnuaimi, A.S.; Taha, R.A.; Al Mohsin, M.; Al-Harthi, A.S. Causes, effects, benefits, and remedies of change orders on public construction projects in Oman. J. Constr. Eng. Manag. 2010, 136, 615–622. [Google Scholar] [CrossRef]
  29. Nguyen, P.H.D.; Tran, D.Q.; Bypaneni, S.P.K. Exploring the impact of project size on design-bid-build and design-build project delivery performance in highways. Constr. Manag. Econ. 2021, 11, 879–893. [Google Scholar] [CrossRef]
  30. Construction and Economy Research Institute of Korea (CERIK). Analysis on Public Cost Status and Responding Policy Recommendations. 2018. Available online: https://cerik.re.kr/report/research/detail/2099 (accessed on 5 June 2024).
  31. Hong, E.; Kwak, Y.H.; Kettunen, J. Does competition impact workplace safety in public utilities’ procurement? Insights from bid-estimate ratio and firm size. IEEE Trans. Eng. Manag. 2024, 71, 9892–9905. [Google Scholar] [CrossRef]
  32. Ling, F.Y.Y.; Zhang, Z.; Yew, A.Y.R. Impact of COVID-19 pandemic on demand, output, and outcomes of construction projects in Singapore. J. Manag. Eng. 2022, 38, 04021097. [Google Scholar] [CrossRef]
  33. Raoufi, M.; Fayek, A.R. New modes of operating for construction organizations during the COVID-19 pandemic: Challenges, actions, and future best practices. J. Manag. Eng. 2022, 38, 04021091. [Google Scholar] [CrossRef]
  34. Araya, F.; Ogalde, K.; Sierra, L. A critical review of impacts from the COVID-19 pandemic in construction projects: What have we learned? In Construction Research Congress; ASCE: Reston, VA, USA, 2024; pp. 621–631. [Google Scholar] [CrossRef]
Figure 1. Research process and description.
Sustainability 16 10083 g001
Figure 2. Histogram of construction cost growths with bid award rates of less than 70%.
Sustainability 16 10083 g002
Figure 3. Histogram of construction cost growths in the range of 70–80% bid award rates.
Sustainability 16 10083 g003
Figure 4. Histogram of construction cost growths with bid award rates of 80% or higher.
Sustainability 16 10083 g004
Table 1. Characteristics of sample projects.
CharacteristicsNumber of Road Projects (% of Total)
Construction typeNew ConstructionExpansion/renovationComplex
88 (51.8%)53 (31.2%)27 (15.9%)
Contract methodLong-term ContinuousOngoing Expenditure
57 (33.5%)91 (53.5%)
Total road length (km) < 7.5 7.5
83 (48.8%)87 (51.2%)
% of bridge and tunnel length < 10 10
71 (41.8%)80 (47.1%)
Size of construction cost
(USD million)
100 100
129 (75.9%)41 (24.1%)
% of direct construction cost < 70 70
65 (38.2%)47 (27.6%)
% of structure and tunnel cost < 50 50
84 (49.4%)29 (17.1%)
Table 2. Facility-specific characteristics of sample projects.
CharacteristicsNumber of Cases (% of Total)
Number of lanes2
29 (22.3%)
4
93 (71.5%)
6
8 (6.2%)
8
1 (0.8%)
Type of bridge superstructuresConcrete
1015 (73.7%)
Steel
330 (23.9%)
Special types
24 (1.7%)
Others
9 (0.7%)
Tunnel construction methodNATM
64 (64.0%)
NATM + Opencut
33 (33.0%)
TBM + NATM
3 (3.0%)
NTR
2 (2.0%)
Type of intersectionsAt-grade
336 (60.3%)
Grade-separated
226 (37.2%)
Others
15 (2.5%)
Table 3. Kruskal–Wallis test results for the entire sample: ranks.
Bid Award RateNMeanS.D.Mean Rank χ 2 p
< 70%5823.93 18.33 100.74 12.268 0.002
70.1 79.9%7916.9916.6271.73
80%3321.4317.8391.68
Table 4. Kruskal–Wallis test results for the entire sample: post hoc comparisons.
Bid Award Rate
(I)
Bid Award Rate
(J)
Group Difference
(I−J)
S.E.Significance
70.1 79.9% 80%−19.95410.2020.151
70.1 79.9% < 70%29.0148.5110.002
80% < 70%9.06010.7321.000
Table 5. Descriptive statistics on construction cost growth by road project characteristics.
CharacteristicMeanS.D.Min.Q1Med.Q3Max
Total sample20.2217.63−25.5710.7517.5827.03101.37
Construction type
New construction21.2018.05 −25.5711.4817.83 26.93 82.43
Expansion/renovation18.1118.46−22.227.3715.8123.95101.37
Complex21.3214.45−8.87 12.0121.6628.72 48.93
Contract method
Long-term continuous17.05 13.71 −8.87 10.82 14.79 19.60 64.24
Ongoing expenditure24.16 19.16 −25.57 12.88 22.44 30.23 101.37
Total road length (km)
< 7.516.65 14.05 −25.57 8.06 14.79 21.38 68.35
7.523.63 19.97 −22.22 12.79 20.37 33.16 101.37
% of bridge and tunnel length
< 1020.16 16.24 −8.87 12.15 16.99 25.95 82.43
1022.51 18.77 −25.57 12.72 19.06 29.53 101.37
Size of construction cost (USD million)
10020.56 16.76 −8.87 12.30 16.99 25.88 101.37
> 10019.14 20.32 −25.57 6.21 19.37 34.55 65.68
% of direct construction cost
< 7026.22 17.28 −4.07 14.16 24.72 32.07 82.43
7015.92 18.30 −11.76 6.93 13.53 17.39 101.37
% of structure and tunnel cost
< 5021.24 18.43 −11.76 11.26 16.51 27.14 101.37
5023.32 18.25 −4.07 8.54 22.24 28.90 68.35
Table 6. Kruskal–Wallis test results by construction type.
Construction TypeNMean Rank χ 2 p
New construction8887.962.470 0.291
Expansion/renovation5577.45
Complex2793.87
Table 7. Kruskal–Wallis test results by bid award rate level: new construction.
Construction TypeBid Award RateNMeanS.D.Mean Rank χ 2 p
New construction < 70%2722.25 18.32 49.00 1.625 0.444
70 79.9%3920.66 17.59 40.92
80%2220.87 19.29 45.32
Table 8. Mann–Whitney U test results by bid award rate level: expansion/renovation and complex.
Construction TypeBid Award RateNMeanS.D.Mean RankUZp
Expansion/renovation < 70%1824.4222.9331.94226.00 −1.672 0.095
70%3715.0315.2824.46
Complex < 70%1326.7310.4617.4646.00 −2.184 0.029
70%1416.2916.1410.79
Table 9. Mann–Whitney U test results by contract method.
Contract MethodNMean RankUZp
Long-term continuous5761.821870.500−2.8490.004
Ongoing expenditure9182.45
Table 10. Mann–Whitney U test results by bid award rate level: long-term continuous.
Contract MethodBid Award RateNMeanS.D.Mean RankUZp
Long-term continuous < 70%1225.12 10.51 43.17 100.000 −3.328 0.001
70%4514.90 13.75 25.22
Table 11. Kruskal–Wallis test results by bid award rate level: ongoing expenditure.
Contract MethodBid Award RateNMeanS.D.Mean Rank χ 2 p
Ongoing expenditure < 70%4325.31 19.28 48.63 1.427 0.490
70 79.9%2623.16 19.67 40.88
80%2223.08 19.08 46.91
Table 12. Mann–Whitney U test results by total road length.
Road LengthNMean RankUZp
Less than 7.5 km8375.662793.500−2.5470.011
7.5 km and above8794.89
Table 13. Kruskal–Wallis test results by bid award rate level: less than 7.5 km.
Road LengthBid Award RateNMeanS.D.Mean Rank χ 2 p
Less than 7.5 km < 70%1919.00 17.18 46.21 0.752 0.686
70 79.9%4416.28 11.57 40.80
80%2015.22 16.18 40.65
Table 14. Mann–Whitney U test results by bid award rate level: 7.5 km and above.
Road LengthBid Award RateNMeanS.D.Mean RankUZp
7.5 km and above < 70%3926.3318.6150.18695.00−2.0570.040
70%4821.4320.9438.98
Table 15. Mann–Whitney U test results by percentage of bridge and tunnel length.
% of Bridge/Tunnel LengthNMean RankUZp
Less than 10%7172.062560.500−1.0420.297
10% and above8079.49
Table 16. Kruskal–Wallis test results by bid award rate level.
% of Bridge/Tunnel LengthBid Award RateNMeanS.D.Mean Rank χ 2 p
Less than 10% < 70%2123.27 9.60 45.48 7.030 0.030
70 79.9%3818.01 18.55 30.61
80%1221.57 17.80 36.50
10% and above < 70%3426.51 21.2146.29 4.448 0.108
70 79.9%2618.97 15.1833.58
80%2020.33 18.1439.65
Table 17. Kruskal–Wallis test results by bid award rate level: post hoc comparisons.
% of Bridge/
Tunnel Length
Bid Award Rate
(I)
Bid Award Rate
(J)
Group Difference
(I−J)
S.E.Significance
Less than 10%70 79.9% < 70%14.8715.6120.024
70 79.9% 80%−5.8956.8351.000
80% < 70%8.9767.4690.688
Table 18. Mann–Whitney U test results by size of construction cost.
Size of Construction CostNMean RankUZp
USD 100 mil. and less12985.692619.500−0.0910.927
Over USD 100 mil.4184.89
Table 19. Kruskal–Wallis test results by bid award rate level.
Size of Construction CostBid Award RateNMeanS.D.Mean Rank χ 2 p
USD 100 mil. and less < 70%4625.18 17.56 80.54 13.775 0.001
70 79.9%6717.10 15.37 54.00
80%1621.79 17.67 66.38
Over USD 100 mil. < 70%1219.13 21.1821.58 0.999 0.607
70 79.9%1216.39 23.2518.17
80%1721.08 18.5222.59
Table 20. Kruskal–Wallis test results by bid award rate level: post hoc comparisons.
Size of
Construction Cost
Bid Award Rate
(I)
Bid Award Rate
(J)
Group Difference
(I−J)
S.E.Significance
USD 100 mil.
and less
70 79.9% 80%−12.37510.4020.703
70 79.9% < 70%26.5437.1580.001
80% < 70%14.16810.8500.575
Table 21. Mann–Whitney U test results by percentage of direct construction cost.
% of Direct Construction CostNMean RankUZp
Less than 70%6566.88853.000−3.9770.000
70% and above4742.15
Table 22. Kruskal–Wallis test results by bid award rate level: less than 70%.
% of Direct Construction CostBid Award RateNMeanS.D.Mean Rank χ 2 p
Less than 70% < 70%2028.51 13.01 38.75 3.883 0.143
70 79.9%2329.21 20.91 33.48
80%2221.02 16.00 27.27
Table 23. Mann–Whitney U test results by bid award rate level: more than 70%.
% of Direct
Construction Cost
Bid Award RateNMeanS.D.Mean RankUZp
70% and above < 70%1824.34 26.35 29.56 161.000 −2.188 0.029
70%2910.70 7.41 20.55
Table 24. Mann–Whitney U test results by percentage of structure and tunnel cost.
% of Structure/Tunnel CostNMean RankUZp
Less than 50%8455.821119.000−0.6510.515
50% and above2960.41
Table 25. Mann–Whitney U test results by bid award rate level.
% of Structure/
Tunnel Cost
Bid Award RateNMeanS.D.Mean RankUZp
Less than 50% < 70%2724.97 20.46 49.74574.00 −1.872 0.061
70%5719.47 17.30 39.07
50% and above < 70%1130.37 20.19 18.5560.00 −1.753 0.080
70%1819.01 16.04 12.83
Table 26. Coefficients of multiple regression analysis.
VariableUnstandardized
Coefficient
Standardized
Coefficient
tSignificance
(p)
BS.E.Beta
Constant4.514 1.173 -3.847 0.000
Bid award rate−0.288 0.146 −0.202 −1.9770.051
Construction type−0.121 0.147 −0.082 −0.822 0.413
Contract method0.416 0.236 0.181 1.764 0.081
Total road length0.419 0.215 0.190 1.950 0.054
% of bridge and tunnel length0.272 0.213 0.124 1.274 0.206
Size of construction cost−0.186 0.307 −0.072 −0.607 0.545
% of direct construction cost−0.903 0.223 −0.395 −4.042 0.000
% of structure and tunnel cost−0.242 0.263 −0.101 −0.919 0.360
Disclaimer/Publisher’s Note: The statements, opinions and data contained in all publications are solely those of the individual author(s) and contributor(s) and not of MDPI and/or the editor(s). MDPI and/or the editor(s) disclaim responsibility for any injury to people or property resulting from any ideas, methods, instructions or products referred to in the content.

