Article

Techno-Economic Analysis of BAU-STR Dryer for Rice Drying: An Approach to Accelerate Adoption

1
Department of Agriculture/Agricultural Regulations, University of Arkansas at Pine Bluff, Pine Bluff, AR 71601, USA
2
Department of Farm Power and Machinery, Bangladesh Agricultural University, Mymensingh 2202, Bangladesh
3
Agricultural Engineering Technology, School of Agriculture, Tennessee Tech University, Cooksville, TN 38505, USA
*
Author to whom correspondence should be addressed.
Sustainability 2024, 16(22), 9846; https://doi.org/10.3390/su16229846
Submission received: 9 August 2024 / Revised: 21 October 2024 / Accepted: 4 November 2024 / Published: 12 November 2024
(This article belongs to the Section Sustainable Agriculture)

Abstract

:
Postharvest food loss and waste offset worldwide agricultural productivity and food security. Insufficient drying and storage are the prominent drivers of food loss and waste in underdeveloped countries. Mechanical grain drying systems have distinct benefits over sun drying but are inaccessible to underserved communities due to high capital costs and energy demand. This study evaluated the techno-economic and financial performance of a half-ton-capacity BAU-STR dryer. The moisture extraction rate, drying rate, drying efficiency, and energy consumption were used as technical performance indicators. In contrast, the net present value (NPV), internal rate of return (IRR), benefit–cost ratio (BCR), and payback period were considered economic performance indicators. The technical performance analysis results revealed that the moisture content of rice was reduced from 19.5% to 13.5 ± 0.15% in 4.0 h with an average drying rate of 1.5%/h and a drying efficiency of 75.1%. The financial performance analysis resulted in a drying cost, NPV, IRR, BCR, and PBP of USD 0.96 per 100 kg of grain, USD 3018, 135%, 3.0, and 0.73 yr., respectively, when the annual use was 240 h. If the yearly use of the dryer increased from 240 to 720 h, a higher NPV, IRR, and BCR, as well as a lower payback period and drying cost, could be achieved. Adopting a BAU-STR dryer for drying grain (rice and corn) among underserved communities could play a key role in postharvest food loss and waste.

1. Introduction

Postharvest food loss and waste are critical challenges in the global agri-food sector, undermining the worldwide efforts to increase agricultural productivity and food security [1]. These issues are severe in underdeveloped countries, where inadequate drying and storage facilities contribute significantly to grain loss [2]. Globally, it is estimated that around 30% of food produced is either lost or wasted across the supply chain, costing the global economy over USD 1 trillion annually [1]. A significant portion of these losses are attributed to inadequate postharvest handling, especially in the drying and storage stages [3]. For grains like rice and maize, the issue is particularly severe because they are usually harvested with a moisture content of 20 to 25% (wet basis), while the safe storage moisture content for cereal grains is generally between 12% and 14% (wet basis). To prevent spoilage and preserve quality, rice and maize need to be dried to below 14% moisture for long-term storage [4]. The storage of grain at a higher moisture content can lead to mold growth, insect infestation, and mycotoxin contamination, all of which can significantly reduce food quality and safety [5,6,7].
Aflatoxin contamination is a significant health concern in improperly dried grains. Aflatoxins, produced by the Aspergillus species, are known carcinogens, and their presence in rice and maize has been linked to stunted infant growth, liver cancer, and compromised immune function [6,8]. Mycotoxins also negatively affect food security by reducing the market value of grain, as contaminated batches are often rejected, leading to further economic losses for farmers [9]. Therefore, the drying of grain is critical to maintaining both grain quality and human health [10].
Drying is the process of the removal of moisture from grain that stabilizes grain, preserves its quality, and minimizes losses during storage [4,11]. In addition, wet grains attract insects and molds that are harmful to grain, and a higher moisture content also lowers the germination rate of grain [7,12]. So, drying grain promptly after harvesting to a safe moisture level is crucial for reducing postharvest losses and maintaining quality during storage. Furthermore, drying permits the production of quality seed, short-term and long-term storage, allows the year-round supply of the product, and takes advantage of higher prices after the harvesting season [4,13]. In developing countries, traditional sun drying remains the predominant method due to its low cost and simplicity. However, sun drying is highly inefficient and dependent on favorable weather conditions, which are often unpredictable [4,14]. Monsoon rains, high humidity, and cloudy conditions hinder effective drying, leading to re-wetting, mold growth, and deterioration in grain quality. These limitations highlight the urgent need for scalable mechanical drying solutions that are cost-effective and suitable for smallholder farmers [15].
Mechanical drying, in contrast to sun drying, offers a more controlled and reliable method for reducing grain moisture to safe levels. However, mechanical dryers are inaccessible to underserved communities due to high capital costs and energy demand. According to Chua and Chou [16], low-cost mechanical grain drying systems are more suitable for underserved communities. A low-cost drying technology should have a low initial capital cost, be easy to construct and fabricate with locally available materials, be easy to operate, repair, and maintain all parts and components, have a climate-independent application, and be gender independent. In addition, the energy consumption of the dryer should be minimal to reach the desired final moisture content [17].
The BAU-STR dryer, developed under the Postharvest Loss Reduction Innovation Lab (PHLIL)-Bangladesh project, represents one such solution. The dryer is a modified version of the SRR dryer, originally designed in Vietnam, and was adapted to local conditions in Bangladesh to meet the needs of smallholder farmers. The BAU-STR dryer has a capacity of 500 kg and was designed to be constructed using locally available materials, reducing the overall cost to approximately USD 700 per unit [12,14]. Over the past eight years, studies have shown that the BAU-STR dryer offers an effective, low-cost alternative to sun drying, with reported drying costs ranging from 0.75 to 0.9 USD/100 kg depending on the energy source [7,14,15,18,19,20].
The effectiveness of the BAU-STR dryer in reducing postharvest losses has been well documented. For instance, Alam et al. [18,19] found that the dryer reduced grain moisture to safe levels in less time compared to traditional methods, leading to improved grain quality and increased marketability. Furthermore, the dryer demonstrated an impressive energy efficiency of 65% and a payback period of just one year, making it an economically viable option for small-scale farmers [20]. These attributes make the BAU-STR dryer a promising technology for reducing postharvest losses and improving food security in other rice-producing regions worldwide.
Considering the BAU-STR dryer’s success in Bangladesh, a study was initiated at the University of Arkansas at Pine Bluff, Arkansas, USA, to assess its feasibility for adoption in other rice-growing regions. A replica of the BAU-STR dryer was constructed, and detailed technical and economic analyses were performed to develop a business model for its implementation for smallholder farmers in similar agri-climatic environments.

2. Materials and Methods

2.1. Technical Performance Study

2.1.1. Location of the Study

The fabrication of the BAU-STR dryer and its technical performance evaluation experiments were conducted at the Agricultural Technology and Training Center, University of Arkansas at Pine Bluff (UAPB), Arkansas, USA, from December 2022 to December 2023.

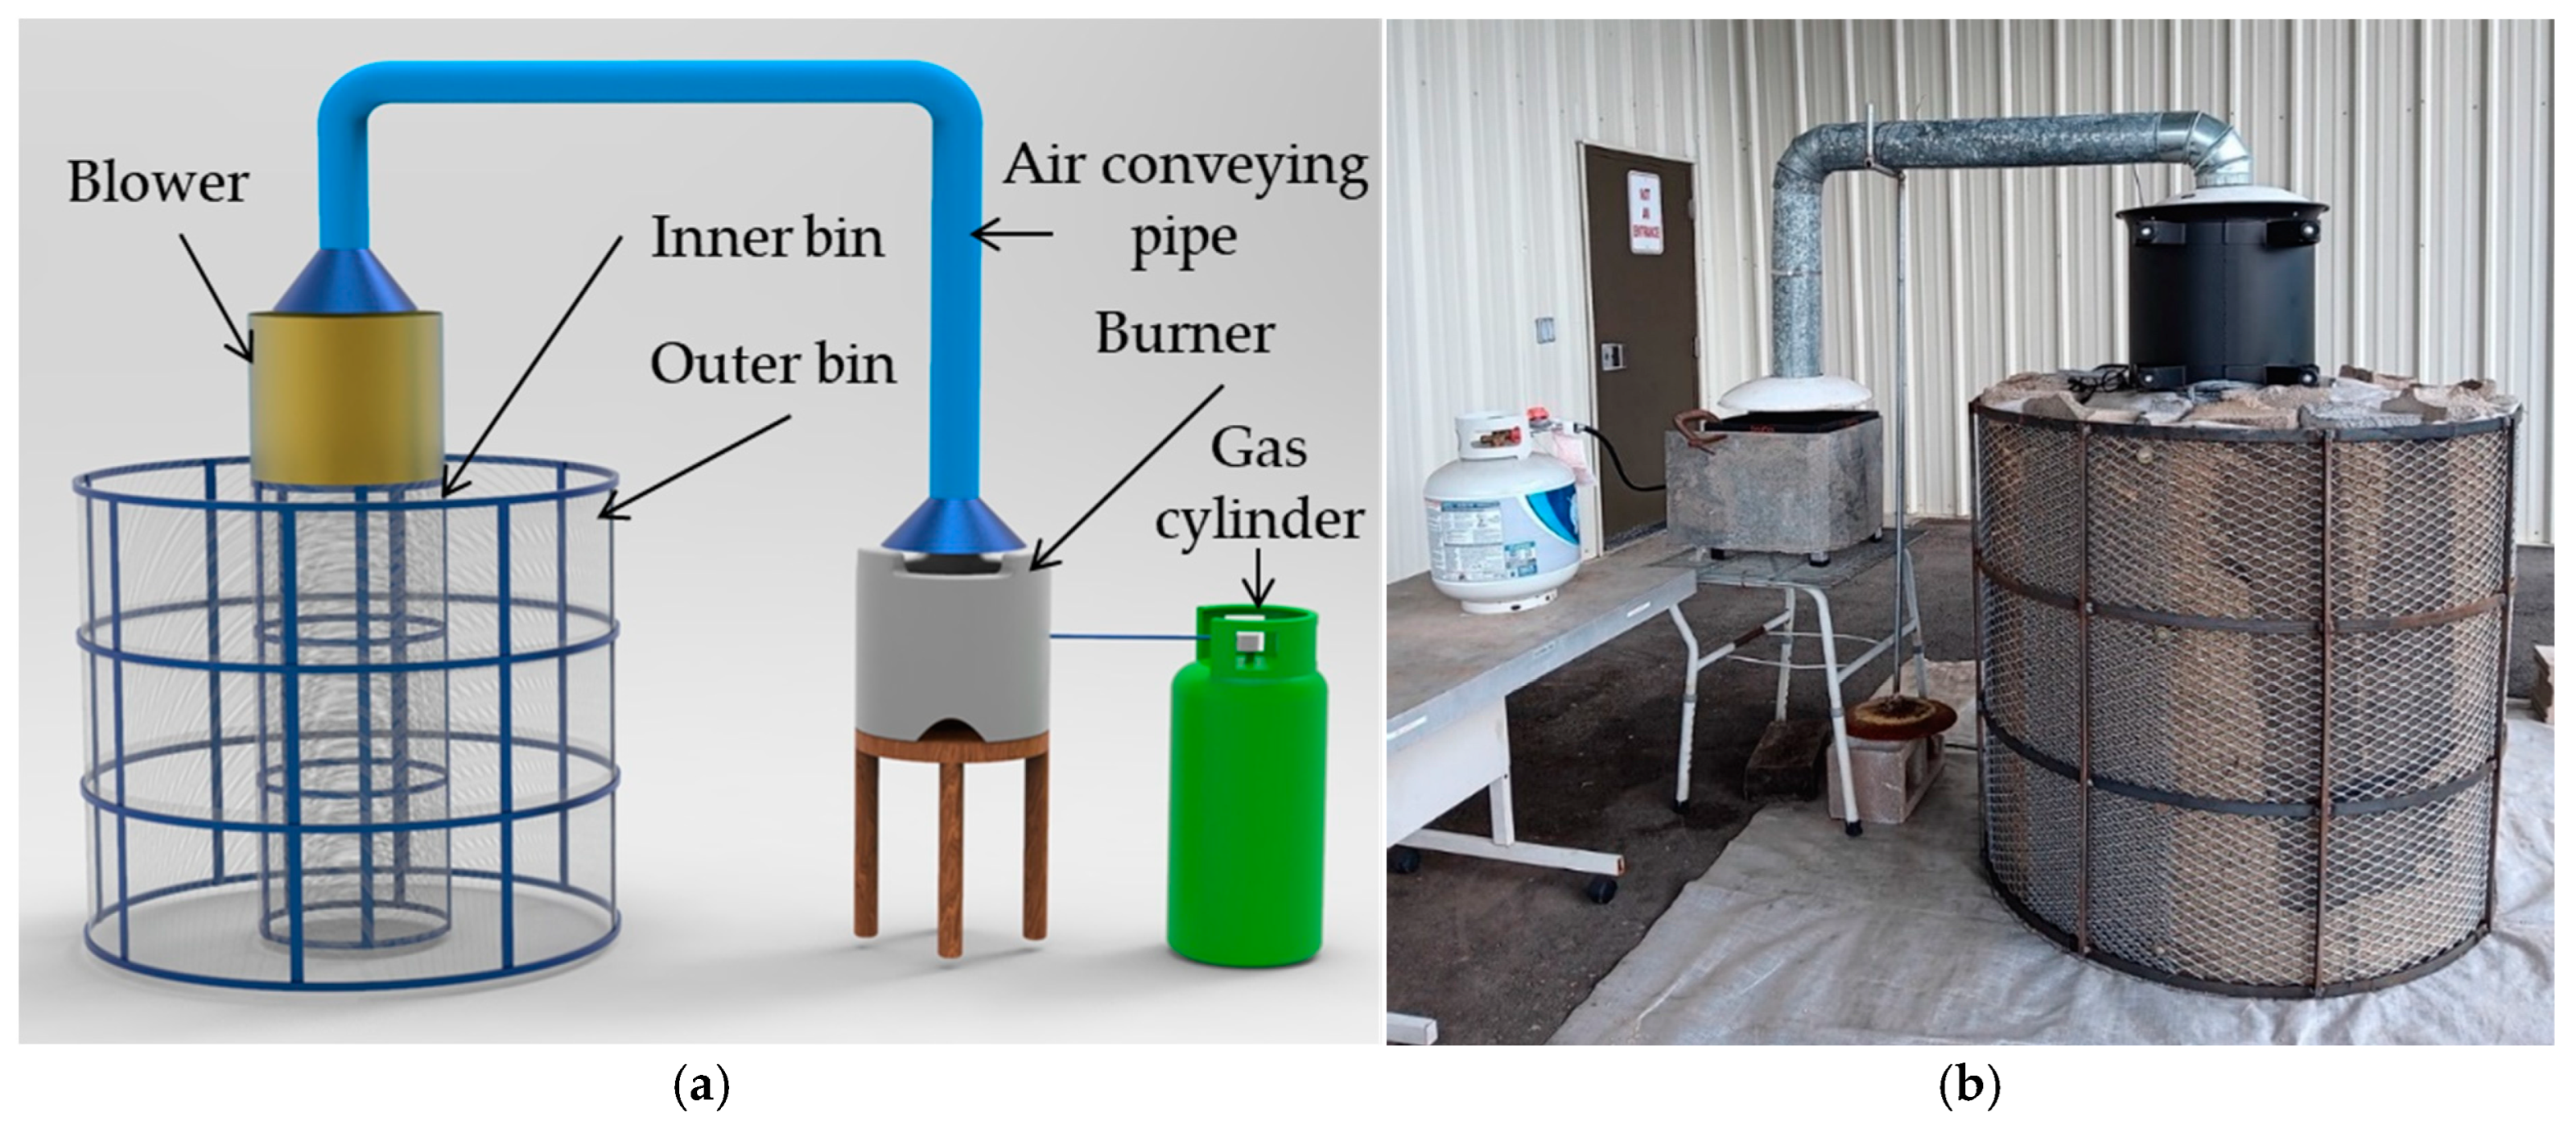
2.1.2. Description of the Dryer

During this study, BAU-STR dryers were fabricated at the University of Arkansas at Pine Bluff (Figure 1) according to the specifications recommended by the Bangladesh Agricultural University. This dryer consists of two homocentric perforated cylinders, namely the inner bin (diameter: 1.12 m; height: 1.14 m) and outer bin (diameter: 0.4 m; height: 1.14 m), an axial-flow blower (model: 16” Ignition Resistant Axial Fan; Manufacturer: Best Value Vacs, Naperville, IL, USA), a cylindrical-shaped hot air conveying pipe (adjustable), and a propane gas burner. Locally available materials were used to construct the inner bin, outer bin, and hot air conveying pipe. The diameter and height of the blower are 16 in. and 22 in., respectively. A 1.1 kW motor powers it, has a maximum RPM of 3300, and can produce an airflow of 120 m3/min. The specifications of the blower complied with those of the original BAU-STR dryer. A locally available propane gas burner (LoCo Cookers 1-Burner; BTU rating: 50,000; maximum fuel consumption rate: 1.2 lb./h) was used as the heating system. This burner is user-friendly and easy to use and controls the air temperature (<43 °C).

2.1.3. Experimental Procedure

At first, the inner and outer bins of the dryer were installed on a concrete floor, keeping uniform space between the bins following the standard procedure described by Saha et al. [21] and filling the space with rough rice. Then, one end of the hot air conveying pipe was set on the top of the inner bin, and the other was put on the gas burner. Later, the gas burner and axial flow blower were put on simultaneously. Grains are very sensitive to drying air temperatures since they have significant effects on seed viability, germination rates, and milling parameters. So, during the drying experiment, the drying air temperature was kept below 43 °C throughout the experiment [4,22]. The moisture content of the rough rice was measured every hour using a handheld digital grain moisture meter (model: HGM68; manufacturer: Omega Engineering, Norwalk, CT, USA; accuracy: ±0.1% moisture content) on a wet basis at three locations in the grain bin (Figure 2). In addition, rice samples were collected simultaneously and then oven-dried to determine the proper moisture. The ambient temperature and relative humidity, drying air temperature, and grain temperature were also measured at five locations in the grain bin every 15 min using a handheld temperature/humidity meter (model: HH414; manufacturer: Omega Engineering, Norwalk, CT, USA; accuracy: ±2.5% relative humidity and ±0.6 °C temperature).

2.1.4. Dryer Performance Parameters

According to Obeng-Akrofi et al. [23], the moisture extraction rate, drying rate, drying efficiency, and energy consumption rate are the predominant parameters for the technical performance evaluation of a mechanical dryer. Those parameters were determined to evaluate the BAU-STR dryer’s effectiveness, cost-effectiveness, and sustainability. The drying time enables farmers or operators to plan their harvesting and post-harvesting activities efficiently, ensuring timely processing and storage of grains. Monitoring the drying rate allows temperature and airflow adjustments to optimize the drying process, thereby reducing energy consumption and minimizing grain spoilage risks. Assessing drying costs helps with budgeting and cost management, which is particularly important for farmers and businesses aiming to maximize profits. Furthermore, the evaluation of drying efficiency aids in identifying potential bottlenecks or inefficiencies in the drying system, facilitating improvements for consistent grain quality and higher throughput. These determinations are essential for ensuring the effectiveness, cost-effectiveness, and sustainability of mechanical grain drying systems.

Moisture Extraction Rate

The moisture extraction rate was calculated using Equation (1).
M E R = W i × M i M f 100 M f × 1 t
where MER is the moisture extraction rate (kg/h), Wi is the mass of wet grain (kg), Mi is the initial moisture content (%, wet basis), Mf is the final moisture content (%, wet basis), and t is the drying time (h).

Drying Rate

The drying rate was calculated using Equation (2).
D R = M i M f t
where Mi is the initial moisture content (%, wet basis), Mf is the final moisture content (%, wet basis), and t is the drying time (h).

Drying Efficiency

The drying efficiency was calculated using Equation (3).
η = W L g E t
where η is the drying efficiency (%), W is the mass of water evaporated (kg), Lg is the latent heat of the evaporation of water (MJkg−1), and Et is the total energy consumption (MJ).

Specific Energy Consumption

The specific energy consumption was calculated using Equation (4), which details the relationship between the total energy input and the moisture removed during the drying process.
S E C = Q t o t a l W w
Q t o t a l = Q s e n s i b l e + Q l a t e n t ;
W w = W i × M i M f 100
Q s e n s i b l e = W i × C r i c e × T + W w × C w a t e r × T
Q l a t e n t = W w × L
where SEC is the specific energy consumption (kJ/kg), Ww is the mass of water removed (kg), Crice is the specific heat capacity of rice (1.69 kJ/kg °C [24]), Cwater is the specific heat capacity of water (4.18 kJ/kg °C), ∆T is the difference between the final and initial temperature of grain, and L is the latent heat of the vaporization of water (2398.8 kJ/kg °C, at 43 °C [25]).

Energy Costs

The total energy costs for drying rice include the fuel energy costs required for heating the drying air and the electric energy costs required for operating the blower. It was calculated using Equation (9).
E t = E f + E e
where Et is the total energy costs, Ef is the fuel energy costs, and Ee is electric energy costs.

Estimation of Fuel Energy Cost

The fuel energy cost was calculated using Equation (10).
E f = M f × t × C f
where Mf is the mass of fuel burnt (kg), t is the total drying time, and Cf is cost of fuel (USD/kg).

Estimation of Electric Energy Cost

The electric energy cost was calculated using Equation (11).
E e = R P η m o t o r × t × C e
where RP is the rated power of the motor (kW), t is the total drying time, and Ce is the cost of electric energy (USD/kWh).

2.2. Economic Performance Study

The economic assessment of the BAU-STR dryer was undertaken from the standpoint of a smallholder rice and maize farmer. By considering the time value of money, this approach guarantees that future cash flows are appropriately valued in terms of the present. This study created a realistic picture of the investment’s prospective profitability and long-term advantages, which is essential for smallholder farmers, who must weigh immediate costs and long-term returns when deciding whether to adopt new agricultural technologies. The findings of this evaluation provide valuable insights into the economic viability of the BAU-STR dryer, guiding farmers’ investment decisions.

2.2.1. Estimation of Cost and Revenue

The cost component of the grain drying system included both fixed and variable costs. The fixed costs included depreciation, interest in machinery investment, taxes, insurance, and shelter. The variable costs were associated with the energy cost, repair and maintenance cost, and labor. Repair and maintenance costs were considered 2% of the purchase price of the drying system.

2.2.2. Economic Parameters

Estimating the net present value (NPV), internal rate of return (IRR), benefit–cost ratio (BCR), and payback period is critical for making investment decisions, optimizing resource allocation, and ensuring a grain drying system’s long-term profitability [17]. These financial parameters are not just important but urgent for farmers or businesses to consider whether the returns from the grain dryer project exceed the initial investment costs. The IRR, for instance, indicates the percentage rate of return expected from the investment, aiding in comparing different investment opportunities and assessing their attractiveness. The BCR evaluates the ratio of the benefits generated by the grain dryer project to its costs, assisting in decision making by quantifying the project’s economic efficiency. In addition, the payback period helps stakeholders understand the project’s risk and liquidity profile by indicating how long it will take for the initial investment to be recouped through cash flows from the grain dryer. These financial factors are essential for directing investment choices, allocating resources as efficiently as possible, and preserving the mechanical grain drying system’s long-term profitability.

Net Present Value (NPV)

The NPV provides a true assessment of an investment’s economic viability. A positive NPV implies that the investment or project is economically viable, whereas a negative one suggests that it is not economically feasible to carry out. The NPV was calculated using Equation (12).
N P V = I + t = 0 N R t 1 + i t + S 1 + i N
where I is the initial investment (cost of dryer), Rt is the cash flow at a specific time (t), S is the salvage value, N is the time (year), and i is the discount rate (%).

Internal Rate of Return (IRR)

The IRR is the discount rate that reduces the net present value of all cash flows from a certain investment to zero. Projects with a greater internal rate of return (IRR) are generally better to pursue. The IRR was calculated using Equation (13).
N P V = t = 0 N R t 1 + I R R t = 0

Benefit–Cost Ratio (BCR)

The BCR is the ratio of the total discounted benefit to the total discounted cost. Projects having a benefit-to-cost ratio higher than one have a positive net benefit because their benefits outweigh their expenses. Higher ratios indicate larger benefits than expenses. The BCR was calculated using Equation (14).
B C R = P r e s e n t   v a l u e   o f   e x p e c t e d   b e n e f i t s   P r e s e n t   v a l u e   o f   e x p e c t e d   c o s t s  

Payback Period (PBP)

The payback period is the number of years required to recoup the original outlay for an investment. It offers a straightforward method for determining the financial viability of investments. The PBP was calculated using Equation (15).
P B P = C o s t   o f   I n v e s t m e n t N e t   A n n u a l   C a s h   I n f l o w

2.2.3. Assumptions for Financial Analysis

The key assumptions underpinning the financial analysis of the dryer are as follows:
  • Cash flows were discounted over five years based on the BAU-STR dryer’s projected usable life.
  • The dryer’s operational period was set to 30 days, reflecting the typical rice cultivation season in the USA. This dryer also has the potential to be used for drying corn. The financial analysis considered the yearly use of 240 h, 480 h, and 720 h, which could vary depending on the harvesting season and number of crops. A discount rate of 5.75%, which corresponded to the USA discount rate of December 2023, was used for the financial analysis.
  • The farmer will operate the dryer him/herself, so no labor cost was considered for its operation.
  • Repair and maintenance costs were considered as 2% of the investment costs of the drying system.

2.2.4. Economic Sensitivity Analysis of the BAU-STR Dryer

The sensitivity analysis was performed by changing one parameter in the economic model and analyzing the impact on the financial indicators. Such an analysis is required to assess the effects of changes in crucial investment variables on economic indicators. The following essential variables were considered for the sensitivity analysis: (1) labor cost—labor cost is a critical variable in grain drying using a BAU-STR dryer because it influences the drying cost. The study used labor costs varied from 0 to 4 USD/h. These movements were considered based on variable labor costs employed worldwide. (2) Discount rate—one of the essential elements influencing the investment NPV is the discount rate. This analysis used 5%, 7%, 9%, 11%, 13%, 15%, 17%, and 19% discount rates. These movements were based on variable discount rates employed worldwide. And (3) investment costs—the investment cost to construct the BAU-STR dryer was also modified to see how it affected the viability of the case scenario. This was done because it was expected that any investor involved in the production and sale of the BAU-STR dryer would desire to make money by selling the dryer for more money than they had invested. Increases were added to 10%, 20%, 30%, 40%, and 50% of the initial investment cost.

3. Results and Discussion

3.1. Technical Performance Evaluation

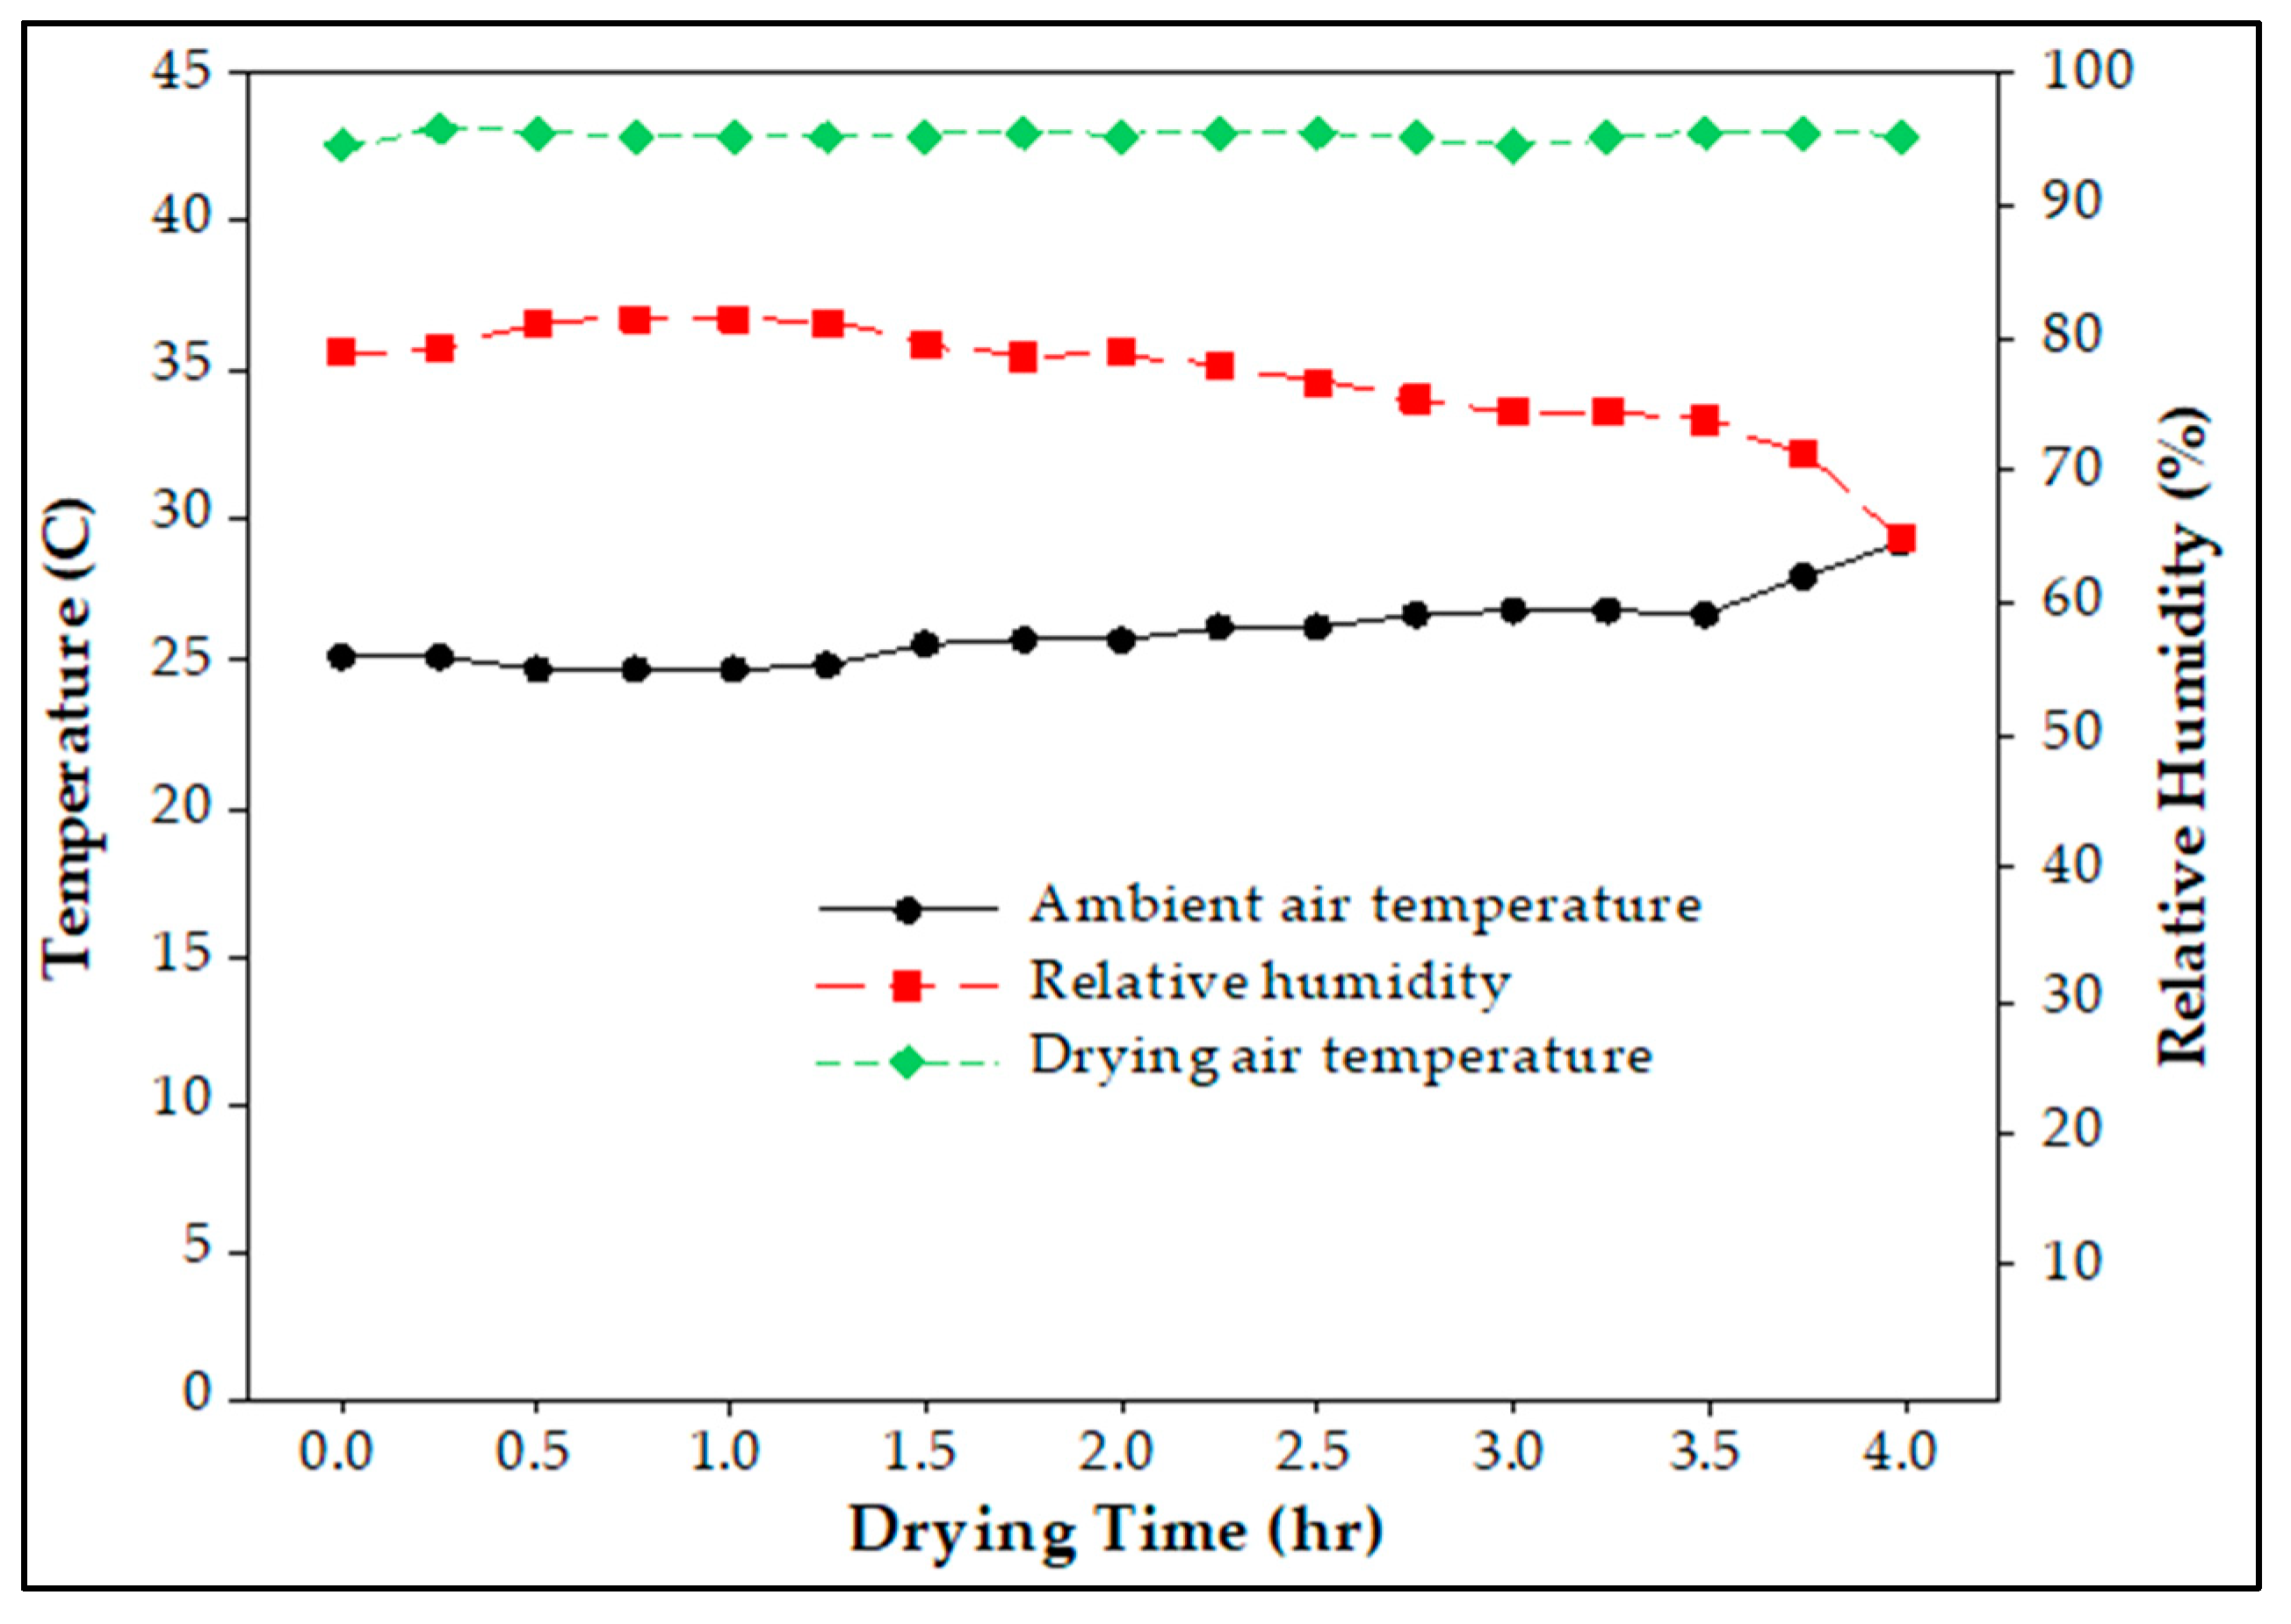
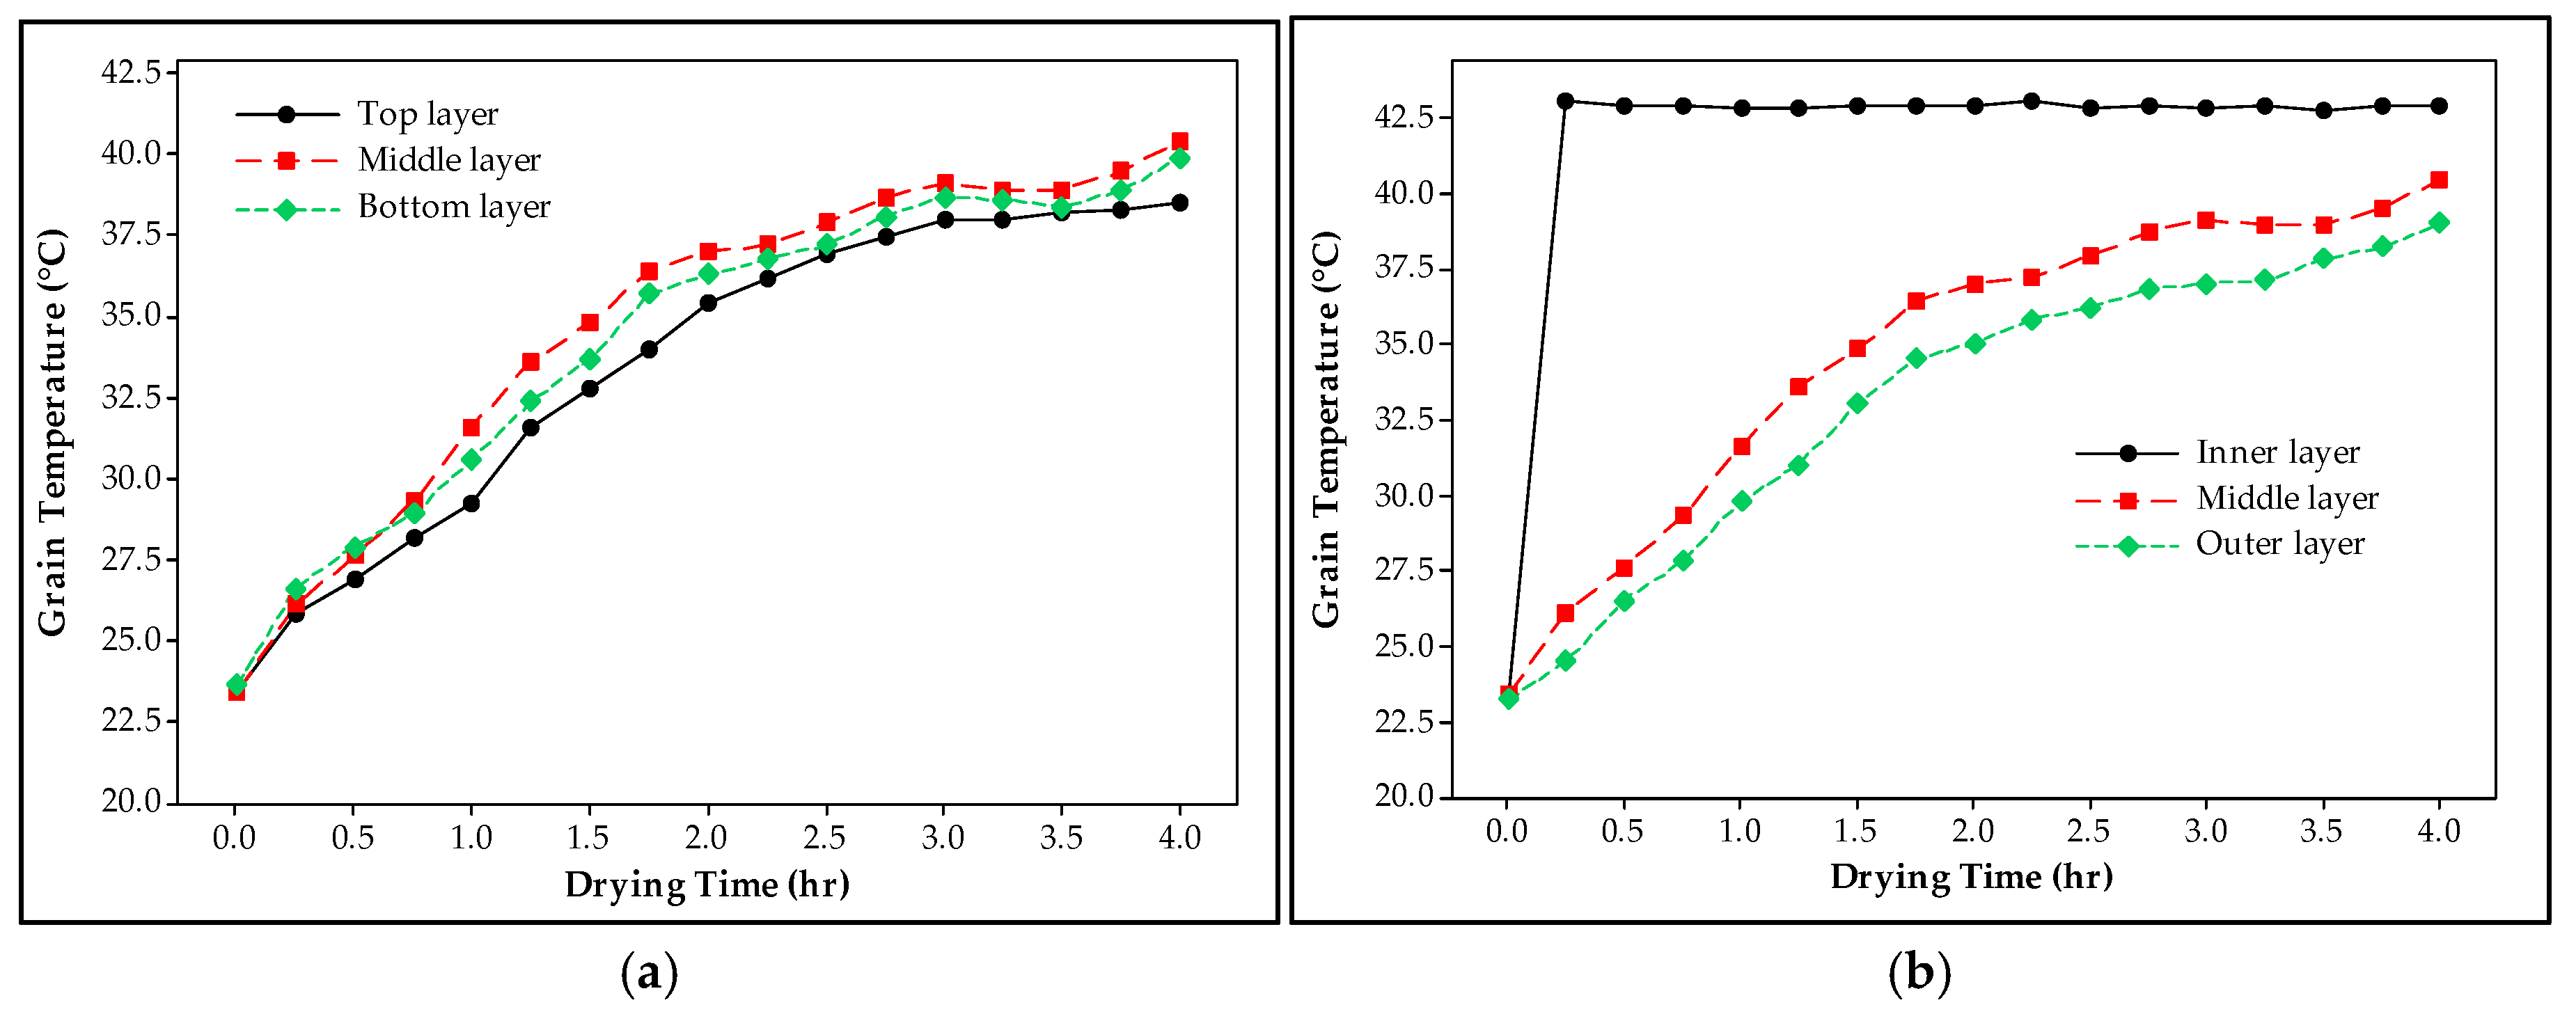
3.1.1. Spatial Temperature Distribution in the Drying Chamber

Three experiments were conducted to evaluate the technical performance of the BAU-STR dryer. Figure 3 shows the variation in drying air temperature in the drying chamber in comparison to the ambient temperature during the drying time. The average drying air and ambient air temperatures were 41.5 ± 0.8 °C and 27.1 ± 0.5 °C, respectively. The mean drying air temperature was 14.4 °C higher than the ambient air temperature.
In addition, the spatial distribution of the drying air temperature through the longitudinal and lateral directions in the grain bin of the newly fabricated BAU-STR dryer at UAPB during the grain drying time is shown in Figure 4. The temperature distribution in the longitudinal direction could be understood by TTop, TMiddle, and TBottom and that in the lateral direction could be understood by TInner, TMiddle, and TOuter. Referring to Figure 4a, the temperature distribution in the longitudinal direction was generally similar, but a higher temperature was observed at TMiddle compared to that at TTop and TBottom. This can be explained by airflow dynamics and heat transfer within the grain bin. In this drying system, the fan directs drying air into the bin from the top (Figure 2a), and the middle section may receive more concentrated airflow, resulting in greater heat retention. However, further study is needed to analyze the distribution of airflow and heat transfer inside the drying bin to fully explain why the temperature of the middle grain layer is higher than that of the lower and upper layers. Furthermore, there is a significant difference at each location in the lateral direction (Figure 4b). This variation in temperature at different locations in the lateral direction at the initial drying stage was due to the variation in lateral distances from the center of the inner bin to the specific location. It was observed that during the first 30 min of drying, only the temperature of the inner layer increased rapidly as it was the closest point to the inner bin. However, after 2 h of drying, the temperature at every measuring location in the bin tended to become almost equal, exhibiting uniform temperature distribution throughout the drying period, which aligned with the observations made by Alam et al. [7] and Saha et al. [14].

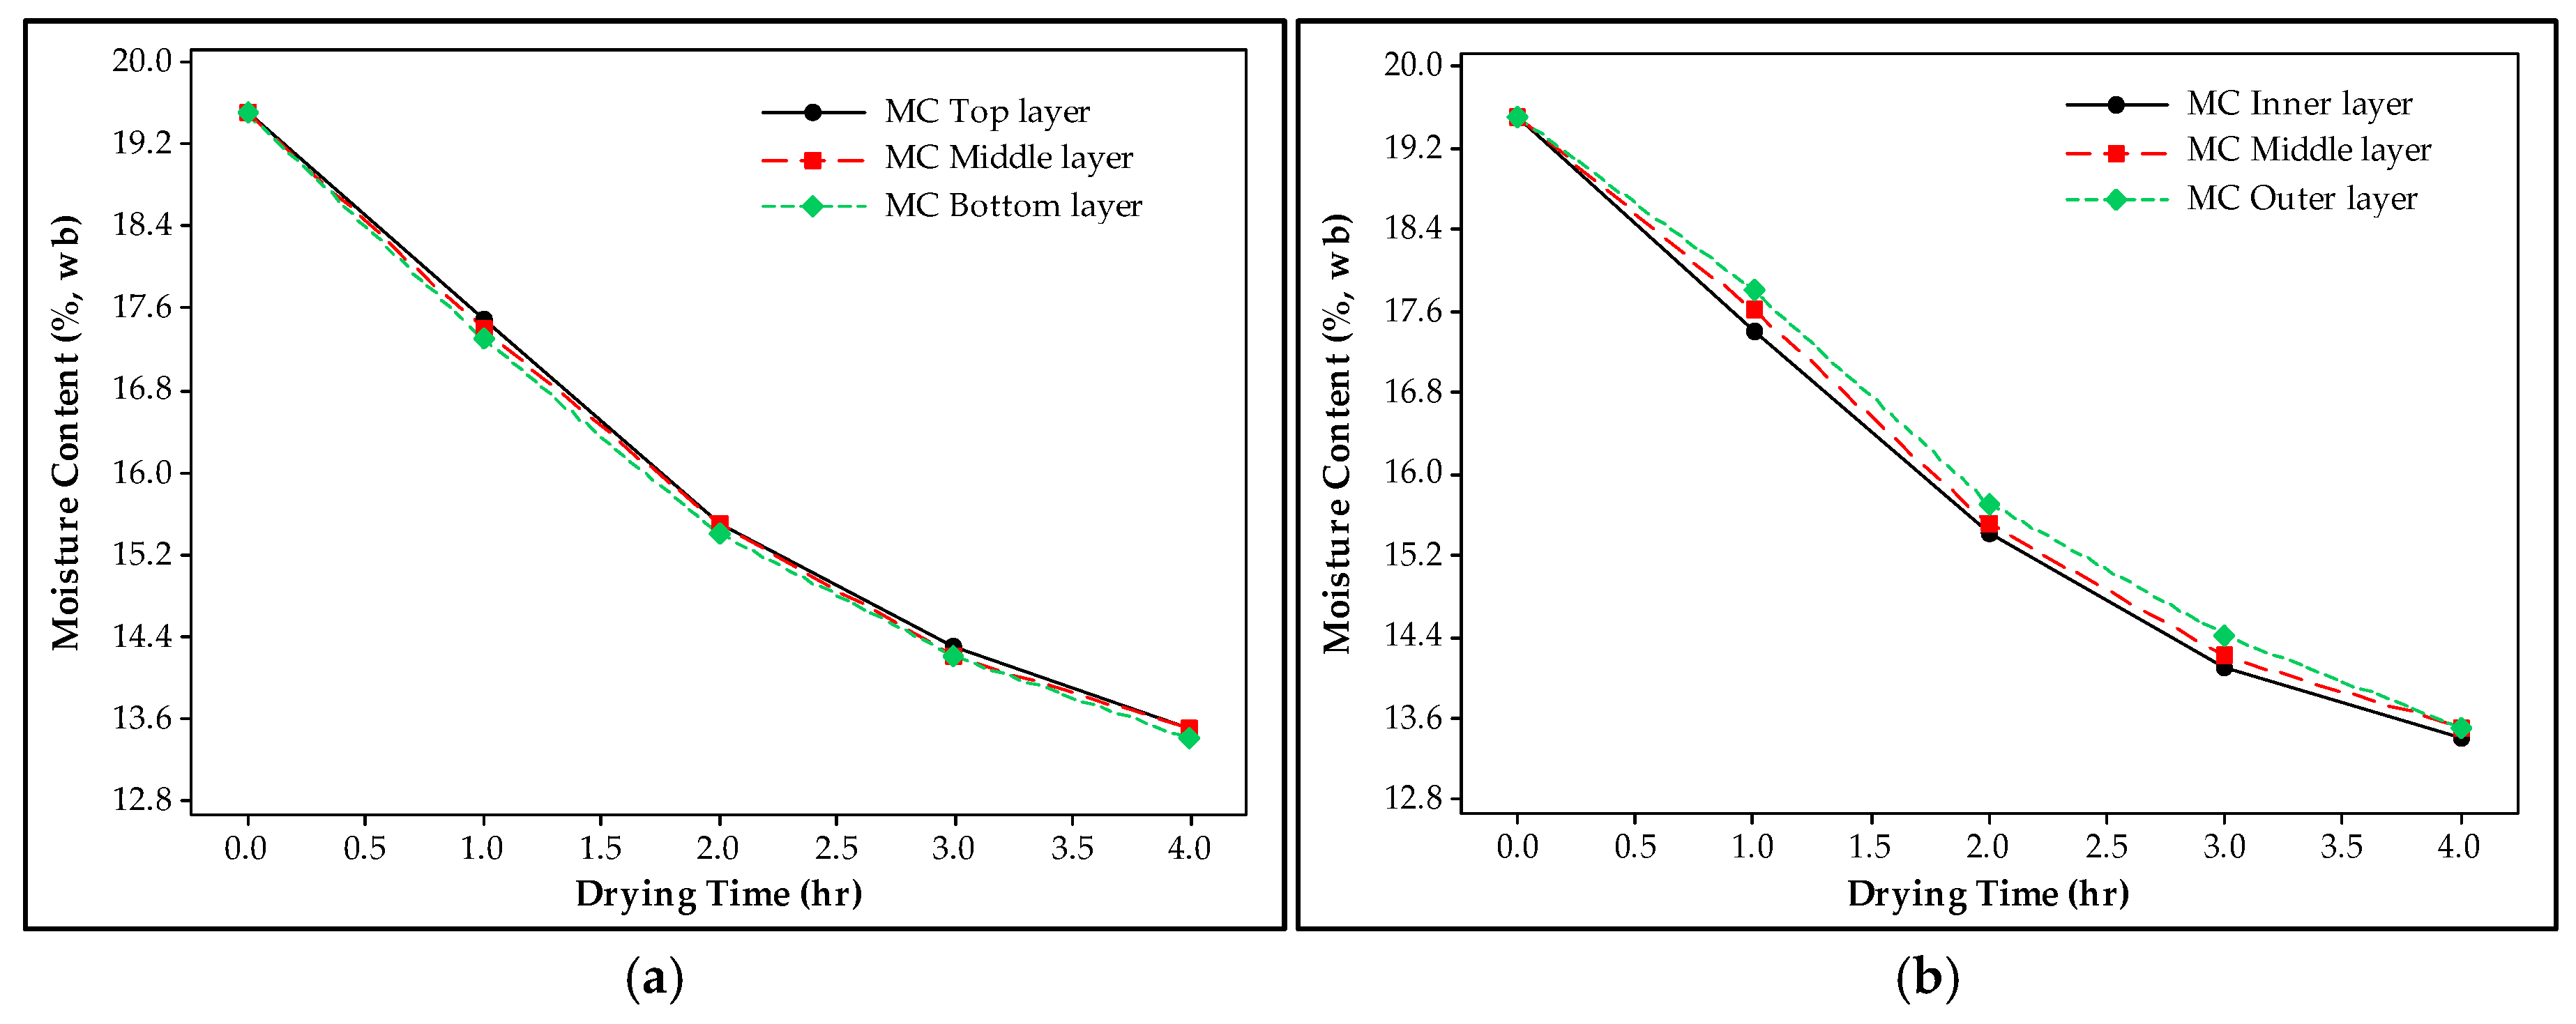
3.1.2. Moisture Gradients Within the Drying Chamber and Drying Rate Analysis

The variation in grain moisture content at three different locations in the drying chamber over the drying period is shown in Figure 5. The moisture distribution in the longitudinal direction was represented by MTop, MMiddle, and MBottom, while the lateral distribution was represented by MInner, MMiddle, and MOuter. From Figure 5, it is observed that the moisture distribution in the longitudinal direction was fairly uniform (<0.1%), but a significant difference (around 0.2%) was observed at different locations in the lateral direction. In addition, the dynamics of moisture removal and the drying rate at which moisture was extracted from the grain are illustrated in Figure 6. The moisture content curve shows a clear decline over time, with an initial rapid drop due to the large moisture gradient between the grain and the drying environment. As drying progressed, the rate of moisture loss decreased as the grain approached equilibrium with its surroundings. The drying rate was highest in the early stages, as indicated by the steep slope of the curve, but gradually decreased as less moisture became available for evaporation, reflecting the typical falling rate drying period, which aligned with the common drying rate phenomenon of agricultural products [26].
The gradient of moisture content between the inner layer and outer layer of the grain bin was very high at the initial drying period because of the different horizontal distances from the center line of the inner bin. The moisture gradient decreased with time and, finally, reached the same level in all sections of the grain bin. The required time varied with the initial moisture content of the paddy. This drying pattern supported the previous work on BAU-STR dryers [20].

3.1.3. BAU-STR Dryer Efficiency and Performance Metrics

The BAU-STR dryer’s technical performance data are shown in Table 1. The average drying air temperature was 41.5 ± 0.8 °C, less than the recommended drying air temperature for rice, i.e., 43 °C [4]. The average moisture removal rate was observed to be 1.5% MC/h, which was slightly less than the value reported by Saha et al. [14]. A possible reason for this reduced drying rate is that the grains had a lower initial moisture content compared to those in the previous study. This supports the statement that high initial grain moisture content leads to a higher average rate of moisture removal, whereas lower moisture content results in a reduced rate [27]. However, the drying efficiency was 75.1 ± 2.3%, which was significantly higher than that of the previous version. This improvement was due to lower energy consumption compared to that in the study reported by Saha et al. [14]. In this research, propane (with a heating value of 50.3 MJ/kg) was used as the heat source instead of LPG (with a heating value of 46.1 MJ/kg) employed in the previous study. Additionally, the gas burner used in this study was more efficient than the one used in earlier research [14]. Again, the drying capacity was also higher than that of the earlier version, but the average drying time was the same [12].

3.2. Economic Performance Evaluation

3.2.1. Financial Performance Evaluation Considerations

The technical and financial parameters considered for the economic analysis of the BAU-STR dryer are shown in Table 2. The average harvesting period of rice is 30 days (from mid-September to October) in Arkansas, USA. Therefore, the potential use of a BAU-STR dryer for drying rough rice is 240 h. (considering an average operation of 10 h per day and six days a week). The fabrication cost of the BAU-STR dryer at UAPB was USD 700. Hence, the financial analysis of the dryer was conducted using the fabrication cost value. While calculating drying cost, the economic life of the dryer and its parts were assumed to be five years and ten years for the blower in all cases. A bank interest rate of 5.75% was considered, according to the USDA December 2023 report. A farmer can operate the BAU-STR dryer by him/herself along with other activities or hire a person. So, the financial analysis of the BAU-STR dryer was performed in both cases to identify the most suitable business model.

3.2.2. Analysis of Cost and Return on Investment

The initial investment cost for the complete drying system is shown in Table 3, and the costs associated with the operation and maintenance of the dryer are presented in Table 4. Two percent of the investment cost was considered as the repair and maintenance cost of the dryer. The fuel and electrical energy costs were calculated by considering the cost of propane gas and electricity as 1.28 USD/kg and 0.17 USD/kWh, respectively, according to the market price. From Table 4, it is observed that the hourly energy consumption cost is also minimal for a BAU-STR dryer, which aligned with the justification made by de Oliveira et al. [16].

3.2.3. Economic Assessment of the Business Model

A positive NPV, an IRR higher than the present discount rate (5.75%), a BCR value greater than 1, and a low payback period were targeted for this financial analysis. The results obtained from this financial analysis are presented in Table 5. The economic analysis resulted in a drying cost, NPV, IRR, BCR and PBP of USD 0.96 per 100 kg of grain, USD 3018, 135%, 3.0, and 0.73 yr., respectively, if the annual use of the dryer was 240 h. If annual use of the dryer changed to 480 h, the resultant drying cost, NPV, IRR, BCR, and PBP were USD 0.77 per 100 kg of grain, USD 6790, 275%, 4.0, and 0.36 yr., respectively. When the annual use of the dryer changed to 720 h, the resultant drying cost, NPV, IRR, BCR, and PBP were USD 0.71 per 100 kg of grain, USD 10562, 413%, 4.5 and 0.24 yr., respectively. A positive NPV, an IRR greater than the discount rate, a BCR higher than one, and a lower payback period can be achieved with an annual use of the dryer for 240 h, 480 h, or 720 h. In addition, the drying costs can be lower if the dryer’s yearly usage increases. Therefore, the average drying cost of rice would be about USD 0.96 per 100 kg of grain when using the BAU-STR dryer, lower than the existing drying fee of (USD 2.2) in the USA [28].

3.2.4. Sensitivity Analysis

To examine the effects of the variable labor cost, discount rate, and initial investment cost on the dryer’s economic parameters, a sensitivity analysis was performed by changing one parameter in the economic model and analyzing the impact on the financial indicators.
First, the effect of the labor cost (for operating the dryer) on the economic outlook of the current economic model was studied, and the results are shown in Table 6. The results revealed that with an increasing value of labor cost, both the drying costs and PBP value increased, and the NPV, IRR, and BCR decreased regardless of the annual usage, indicating that labor cost significantly influenced the economic model. Therefore, if the farmer operates the dryer by him/herself, he/she could benefit more than the hired operator.
Second, the influence of discount rates on the current economic model was explored and is presented in Table 7. The findings demonstrated that as discount rates rose, the drying costs rose in all three cases of annual usage, but the NPV, IRR, BCR, and PBP remained constant. In addition, if annual the dryer usage increased at a certain discount rate, the drying cost decreased, indicating that both the discount rate and annual usage had significant influences on the economic model.
Third, the effect of increasing dryer prices on economic variables was assessed and are displayed in Table 8. This study analyzed a scenario in which the owner of the BAU-STR dryer must pay 10% to 50% more than the current price (USD 700), and the labor cost and discount rate were set to zero and 5.75%, respectively. The results revealed that drying costs and PBP rose if the purchase price rose, but the NPV, IRR, and BCR decreased. Therefore, variation in the dryer’s purchase price significantly influenced the economic model regardless of the annual usage.

4. Conclusions

The techno-economic performance of a BAU-STR dryer was evaluated successfully. During this study, rice at an average moisture content of 19.5% (wet basis) was dried to a final moisture content of 13.4% (wet basis) within an average drying period of 4.0 h. The average rate of moisture removal was observed to be 1.5%MC/h with a drying efficiency of 75.1%. The economic analysis of this case was evaluated to assess the drying cost and other financial aspects of the use of a BAU-STR dryer for drying rice under different labor costs, discount rates, annual usages, and the purchase prices of the dryer. An initial economic model was developed using the current price of a BAU-STR dryer, zero labor cost for operation (the farmer will operate his/her dryer), a discount rate of 5.75% over a projected life span of 5 years for the drying system, ten years for the blower, and three annual usage hours, i.e., 240 h, 480 h, and 720 h. The economic analysis revealed that a higher NPV, IRR, and BCR, and a lower payback period and drying cost could be achieved with any annual use of the dryer. In addition, the drying costs could be lower if the dryer’s yearly usage increased. A further sensitivity analysis revealed that with an increasing labor cost and higher purchase price, both the drying costs and PBP value increased, but the NPV, IRR, and BCR decreased regardless of the annual usages. Moreover, if the discount rate rose, the drying costs rose insignificantly, but the NPV, IRR, BCR, and PBP remained constant. Finally, the positive performance indicators provided the confidence to scale-up the BAU-STR dryer among the underserved rice/corn grower communities in the world, which can ultimately play a key role in postharvest food loss and waste.

Author Contributions

The following authors contributed to the work: conceptualization, S.I. and A.M.; methodology, M.H.I.; software, M.H.I.; formal analysis, M.H.I.; investigation, M.H.I.; resources, S.I.; writing—original draft preparation, M.H.I.; writing—review and editing, M.H.I., S.I., C.K.S. and M.M.A.; visualization, M.H.I.; supervision, S.I.; project administration, S.I. and M.M.A.; funding acquisition, S.I. and M.M.A. All authors have read and agreed to the published version of the manuscript.

Funding

This publication was made possible through support provided by USAID, through the LASER PULSE Program led by Purdue University, and through the University of Arkansas at Pine Bluff, USA. Grant number: GR017633.

Institutional Review Board Statement

Not applicable.

Informed Consent Statement

Not applicable.

Data Availability Statement

Data will be made available on request.

Conflicts of Interest

The authors declare no conflicts of interest.

References

  1. FAO. The State of Food and Agriculture 2020. Overcoming Water Challenges in Agriculture; FAO: Rome, Italy, 2020. [Google Scholar] [CrossRef]
  2. Sheahan, M.; Barrett, C.B. Review: Food loss and waste in Sub-Saharan Africa. Food Policy 2017, 70, 1–12. [Google Scholar] [CrossRef] [PubMed]
  3. Kumar, D.; Kalita, P. Reducing Postharvest Losses during Storage of Grain Crops to Strengthen Food Security in Developing Countries. Foods 2017, 6, 8. [Google Scholar] [CrossRef] [PubMed]
  4. Bala, B.K. Drying and Storage of Cereal Grains, 2nd ed.; Wiley-Blackwell: West Sussex, UK, 2016. [Google Scholar]
  5. Magan, N.; Aldred, D. Post-harvest control strategies: Minimizing mycotoxins in the food chain. Int. J. Food Microbiol. 2007, 119, 131–139. [Google Scholar] [CrossRef]
  6. Gong, Y.Y.; Watson, S.; Routledge, M.N. Aflatoxin Exposure and Associated Human Health Effects, a Review of Epidemiological Studies. Food Saf. 2016, 4, 14–27. [Google Scholar] [CrossRef]
  7. Alam, M.A.; Saha, C.K.; Alam, M.M.; Manir, M.R.; Rana, M.M.; Rashid, M.M. BAU-STR Dryer for Rough Rice Dying at Farmers and Small Trader’s Level in Bangladesh. Sci. Technol. Environ. Informatics 2020, 9, 629–638. [Google Scholar] [CrossRef]
  8. Williams, J.H.; Phillips, T.D.; Jolly, P.E.; Stiles, J.K.; Jolly, C.M.; Aggarwal, D. Human aflatoxicosis in developing countries: A review of toxicology, exposure, potential health consequences, and interventions. Am. J. Clin. Nutr. 2004, 80, 1106–1122. [Google Scholar] [CrossRef] [PubMed]
  9. Khan, R. Mycotoxins in food: Occurrence, health implications, and control strategies—A comprehensive review. Toxicon 2024, 248, 108038. [Google Scholar] [CrossRef]
  10. De Groote, H.; Githinji, P.G.; Munya, B.G.; Ricker-Gilbert, J.E. Economics of Open-Air Sun drying in the Maize Value Chain of Kenya. J. Agric. Food Res. 2021, 5, 100185. [Google Scholar] [CrossRef]
  11. Sahay, K.M.; Singh, K.K. Unit Operations of Agricultural Processing; Vikas Publishing House Pvt. Ltd.: New Delhi, India, 1994; pp. 125–135. [Google Scholar]
  12. Kumar, A.; Kumar, S.; Kumar, S. Performance Evaluation of Modified STR Dryer for Drying of Paddy in Process of Reducing Post-Harvest Losses. Int. J. Curr. Microbiol. Appl. Sci. 2018, 7, 2959–2968. [Google Scholar]
  13. Doymaz, I.; Pala, M. The Thin-Layer Drying Characteristics of Corn. J. Food Eng. 2003, 60, 125–130. [Google Scholar] [CrossRef]
  14. Akhtaruzzaman, M.; Sohany, M.; Basunia, M.A.; Hossain, M.K.; Sarker, M.S. Drying and quality features of selected maize varieties dried in commercial processing complexes. Agric. Eng. Int. CIGR J. 2017, 19, 148–155. [Google Scholar]
  15. Alam, M.A.; Saha, C.K.; Alam, M.M. Mechanical Drying of Paddy using BAU-STR Dryer for Reducing Drying Losses in Bangladesh. Progress. Agric. 2019, 30, 42–50. [Google Scholar] [CrossRef]
  16. Chua, K.J.; Chou, S.K. Low-Cost drying Methods for Developing Countries. Trends Food Sci. Technol. 2003, 14, 519–528. [Google Scholar] [CrossRef]
  17. de Oliveira, V.; Santos, R.F.; Rosa, H.A.; de Souza, S.N.M.; Secco, D.; Nogueira, C.E.C. Economic and Financial Analysis of the Implementation of a Water-Tube Boiler in the Process of Grain Drying using A Column Dryer. Afr. J. Agric. Res. 2016, 11, 100–104. [Google Scholar] [CrossRef]
  18. Alam, M.A.; Saha, C.K.; Alam, M.M. Field Performance of BAU-STR Dryer in Rural Area of Bangladesh. Asian J. Poverty Stud. 2017, 3, 170–174. [Google Scholar]
  19. Alam, M.A.; Saha, C.K.; Alam, M.M.; Ashraf, M.A.; Bala, B.K.; Harvey, J. Neural Network Modeling of Drying of Rice in BAU-STR Dryer. Heat Mass Transf. 2018, 54, 3297–3305. [Google Scholar] [CrossRef]
  20. Kumar, V.; Rajak, D.; Kalita, P.; Rausch, K.; Kumar, D. Performance Evaluation of Modified STR Dryer. Int. J. Chem. Stud. 2018, 6, 1915–1918. [Google Scholar]
  21. Saha, C.K.; Alam, M.A.; Alam, M.M.; Winter-Nielsen, A.; Harvey, J. Scope of BAU-STR Dryer in Existing Paddy Drying System of Bangladesh. In Proceedings of the 2018 ASABE Annual International Meeting, Detroit, MI, USA, 29 July–1 August 2018. [Google Scholar] [CrossRef]
  22. Huang, Y.-T.; Wu, W.; Zou, W.-X.; Wu, H.-P.; Cao, D.-D. Drying Temperature Affects Rice Seed Vigor via Gibberellin, Abscisic Acid, and Antioxidant Enzyme Metabolism. J. Zhejiang Univ. B 2020, 21, 796–810. [Google Scholar] [CrossRef]
  23. Obeng-Akrofi, G.; Akowuah, J.O.; Maier, D.E.; Addo, A. Techno-Economic Analysis of a Crossflow Column Dryer for Maize Drying in Ghana. Agriculture 2021, 11, 568. [Google Scholar] [CrossRef]
  24. Iguaz, A.; San Martín, M.B.; Arroqui, C.; Fernandez, T.; Mate, J.I.; Virseda, P. Thermophysical properties of medium grain rough rice (LIDO cultivar) at medium and low temperatures. Eur. Food Res. Technol. 2003, 217, 224–229. [Google Scholar] [CrossRef]
  25. The Engineering ToolBox. Water—Heat of Vaporization vs. Temperature. 2010. Available online: https://www.engineeringtoolbox.com/water-properties-d_1573.html (accessed on 20 May 2024).
  26. Mujumdar, A.S. Handbook of Industrial Drying, 4th ed.; CRC Press: Boca Raton, FL, USA, 2014; p. 154. [Google Scholar] [CrossRef]
  27. Hemhirun, S.; Bunyawanichakul, P. Effect of the initial moisture content of the paddy drying operation for the small community. J. Agric. Eng. 2020, 51, 176–183. [Google Scholar] [CrossRef]
  28. Riceland. Riceland Marketing Program. 24 April 2024. Available online: https://riceland.coop/story-executive-summary-2024-marketing-booklet-690-243569 (accessed on 24 June 2024).
Figure 1. BAU-STR dryer (a) schematic view and (b) pictorial view.
Sustainability 16 09846 g001
Figure 2. Cross-section of the BAU-STR dryer: (a) illustrates the airflow direction and (b) presents the experimental layout (T = temperature sensors, M = moisture sensors, with sensor positions labeled as Top, Middle, Bottom, Inner, and Outer; adapted from Alam et al. [19]).
Sustainability 16 09846 g002
Figure 3. Variation in drying air temperature, ambient temperature, and relative humidity during drying time.
Sustainability 16 09846 g003
Figure 4. Spatial temperature distribution at different locations in the drying chamber; (a) longitudinal direction and (b) lateral direction during drying time.
Sustainability 16 09846 g004
Figure 5. Variation in moisture content of rice at different locations in the drying chamber; (a) longitudinal direction and (b) lateral direction with drying time.
Sustainability 16 09846 g005
Figure 6. Illustration of the relationship between moisture content, drying rate, and drying time during the grain drying process.
Sustainability 16 09846 g006
Table 1. Summary of dryer’s technical performance.
ParameterValue
Initial mass of rice (kg)575.2 ± 4.95
Initial moisture content (%, wet basis)19.5 ± 0.5
Final moisture content (%, wet basis)13.4 ± 0.10
Average drying temperature (°C)41.5 ± 0.8
Average drying time (h)4.0
Average moisture removal rate (kg/h)6.9 ± 0.3
Average drying rate (%MC/h)1.50 ± 0.05
Average drying efficiency (%)75.1 ± 2.3
Specific energy consumption (MJ/kg of moisture)2.98 ± 0.10
Table 2. Technical and financial parameters considered for the business model proposed in this study.
ParameterValue
Capacity of dryer (kg)500
Number of batches per day2
Number of hours required per batch of drying5
Number of operational days per week6
Number of operational hours per week60
Number of operational hours per month *240
Average lifespan of the drying system (years)5
Average lifespan of the axial-flow blower (years)10
* The average rice harvesting period extends to 30 days. If rice or corn is cultivated in multiple seasons in a year, then the number of operational hours will be multiplied by the number of harvesting seasons.
Table 3. Fixed cost of the drying system.
InvestmentValue (USD)
Inner and outer bins, air conveying pipe, and other auxiliary units300.0
Gas burner80.0
Axial-flow Blower320.0
Total fixed cost700.0
Table 4. Operational and maintenance cost of running the drying system.
Variable CostsValue (USD/h)
Maintenance and overhead expenses (2% of investment cost)0.06
Fuel energy cost0.66
Electricity cost0.19
Total variable cost0.91
Table 5. Variation in drying cost per 100 kg of rice, NPV, IRR, BCR, and PBP in relation to annual usage.
Annual Use
(h)
Drying Cost
(USD/100 kg)
NPV
(USD)
IRR
(%)
BCR
(-)
PBP
(Year)
2400.9630181353.00.73
4800.7767902754.00.36
7200.71105624134.50.24
Table 6. Variation in drying cost per 100 kg of rice, NPV, IRR, BCR, and PBP in relation to labor cost and annual usage (Discount rate: 5.75%).
Labor Cost (USD/h)Annual Use (h)Drying Cost
(USD/100 kg)
NPV
(USD)
IRR
(%)
BCR
(-)
PBP
(Year)
0.02400.9630181353.000.73
4800.7967902754.000.36
7200.7110,5624134.500.24
0.52401.3025511172.290.84
4801.1358562402.830.42
7201.0691613623.070.28
1.02401.672084991.850.98
4801.4849232062.190.49
7201.4277613102.330.32
1.52402.031617811.561.19
4801.8439891711.790.59
7201.7763612591.880.39
2.02402.381151621.341.49
4802.1930561361.510.74
7202.1349612071.580.49
2.52402.74684421.182.02
4802.5521221001.310.99
7202.4835601551.360.66
3.02403.10217201.053.17
4802.901188631.151.53
7202.8421601021.191.01
3.52403.45−250−80.959.09
4803.26255201.034.01
7203.20760431.062.56
4.02403.81−1364-0.74-
4803.62−1973-0.80-
7203.55−2582-0.82-
Table 7. Variation in drying cost of rice, NPV, IRR, BCR, and PBP in relation to discount rate and annual usage (Considering labor cost 0).
Discount Rate (%)Annual Use (h)Drying Cost
(US$/100 kg)
NPV
(US$)
IRR
(%)
BCR
(-)
PBP
(Year)
52400.9623711102.570.89
4800.7754962273.430.44
7200.7186213423.850.29
72400.9623711102.570.89
4800.7754962273.430.44
7200.7186213423.850.29
92400.9723711102.570.89
4800.7754962273.430.44
7200.7186213423.850.29
112400.9823711102.570.89
4800.7854962273.430.44
7200.7186213423.850.29
132400.9923711102.570.89
4800.7854962273.430.44
7200.7186213423.850.29
152401.0023711102.570.89
4800.7954962273.430.44
7200.7286213423.850.29
172401.0123711102.570.89
4800.8054962273.430.44
7200.7286213423.850.29
192401.0323711102.570.89
4800.8054962273.430.44
7200.7386213423.850.29
Table 8. Variation of drying cost per 100 kg of rice, NPV, IRR, BCR, and PBP in relation to dryer cost and annual usage (Considering a labor cost of 0 and discount rate of 5.75%).
Investment Cost (USD)Annual Use (h)Drying Cost
(USD/100 kg)
NPV
(USD)
IRR
(%)
BCR
(-)
PBP
(Year)
700 (base cost)2400.9623711102.570.89
4800.7754962273.430.44
7200.7186213423.850.29
770 (10% more)2401.002295992.450.98
4800.7954202063.310.49
7200.7285453113.700.32
840 (20% more)2401.042220902.341.07
4800.8153451883.210,53
7200.7384702853.670.35
910 (30% more)2401.082142822.231.17
4800.8352671733.110.58
7200.7483922623.580.38
980 (40% more)2401.112069752.141.26
4800.8551941613.020.62
7200.7683192433.50.41
1050 (50% more)2401.151993692.061.35
4800.8751181492.940.66
7200.7782432273.430.44
Disclaimer/Publisher’s Note: The statements, opinions and data contained in all publications are solely those of the individual author(s) and contributor(s) and not of MDPI and/or the editor(s). MDPI and/or the editor(s) disclaim responsibility for any injury to people or property resulting from any ideas, methods, instructions or products referred to in the content.

