Abstract
This study examines the impact of changes in temperature and seasonal climate across a 4-year period (2019–2022) and the impact of the existing design on pedestrian activity in the ChiKaHo underground public space in Sapporo, Japan. Using statistical and regression analyses, the study identified boundary temperature ranges for each analyzed point in this space and presented an assumption of the design- and function-related factors influencing the period of use of the ChiKaHo. Each observation point exhibited a unique temperature range of change in pedestrian behavior, from −2 °C (points J1 and J3 near the main transportation station gate and in the corridor, respectively) to +6.8–13.2 °C for points J2 and J4, near open spaces. This research revealed the temperature ranges affecting pedestrian use of underground spaces and that a varying climate has different influences on a particular location. In the future, this can be used as a basis for local design improvements and seasonal adaptation policies to provide a sustainable public underground space in ChiKaHo.
1. Introduction
Public space is an integral part of the urban structure; however, creating a comfortable space for users in a winter city is challenging. Pressman [1] describes the theoretical foundations of a livable winter city, develops approaches for design and policy at the macro and micro levels in a Canadian city, and identifies 10 major factors and research directions for the creation of a livable winter city.
Modern research on winter cities mainly focuses on the relationship between user behavior in the urban environment and climate, that is, soft mobility and the public environment during winter under varying climate conditions, including the perception of Nordic and non-Nordic residents [2].
To examine pedestrian behavior in cold climates [3], the current study used the Universal Thermal Climate Index (UTCI) and compared perceptions of outdoor comfort, which revealed temperature ranges and leading factors as the influence of air and globe temperatures [4].
In Montreal, Canada, research on pedestrian flow was conducted to measure its dependence from climatic factors [5] using data from automatic pedestrian counting. A similar study was carried in Montpelier, Vermont [6], in which the spatial characteristics of North American cities were examined to create a pedestrian-friendly environment in central areas [7].
Numerous studies have focused on thermal pedestrian comfort, including perceptions and pedestrian behaviors on the streets of various cities [8,9,10], as well as thermal comfort range and influence factors [11]. Particular attention was given to the influence of the features of urban morphology (e.g., building height, sky view factor, and orientation) on the perception of outdoor pedestrian thermal comfort in Harbin [12]. In Shenyang, the use of open public spaces during the cold and hot seasons is influenced by the shape of the space. Moreover, weather factors such as sun and wind, and shade to ensure comfort [13], significantly impact the perception of outdoor comfort in open public space [14]. Moreover, studies that examine the influence of the microclimate of a particular place on the behavior of users were conducted with the objective of improving the design of public spaces in Sweden [15]. In China, the cold-region effects of the visual–thermal environment on evaluations of thermal and other comforts in pedestrian streets [16] and the influence of light, thermal, and acoustic comfort on pedestrian’s behavior on the pedestrian streets of Wuhan [17] have been researched for different social groups in city pedestrian streets. The results revealed that the outdoor thermal comfort of users in winter cities exhibited regional characteristics [18].
In cities located in cold climates, underground public spaces are valuable urban resources. This notion is evident in places such as Toronto and Montreal in Canada, as well as Harbin, Beijing, Sapporo, and Helsinki. A review of the use of underground pedestrian spaces highlighted their contribution to the livability of a city [19]. Thus, exploring how the design of underground space can reduce CO2 emissions [20] and forecasting the potential of networks of underground urban spaces for further development are crucial topics [21].
Research has identified the causes and factors of the development of underground pedestrian spaces worldwide, such as climate, land use, metro construction, and the economic environment [22]. For example, Delmastro discussed planning tools [23], management [24], method of assessment toward sustainable development [25], and personnel training [26] as various approaches used in cities such as Helsinki (Vähäaho) [27,28], Montreal (Besner) [29,30], and Sapporo [31].
In Montreal, Dubos-Golain [32] identified the daily patterns of the use of various modes of transportation and found variations based on location, weather, and objective of citizens. The author used data from smart cards.
In Canadian cities, underground pedestrian spaces that connect subway stations and shopping malls act as a means of comfortable movement during winter. Moreover, various studies have conducted analyses and described the underground pedestrian network in Montreal [33,34] and its historical development and policy [35].
Furthermore, methods based on cognitive neuroscience have been systematized to examine human behavior in underground space [36]. Factors such as economic, social, and environmental ones influence the development of these spaces [37]. Thus, a methodology that intends to improve physical connectivity and design optimization in underground spaces has been developed [38].
Design and space assessments using questionnaires [33,39] for Toronto underground space [40] and its future potential [41] were analyzed. The design characteristics of an underground transfer hub were evaluated by exploring the behavior and movement speed of pedestrians [42]. In addition, the interrelationships between pedestrian and transport movement patterns with the urban form were identified, with a focus on inclusion in the design and configuration of the general urban system instead of local space properties only [43]. In Shanghai, the spatial performance of underground public spaces was studied based on temporal pedestrian data and relevant factors [44].
Approaches to research on the dynamics of the pedestrian environment and the underground pedestrian space were conducted by Zacharias [45]. The existing research on underground public space primarily focuses on the analysis of consumer behavior patterns and the attraction of customers to shopping centers [46].
Boisvert [47] formulated a predictive pedestrian model for subway and outdoor spaces using retrospective data from the summers of 1989 and 2004 during the early and middle stages of the development of the underground pedestrian network in Montreal.
Predictive models for new attraction points, such as office spaces or existing pedestrian systems, were proposed, indicating that location significantly impacts pedestrian routes, while the availability of services exerts an unambiguous effect, and the weather conditions do not affect the duration of routes in Montreal [48].
Thus, identifying the influence of local features on pedestrian activities due to the fact that the regional climatic and social aspects, as well as the aspect of urban form, in such studies has an influence.
Previous studies have identified many aspects related to pedestrian behavior in cold-climate cities, such as the perception of space and comfort in open and indoor public spaces, range of thermal comfort for pedestrians in streets, pedestrians’ behavior in open spaces, the influence of climatic factors and microclimates, spatial characteristics, and urban morphology. Other studies have investigated land use, the location of transport nodes and points of interest, and the role that underground public spaces play in reducing CO2 emissions. In addition, studies have analyzed the development potential of underground space networks and predictive models for pedestrian flows. However, a significant gap remains with respect to the perspective of pedestrian flows regarding underground public spaces in cold-climate cities. In particular, the point or range at which pedestrian flow in underground spaces begins to fluctuate in response to temperature changes has not been addressed in prior research. Understanding this factor is crucial for planning seasonal adaptations in the design and usage of public spaces in winter cities such as Sapporo. If the number of visitors to an underground space declines sharply, local businesses struggle to adapt rapidly, leading to a loss of clients and revenue. Consequently, ChiKaHo’s management company faces reduced income that can be spent on maintaining the space, which could lead to its gradual degradation. Sapporo has among the highest urban snowfalls in the world, hitting an average of 4.79 m per year. It aims to become a more compact city to minimize infrastructure maintenance costs. In this context, ChiKaHo is a vital component of public facilities in promoting social and economic interactions and contributing to urban resilience.
This study’s main hypothesis is that changes in pedestrian flow in underground public spaces due to seasonal climate and temperature variations depend significantly on the characteristics of the specific location and, in particular, can be assessed outside peak times (morning and evening). Therefore, this study examines Sapporo’s underground spaces, which are located in unique climatic conditions and possess distinctive social features.
Using a large sample of observations (acquired through automated counting), understanding which temperature changes exert the greatest impact on pedestrian flow is possible, which could enable a more accurate determination compared with surveys on pedestrian sensations in open spaces. However, the extent to which climatic factors influence pedestrian traffic may vary from city to city.
Sapporo, as a cold-climate city, is subject to seasonal influences on the pedestrian use of public spaces. The current study aims to identify the relationship between pedestrian flow and seasonal environmental changes in Sapporo’s underground path during the cold season to make further accurate urban policy decisions that influence the maintenance and development of the public space network in this compact city.
2. Materials and Methods
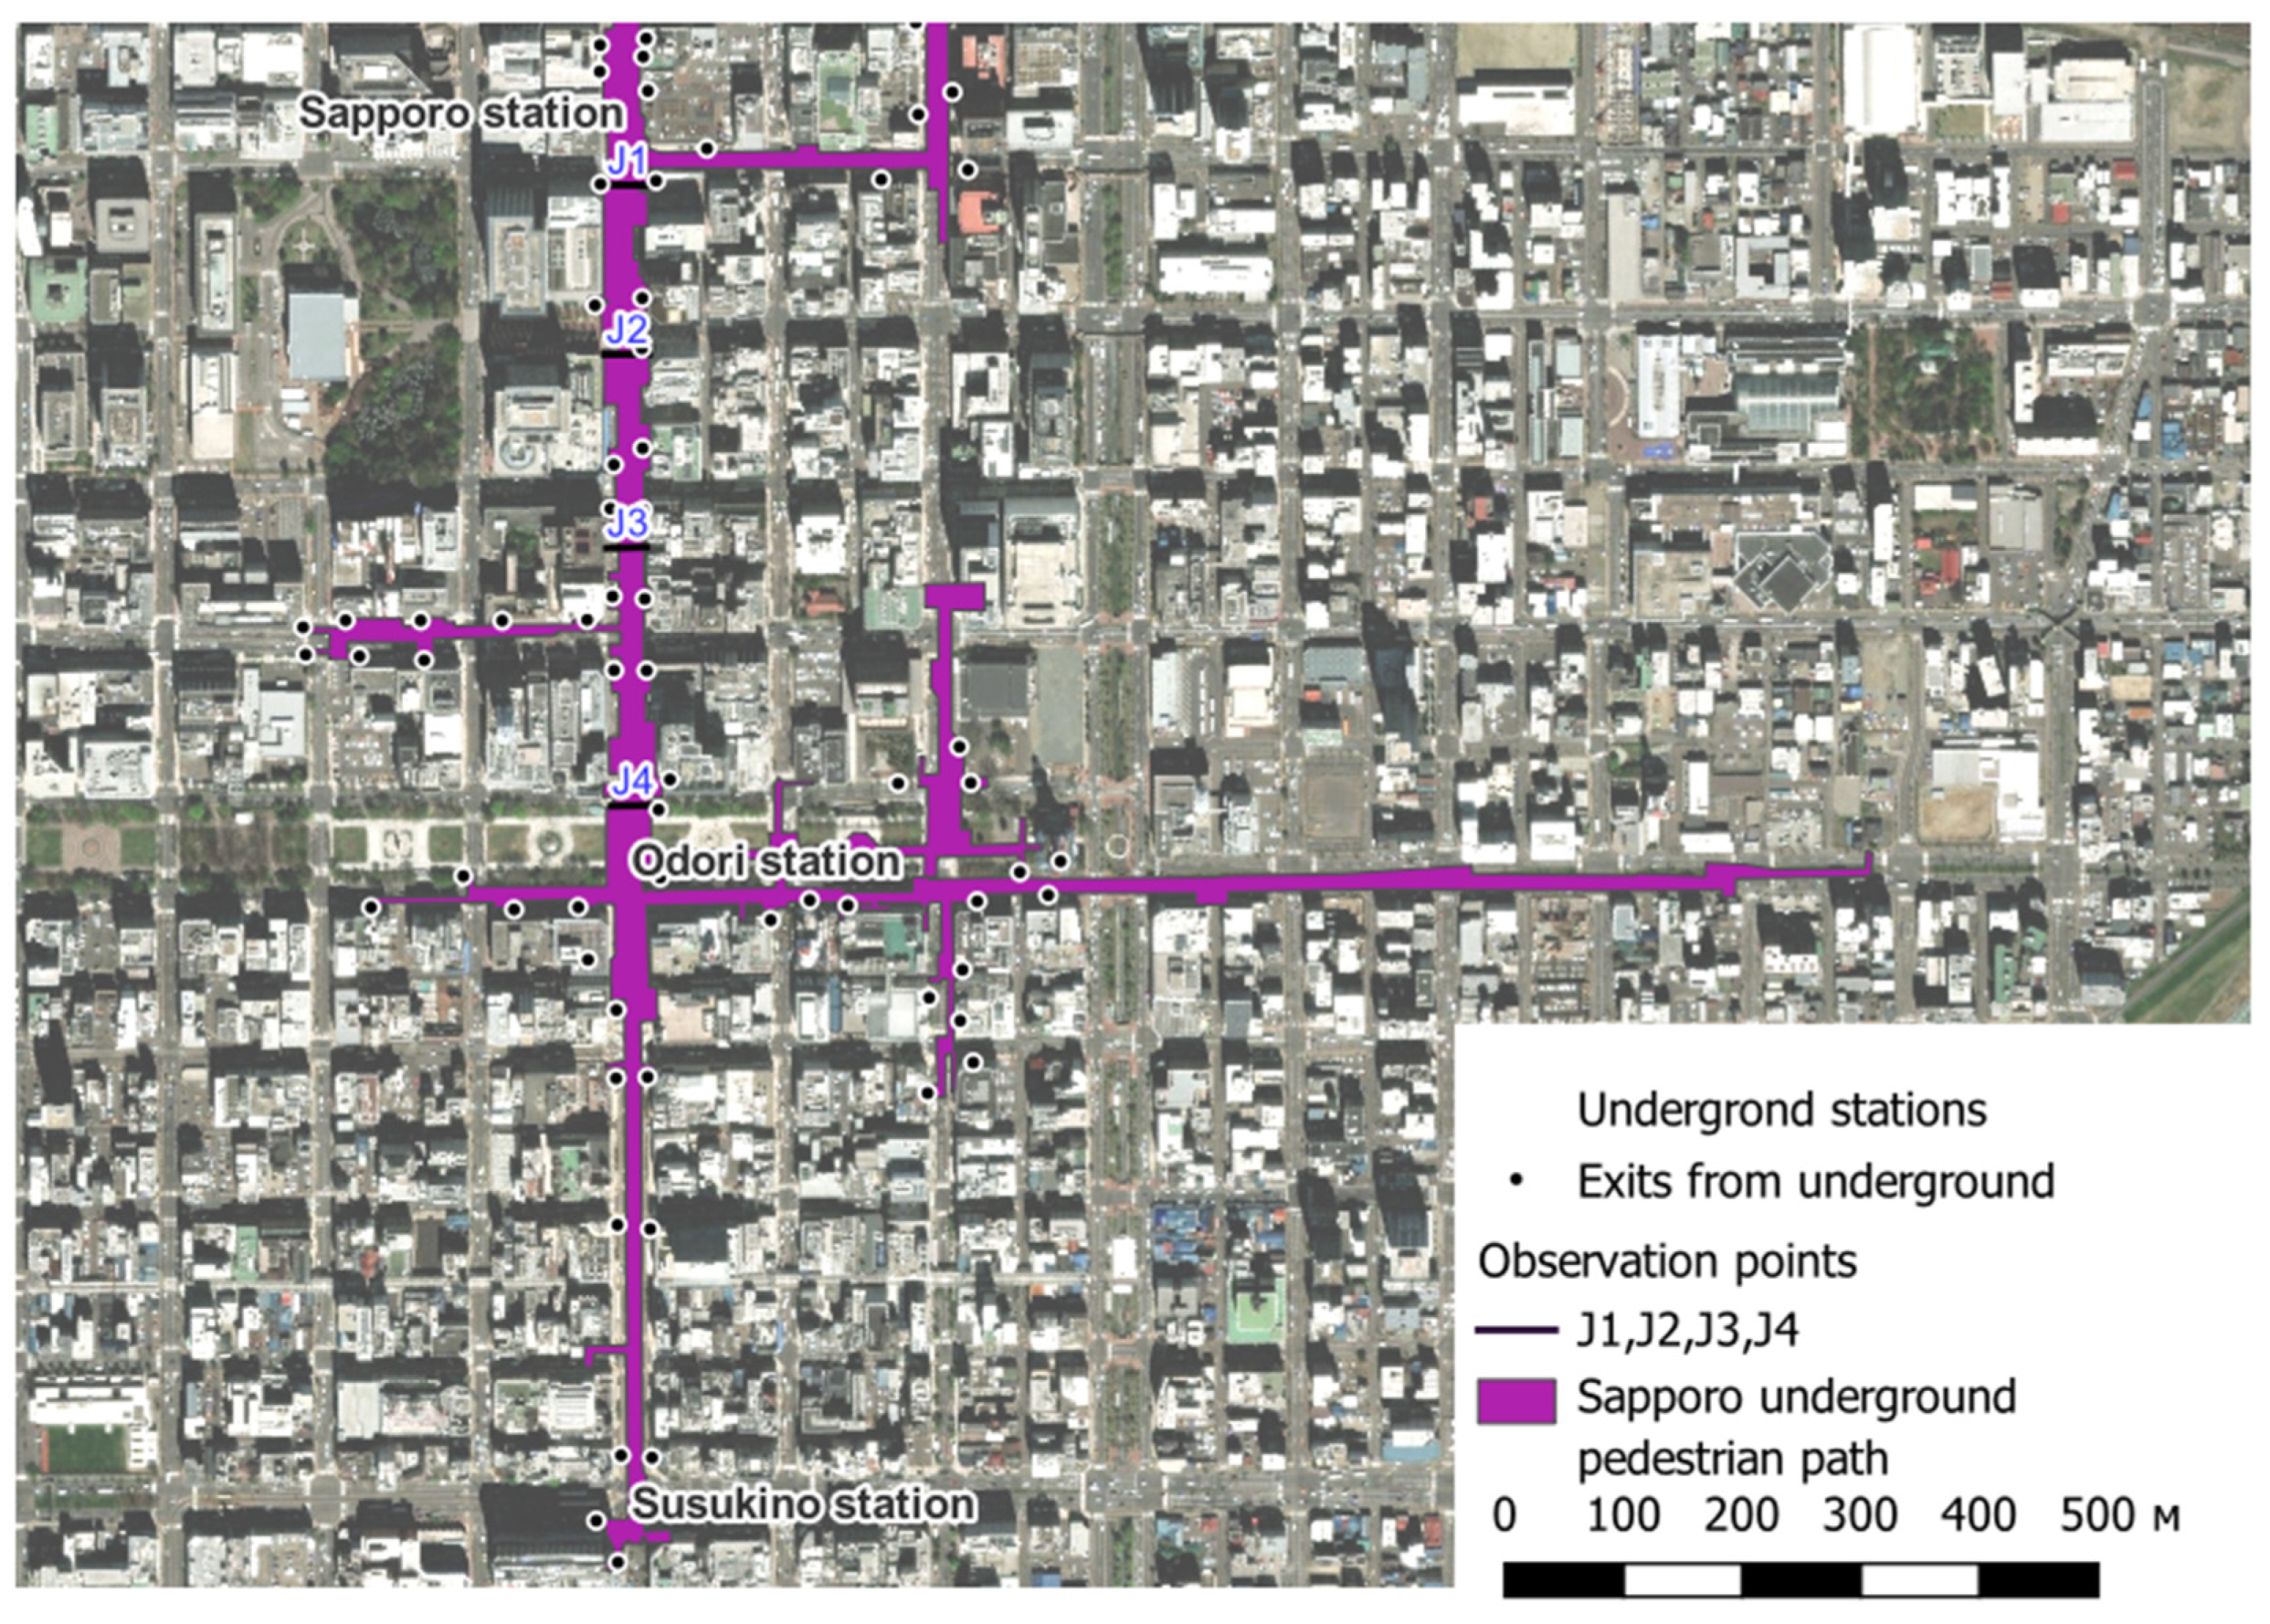
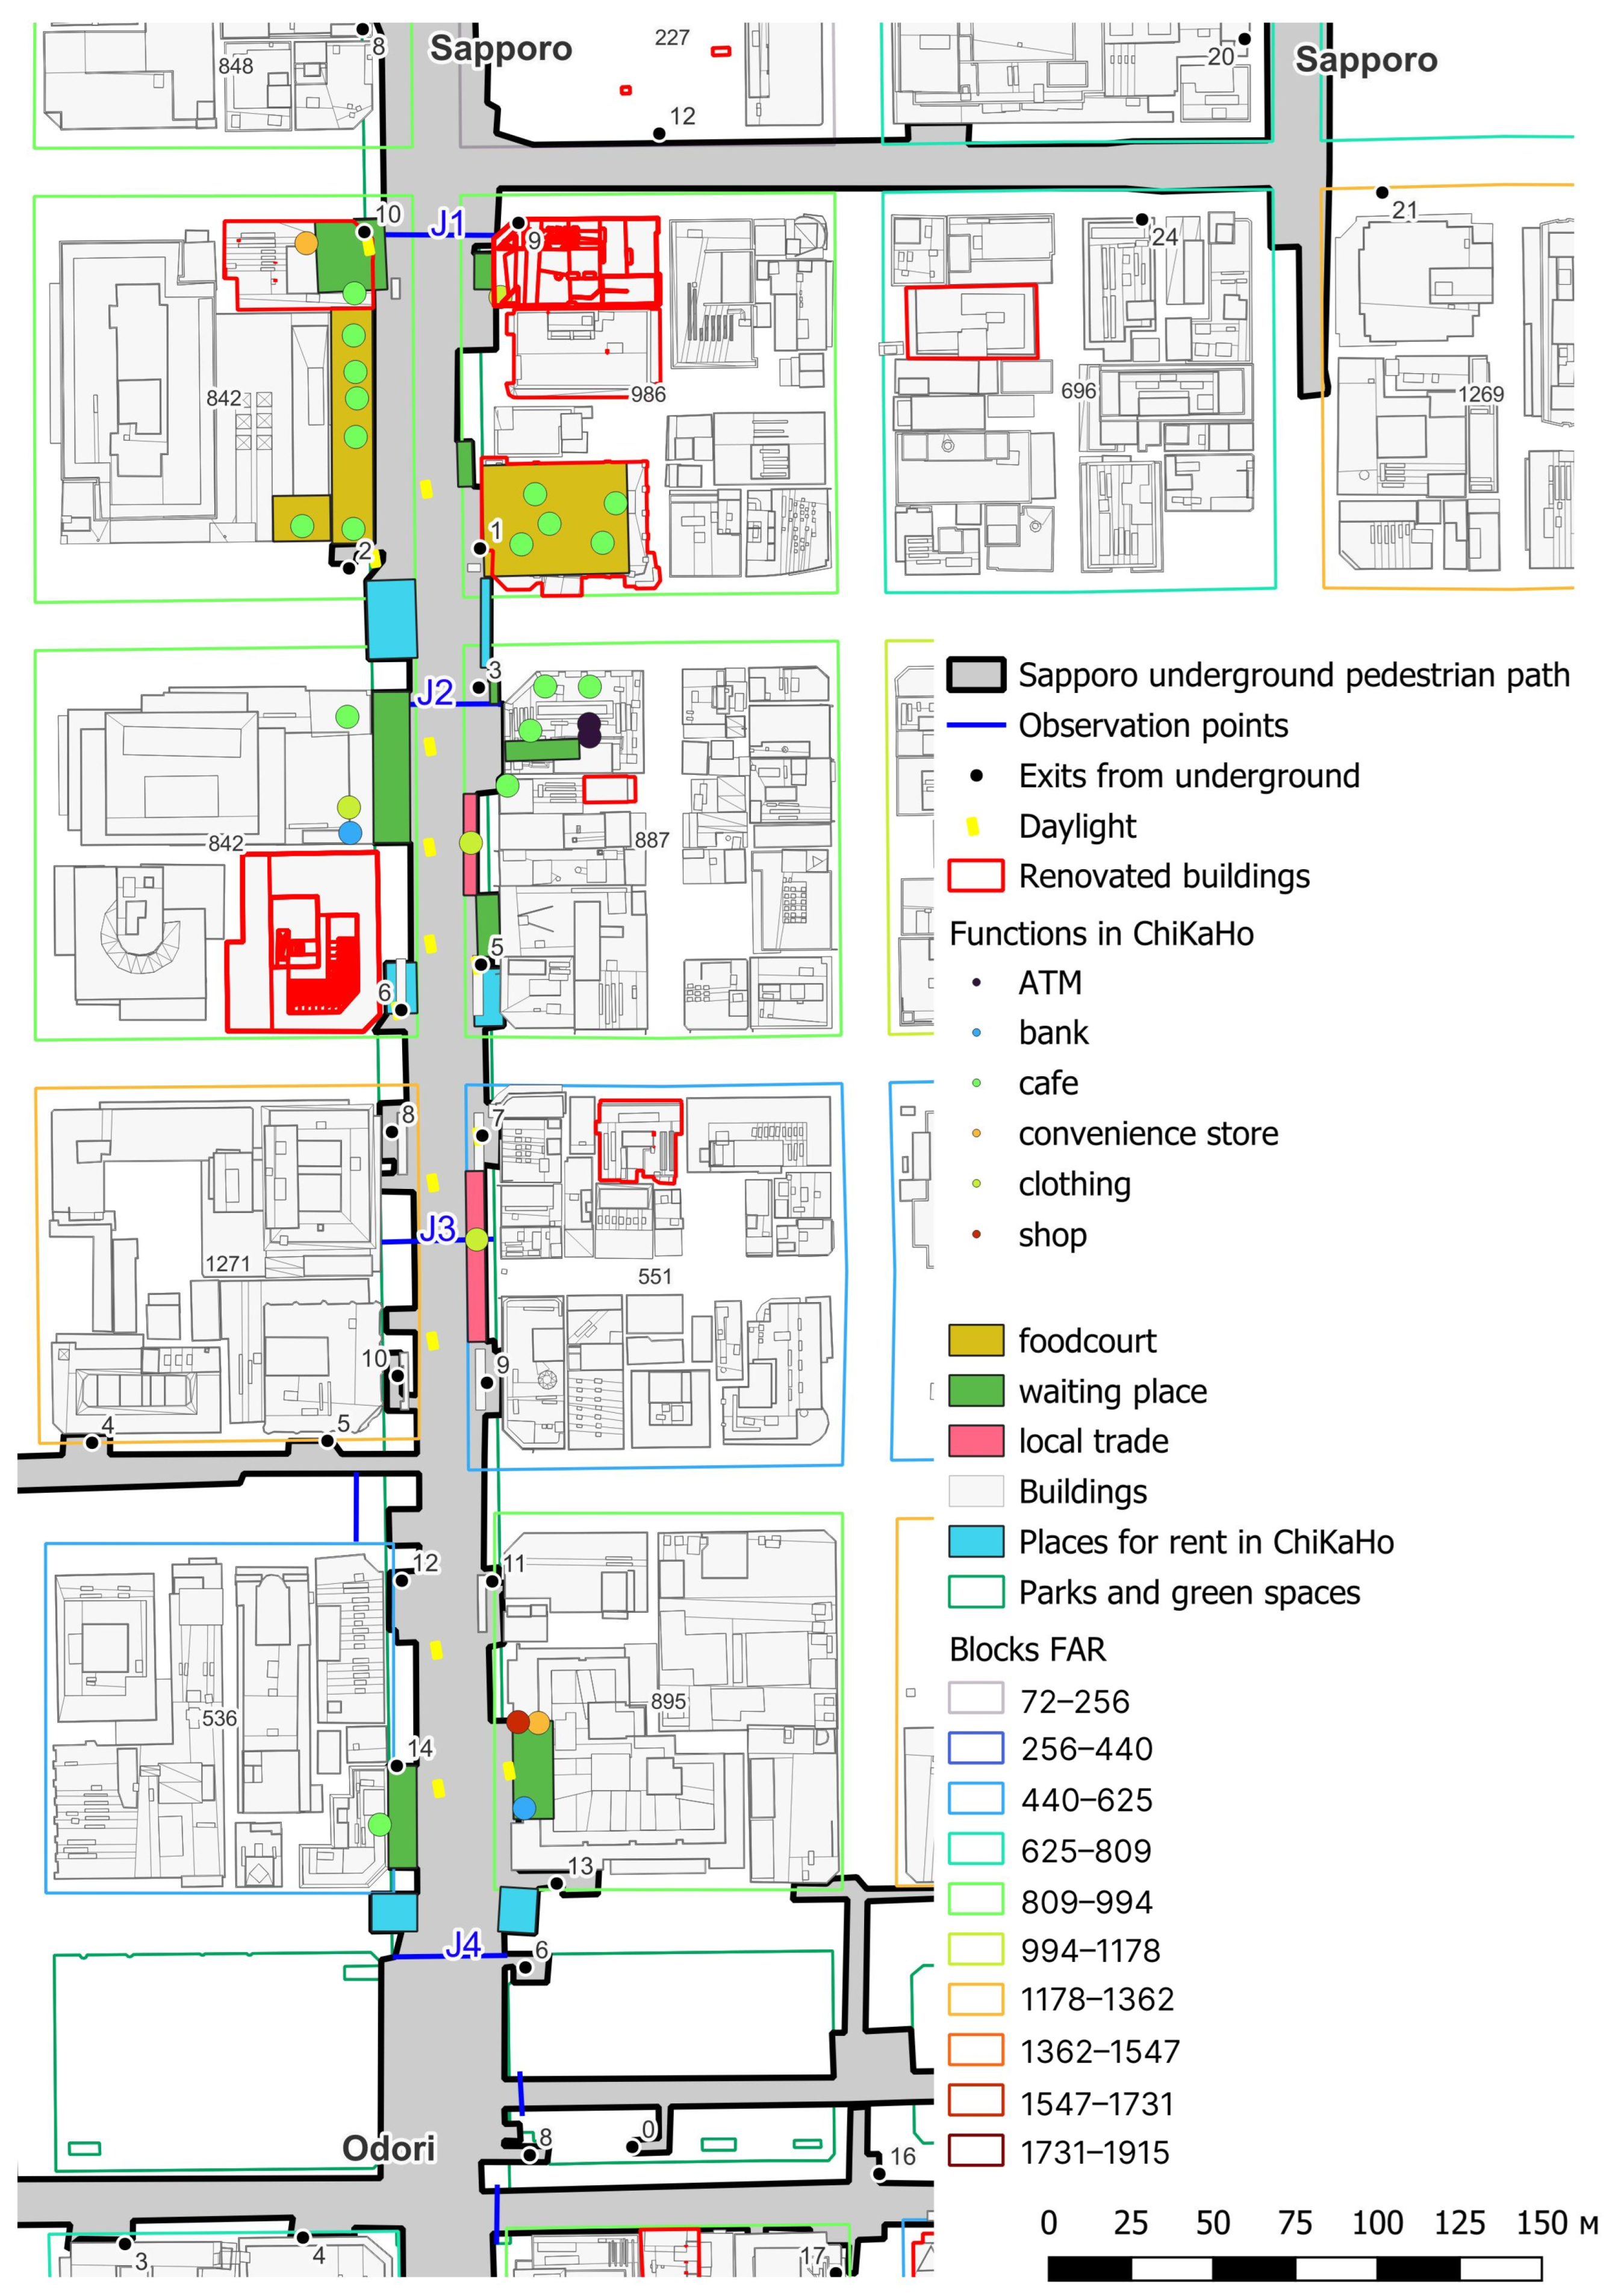
The study was conducted in Sapporo, a city in Hokkaido, Japan. It is located in a cold climate and subject to high levels of precipitation (snow) in winter. In 2011, as part of the Sapporo City Center Revitalization Project [30], the underground pedestrian path ChiKaHo (Figure 1) was built to connect Sapporo and Odori Stations (Odori Park is an open public space with a length of 1625 m). The length of the ChiKaHo underground space is 521 m from point J1 (Sapporo Station) to J4 (Odori); its orientations from the north to south distances between points J1 and J2, between J2 and J3, and between J3 and J4 are 143, 162 m, and 217 m, respectively.

Figure 1.
Map of underground walking space in Sapporo and ChiKaHo.
In the cold and snowy Sapporo city [49], ChiKaHo acts as the main pedestrian artery and underground public space of the study. This study aims to elucidate changes in pedestrian flow in the ChiKaHo, as influenced by seasonal climate and temperature changes.
2.1. Data Collection
Data on pedestrian flow were derived from Hokkaido Open Data Promotion Council [50] and its automated pedestrian counting sensors (Figure 2). These sensors are installed at five locations in the Sapporo Ekimae-dori underground walking space (ChiKaHo). A total of 280 sonic sensors of people flow are divided into five rows (arrays) and installed on the ceiling of ChiKaHo (20 to 70 sensors per row). The number of people passing directly under each array is separately measured according to the direction of traffic (northbound, toward Sapporo Station/southbound, and toward Odori Station).
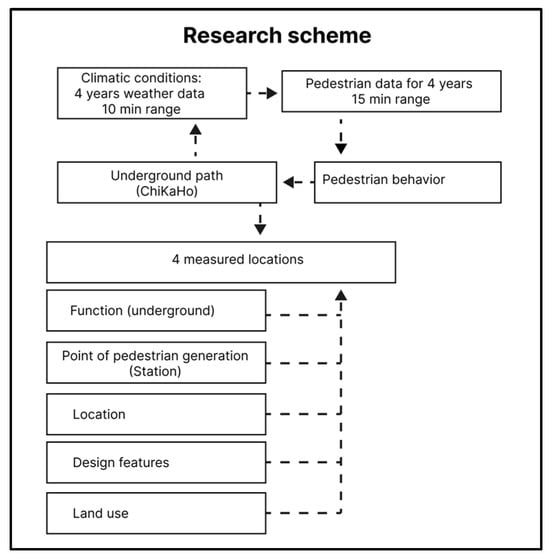
Figure 2.
Scheme of Sapporo underground walkway system research.
The installation locations are at the entrances and exits (J1 and J4), which connect to the subway station concourse at the north and south ends of the ChiKaHo; and at the intersection of surface roads (J2 and J3), and from ChiKaHo facing west. The sensor detects a person that passes between the ceiling and the floor, but it does not recognize or identify an individual. Data are divided into 15-minute intervals.
Lastly, the study combined pedestrian data with the 10-minute climate data [51] of the central Sapporo district, including precipitation (mm), wind speed (m/s), direction (0°–359°), and temperature (°C).
The study investigated seasonal changes (spring, summer, fall, and winter) in pedestrian flow according to temperature and difference between points for the same period (evaluation of the design using the spatial characteristics of a particular point).
2.2. Model Building
For each point, data across four years were collected (2019–2022). The time allocation of the four seasons were December 1–February 28 (winter; average day temperature: approximately 0 °C), 1 March–31 May (spring; temperate months), 1 June–30 September (summer), and 1 October–30 November (fall; temperate months). Data were also classified and analyzed according to weekdays or weekends/national holidays, but the results did not demonstrate a significant difference. Moreover, data were collected between 9:30 and 16:00 to minimize the influence of commuting peaks in the morning and evening. Regression analysis (total least squares) was conducted between temperature changes and pedestrian flow at the four points of the ChiKaHo. The study considered the following climatic parameters (Table 1): average number of pedestrians (per year), average number of pedestrians (season), median number of pedestrians (per year), coefficient of determination (per year and per season), correlation between number of pedestrians and temperature (per year and per season), standard deviation of number of pedestrians (per year and season), and temperature changing point and pedestrian flow (average and per year).

Table 1.
Parameters for estimating pedestrian flow in the ChiKaHo.
The estimation of the rate of change in pedestrian flow from temperature is estimated as the slope coefficient (derivative) of this model.
In addition to climatic influence, the study used GIS tools to assess the influence of the existing design of the space and environment of a specific point and functional saturation on pedestrian activity. Table 2 displays the significant factors: proximity to the metro station, proximity to an office building with at least 1 company and more than 3000 employees, linear density of retail services/equipment, floor area of nearest blocks, exits from underground, placement of the counting node, food court, and FAR (density of surrounding blocks). Finally, the study performed a comparative analysis of the points.
Table 2.
Physical parameters of observed space around each point.
3. Results
3.1. Analysis of Pedestrian Counts Using Open Data
According to observations of pedestrian flow in the underground public space of ChiKaHo, the first rush hour (morning) ranges from 8:00 to 8:45 AM, while the second rush hour (evening) is from 5:00 to 6:15 PM.
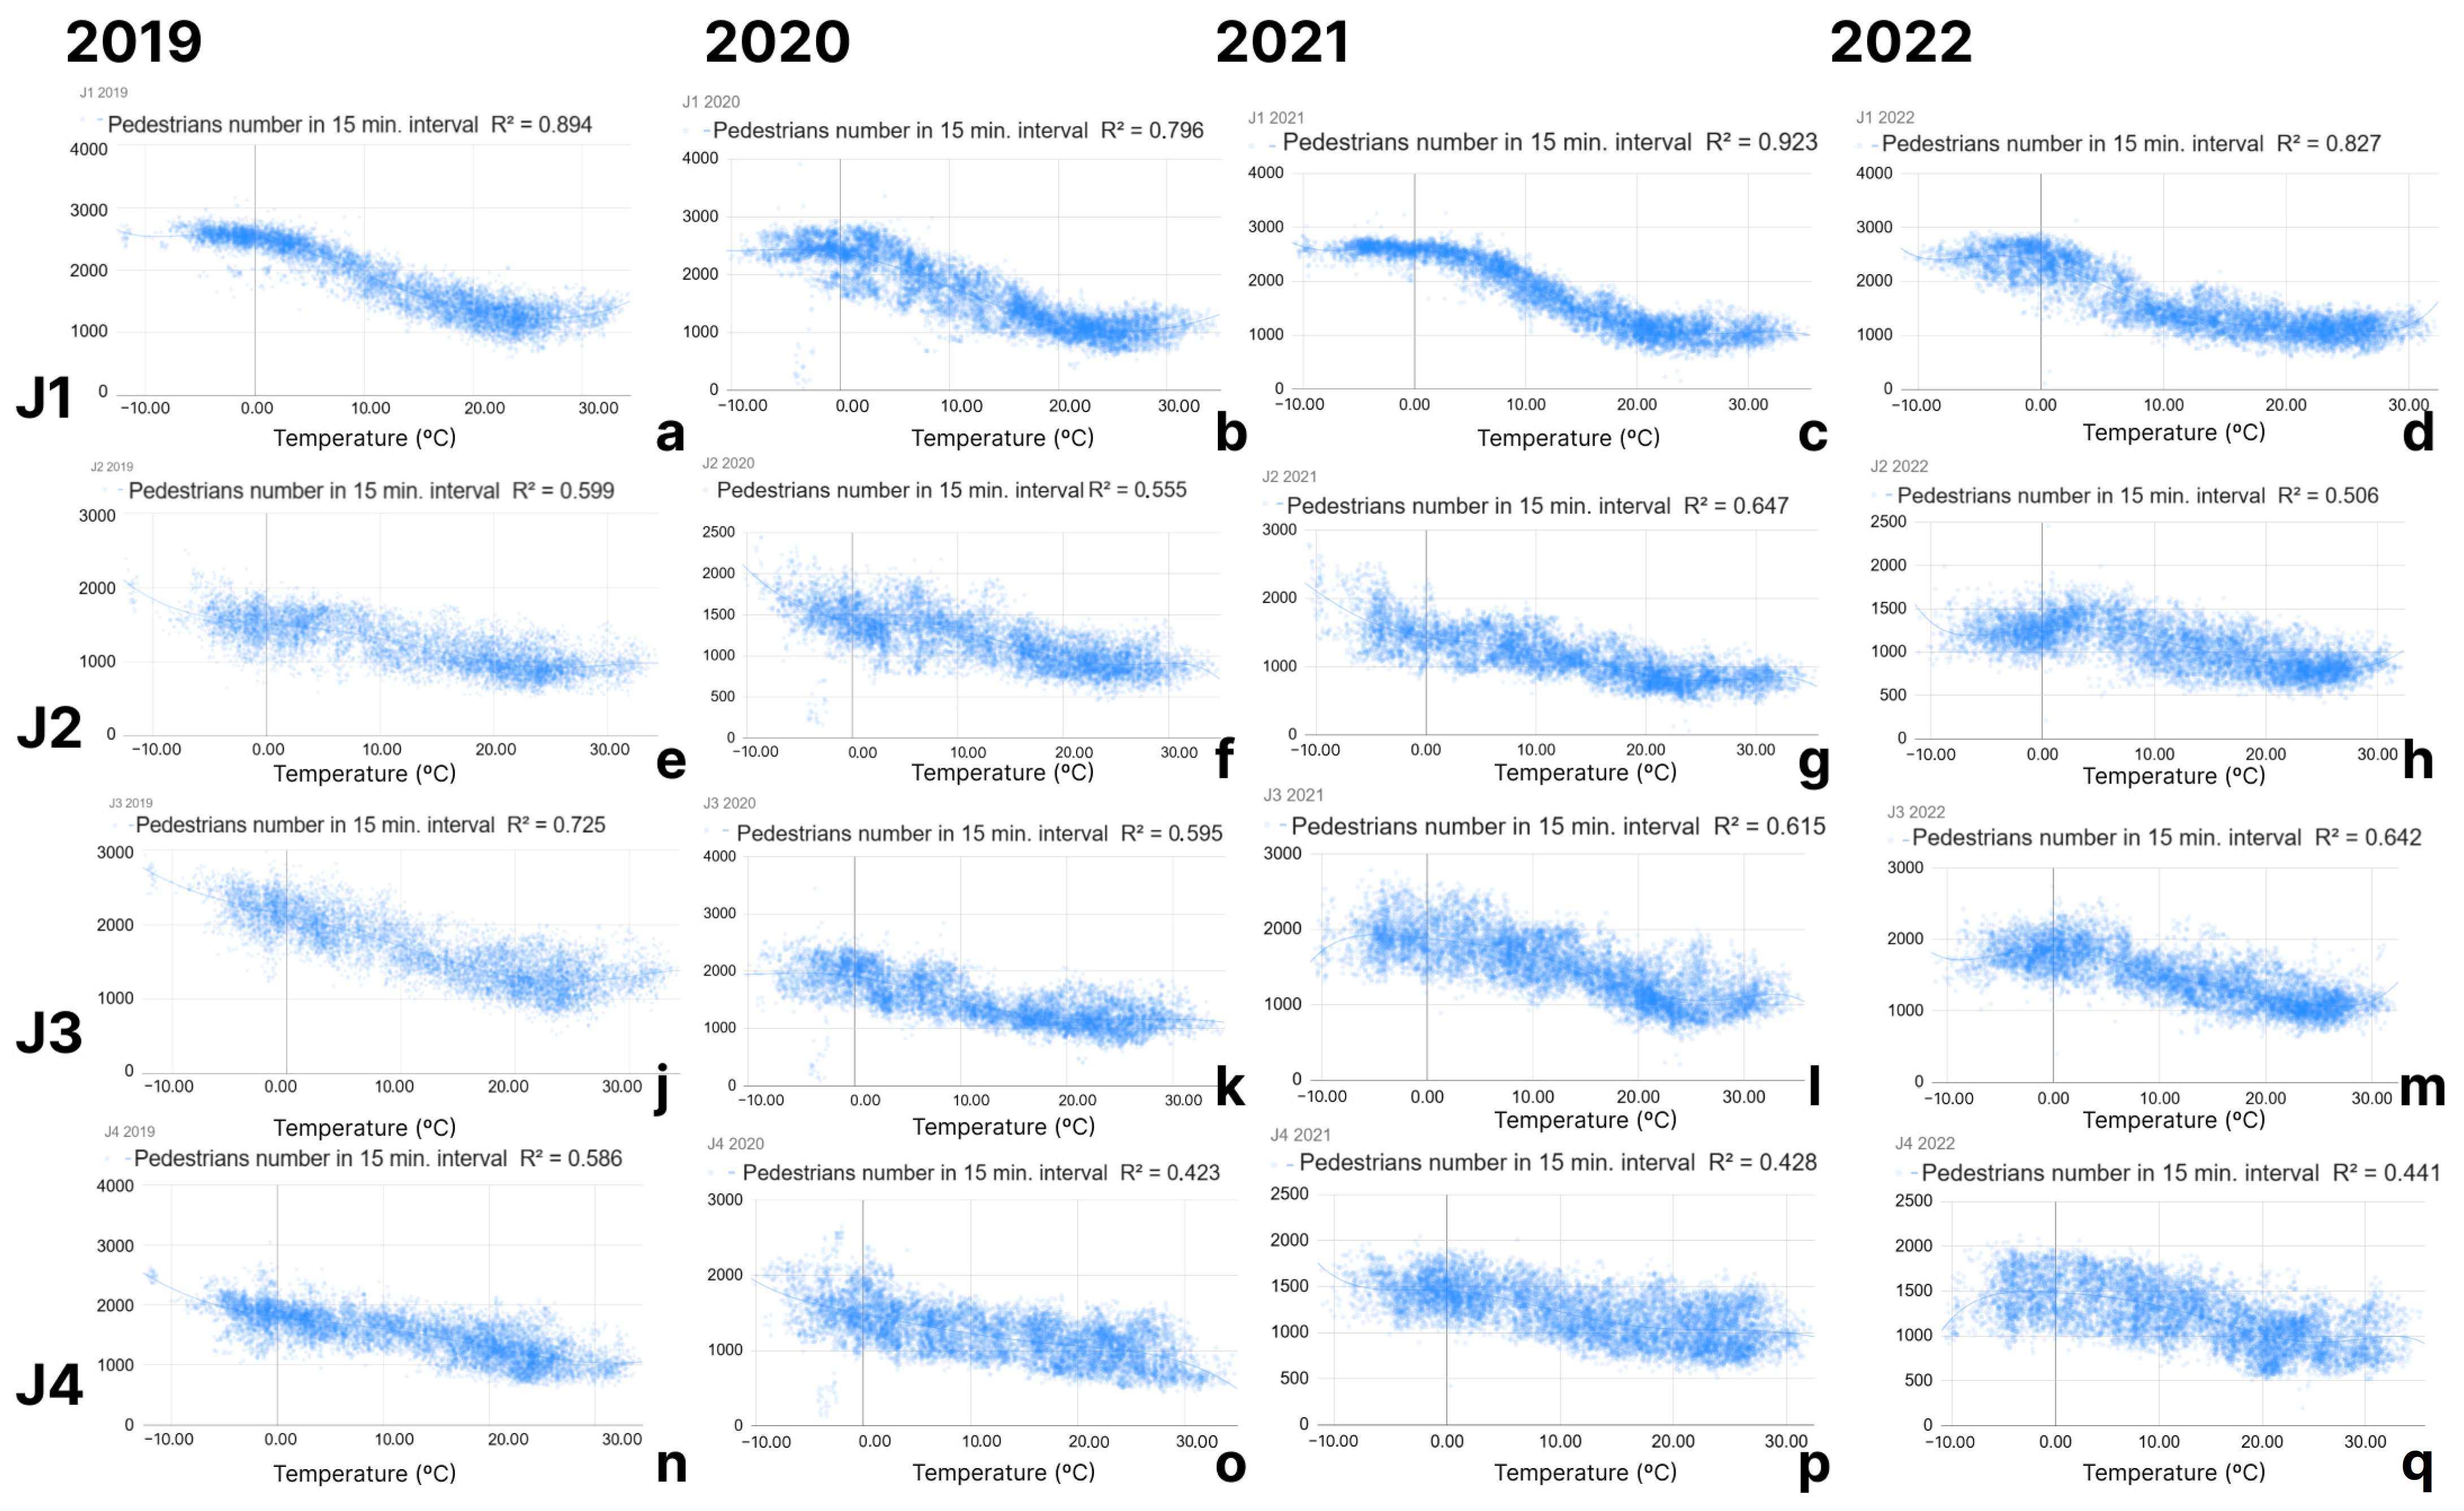
Figure 3 presents the relationship between pedestrian flow and temperature change in the ChiKaHo from 9:30 to 16:00 across the 4 years of observation from 2019 to 2022.
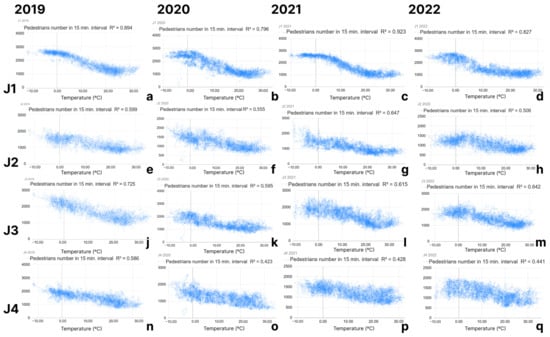
Figure 3.
Dependence of pedestrian flow on temperature at the four points for 4 years of observation. (a–d)—Dependence of pedestrian flow on temperature in J1 for 2019–2022 respectively. (e–h)—Dependence of pedestrian flow on temperature in J2 for 2019–2022 respectively. (j–m)—Dependence of pedestrian flow on temperature in J3 for 2019–2022 respectively. (n–q)—Dependence of pedestrian flow on temperature in J4 for 2019–2022 respectively.
To aggregate data (average) per day according to temperature (Figure 3), the study identified a polynomial function for each observed point in underground space across the 4 years.
During winter (1 December–31 March 2021–2022; daytime, 9:30 to 16:00), in terms of pedestrian traffic changes by point, the fluctuation of interquartile range (IQR) is 6–9.4% (minimum among all observed points) for point J1 (Q1, 75.15%; Q3, 83. 60%). For J2, the fluctuation of IQR is 10.10% (however, the ranges of Q1 and Q3 fluctuate at 5% each). For J3, the fluctuation of IQR is relatively stable across the seasons (11–19%). For J4, the fluctuation of IQR is relatively stable for all seasons but higher than J3 (14–21%; however, it exerts a strong influence from temperature change).
During spring (1 April–31 May 2021–2022) and fall (1 October–30 November 2021–2022; daytime, 9:30–16:00), pedestrian traffic changes by points indicate that the fluctuation of IQR is 13–28.44% (maximum among all points) for J1 (Q1, 49.73%; Q3, 79.55%). For J2, this value is stable (approximately 19%; however, it is the highest for this point). Pedestrian flow presents a similar fluctuation for J4 (approximately 20%).
During summer (1 June–30 September 2021–2022; daytime, 9:30–16:00), pedestrian traffic changes by points reveal that the fluctuation of IQR is stable (13%) for J1.
The R2 coefficient of determination indicates how closely the trend line fits the data. The closer to R2 = 1, the closer the match.
For J1, at a surface temperature of +2 °C, the flow of pedestrians was 71.75% of the maximum observed in the period from November 1 to March 31 (four seasons*). At temperatures of +4 °C, 6 °C, and 8 °C, the numbers of pedestrians are 67.73%, 62.8%, and 57.54%, respectively, stabilizing at 34.5–31.5% of pedestrians from the maximum.
For J2, at a surface temperature of +2 °C, the flow of pedestrians reached 50.6% of the maximum observed from 1 November to 31 March (four seasons*). At temperatures of +4 °C, 6 °C, and 8 °C, the numbers of pedestrians were 49.82%, 48.74%, and 47.26%, respectively.
For J3, at a surface temperature of +2 °C, the pedestrian flow was 65.68% of the maximum observed from 1 November to 31 March (four seasons*). At temperatures of +4 °C, 6 °C, and 8 °C, the numbers of pedestrians were 64.3%, 62.5%, and 60.3%, respectively.
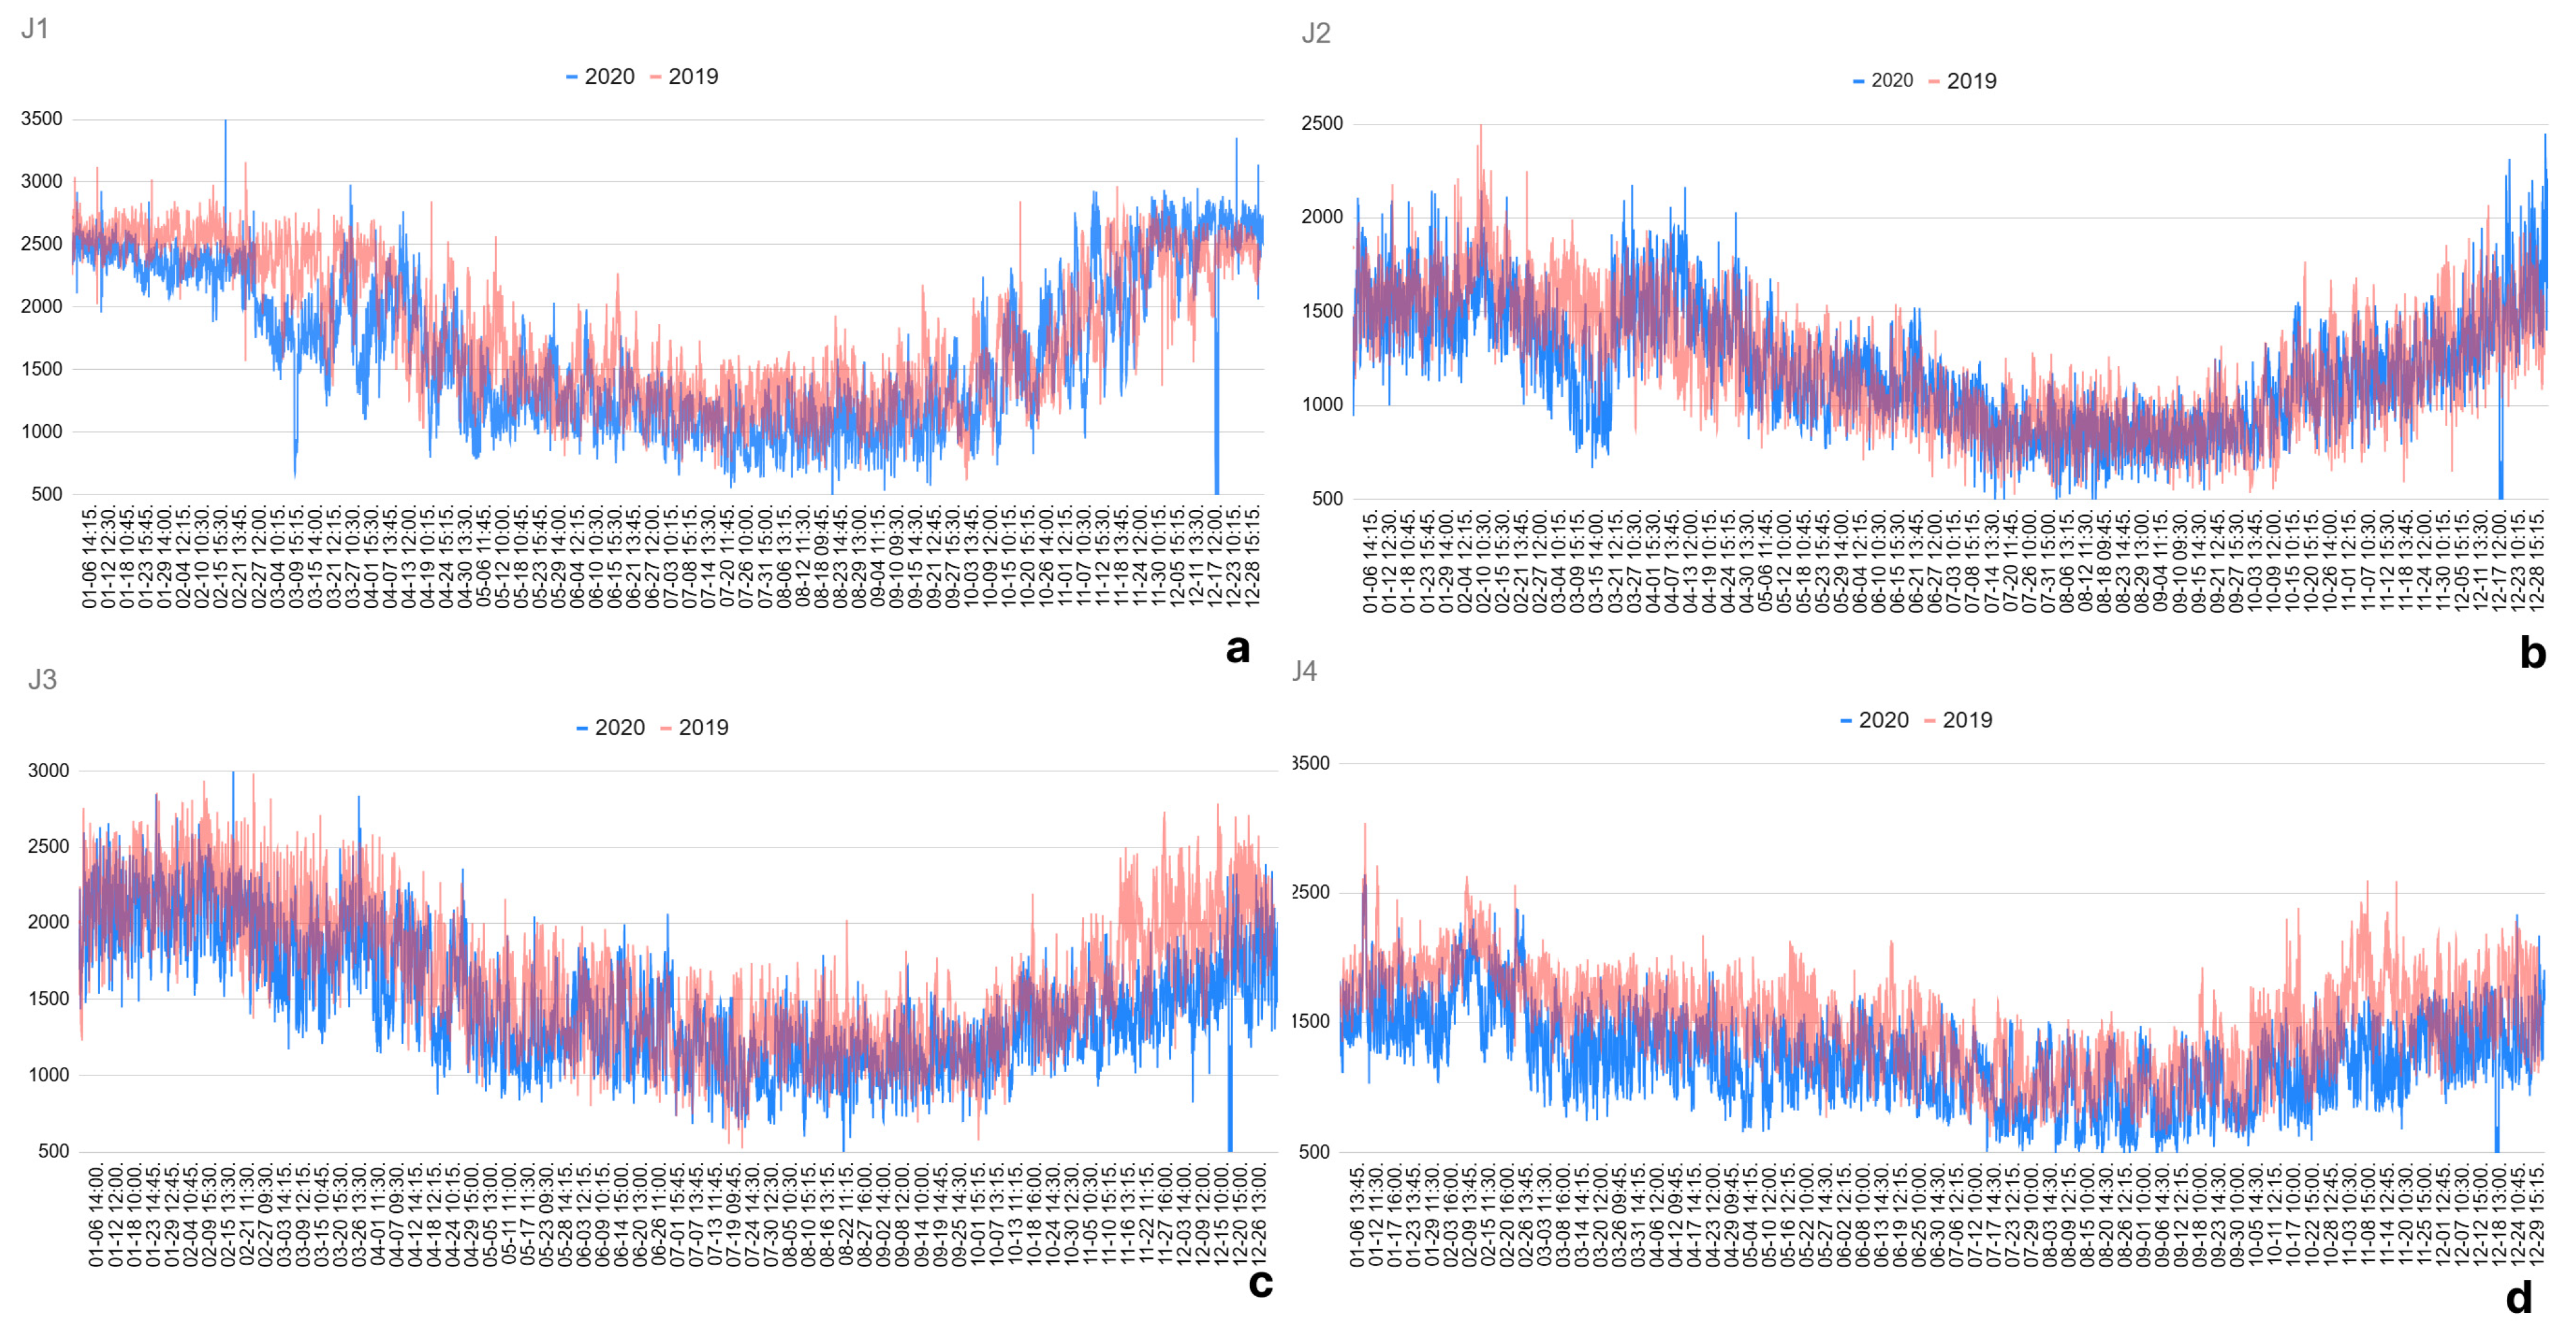
Separately considering the pedestrian activity data for 2020, some expected anomalies in the analyzed data can be seen due to the influence of COVID-19. In 2020, a sharp decrease was observed in pedestrian flow (relative to 2019) during the spring months (Figure 4). The average declines at point J1 (Sapporo Station gate), J3, and J4 (Odori Station) were 10.29%, 15.89%, and 20.34%, respectively. Point J2 was exempt (near open public space). There was a significant drop at point J2 from the middle of February to middle of March in number of pedestrians; however, this was reversed from the second part of the month.
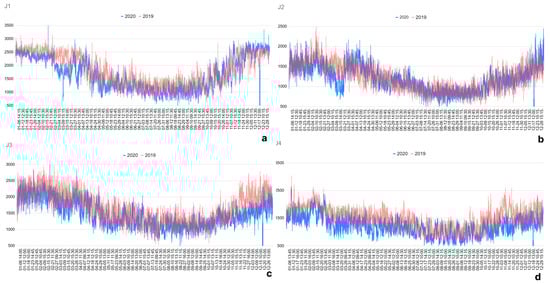
Figure 4.
Comparison of 2019 pedestrian traffic in ChiKaHo and 2020 in four observed locations. (a)—Pedestrian flow in 2019 and 2020 at point J1. (b)—Pedestrian flow in 2019 and 2020 at point J2. (c)—Pedestrian flow in 2019 and 2020 at point J3. (d)—Pedestrian flow in 2019 and 2020 at point J4.
3.2. Annual Period, Including Winter and Summer
Pedestrian flow at all points during the 4 years varies due to the influence of temperature and seasonal changes. During winter, pedestrian flow at all points of the ChiKaHo increased from 31% to 59% compared with that of the summer period. Therefore, the study infers that climatic factors influence the use of the public underground space in Sapporo.
In winter, the average observed temperature across 4 years varies from 0.6 °C to 1.0 °C, while the minimum temperature from 9:30 to 16:00 is from −12.4 °C to +7.4 °C.
The average temperature for summer in this period is 23.0–24.4 °C, while the minimum temperature for the period from 9:30 to 16:00 is from +14.00 °C to +35.5 °C.
In absolute terms, the number of pedestrians in summer is relatively similar for all observation points: on average, from 818 to 1310 in 15 min from 9:30 to 16:00. In contrast to the winter season and the transition seasons, spring and autumn, summer is characterized by the absence of correlations (low correlations at all points) between temperature and pedestrian flow.
Graphs of annual changes in pedestrian flow during the day, from 9:30 to 16:00 (outside peak use for commuting to and from work), depending on temperature changes for the observation points, can be described using polynomial and linear formulas. The minimum number of pedestrians throughout the year is observed at all points in the summer (1 June–30 September).
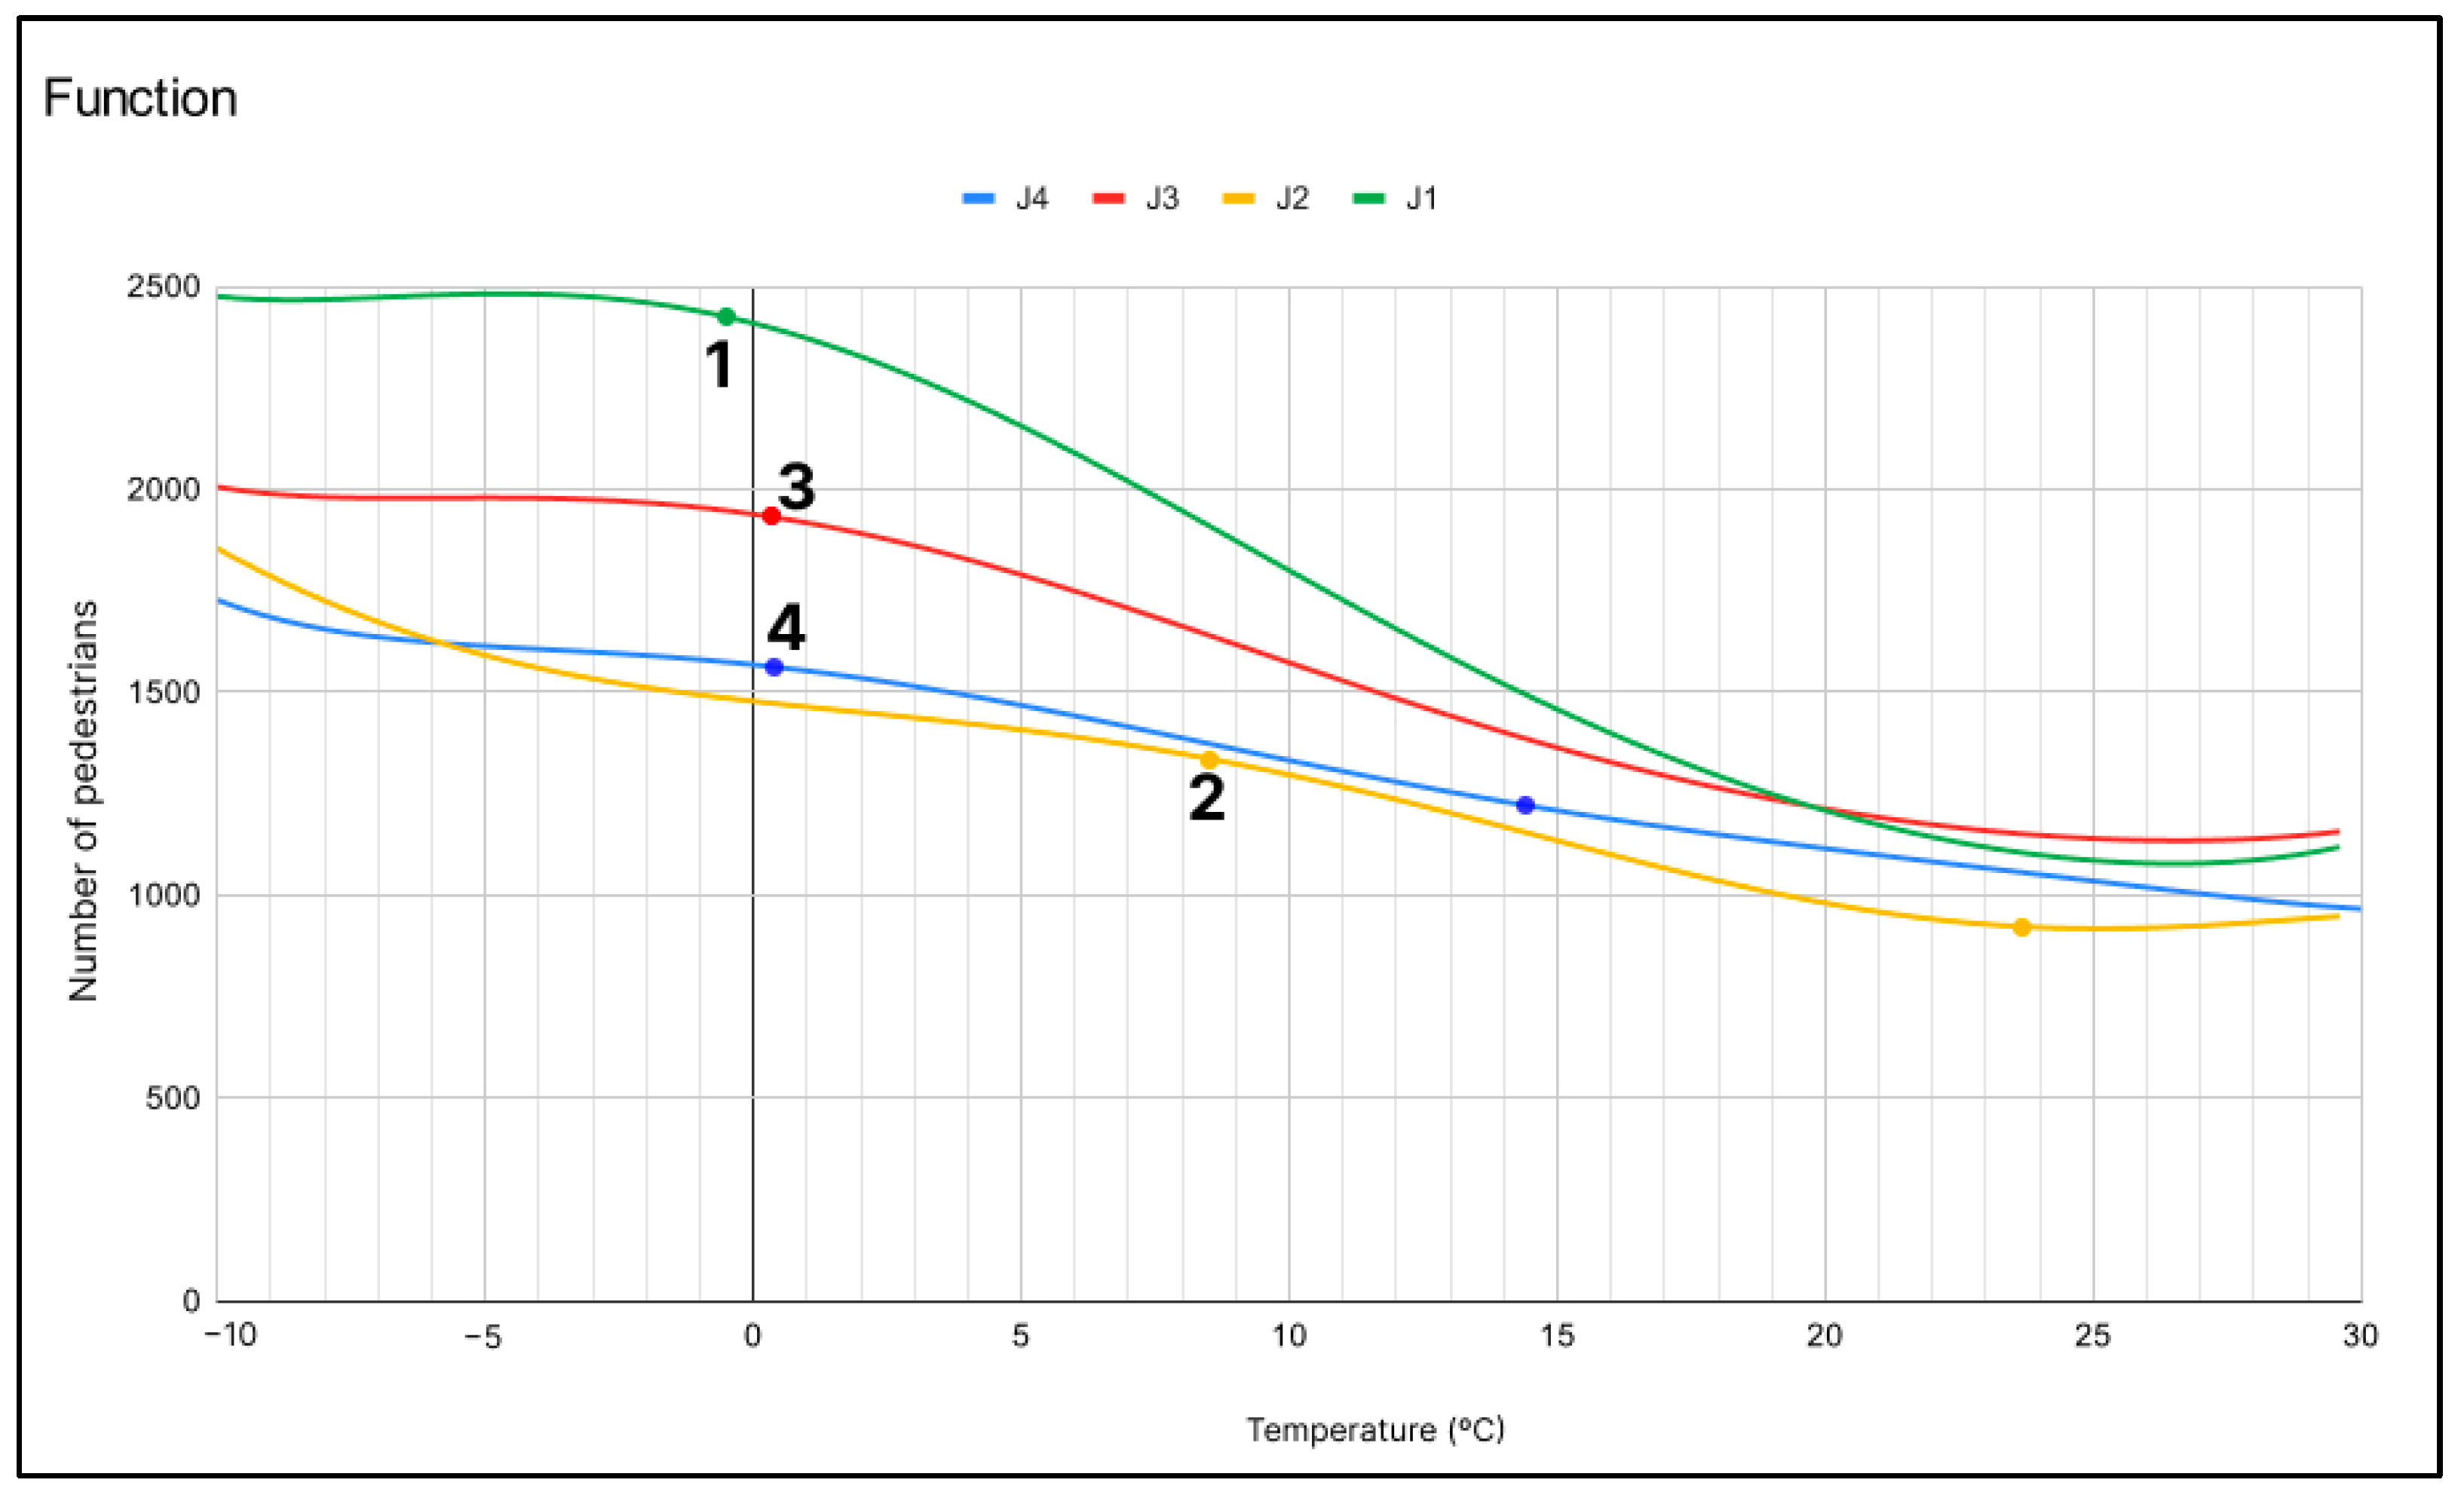
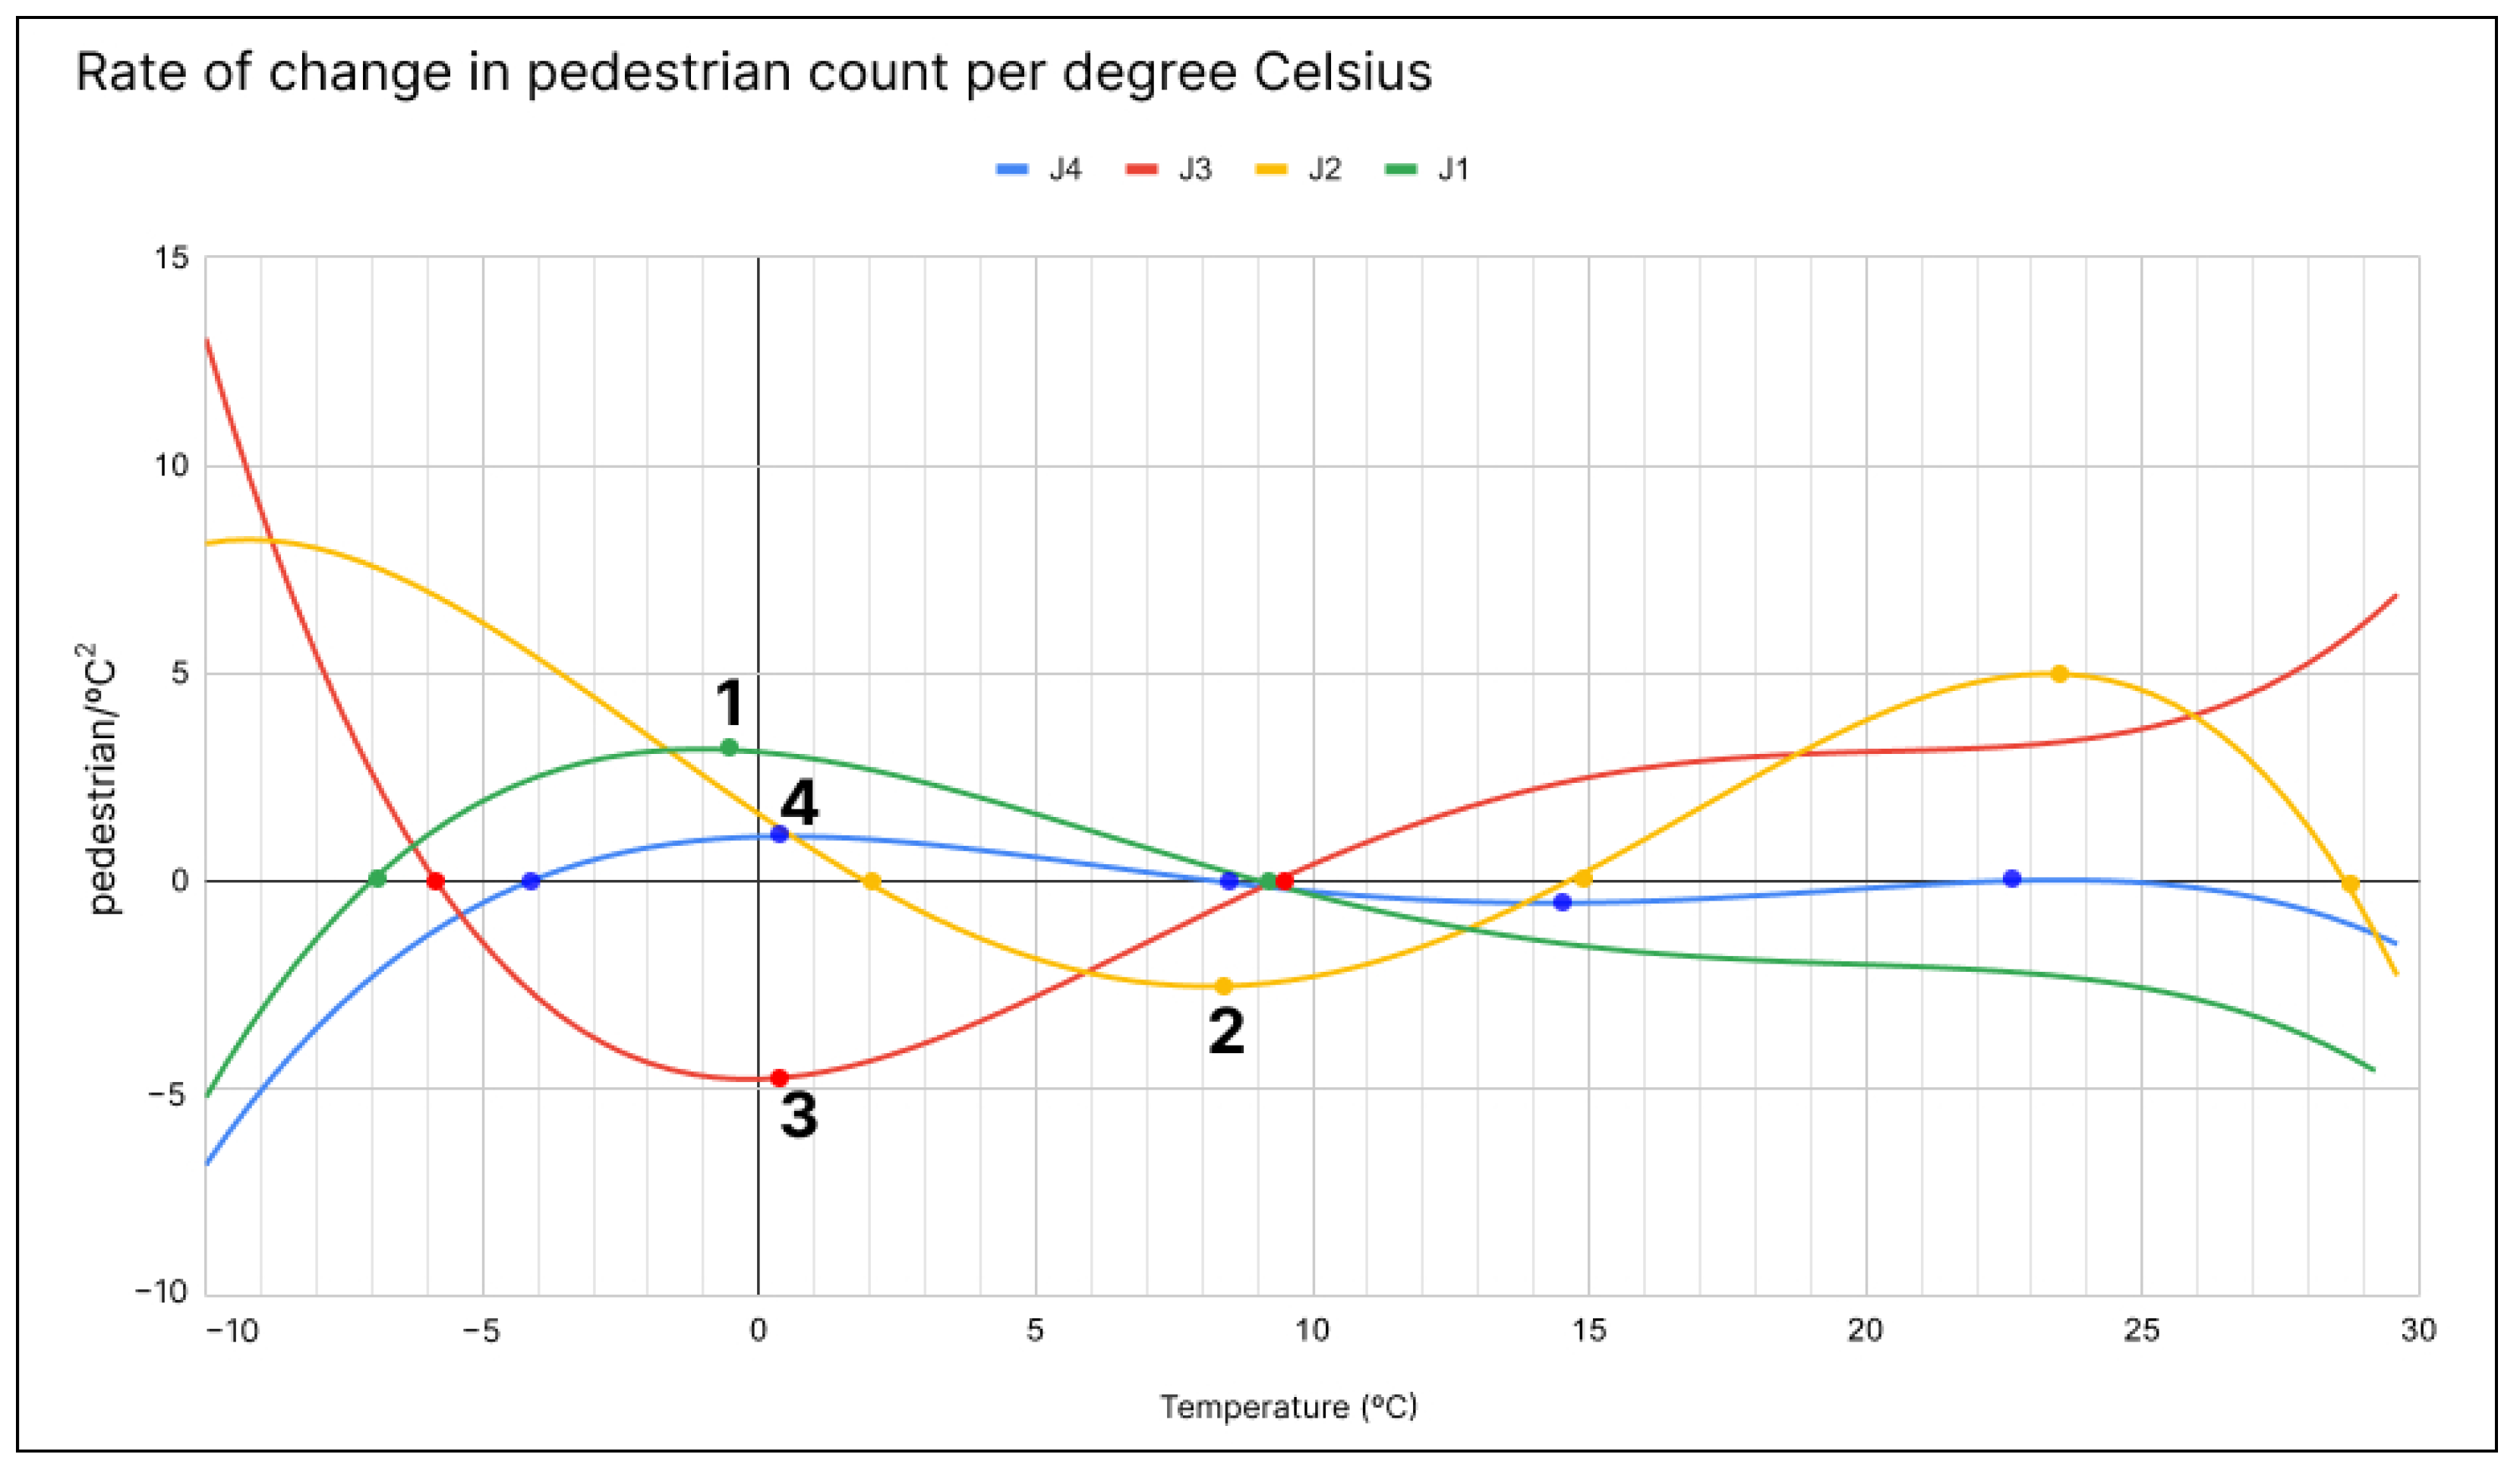
The rate of change in the number function of pedestrian over a 15-minute interval from the temperature for each of the points is described by the second derivative of the 6th degree polynomial function (Figure 5 and Figure 6). An analysis was conducted on the points, and the second derivatives of function per year and on average were constructed. The result indicates that the average fits into the total range of 4 years for each of the points. For J1, the period of major changes in the number of pedestrians occurs at temperatures from −2 °C to +1.2 °C (point 1 in Figure 5 and Figure 6; average, −0.5 °C). For J2, two-to-three points of change can be observed depending on the year (point 2 in Figure 4 and Figure 5); in the plus zone, the most significant changes occur at a temperature of +6.8–11.6 °C (average: 8.5 °C), and the second point is +22.8–23.7 °C (average: 23.7 °C). For J3, the minimum number of temperature points of change is two: the first period is from −2 °C to +4.4 °C and +10–13.2 °C, but the average for 4 years is one point +0.3 °C (point 3 in Figure 4 and Figure 5). Two tipping temperature points were identified for J4 ranging from +1.2 °C to 2.8 °C (point 4 in Figure 4 and Figure 5) and from 9.2 to 16 °C (average, +0.4 °C and +14.4 °C; Table 3, Table 4, Table 5 and Table 6).
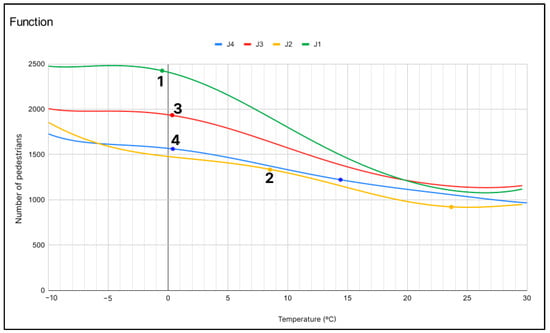
Figure 5.
Functions of pedestrian number per location and temperature changing points across 4 years of observation (average; 2019–2022) from 9:30 to 16:00. 1—Changing Temperature Point for J1. 2—Changing Temperature Point for J2. 3—Changing Temperature Point for J3. 4—Changing Temperature Point for J4.
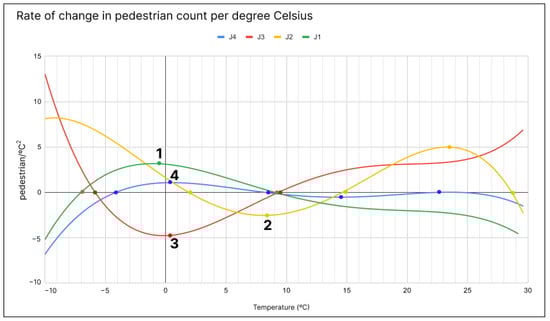
Figure 6.
Function of second derivatives per location across 4 years of observation (average; 2019–2022) from 9:30 to 16:00. 1—local maximum of second derivative for J1. 2—local minimum of second derivative for J2. 3—local minimum of second derivative for J3. 4—local maximum of second derivative for J4.
Table 3.
Changing temperature points influenced by pedestrian activity (average across 4 years).
Table 4.
Changing temperature points as influenced by pedestrian activity per year (2019–2022).
Table 5.
Comparison of observation points of pedestrian flow and climatic factors (Part 1) across 4 years.
Table 6.
Comparison between pedestrian flow and climatic factors (Part 2) across 4 years per observation point.
The following parameters were preliminarily calculated (Table 1, Table 5 and Table 6). Specifically, Table 5 and Table 6 present the statistical parameters of pedestrian flow, which was divided into two for better representation (Table 5 and Table 6). The coefficient of determination (R2) indicates the accuracy of the model of the pedestrian flow function using temperature as the dependent variable. The study identified changes in temperature points as influenced by pedestrian activity (average and per year of observation: 2019, 2020, 2021, and 2022; Table 3 and Table 4).
Pedestrian flow at all four points behaves differently according to season. If the correlation between changes in pedestrian flow and ambient temperature throughout the year is considered, then J1 displays a high negative correlation, ranging from −0.859 to −0.927; J3 shows a moderate correlation, from −0.743 to −0.83; J2 shows a medium correlation, from −0.671 to –0.789; and J4 shows a low correlation, from −0.627 to –0.761 (Figure 3). The greatest dependence between changes in temperature and pedestrian flow occurs during the transition seasons (spring and autumn), which are characterized by high temperature fluctuations (Figure 7).
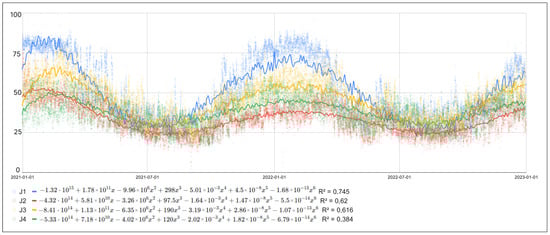
Figure 7.
Change in pedestrian flow by point for 2021–2022.
For J1, the spring and autumn seasons are characterized by a high correlation between pedestrian flow and ambient temperature (spring, from −0.695 to −0.88; autumn, from −0.530 to −0.92). In winter, it is stable (from −0.614 to −0.751). Moderate correlations are also observed in autumn (from −0.49 to 0.84) and spring (from −0.52 to −0.58) for J3. For J2 (Kita 3 jo), the correlation is weak in spring (from −0.41 to −0.66) and autumn (from −0.37 to −0.52). For J4, pedestrian traffic weakly and inconsistently correlates with temperature in spring (from −0.14 to 0.41) and moderately in autumn (from −0.44 to −0.65). The lowest correlation between ambient temperature and pedestrian traffic among the seasons is in summer for J1. According to the year (from −0.212 to −0.445), a similar trend is observed for J2 (from −0.02 to −0.35), J3 (from −0.08 to 0.34), and J4 (from −0.51 to −0.01). In winter, a stable correlation was found for J1 (from −0.614 to –0.751), and for other points, the correlation is unstable and similar to the summer period. According to the year, the corridor of values of point J2 is from −0.589 to −0.062, J3 is from −0.09 to −0.47, and J4 is from −0.58 to −0.06. For this reason, the changes in pedestrian flow in ChiKaHo during the year can be explained in relation to changes in ambient temperature and observation location in relation to the model coefficient of determination: for point J1, it was 73.8–85.9% (high dependency; average, 80.02%); for J2, it was 45–61.1% (average: 54.25%); for J3, it was 55.3–68.8% (average: 60.4%); and for J4, it was 39.3–57.9% (average: 44.75%).
3.3. Analysis of Urban Space and Function
In terms of location for each point, similar characteristics can be identified for J1 and J4: they are located in close proximity to the exits (gates) of metro stations and near office buildings with more than 3000 employees. J3 and J2 are located away from stations. The proximity of the park, variety of services and trade along the corridor, absence of a food court, and location of the pedestrian flow counting point not being between nodes are the main differences in functional and land uses between J1 and J4. Moreover, a difference exists in the characteristics of the nearest blocks to the points according to their FAR (density). Moreover, an open, undeveloped (vacant) space is identified around J1. For the other points, the blocks are more homogeneous.
The possibility exists that the presence of a vacant lot, together with other characteristics, makes the pedestrian flow at J1 subject to seasonal climatic dependencies.
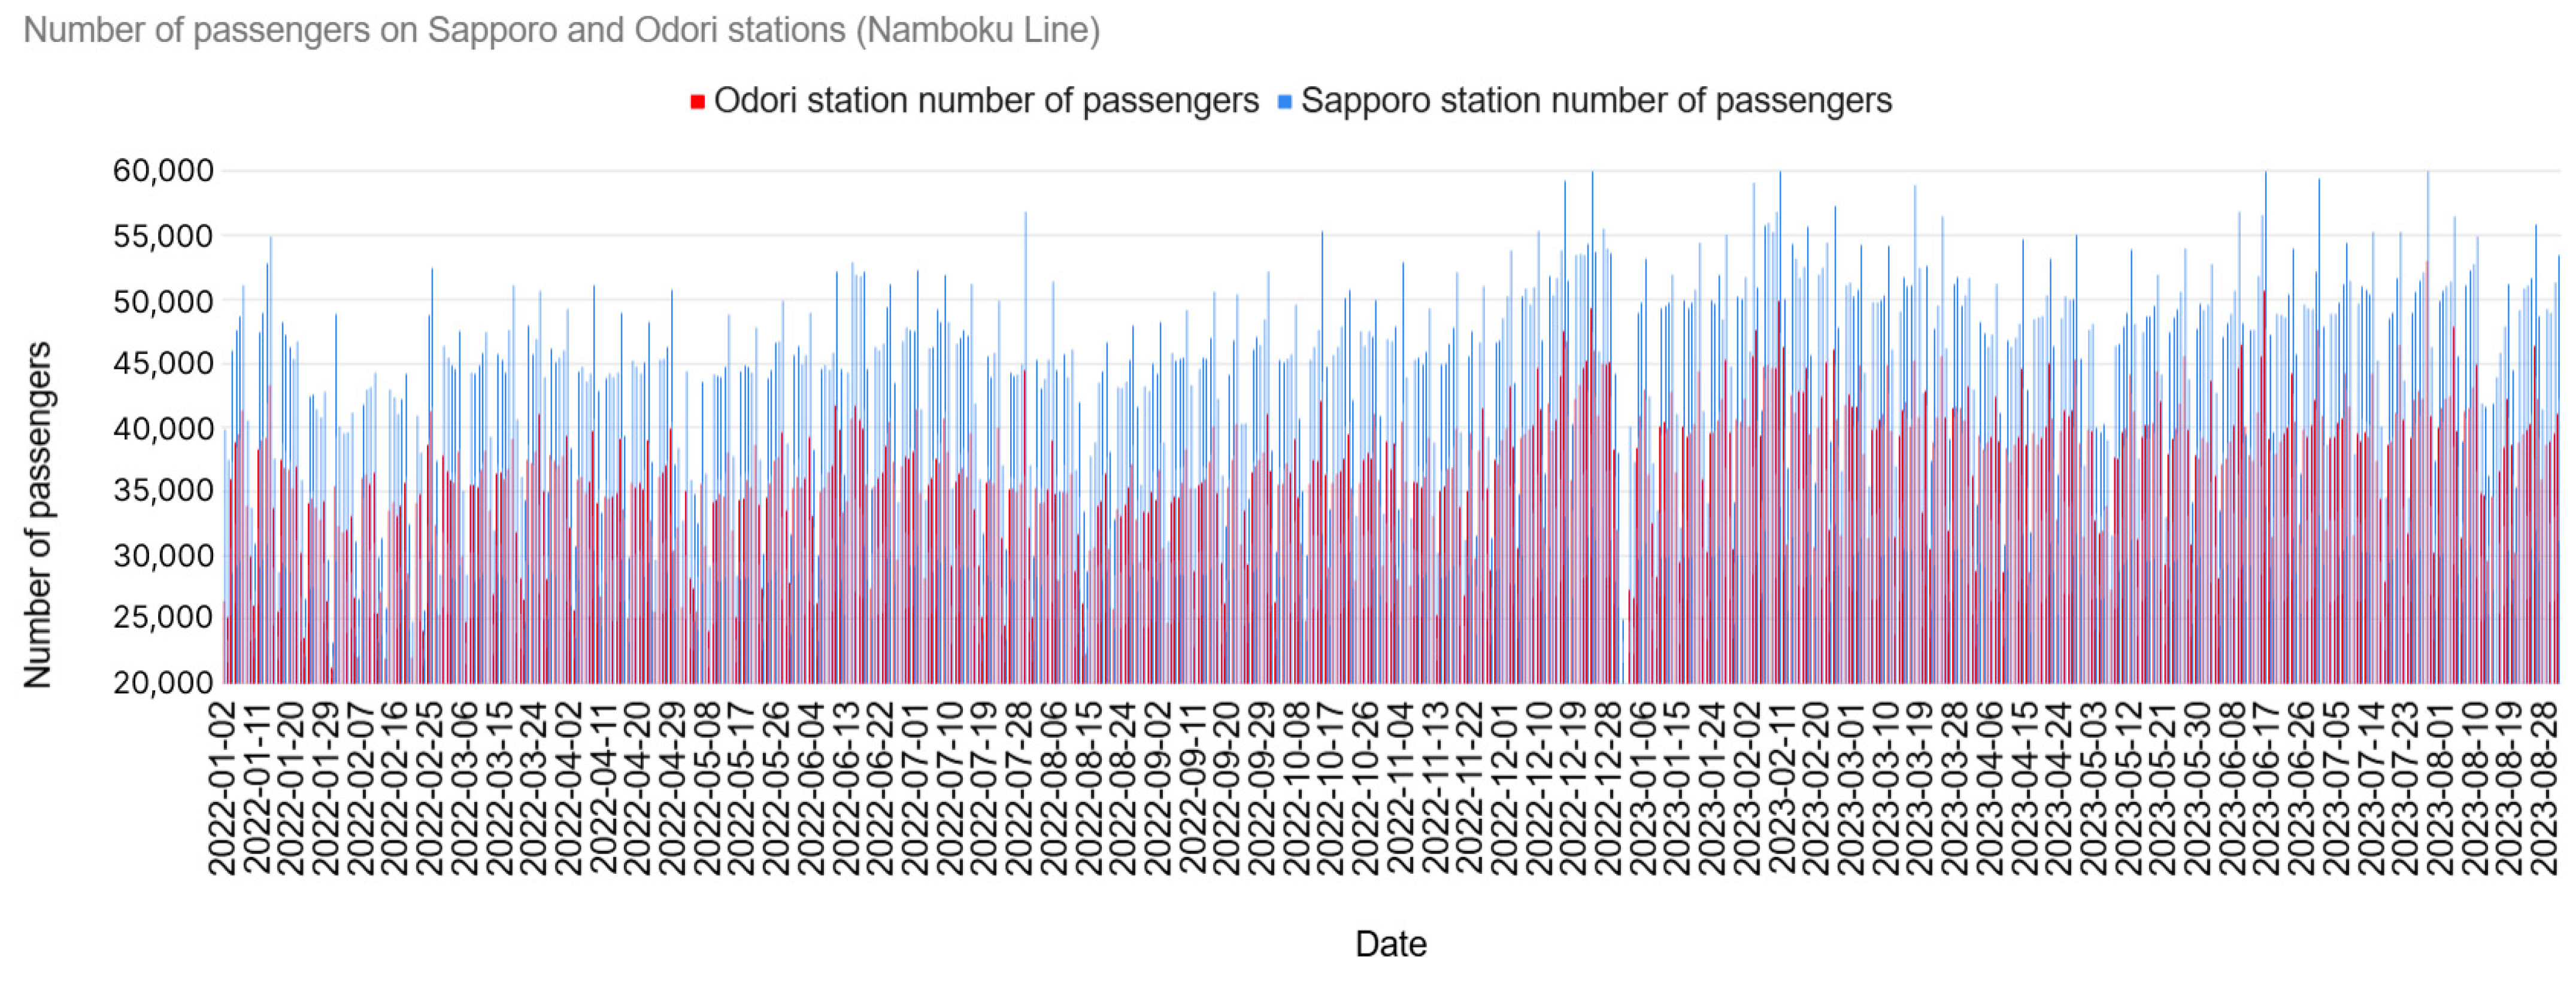
By analyzing data on daily passenger use for Odori Station and the Sapporo Namboku Line (August 2021–August 2023; Figure 8), the study found that Sapporo Station has a higher passenger flow and that the dynamics of changes in the same time periods are similar with those of the Odori Station, that is, an increase in passenger flow in December and early February, with a sharp decrease in early January, early May, and mid-August, coinciding with national holidays and festivals [52].
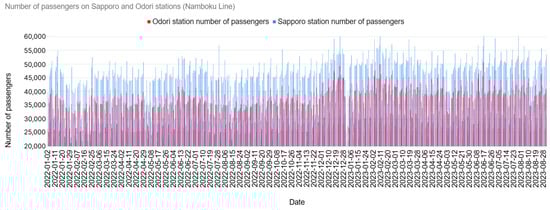
Figure 8.
Dynamics of passenger use of the Sapporo and Odori Subway Stations on the Namboku Line.
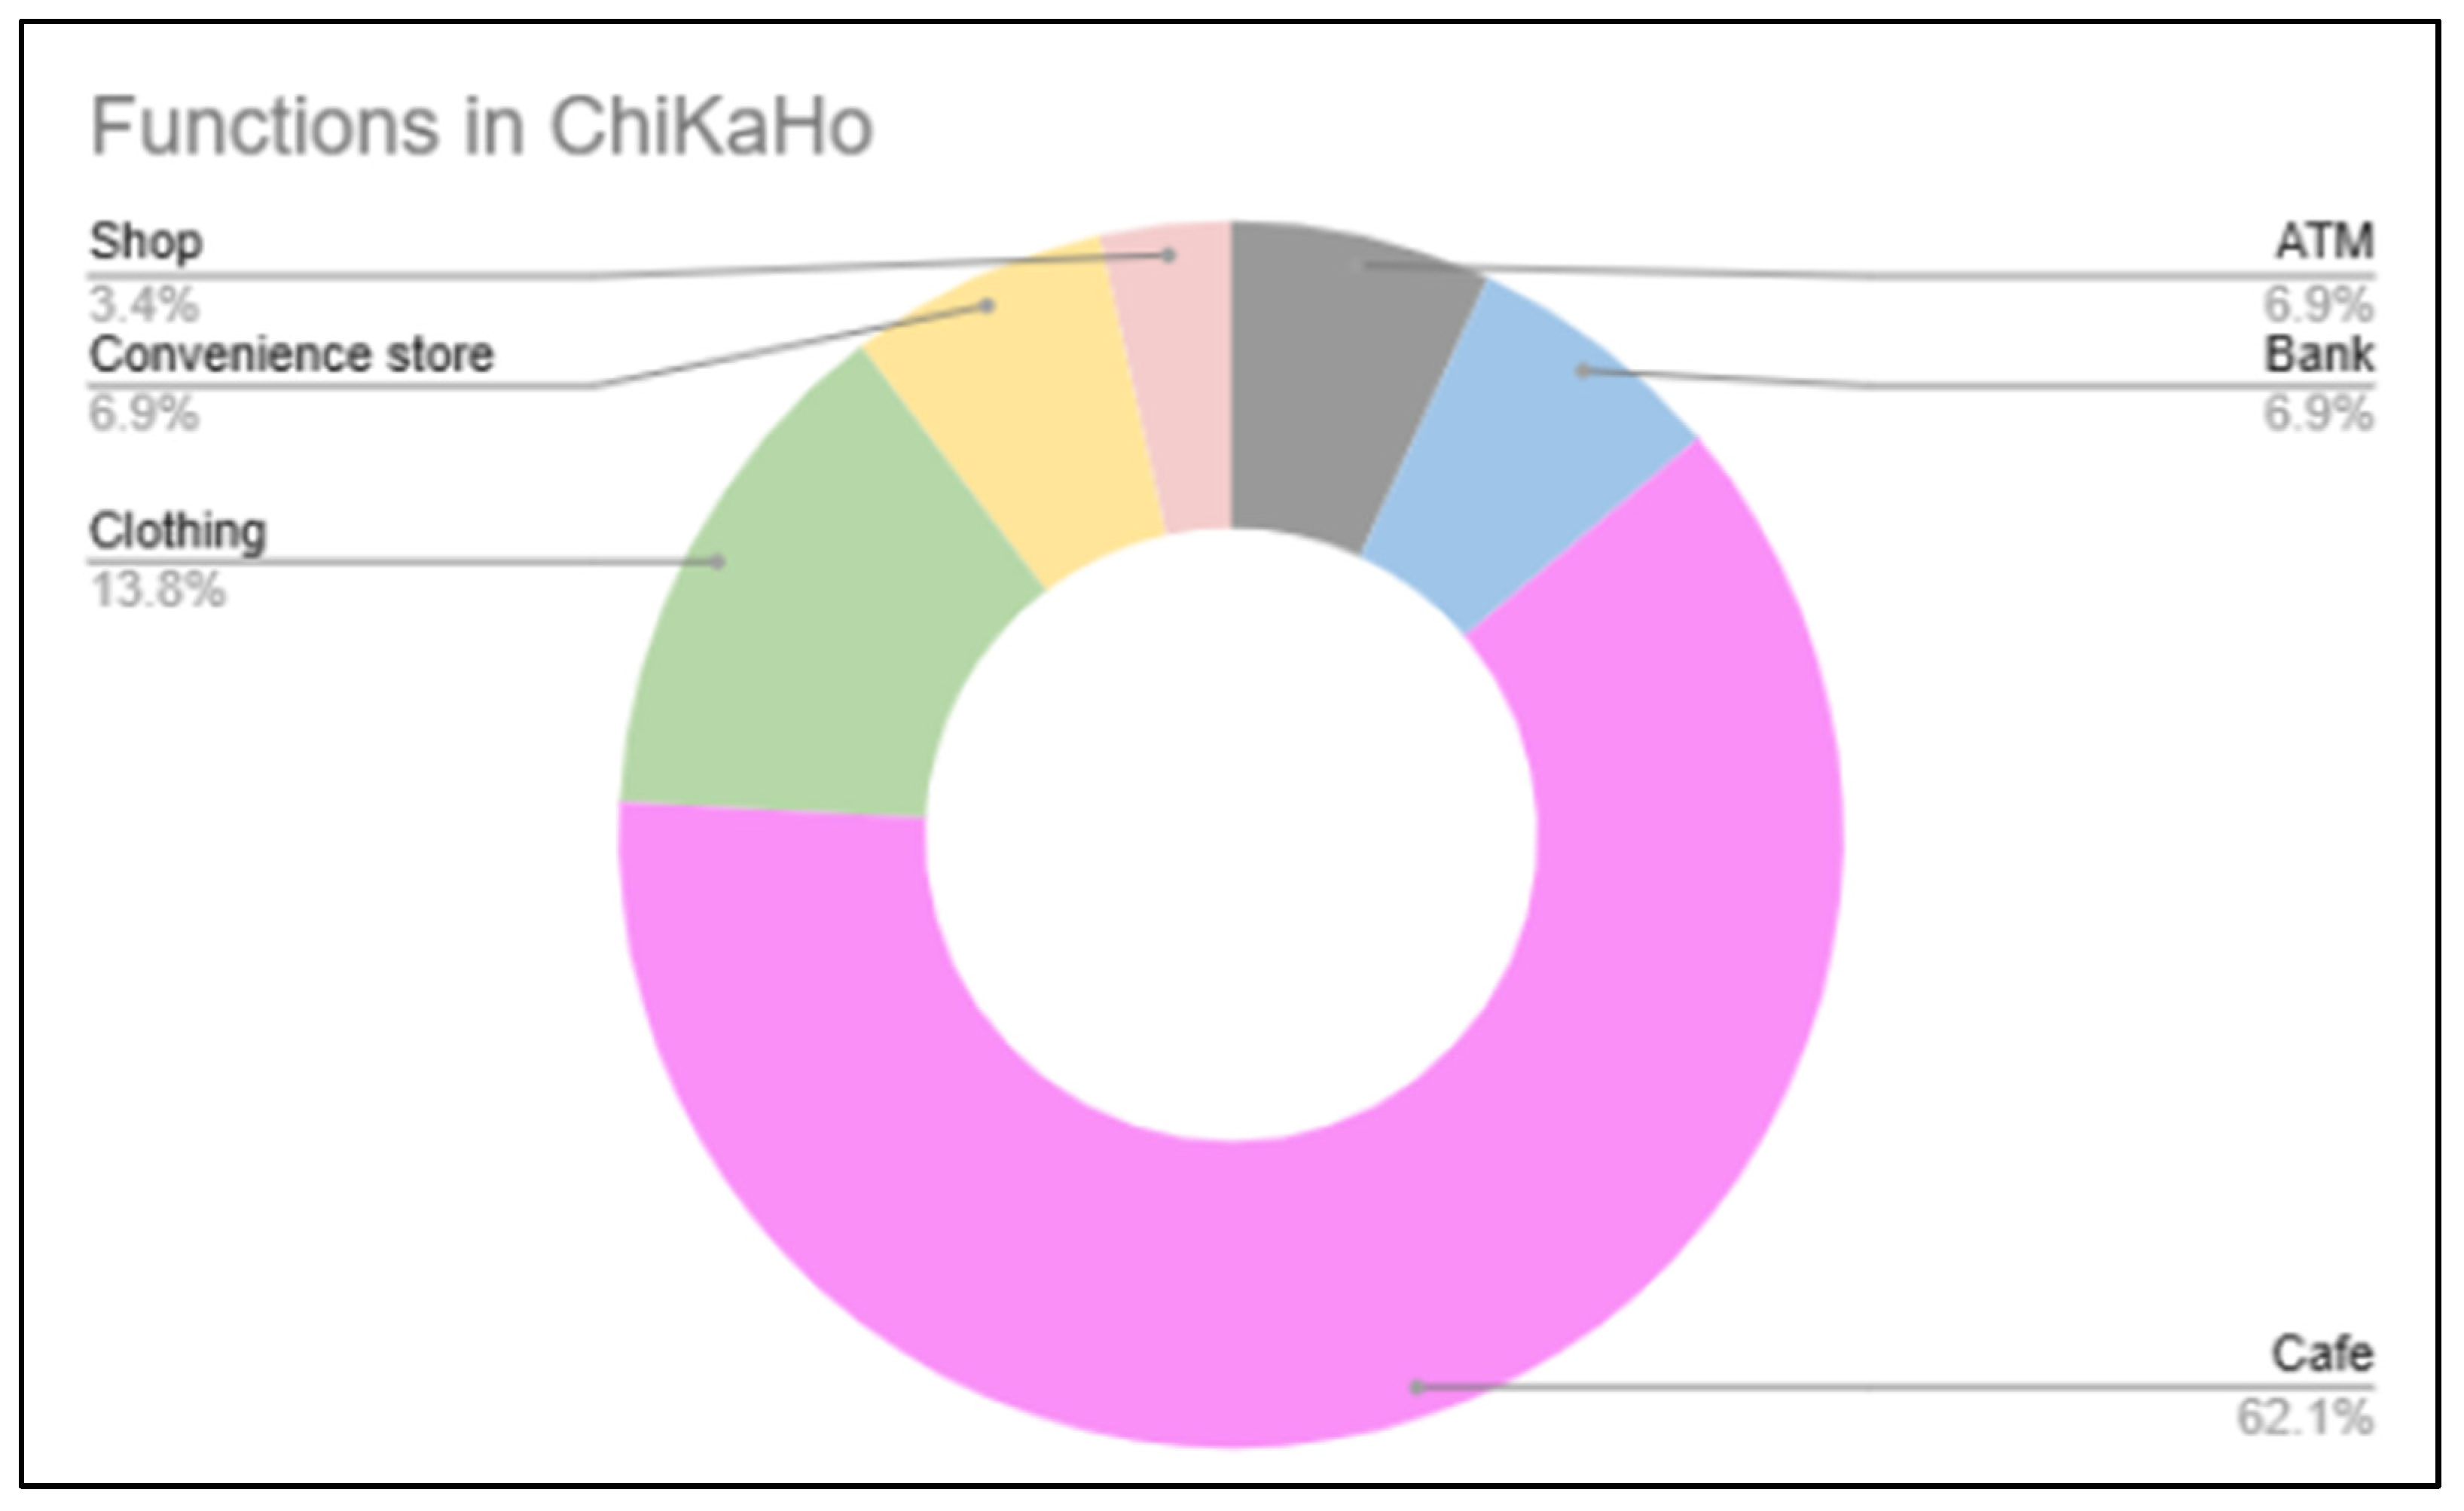
In winter, the underground space sufficiently covers daily basic needs without the need to go to the surface: the highest concentration of public functions (number of spots) is located in areas from J1 to J2 (up to 50 m in the direction of Odori), which comprise more than 82% of the total number of services in ChiKaHo. In particular, 66% of the services located in this area are catering cafes (Figure 9). In addition, two clothing and shoe stores exhibit direct access from ChiKaHo, a market for local small businesses, convenience stores, and financial services: one bank and two ATMs. J3 is located in the center of the market, where local craftsmen are represented. The next service area is located near exploration point J4 in Odori Station; it includes a cosmetics and perfume store, a convenience store, a cafe market, and a bank branch. The diagram presents the total number of services as percentages.

Figure 9.
Functions in ChiKaHo (number of spots).
In addition to the direct trading function, the underground space has eight public areas for waiting and relaxation, as well as six zones (available for rent at the request of local residents and businesses) to promote urban development. According to the official website [53], the main goals of these zones are as follows:
- (1)
- Promote the “Creative City of Sapporo” as a place to disseminate information about and stimulate the creative activities of citizens and companies;
- (2)
- Serve as a platform for collaboration for community events across the country and the world;
- (3)
- Encourage “movement and revitalization of the city center” for initiatives (events) to attract visitors to the city center and use it as a place for businesses along the station road to revitalize these businesses;
- (4)
- Represent a “comfortable daily life for business people in the city”;
- (5)
- “Unlock the Charm of Sapporo and Hokkaido” as a place for the dissemination of information about Sapporo and Hokkaido tourism resources, culture/art, and sports events, among others: two zones (on each side of the pedestrian path) in the area between J2 and J4 and two zones in the middle of the section between J2 and J3.
From the point of view of access to the underground space and its connection with the surface, the situation differs throughout the underground space: for J1 toward Odori Station, six entrances/exits can be boardroom the metro (i.e., 10, 9, 1, 2, 3, 4, 5, and 6). The nearest ones are at a distance of 20 m, whereas the farthest ones are behind J2 (250 m from J1); the nearest exits to J2 (6 units) are located at a distance from 5 to 95 m. For J3, the nearest exits (6 units) are from 35 up to 105 m. For J4 in the direction of Sapporo Station, the six nearest exits are located at a distance from 44 to 180 m (Table 7).
Table 7.
Physical characteristics of point space.
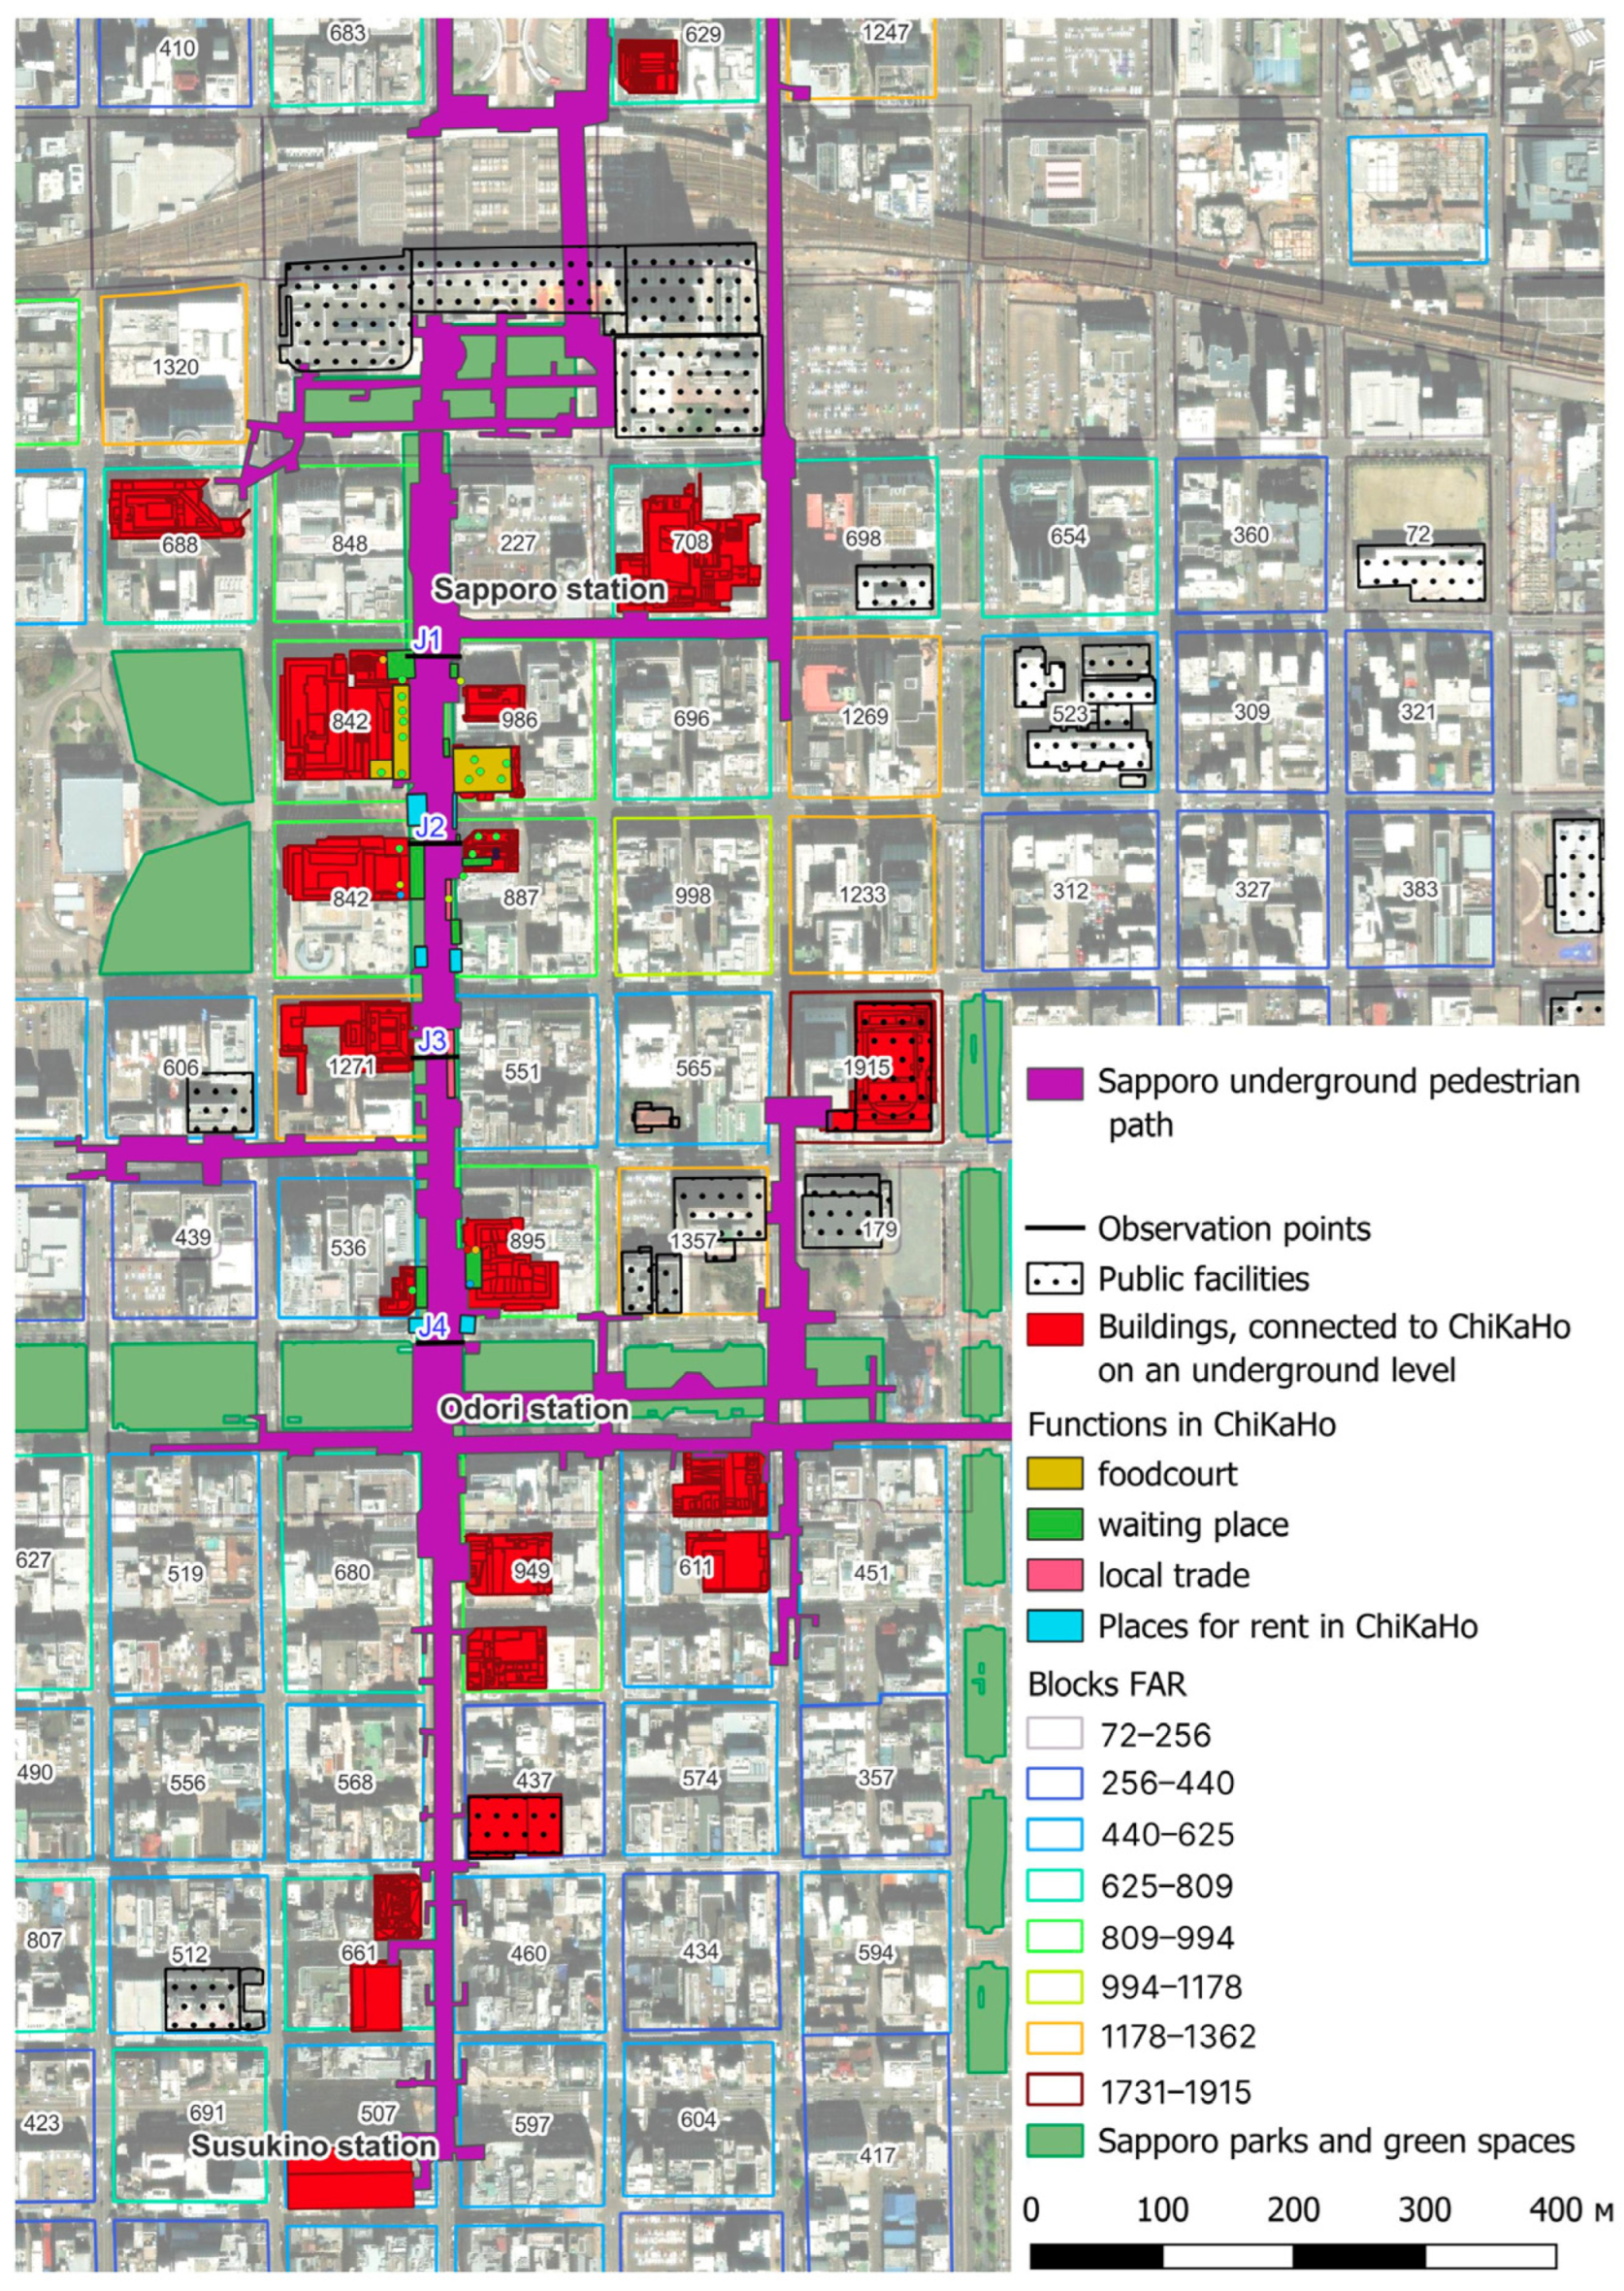
The connection between the path of the ChiKaHo with the surface, in addition to direct exits to the street level, can also be accessed through nearby buildings connected through underground floors. Most of these buildings were built after 2011 as part of the redevelopment of the territory and considered underground public spaces. Figure 10 shows the attached buildings and the public facilities of Sapporo. Among these buildings, several categories can be distinguished: office high-rise buildings with several public floors above and below ground level, shopping centers, hotels, a cultural center, and mixed-function buildings.

Figure 10.
Map of connected buildings with ChiKaHo and Sapporo public facilities.
The basic set temperature in ChiKaHo is 28 °C in summer and 17 °C in winter. Some minor adjustments might be made depending on the situation.
In addition, highlighting the local points of natural light in the subway is notable. A few of them correspond to surface exits, while others are resolved through the foyer (atrium) and the second light of adjacent buildings. A few of them are similar to ground lights, that is, rectangular windows elongated in the direction of travel. Traveling in the subway enables one to pass four groups of traffic lights on the surface. On average, a pedestrian could spend 6 min to move from J1 to J4.
The ChiKaHo underground space in Sapporo (Figure 11) is subject to seasonal changes in terms of the number of pedestrians. During winter, pedestrian flow at all points of the ChiKaHo increased from 31% to 59% compared with that of the summer period. The climate period during which the greatest change in pedestrian flow occurs at all points is from +6.8 °C to +11.6 °C, while the stabilization of this flow occurs at a temperature of +23.2 °C.

Figure 11.
ChiKaHo map with representation of functions and services.
3.4. Relationship Between Urban Functions and Pedestrian Count Fluctuations
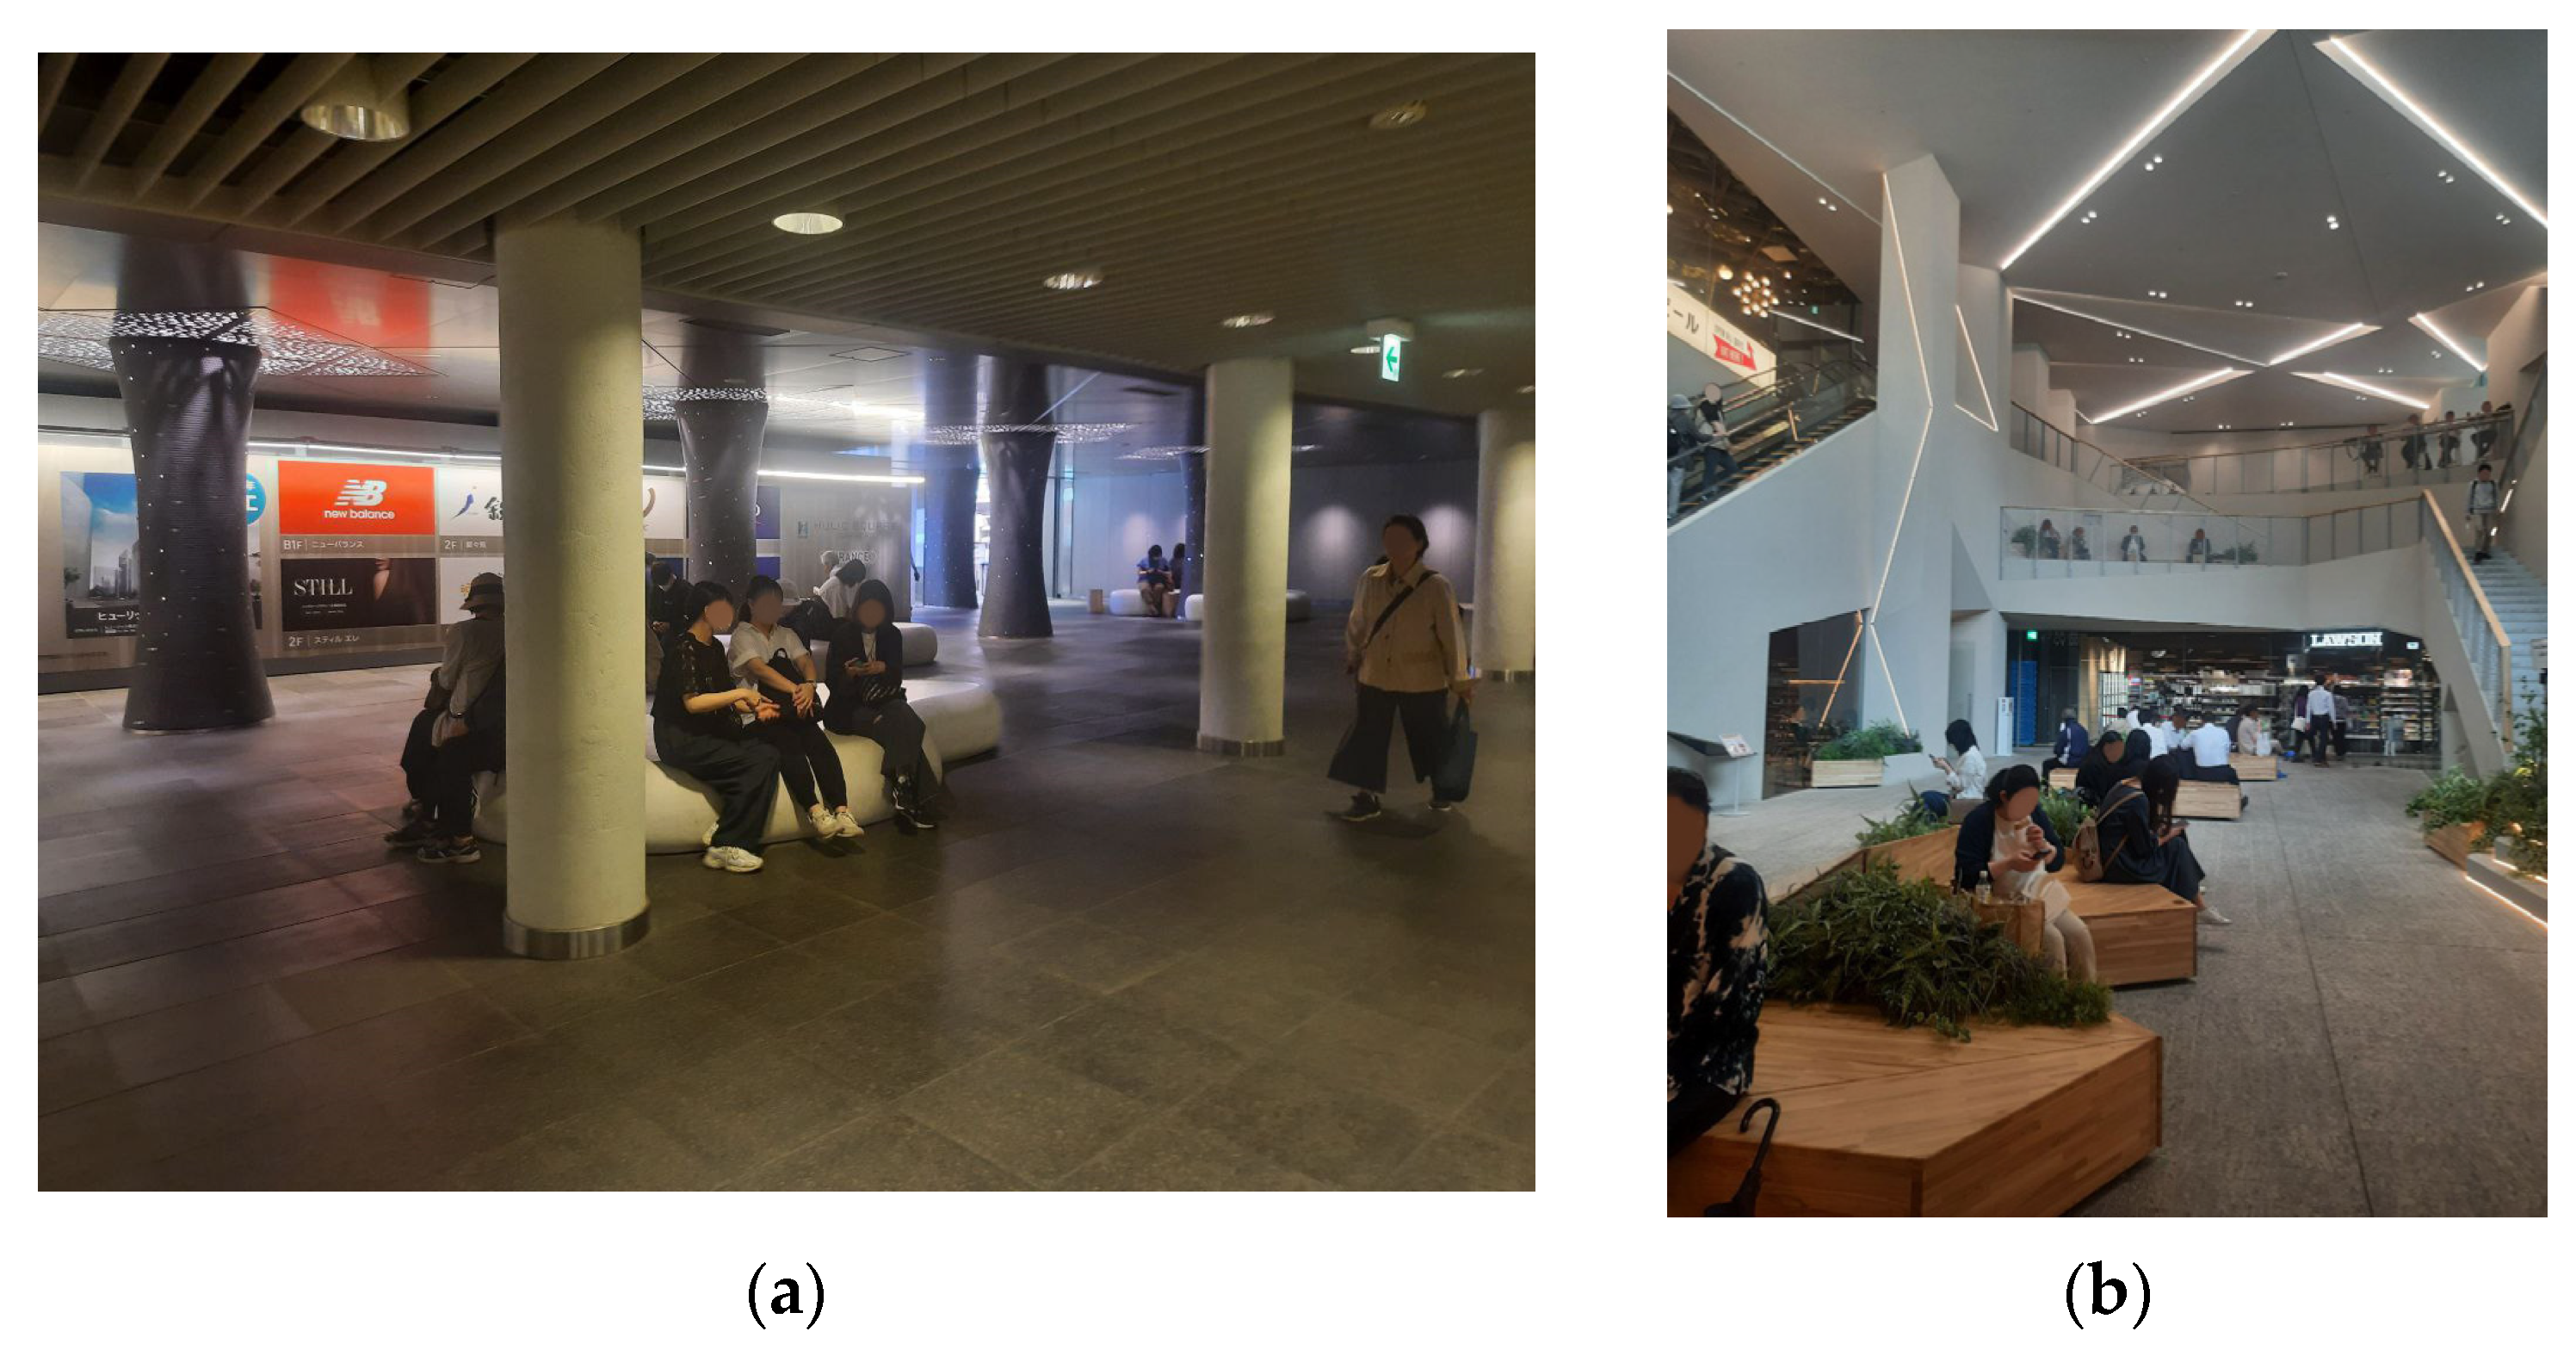
In J1, changes in pedestrian flow begin at lower temperatures in spring (from −2 to +1.2), such that pedestrians are more likely to opt for the overland route (earlier compared with other points). Conversely, in the fall, pedestrians will eventually descend into the subway. However, this section of the ChiKaHo is stable for forecasts due to the functional diversity and abundance of cafes. If the location of the functions is considered (a food court and numerous retail services immediately available in the underground space and absent on the surface), then these services increase attractiveness through the pedestrian traffic of the point (Figure 12).

Figure 12.
Photos of J1 in ChiKaHo: (a) west and (b) east sides of the ChiKaHo path.
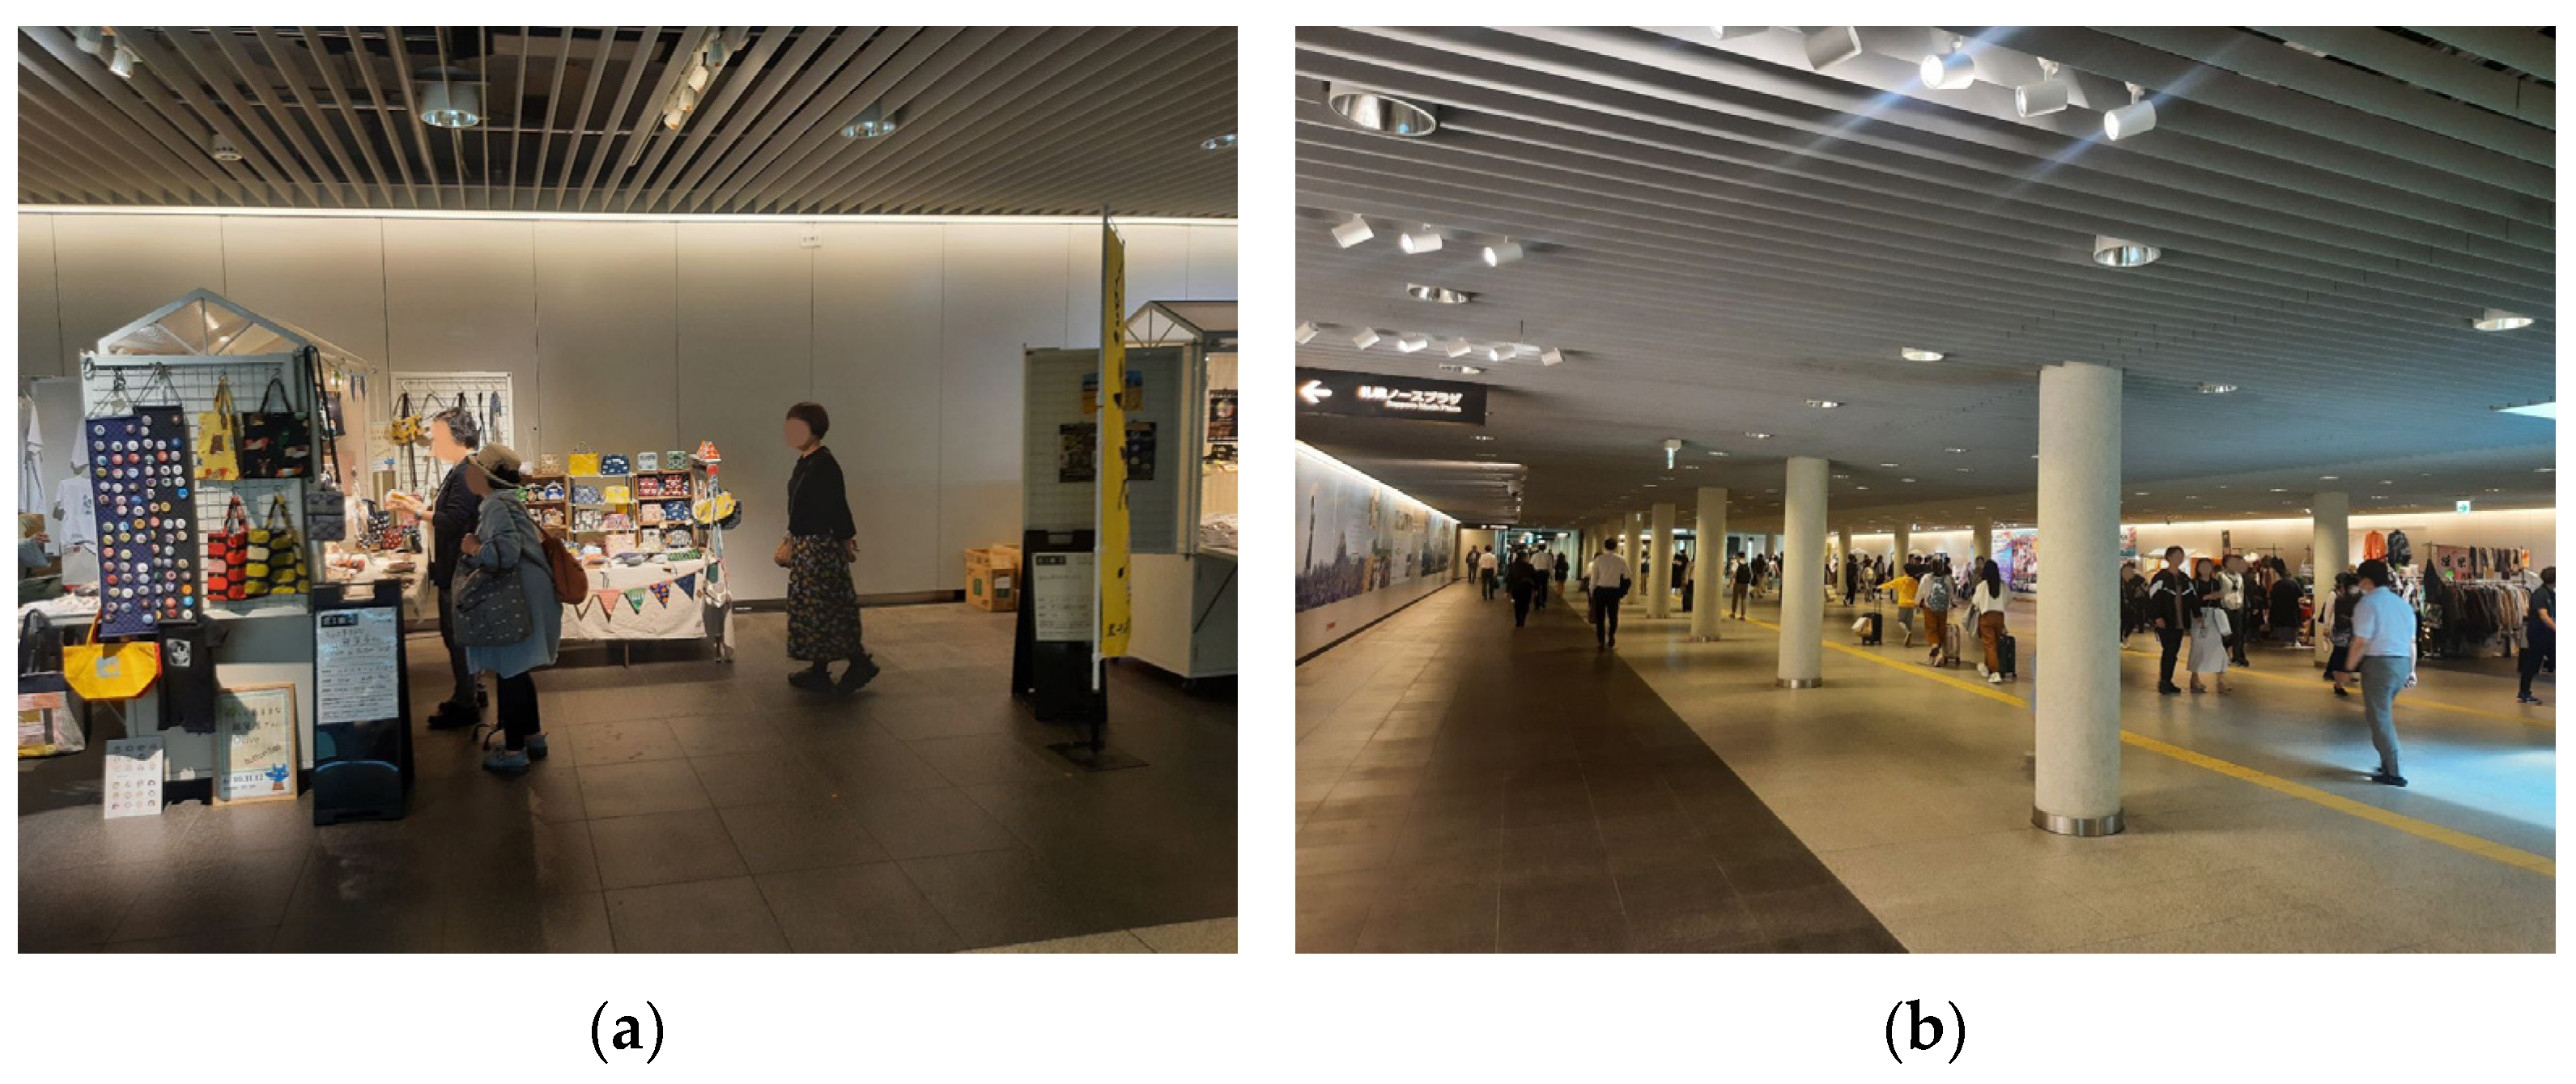
The ChiKaHo section between J1 and J2 is the most developed in terms of infrastructure, function, and design. However, in J2, pedestrian flow significantly decreases when the ambient temperature is +6.8–11.6 °C, which is the lowest temperature parameter among all points. This place acts as a food court, and connections exist on the surface, but there is a preference for choosing an underground pedestrian space. On the surface, the path is connected to open square Kita 3 Jo, which exhibits nearly no points of attraction or permeable facades (that support pedestrian traffic), except during seasonal festivals/events. In the summer, when there are no events, food trucks are located in this area (Figure 13).
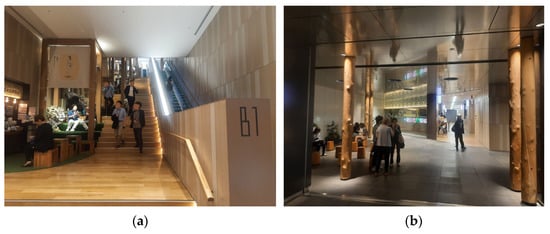
Figure 13.
Photos of J2 in ChiKaHo: (a) west and (b) east sides of the ChiKaHo path.
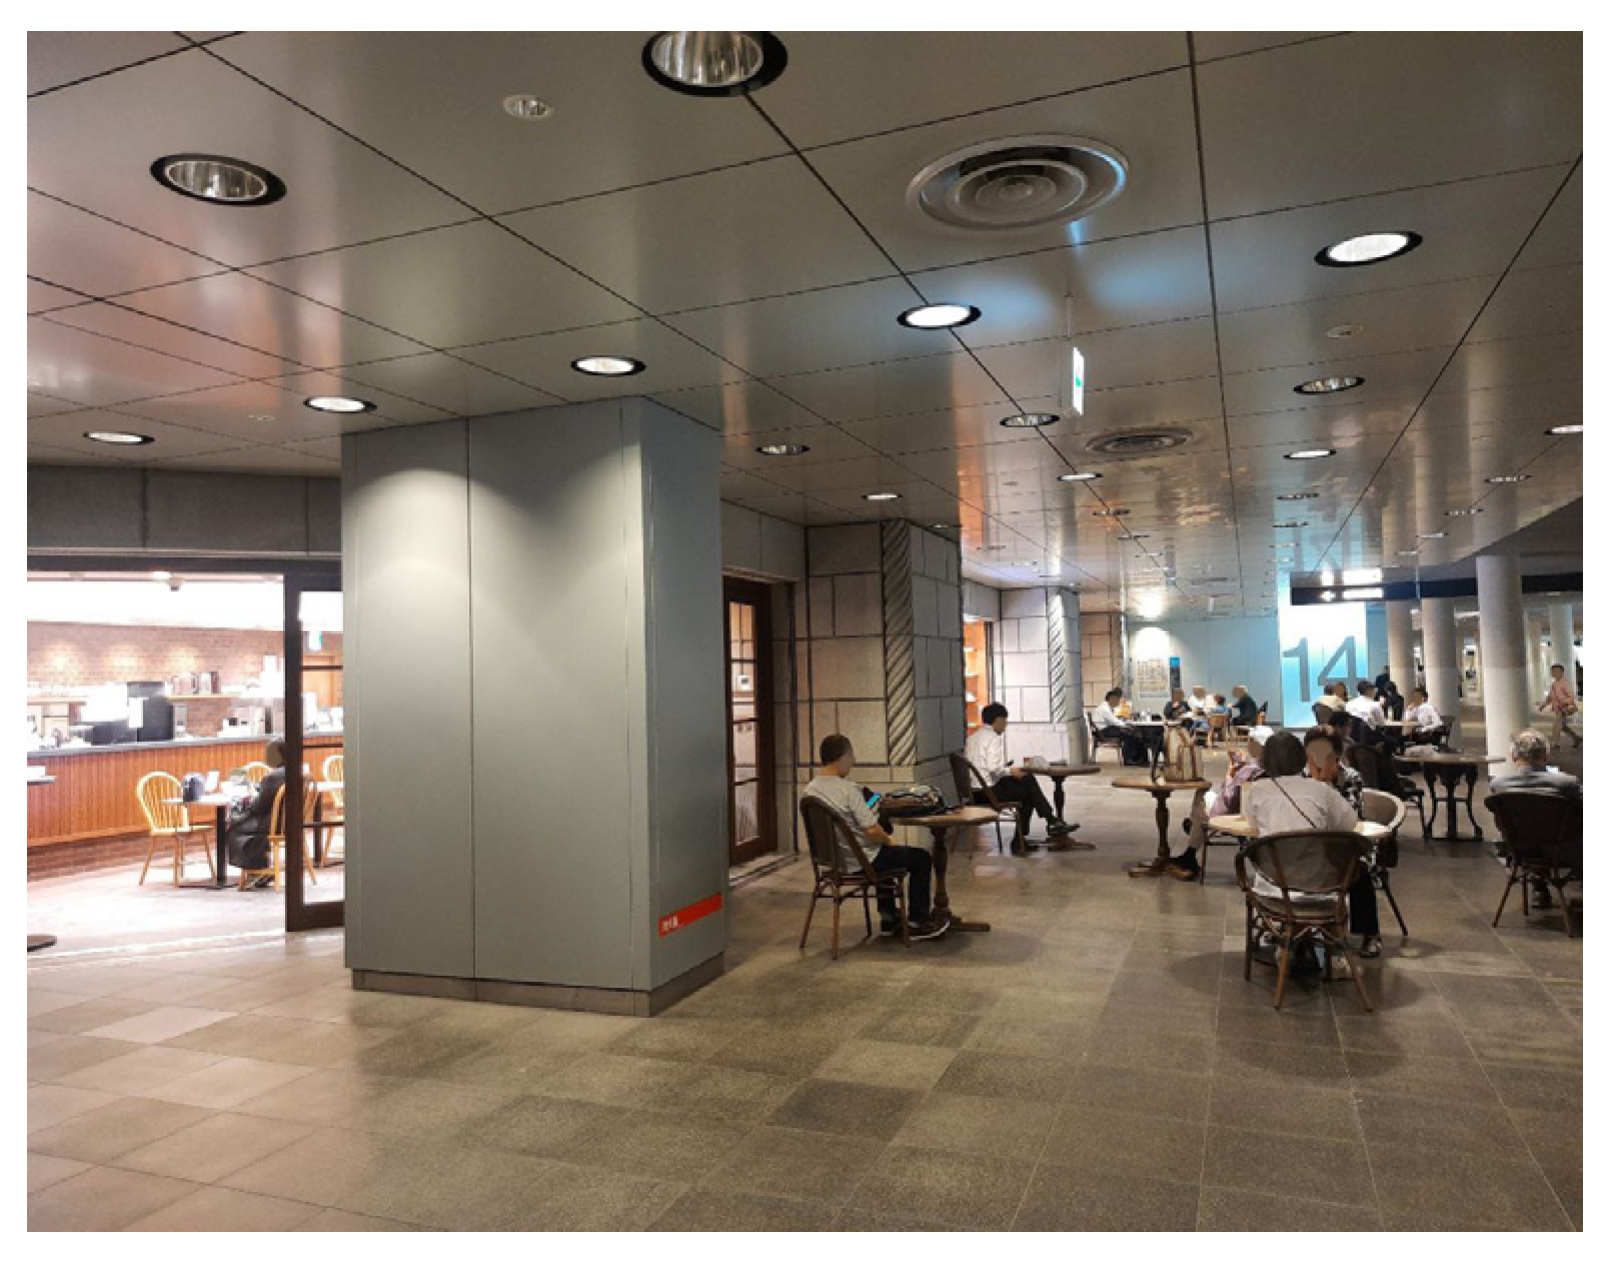
J3 does not generate pedestrian flow (as a station, Figure 14), but it is significant in terms of absolute numbers of transit pedestrian flows (after J1). In addition, it is second among all points, reflecting a temperature change (−2 °C +4.4 °C). Annually, 2–3 points of temperature change occur in this point, influencing pedestrian flow. A similar situation is observed for J4; its period of change begins from + 1.2 °C to 2.8 °C, while that for the second period is from +9.2 °C to 16 °C.

Figure 14.
Photos of J3 in ChiKaHo: (a) west and (b) east sides of ChiKaHo.
The area adjacent to J1 displays the greatest forecast potential throughout the year due to the high correlation between pedestrian flow and ambient temperature. The linear predictive model created for J1 helps us to understand changes in foot traffic at a specific point and the impact of temperature changes on local retail businesses and services. On the surface, a potential exists for the development of the aboveground and underground parts of the two blocks adjacent to J1 due to the presence of free land plots.
As a point least susceptible to seasonal changes, J4 (Odori) has a low predictive potential on the one hand and indicates the instability of pedestrian flow and the lack of high dependence on temperature changes on the other hand. However, the location of the open public space in close proximity (Odori Park, the site of the winter festival) in winter increases the desire of pedestrians to use the underground space more frequently than they do the aboveground space (Figure 15).

Figure 15.
Photo of J4 in ChiKaHo.
3.5. Development of Underground Space
Extending the period of subway use and using its functions as a public space can encourage year-round communication/interaction among city users/residents due to the long winters in Sapporo. Toward this end, expanding the research locations with an emphasis on the entrances and exits from the underground pedestrian space to assess the potential of the existing points of attraction and the density of the surrounding buildings for a rational economic component is recommended.
The space at J3 requires modification to the existing structure to improve its resistance to foot traffic and climate resistance.
Expanding access to the entrance to ChiKaHo from the underground floors of adjacent buildings is necessary, especially due to the extremely narrow corridors surrounding J3, which renders the function of the underground space as purely for transport.
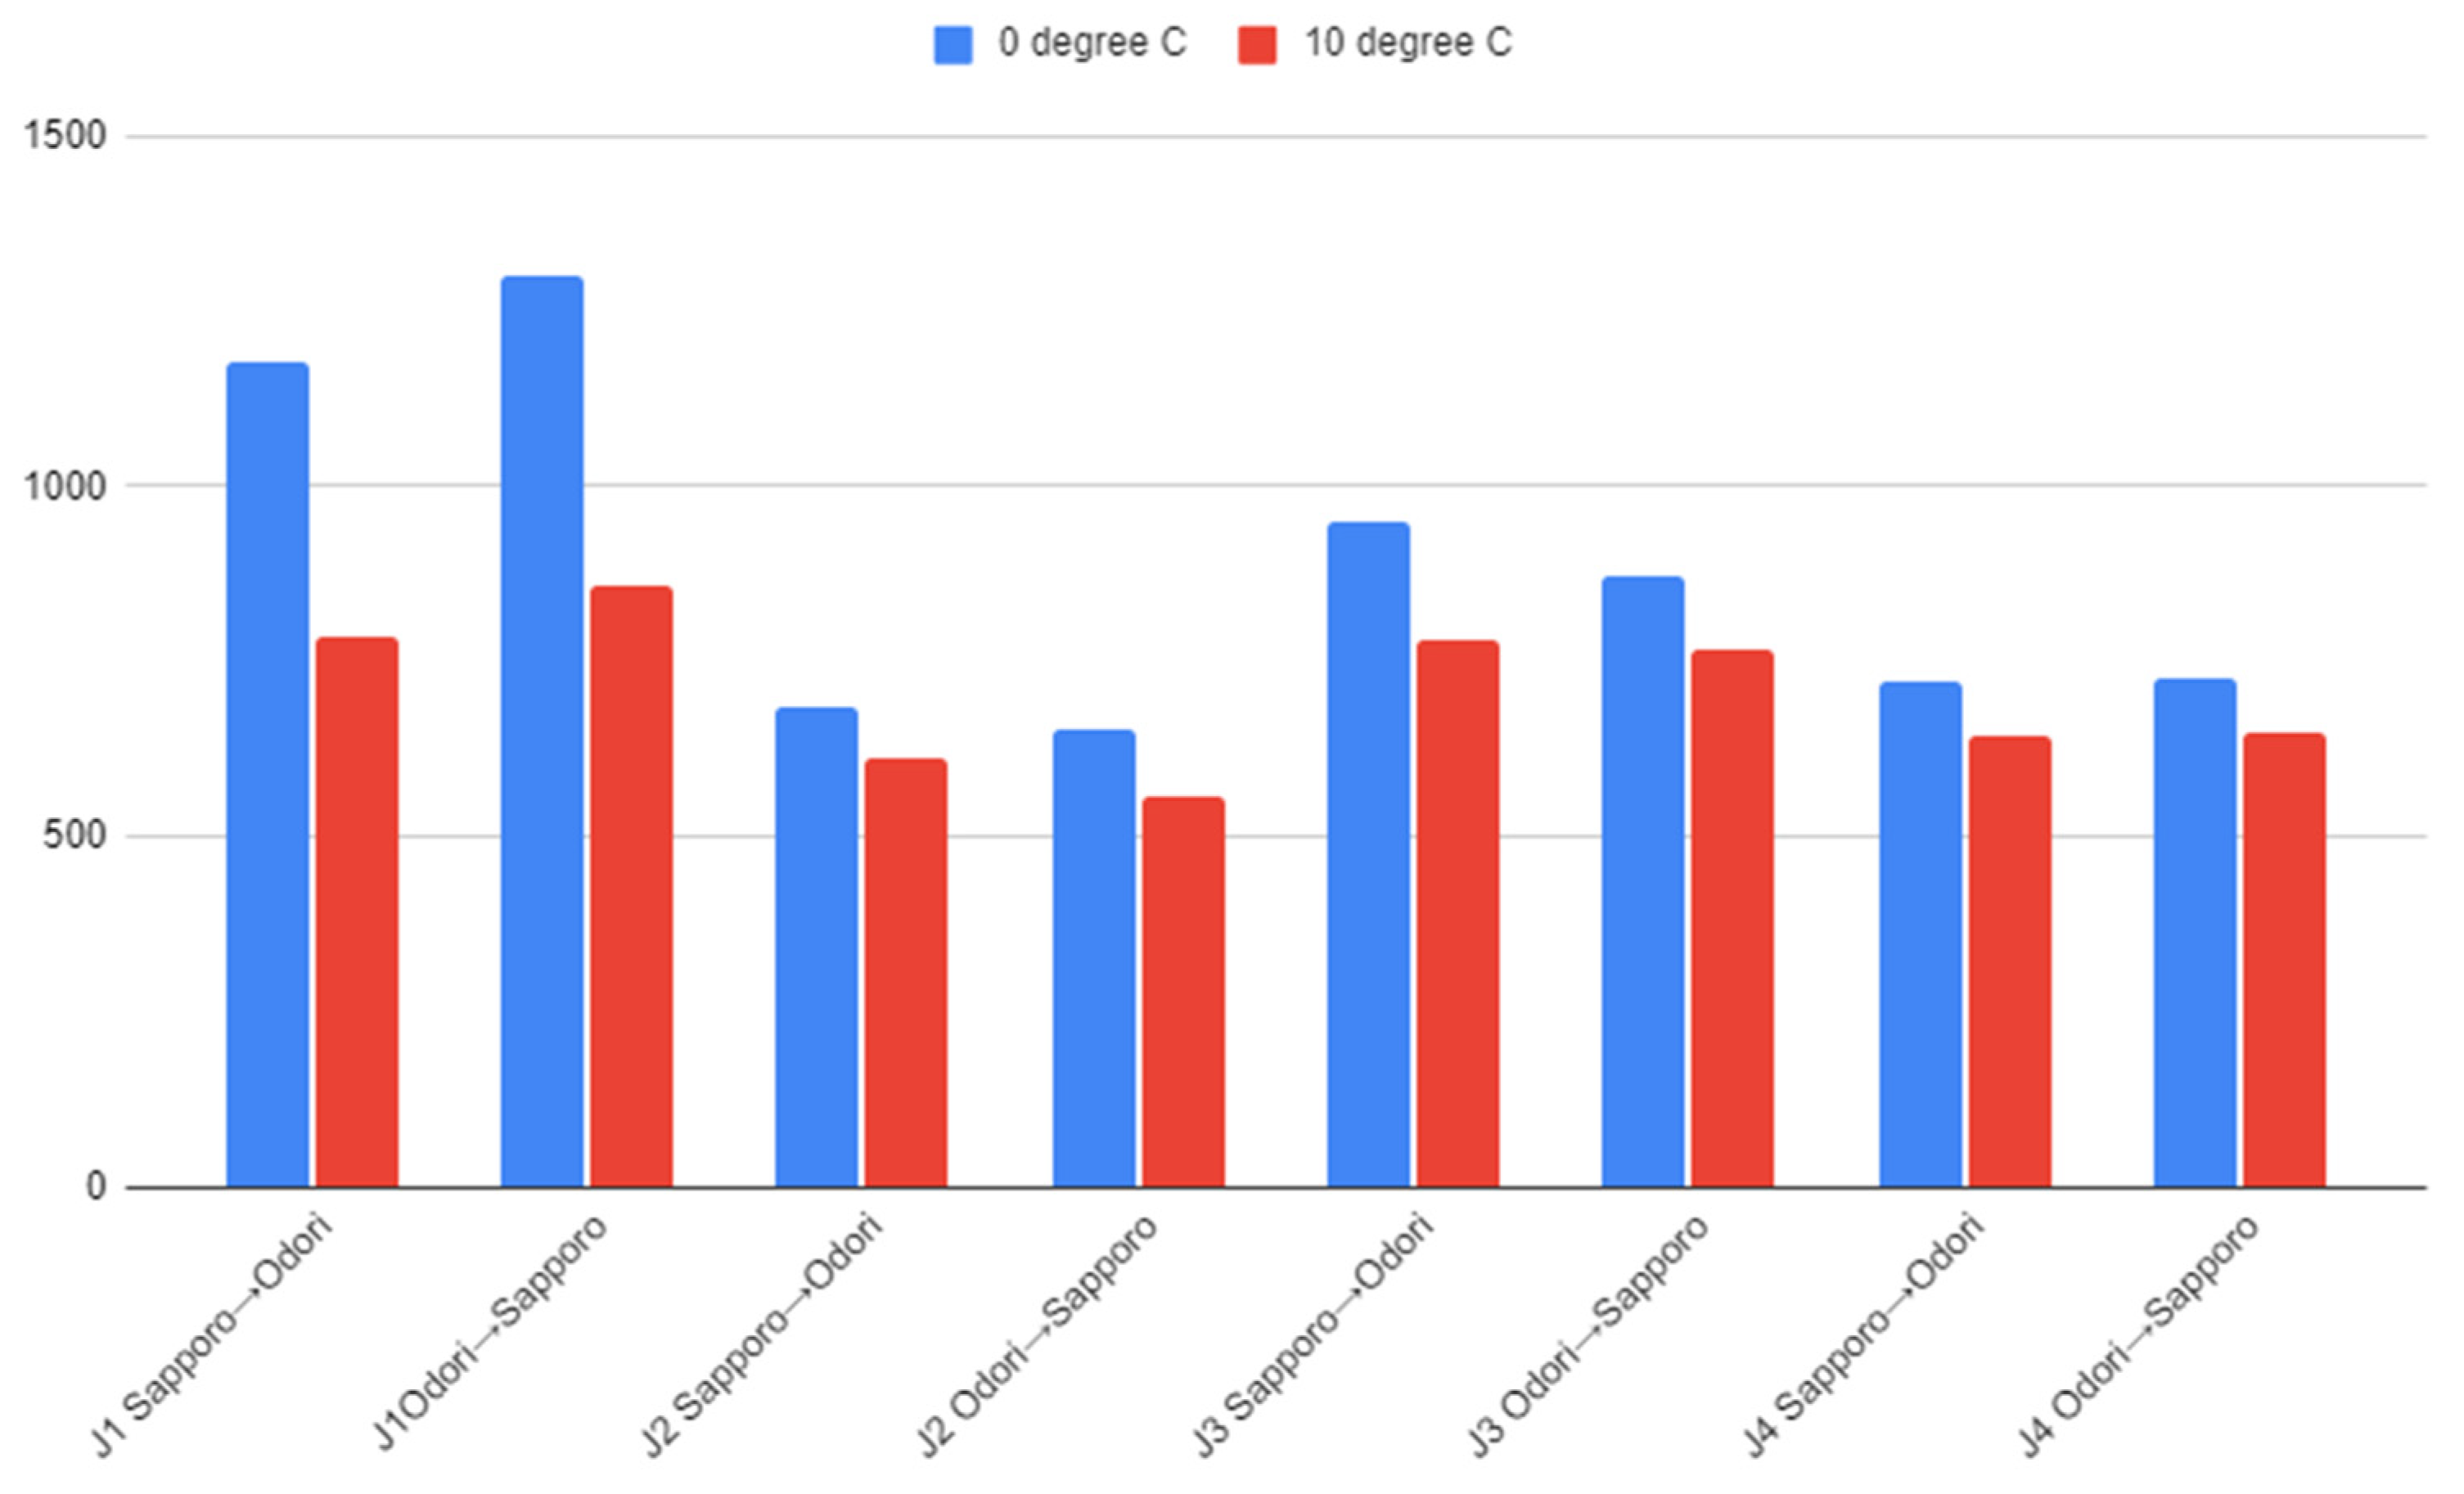
If the dynamic changes in pedestrian flow from J1 to J4 are considered during the year, certain patterns emerge. An increase in flow is noted in J1 during the winter, and a sharp decrease of 25–30% is noted in the period from 0 °C to 10 °C in the direction from Sapporo to Odori and by 24% from Odori to Sapporo. In addition, pedestrian flow from the Odori to Sapporo Stations is, on average, 7.5% more intense compared with that of the opposite direction in the period from 9:30 to 16:00. Moreover, a sharp decrease in pedestrian flow is noted in J1 and J2 (Figure 16).

Figure 16.
Change in pedestrian flow per 15-minute interval from 9:30 to 16:00 in ChiKaHo at the observation points for average temperatures of 0 °C and 10 °C from Sapporo to Odori Station with two directions, namely from Sapporo to Odori (J1, J2, J3, and J4) and the opposite direction, from Odori to Sapporo Station (2021–2022).
For J3, the decrease in pedestrian flow from Sapporo to Odori Station is smoother compared with J1 (15%); in the opposite direction (from Odori to Sapporo Station), the decrease is insignificant (5.5%) in terms of the temperature range from 0 °C to +10 °C. In general, the difference in the intensity of pedestrian flow from Sapporo Station to Odori for J1 and J3 is 20% at 0 °C and 10.5% at 10 °C; in the opposite direction, this intensity is 33% at 0 °C and 20% at 10 °C.
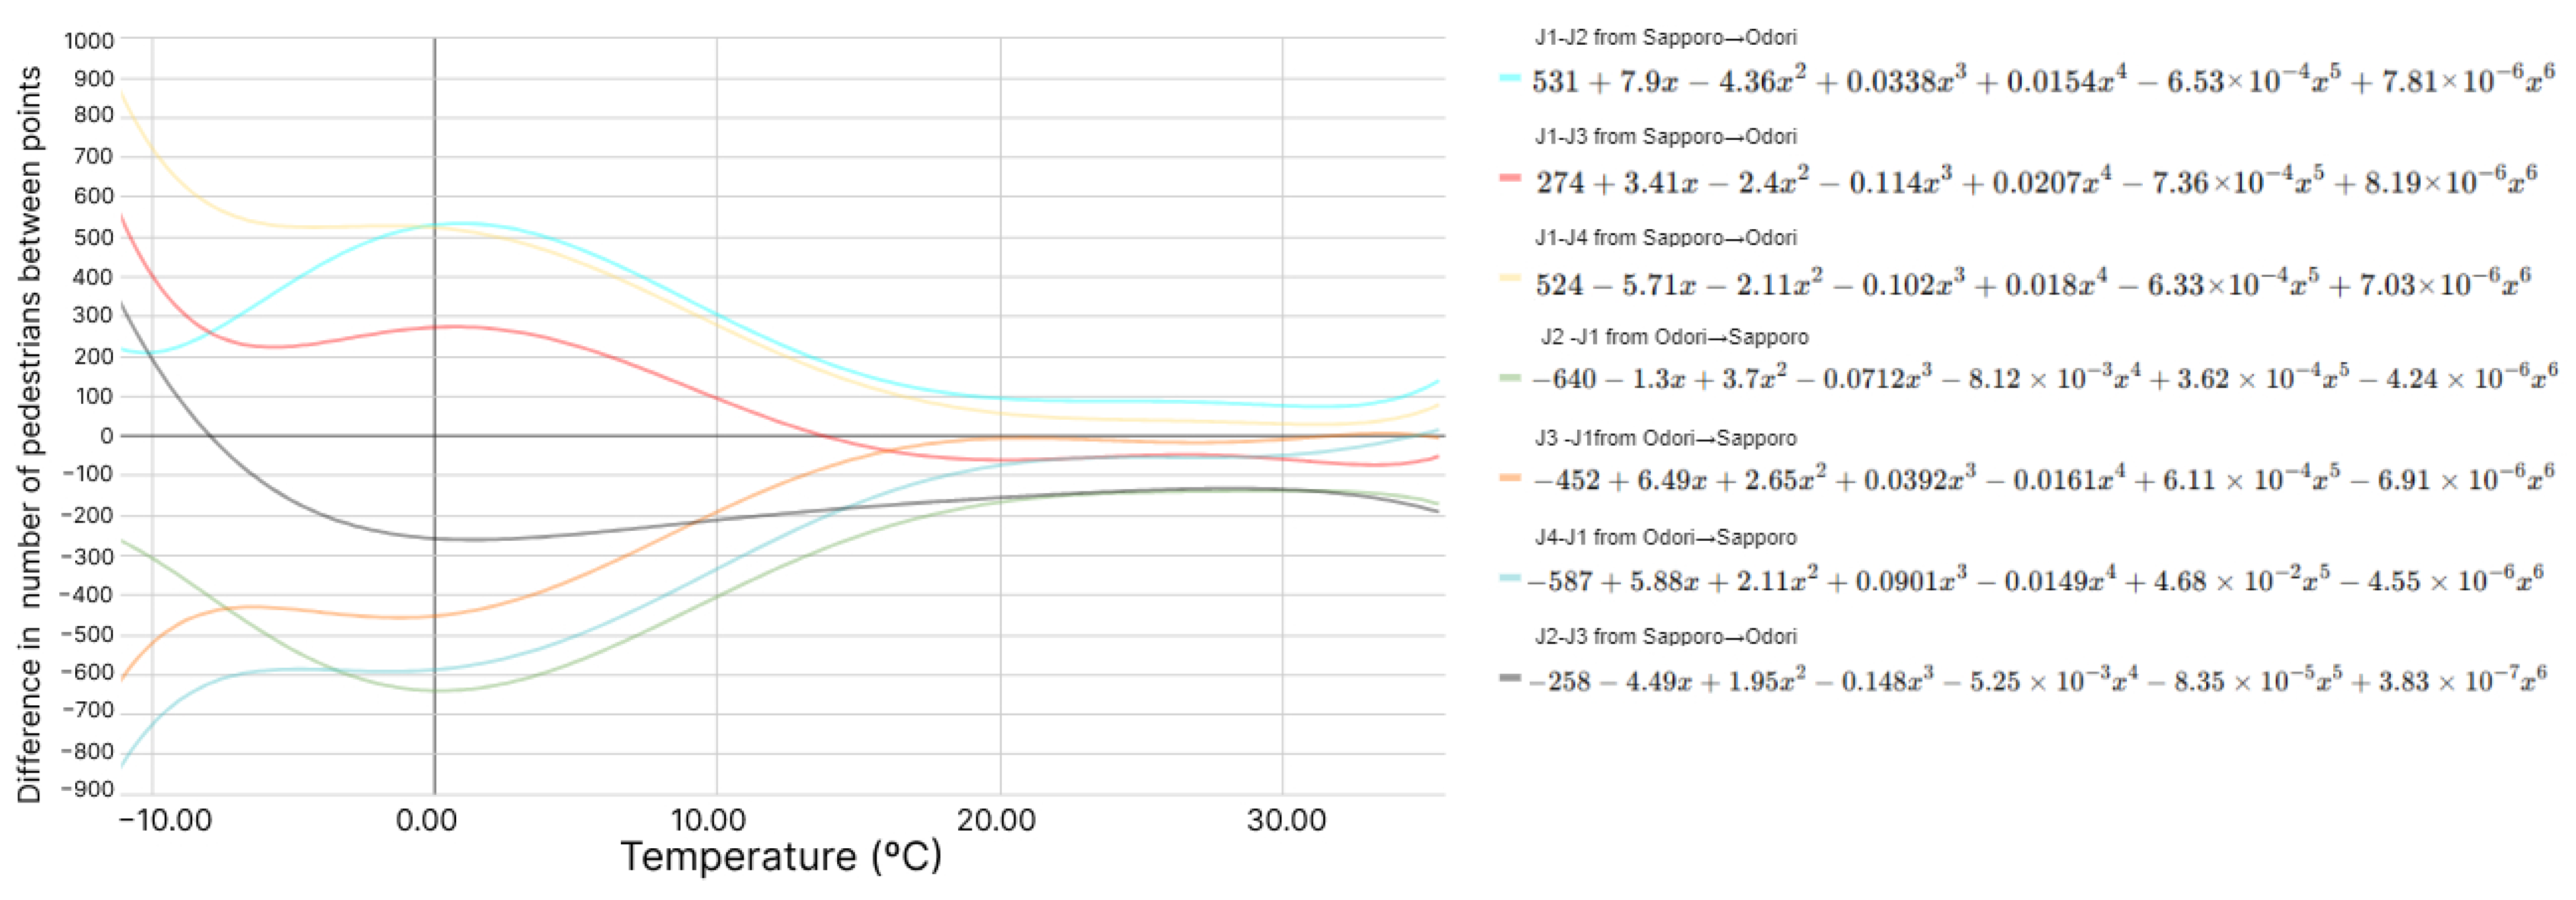
A decrease in flow at J1 influences pedestrian flow at J2, but it is partially compensated for by the flow from J3 (Figure 17). For J2, the decrease in pedestrian flow in both directions with an increase in temperature from 0 °C to +10 °C is approximately 15%, which is a similar percentage of decrease for J4.

Figure 17.
Influence of the observation points of pedestrian flow on one another according to direction of movement and temperature changes.
For ChiKaHo J2–J4 (mainly adjacent to J3), the inclusion of adjacent buildings is recommended to expand space and access to the ChiKaHo, which will enhance the connectivity of the underground space and the aboveground part.
Expanding the space in the underground alley will likely entail the modernization of adjacent buildings.
Thus, a balance must occur between the development of underground public space (the layout of which is linear and easy to navigate) and the duplication of the major pedestrian axis of the street, which could create opportunities for selecting climatic conditions while maintaining the route. The reason is that if the ChiKaHo underground were to be developed more functionally, then the functions on the ground and the design of the street must differ.
In addition, the possibility exists that the presence of vacant land on the surface (lack of development) in combination with other functional characteristics will render the pedestrian flow at J1 subject to seasonal climatic dependencies.
In terms of the development of the underground network beyond ChiKaHo, the total length of the underground pedestrian space in Sapporo is approximately 4.2 km when excluding Sapporo Station and 6 km when including the Sapporo Station.
In a cold city, the correlation between seasonal temperature changes and pedestrian traffic likely determines the sustainability of the design of underground public space, including the significant standard deviation of pedestrian volumes in the spring and autumn seasons compared with those of winter and summer—when the design and functionality of the space invariably attract users.
4. Discussion
The study reveals the impact of climatic seasonal changes in Sapporo, which is located in a cold-climate region, on the use of underground public space. The study identified periods of temperature changes that exert the greatest impact on changes in pedestrian activities in the ChiKaHo.
A number of studies have been conducted on this type of space, such as those in Montreal, Toronto, and Harbin, among others, which are also located in cold-climate regions and exhibit extensive networks of underground pedestrian pathways linked to the city center. However, these studies mainly focused on the concentration and distribution of pedestrians in space, sustainability of pedestrian flow, changes in flow during the day/hour according to the day of the week, weather conditions, events, the dependence of pedestrian flow on the configuration of the space [44], the perception of space based on surveys and space evaluation [33], functional saturation [44], and perception of pedestrian flow [44]. The current study complements the existing studies on the theory of the design of comfortable public spaces in cold-climate regions.
Nevertheless, a few studies on open public spaces in cold-climate areas (e.g., Vermont) failed to identify a clear relationship between pedestrian flow and weather factors due to the low percentage of influence for use in predictive models. However, these studies propose that it is still necessary to take it into account [6]. A majority of scholars highlight significant factors, such as precipitation and wind speed, which affect pedestrian activities in Montreal in winter [5]. In this regard, one can infer that even in relatively close locations, the microclimate, environmental configuration, and local behavioral patterns are crucial. The principle of increasing the thermal comfort of open public spaces in cold-climate areas using design according to season is well examined, that is, minimizing wind load by creating green spaces and providing shade during summer [11].
The literature has established that entrances to pedestrian zones play a significant role [44] in the distribution of pedestrian flow. In addition, previous scholars posit that the pedestrian environment is an evolutionary system and develops over time, thus, accumulating potential and expanding space.
In cold-climate cities, pedestrian traffic outdoor may be reduced by up to 20% in winter [6]. Also, pedestrian traffic in underground spaces may be reduced by up to 50% compared to street level [45,48]. Sapporo shows a summer reduction of traffic in ChiKaHo depending on the point of study of up to 59% relative to winter use.
According to Zacharias, two approaches can be used for planning and managing pedestrian flow, namely, a concentrated and compact pedestrian flow with clear zoning and a distributed one that is tied to the environment. Nowadays, ChiKaHo works as the first version of the system; however, developing connections with the environment that affects specific areas is preferable.
Other approaches are available for examining pedestrian flow as an entire system instead of as points and specific locations (particle stream models), such as seemingly random behavior that cannot be explained by environmental factors and are dependent on a specific subject. However, a generally accepted notion is that pedestrians react to certain space design elements due to the uneven distribution of pedestrians in available pedestrian spaces [44].
To determine the efficiency of using similar objects, such as shopping centers, metric gravity models are used based on the idea of the attractiveness of competition. Traffic generators, such as stations and transport hubs, play an immense role, such that their absence creates the problems of public presence.
For public pedestrian spaces, the shortest route, which is an important metric, influences the movement of pedestrians along with ease of orientation in space due to which cognitive maps of the city and space appear. In addition to microclimate, noise influences the intensity and speed of pedestrian flow, as well as the perception of the environment. Moreover, if minimizing the impact of cold climate in the underground space is an easy task (by protecting from wind and increasing microclimatic comfort), then the minimization of noise lacks scholarly attention.
The major factors that influence the length of walking distance in the underground pedestrian space from metro stations are saturation of functions and land use: commercial or institutional contribute to an increase in the length of the pedestrian route [54]. An opinion exists about the lack of a generator of public movement (e.g., a station)—the main contribution to the problem of maintaining public space, the isolation of space from the communication channels of the city.
This study identified the relationship between changes in ambient temperature and pedestrian traffic in four locations along an underground pedestrian path and found specific temperature ranges of change that affect each location. The value of the result lies in enhancing the current understanding of the influence of climate and functional features of underground public spaces in cold-climate cities on pedestrian behavior.
This study has its limitations in terms of its application to specific location and uses (underground public spaces), climatic characteristics, and the cultural and social behavioral patterns of Sapporo residents. For future studies on ChiKaHo, localized surveys are required to qualitatively and quantitatively assess perceptions of underground space and tracking of pedestrian routes.
While this study is based on data from Sapporo’s underground public space ChiKaHo, the conclusions are broadly applicable to other cities with cold climates, particularly those with similar urban forms and seasonal fluctuations in temperature. However, it should be acknowledged that variations in cultural, social, and built environments can influence the transferability of the findings. These findings can be applied to cities in Northern Japan.
Urban planners and government officials in other cold-climate cities can use these data to develop adaptive policies to improve their cities’ year-round pedestrian accessibility and comfort to enhance the livability of underground pedestrian networks under the conditions of a declining population. The prediction of flows in public spaces in cold-climate cities, in general, is of practical importance for local businesses.
5. Conclusions
The results revealed that underground public spaces that serve commute functions are subject to seasonal temperature changes in terms of the number of pedestrians (from 31% to 59%). The commonly observed temperature ranges were approximately +1.2 °C and +10 °C. In addition, temperature ranges of changes in the pedestrian flow were identified according to location.
Out of the four points, J1 (the southern exit of Sapporo Station) exhibited a decrease in the number of pedestrians during spring, which begins at a temperature of −2 °C + 1.2 °C. For J2, the temperature range is significantly shifted to the plus zone: +6.8–11.6 °C. For J3, it ranges from −2 °C + 4.4 °C to +10–13.2 °C. J4 (Odori Station) has two temperature intervals in changing pedestrian behavior: +1.2–2.8 °C and 9.2–16 °C.
At J1, which is located close to a large transport hub, a decrease in pedestrian flow during spring is the earliest. The possible reasons are the close proximity to the station gates and the option of users to take routes outside the ChiKaHo, as well as mixed-use services along the path, attached rebuild buildings, wide public spaces and waiting areas, and its renovated design. J2 is located under an open public square; thus, the pedestrian activity decreases at the lowest temperature range of the four locations. The presence of an open public space in an immediate vicinity is considered one of the reasons that force pedestrians to use the underground space in this area longer during a transition season. In addition, dependence on flows at J1 and J3 indicates a sharp decrease in pedestrian traffic at J1 toward Odori Station. A partial compensation is observed from J3 toward Sapporo Station, as well as additional functions, such as food courts. The lack of design and functional diversity for J3 (except for the local crafts market) is a potential reason for the high value of temperature ranges in which pedestrian behavior changes (second among the observed points). Similar to J2, J4 is adjacent to an open public space on the surface (Odori Park) and close to the second largest station (after Sapporo). In addition, it has a wide underground public space with a rest area and double-height lighting. Thus, the value of the results is that it can enhance the current understanding of the moment of change in pedestrian flow, as well as the possible influence of design and functional usage of space at the moment of change (temperature range). In the future, the assessment of these aspects could lead to accurate forecasts in the use of multifunctional underground pedestrian spaces in cold-climate areas. By identifying the relationship between temperature fluctuations and pedestrian flow, this study’s findings offer a more nuanced understanding of how cold-climate cities can adapt their public space design for each season.
This study identified the period of declining pedestrian traffic that would gradually allow local businesses to adapt. The results of this study show accurate temperature ranges; to mitigate a drop in pedestrian flow, we plan to continue this study on the assessment and perception of design in ChiKaHo by quantitatively validating the hypotheses. We intend to obtain new results on the impact of urban design to improve the sustainability of the underground space. As the ChiKaHo space is not uniformly developed with a concentration of functions and public areas surrounding the Sapporo and Odori Stations, this study poses a few hypotheses for the design approach of the underground pedestrian space ChiKaHo and its effective usage that should be studied further:
- Create additional sources of natural light through the creation of atriums and the design of interior lighting in newly renovated buildings from the first floor to underground. Since the opening of the D-Lifeplace building, this space has had high occupation and has attracted users for recreation and work purposes. The building was completed in May 2023, following the data-collection period for this study.
- Include underground floors of buildings located near the underground space. This should be done to increase access to ChiKaHo and expand the use of space and its functional diversity and saturation. This will allow for the creation of a network of connected spaces (including inside the buildings) that is resistant to the influence of cold-climate with the use of elevators and escalators. One possible reason for the reduced pedestrian traffic to J2 point at later dates is maximizing the number of accessible entrances to buildings directly from the underground space, mitigating the need to go to the surface.
- Identify retention spaces along walking spaces. In ChiKaHo, existing spaces feature different attractive elements; therefore, it is important to understand what specifically influences the choice of pedestrian route and the extent of this influence.
- Expand the pedestrian area in the narrow areas of ChiKaHo. This hypothesis involves point J3, which has narrowed the parameters of the path corridor as a result of the placement of old buildings along it; thus, there is no possibility to place additional functions without constricting traffic and worsening safety. According to the research data, this location has intense pedestrian traffic and a minimum of two temperature-change points; however, there is a possibility to average these points through redevelopment.
- Include natural elements in finishes and materials to reflect local identity, temporal design, and flexible and modular furniture. The example of point J2 suggests that imitation-wooden columns and locally designed furniture can be an attractive design feature for the users of the space.
The abovementioned approach to spatial design could improve public perception of the public-space network and create active, all-seasons traffic. This will be considered as a plan for future study.
Author Contributions
Conceptualization, M.K. and T.S.; methodology, M.K.; software, M.K.; validation, M.K., T.S. and N.W.; formal analysis, M.K.; investigation, M.K.; resources, M.K.; data curation, M.K.; writing—original draft preparation, M.K.; writing—review and editing, T.S. and N.W.; visualization, M.K.; supervision, T.S. and N.W. All authors have read and agreed to the published version of the manuscript.
Funding
This work was supported by JSPS KAKENHI, Grant Number JP22K04486.
Institutional Review Board Statement
Not applicable.
Informed Consent Statement
Not applicable.
Data Availability Statement
The raw data supporting the conclusions of this article will be made available by the authors upon request.
Conflicts of Interest
The authors declare no conflicts of interest.
References
- Pressman, N. Developing climate-responsive winter cities. Energy Build. 1988, 11, 11–22. [Google Scholar] [CrossRef]
- Yang, B.; Wang, S.; Yu, S.; Olofsson, T. Soft mobility in a winter-dominant city: A case study comparing Nordic and non-Nordic residents in Umeå. Cities 2020, 102, 102727. [Google Scholar] [CrossRef]
- Liang, S.; Leng, H.; Yuan, Q.; Wang, B.; Yuan, C. How does weather and climate affect pedestrian walking speed during cool and cold seasons in severely cold areas? Build. Environ. 2020, 175, 106811. [Google Scholar] [CrossRef]
- An, L.; Hong, B.; Cui, X.; Geng, Y.; Ma, X. Outdoor thermal comfort during winter in China’s cold regions: A comparative study. Sci. Total Environ. 2021, 768, 144464. [Google Scholar] [CrossRef] [PubMed]
- Miranda-Moreno, L. Temporal trends and the effect of weather on pedestrian volumes: A case study of Montreal, Canada. Transp. Res. Part D Transp. Environ. 2013, 22, 54–59. [Google Scholar] [CrossRef]
- Aultman-Hall, L.; Lane, D.; Lambert, R. Assessing impact of weather and season on pedestrian traffic volumes. Transp. Res. Rec. 2009, 2140, 35–43. [Google Scholar] [CrossRef]
- Zacharias, J. Underground pedestrian trips-trip generation, spatial distribution and activities in the Montréal underground. Tunn. Undergr. Space Technol. 2015, 46, 46–51. [Google Scholar] [CrossRef]
- Chen, L.; Ng, E. Outdoor thermal comfort and outdoor activities: A review of research in the past decade. Cities 2012, 29, 118–125. [Google Scholar] [CrossRef]
- Liu, Z.; Zhao, X.; Jin, Y.; Jin, H.; Xu, X. Prediction of outdoor human thermal sensation at the pedestrian level in high-rise residential areas in severe cold regions of China. Energy Procedia 2019, 157, 51–58. [Google Scholar] [CrossRef]
- Jin, H.; Liu, S.; Kang, J. The thermal comfort of urban pedestrian street in the severe cold area of Northeast China. Energy Procedia 2017, 134, 741–748. [Google Scholar] [CrossRef]
- Jin, H.; Liu, S.; Kang, J. Thermal comfort range and influence factor of urban pedestrian streets in severe cold regions. Energy Build. 2019, 198, 197–206. [Google Scholar] [CrossRef]
- Sun, C.; Lian, W.; Liu, L.; Dong, Q.; Han, Y. The impact of street geometry on outdoor thermal comfort within three different urban forms in severe cold region of China. Build. Environ. 2022, 222, 109342. [Google Scholar] [CrossRef]
- Guo, Z.; Setoguchi, T.; Watanabe, N.; Huo, K. Public open space design study on the basis of microclimate and spatial behavior in hot and cold weather conditions in downtown area. Mod. Appl. Sci. 2018, 128, 12. [Google Scholar] [CrossRef]
- Liu, K.; Lian, Z.; Dai, X.; Lai, D. Comparing the effects of sun and wind on outdoor thermal comfort: A case study based on longitudinal subject tests in cold climate region. Sci. Total Environ. 2022, 825, 154009. [Google Scholar] [CrossRef]
- Eliasson, I.; Knez, I.; Westerberg, U.; Thorsson, S.; Lindberg, F. Climate and behaviour in a Nordic city. Landsc. Urban Plan. 2007, 82, 72–84. [Google Scholar] [CrossRef]
- Yan, T.; Jin, Y.; Jin, H. Combined effects of the visual-thermal environment on the subjective evaluation of urban pedestrian streets in severely cold regions of China. Build. Environ. 2023, 228, 109895. [Google Scholar] [CrossRef]
- Li, K.; Liu, M. Combined influence of multi-sensory comfort in winter open spaces and its association with environmental factors: Wuhan as a case study. Build. Environ. 2024, 248, 111037. [Google Scholar] [CrossRef]
- Leng, H.; Liang, S.; Yuan, Q. Outdoor thermal comfort and adaptive behaviors in the residential public open spaces of winter cities during the marginal season. Int. J. Biometeorol. 2020, 64, 217–229. [Google Scholar] [CrossRef] [PubMed]
- Hunt, D.; Makana, L.; Jefferson, I.; Rogers, C. Liveable cities and urban underground space. Tunn. Undergr. Space Technol. 2016, 55, 8–20. [Google Scholar] [CrossRef]
- Sun, L.; Leng, J. Research on influencing factors of travel in underground space based on multi-source data: Spatial optimization design for low-carbon travel. Energy Build. 2021, 253, 111524. [Google Scholar] [CrossRef]
- Li, X.; Xu, H.; Li, C.; Sun, L.; Wang, R. Study on the demand and driving factors of urban underground space use. Tunn. Undergr. Space Technol. 2016, 55, 52–58. [Google Scholar] [CrossRef]
- Cui, J.; Allan, A.; Taylor, M.; Lin, D. Underground pedestrian systems development in cities: Influencing factors and implications. Tunn. Undergr. Space Technol. 2013, 35, 152–160. [Google Scholar] [CrossRef]
- Delmastro, C.; Lavagno, E.; Schranz, L. Underground urbanism: Master plans and sectorial plans. Tunn. Undergr. Space Technol. 2016, 55, 103–111. [Google Scholar] [CrossRef]
- von der Tann, L.; Sterling, R.; Zhou, Y.; Metje, N. Systems approaches to urban underground space planning and management—A review. Undergr. Space 2020, 5, 144–166. [Google Scholar] [CrossRef]
- Kadaei, S.; Nezam, Z.; González-Lezcano, R.A.; Shokrpour, S.; Mohammadtaheri, A.; Doraj, P.; Akar, U. A new approach to determine the reverse logistics-related issues of smart buildings focusing on sustainable architecture. Front. Environ. Sci. 2023, 10, 1079522. [Google Scholar] [CrossRef]
- Besner, J. Underground space needs an interdisciplinary approach. Tunn. Undergr. Space Technol. 2016, 55, 224–228. [Google Scholar] [CrossRef]
- Vähäaho, I. Underground space planning in Helsinki. J. Rock Mech. Geotech. Eng. 2014, 6, 387–398. [Google Scholar] [CrossRef]
- Vähäaho, I. Development for urban underground space in Helsinki. Energy Procedia 2016, 96, 824–832. [Google Scholar] [CrossRef]
- Besner, J. Planning and developing an underground city with or without a master plan: The Montreal case. In Proceedings of the 15th ACUUS International Conference Proceedings, Seoul, Republic of Korea, 24–26 September 2014. [Google Scholar]
- Besner, J. Cities think underground—Underground space (also) for people. Procedia Eng. 2017, 209, 49–55. [Google Scholar] [CrossRef]
- Sakakura, H.; Shimizu, H.; Itabashi, H. Sapporo’s urban management and roles of the underground path. In Proceedings of the the 11th ACUUS Conference, Athens, Greece, 10–13 September 2007. [Google Scholar]
- Dubos-Golain, A.; Trépanier, M.; Morency, C. Understanding transit use patterns in Montreal. CIRRELT 2017, 64, 1–15. [Google Scholar]
- Boivin, D.J. Montreal’s underground network: A study of the downtown pedestrian system. Tunn. Undergr. Space Technol. 1991, 6, 83–91. [Google Scholar] [CrossRef]
- Zacharias, J. Modeling pedestrian dynamics in Montreal’s underground city. J. Transp. Eng. 2000, 126, 405–412. [Google Scholar] [CrossRef]
- El-Geneidy, A.; Kastelberger, L.; Abdelhamid, H. Montréal’s roots: Exploring the growth of Montréal’s indoor city. J. Transp. Land Use 2011, 4, 33–46. [Google Scholar] [CrossRef]
- Roberts, A.; Christopoulos, G.; Car, J.; Soh, C.; Lu, M. Psycho-biological factors associated with underground spaces: What can the new era of cognitive neuroscience offer to their study? Tunn. Undergr. Space Technol. 2016, 55, 118–134. [Google Scholar] [CrossRef]
- Cui, J.; Allan, A.; Lin, D. SWOT analysis and development strategies for underground pedestrian systems. Tunn. Undergr. Space Technol. 2019, 87, 127–133. [Google Scholar] [CrossRef]
- Zhao, J.; Künzli, O. An introduction to connectivity concept and an example of physical connectivity evaluation for underground space. Tunn. Undergr. Space Technol. 2016, 55, 205–213. [Google Scholar] [CrossRef]
- Zeng, R.; Shen, Z.; Luo, J. Post-occupancy evaluation of user satisfaction: Case studies of 10 urban underground complexes in China. Tunn. Undergr. Space Technol. 2024, 143, 105500. [Google Scholar] [CrossRef]
- Bélanger, P. Underground landscape: The urbanism and infrastructure of Toronto’s downtown pedestrian network. Tunn. Undergr. Space Technol. 2007, 22, 272–292. [Google Scholar] [CrossRef]
- Barker, M. Toronto’s underground pedestrian system. Tunn. Undergr. Space Technol. Inc. Trenchless Technol. Res. 1986, 1, 145–151. [Google Scholar] [CrossRef]
- Zhang, R.; Li, Z.; Hong, J.; Han, D.; Zhao, L. Research on characteristics of pedestrian traffic and simulation in the underground transfer hub in Beijing. In Proceedings of the ICCIT 2009—4th International Conference on Computer Sciences and Convergence Information Technology, Seoul, Republic of Korea, 24–26 November 2009; pp. 1352–1357. [Google Scholar] [CrossRef]
- Hillier, B.; Penn, A.; Hanson, J.; Grajewski, T.; Xu, J. Natural movement: Or, configuration and attraction in urban pedestrian movement. Environ. Plan. B Plan. Des. 1993, 20, 29–66. [Google Scholar] [CrossRef]
- Ma, C.; Peng, F.; Qiao, Y.; Li, H. Influential factors of spatial performance in metro-led urban underground public space: A case study in Shanghai. Undergr. Space 2023, 8, 229–251. [Google Scholar] [CrossRef]
- Zacharias, J. Pedestrian behavior and perception in urban walking environments. J. Plan. Lit. 2001, 16, 3–18. [Google Scholar] [CrossRef]
- Zacharias, J. Reconsidering the impacts of enclosed shopping centres: A study of pedestrian behaviour around and within a festival market in Montreal. Landsc. Urban Plan. 1993, 26, 149–160. [Google Scholar] [CrossRef]
- Boisvert, M. Modeling pedestrian flows in Montréal’s indoor city. In Proceedings of the 10th Congress of the Association of Research Centers devoted to Underground Urban Space (ACUUS), Moscow, Russia, 24–28 January 2005. [Google Scholar]
- Zacharias, J. Planning for pedestrian networks in North American downtowns. J. Adv. Transp. 1994, 28, 141–156. [Google Scholar] [CrossRef]
- Japan Meteorological Agency. Available online: https://www.jma.go.jp/jma/indexe.html (accessed on 6 August 2024).
- The Hokkaido Open Data Promotion Council (HODA). Available online: https://ckan.hoda.jp/dataset/chikaho-jinryu (accessed on 6 August 2024).
- Chuo Ward Weather Observation Record 2019, 2020, 2021, 2022 Years. Available online: https://ckan.hoda.jp/ja/dataset/sapporo_weather (accessed on 6 August 2024).
- Passengers Usage of Sapporo and Odori Subway Stations on Namboku Line, Sapporo City, Transportation Bureau. Available online: https://www.city.sapporo.jp/st/index.html (accessed on 6 August 2024).
- ChiKaHo, Sapporo Station Underground Plaza. Available online: https://www.sapporo-chikamichi.jp/ (accessed on 6 August 2024).
- Zhuo, K.; Zacharias, J. Motivations and expectations in the planned visits to commercial public space post pandemic: A grounded theory approach. J. Leis. Res. 2023, 1–20. [Google Scholar] [CrossRef]


Disclaimer/Publisher’s Note: The statements, opinions and data contained in all publications are solely those of the individual author(s) and contributor(s) and not of MDPI and/or the editor(s). MDPI and/or the editor(s) disclaim responsibility for any injury to people or property resulting from any ideas, methods, instructions or products referred to in the content. |
© 2024 by the authors. Licensee MDPI, Basel, Switzerland. This article is an open access article distributed under the terms and conditions of the Creative Commons Attribution (CC BY) license (https://creativecommons.org/licenses/by/4.0/).