Abstract
Ecological zoning is essential for optimizing regional ecological management and improving environmental protection efficiency. While previous studies have primarily focused on the independent analysis of land use intensity (LUI) and landscape ecological risk (LER), there has been limited research on their coupled relationship. This study, conducted in the Western Jilin (WJL), introduces an innovative ecological zoning method based on the Production–Living–Ecological Space (PLES) framework, which explores the interactions between LUI and LER, filling a gap in existing research. The method employs a coupling coordination degree (CCD) model and Geographic Information System (GIS) technology to construct an LUI-ERI coupling model, which is used to delineate ecological zones. The results indicate that: (1) The PLES in the study area is predominantly production space (PS), with the largest area of transfer being production ecological space (PES) 2784.23 km2, and the most significant transfer in being PS 3112.33 km2. (2) Between 2000 and 2020, both LUI and LER exhibited downward trends, with opposite spatial distribution characteristics. The “middle” intensity zone and “highest” risk zone were the dominant LUI and LER types, covering approximately 46% and 45% of the total area, respectively. (3) The coupling coordination degree between LUI and LER showed a polarized trend, with an overall upward trajectory from 2000 to 2020. (4) The ecological zoning of the WJL can be categorized into an ecological core protection (ECP) zone, ecological potential governance (EPG) zone, ecological comprehensive monitoring (ECM) zone, ecological optimization (EO) zone, and ecological restoration (ER) zone, with the ecological core protection area occupying 61.63% of the total area. This study provides a novel perspective on ecological zoning and offers a systematic scientific basis for regional ecological management and spatial planning.
1. Introduction
The growth of the population, socio-economic development, and climate change have all contributed to significant changes in land use patterns and intensity [1]. These transformations have caused an imbalance in PLES, leading to disruptions in landscape structure, ecological space compression, and interference with ecological processes [2]. These changes have caused habitat fragmentation and pollution, increasing ecological risks at the landscape level [3]. In this context, the concept of “PLES” emphasizes the need for harmonious coexistence among these three aspects in land and ecological space (ES) management. Therefore, it has become urgent in today’s society to clarify the complex interactions between LUI and LER from the PLES perspective and optimize spatial resource allocation through ecological zoning to achieve sustainable development.
Land use change is a key topic in global environmental research and reflects human impacts on the environment [4]. Changes in land use types and intensity play a key role in landscape patterns, affecting ecosystems regionally [5] and cumulatively [6]. These effects vary significantly across regions [7]. In response, the Chinese government has formulated and implemented land spatial planning policies that require local governments to ensure coordinated relationships among spatial utilization, population development, and resource environments in their industrial layout planning. Scholars have studied PLES in terms of its meaning [8], functions [9], interactions [10], and pattern optimization [11]. While international discussions have extensively addressed the multidimensional characteristics of this space, research on the extent of human activities’ impact on its development still needs to be explored. To better understand regional PLES development, quantifying LUI is essential. This helps reveal the impact of human activities on the status of this space. Additionally, integrating land use planning with ecological risk assessment ensures that developmental strategies promote economic growth while safeguarding ecosystem sustainability and stability.
LER has been an important area of ecological risk research since the 1990s. It focuses on how human activities and natural changes affect landscape structures and ecosystem functions [12]. Recently, methodologies such as the “source-sink” landscape theory and landscape index approaches have gained prominence. The “source-sink” theory’s assessment methods suit areas with apparent stress factors. For example, Wan et al. (2022) [13] developed a comprehensive ecological risk assessment system for the Sanjiang Plain wetlands by using urban expansion and road construction as risk sources and landscape ecological patterns and ecosystem service values as risk receptors to analyze the temporal and spatial characteristics of ecological risk. The landscape pattern index method provides a spatial assessment of ecological risks, identifying relationships between landscape elements and their impacts. For instance, Liu et al. (2024) [14] and Kang et al. (2024) [15] employed this method to evaluate LERs in the Loess Plateau and Sanjiang Plain, respectively. Therefore, to comprehensively assess the ecological risks of PLES, utilizing the landscape pattern index method for effective identification and management of ecological risks is essential, along with a systematic analysis of the characteristics of ecological risks across different functional zones.
Exploring the coupling relationship between LUI and LER provides a theoretical foundation for implementing ecological zoning, establishing the concept of ecological zoning as a critical element in ecological protection and restoration projects, and playing a pivotal role in the formulation of regional resource development, protection, and local development policies [16]. Current research predominantly focuses on the spatial correlation between land use changes and LER. For instance, studies on the Yellow River Basin by Du et al. (2023) [17] found that high LER areas are primarily located above 3500 m elevation, while relatively high LER areas are found in plains. Moreover, national-scale studies by Zeng et al. (2024) [18] reveal significant spatial heterogeneity in LUI and LER across China based on multi-scenario simulations. However, despite existing research at the macro scale, studies examining the coupling and coordination relationships at smaller scales remain relatively limited, hindering our understanding of the potential impacts of land use changes on ecosystem services and risks. Ecological zoning research tends to incorporate multiple indicators for analysis, which can more comprehensively reflect the complexity and diversity of ecosystems compared to single-indicator analyses [19]. Existing ecological zoning methods, such as quadrant models or overlay analysis, often directly combine indicators without fully considering their interrelationships. For example, Liu and Tang (2024) [20] and Xie et al. (2024) [21] used quadrant models and overlay analysis to define ecological zones. Therefore, we propose an ecological zoning method that considers the intrinsic relationships and interactions among indicators, enhancing the harmonious coexistence of human activities and natural ecological processes while providing precise decision support for sustainable ecological management and development.
WJL is a crucial grain production base, a critical biological habitat in China, and one of the most ecologically sensitive regions in Northeast China [22]. This region is characterized by arid and variable climate conditions, loose soil, and a propensity for desertification due to wind erosion, displaying typical ecological vulnerability [23]. In recent years, natural factors and human activities have contributed to the degradation of wetlands and grasslands, intensified soil salinization, and the thinning of the black soil layer, resulting in the destruction or loss of the fundamental structures and functions of ecosystems and a reduction in stability [24]. Therefore, there is an urgent need to develop comprehensive ecological zoning plans to address these ecological pressures.
To address the scientific gaps and sustainability needs in WJL, this study incorporates LUI and LER into the research on ecological zoning, aiming to provide effective entry points for ecological management. The specific research objectives are as follows: (1) to analyze the spatiotemporal changes in LUI and LER in WJL from 2000 to 2020; (2) to reveal the coupling coordination relationship between LUI and LER; and (3) to conduct ecological zoning based on the heterogeneity of the CCD. The results of this study can provide practical decision-making solutions for ecological management and risk prevention, promoting sustainable development.
2. Materials and Methods
2.1. Study Area
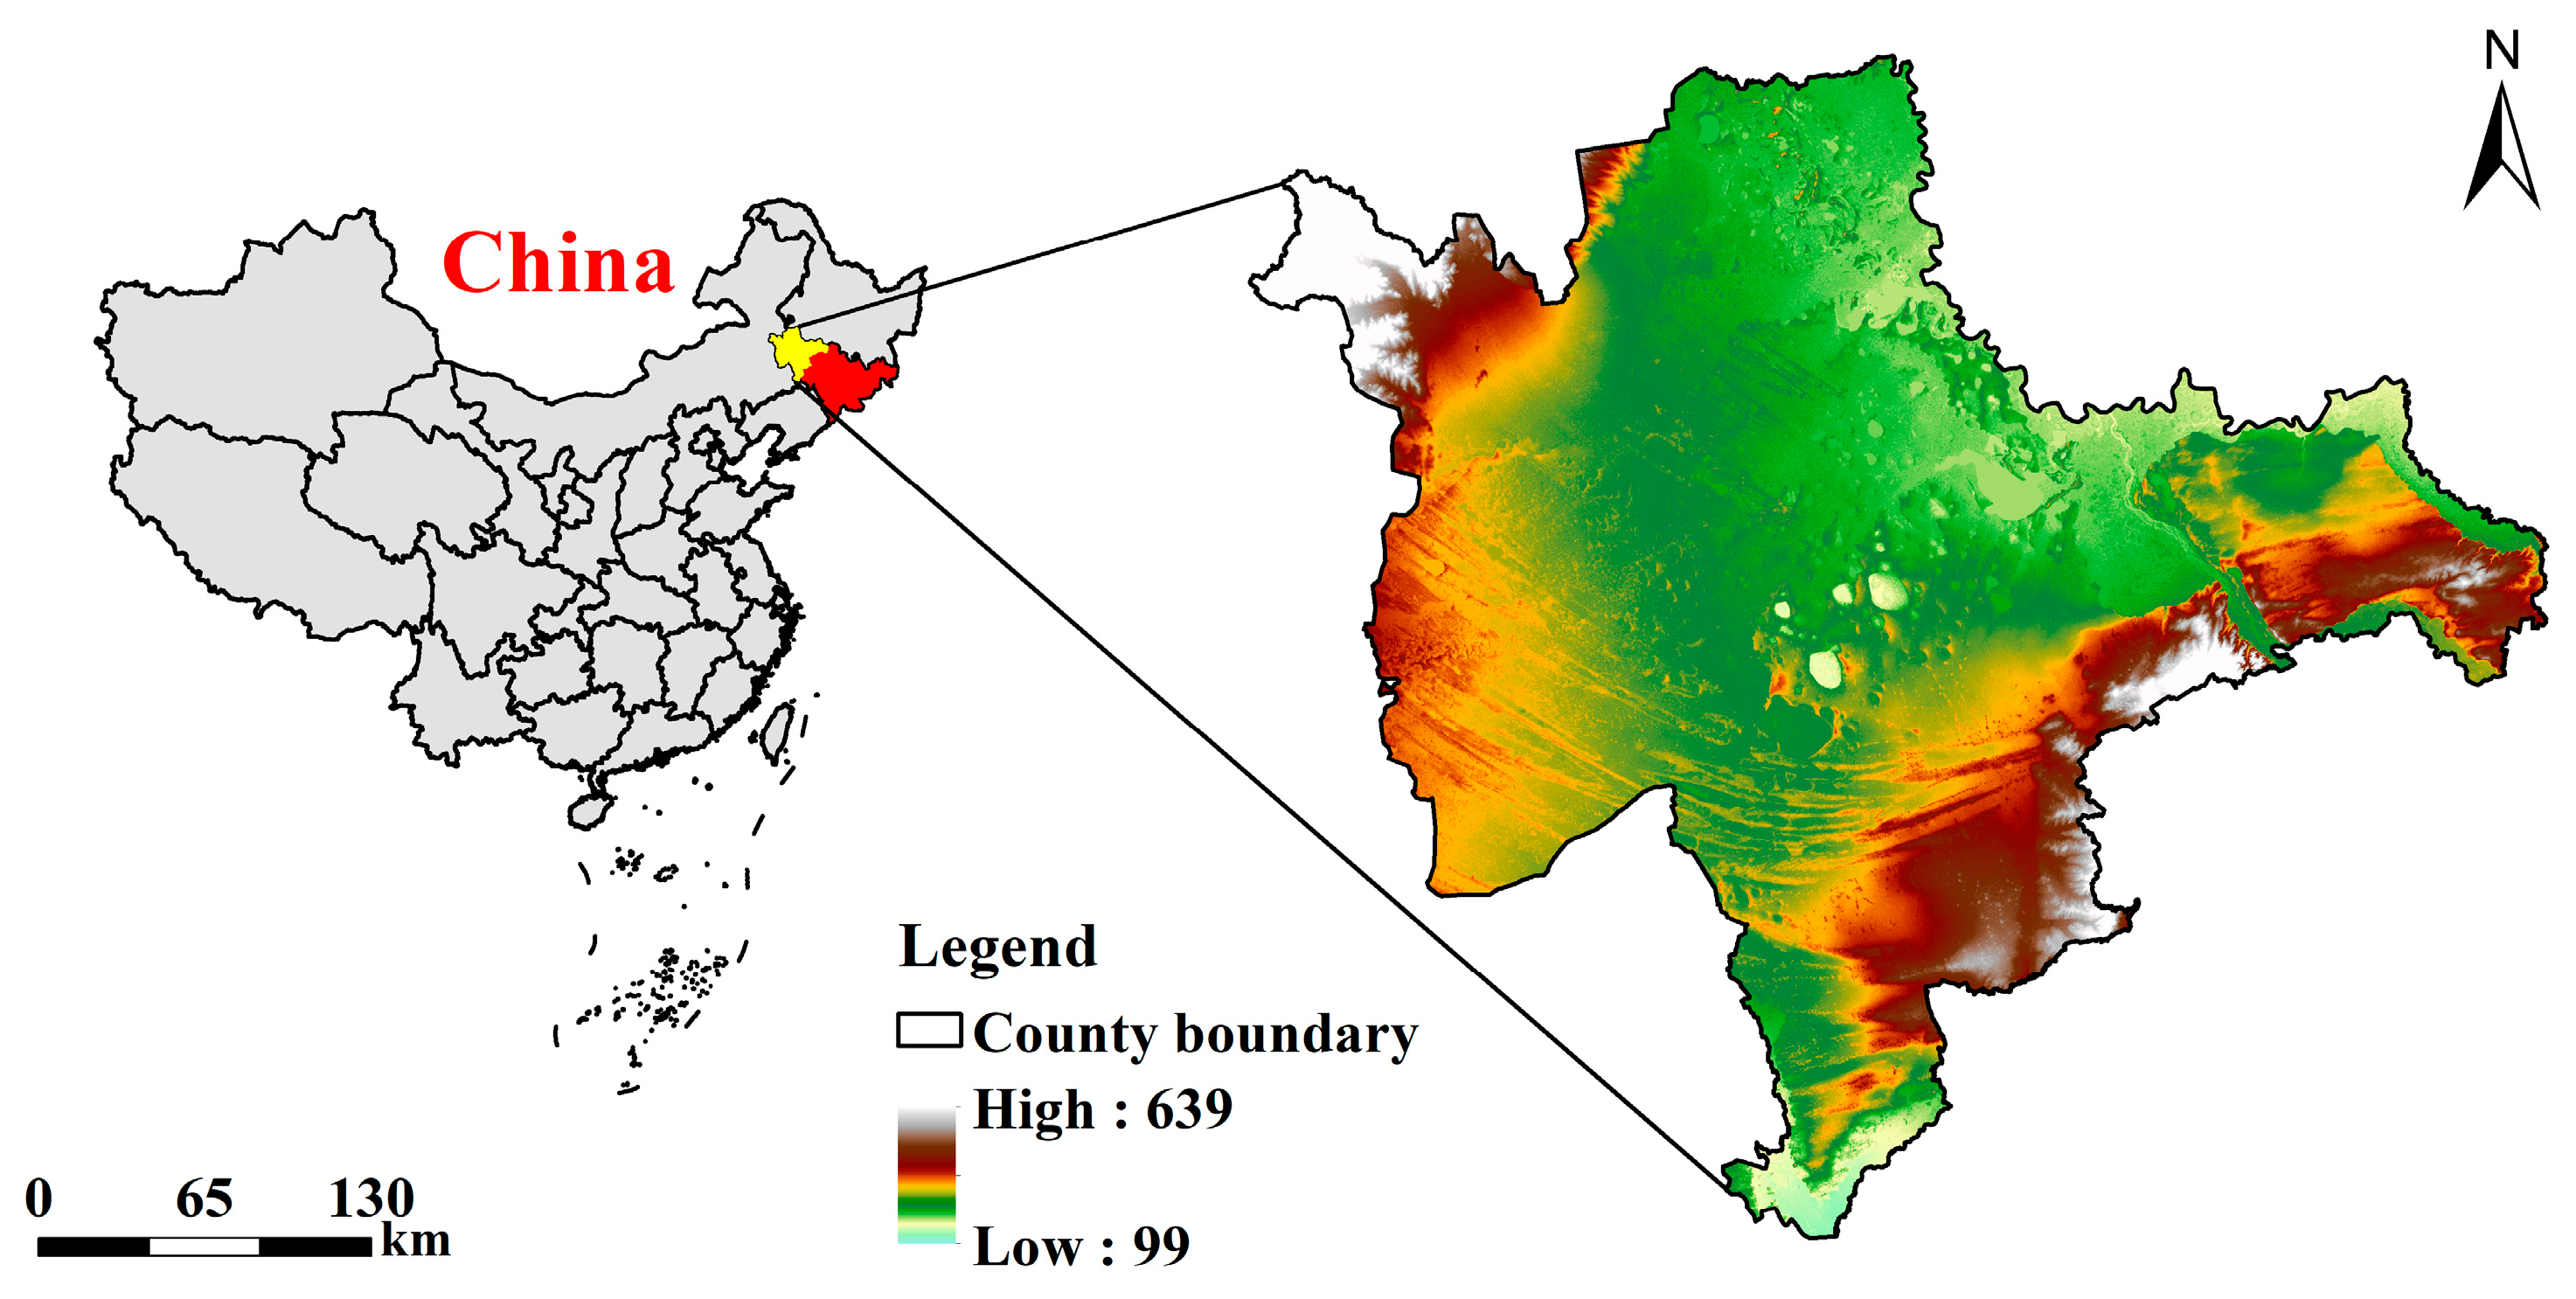
The WJL is located between 121°38′ E~126°11′ E and 43°15′ N~46°18′ N. It lies at the confluence of the Horqin Grassland and the Songliao Plain, adjacent to the Greater Khingan Range, making it one of the area most susceptible to climate change (Figure 1). This region encompasses vast wetlands and grasslands, representing an essential ecological landscape within Jilin Province, and is extensively utilized as a commercial grain production base. Characterized by a temperate continental monsoon climate, it occupies a transitional zone between semi-arid and semi-humid environments, where low-lying saline–alkaline lands are prone to waterlogging, and wind–sand areas are interspersed. Due to the long-term threats of land desertification, saline–alkaline soils, and grassland degradation, the stability of natural ecosystems is relatively low, and the ecological environment is highly vulnerable. Consequently, the coordinated development of PLES faces significant challenges.

Figure 1.
Geographic Location of the WJL.
2.2. Data Sources and Classification
To conduct an in-depth study of land use changes in the WJL, this research selects representative land use data from five time points: 2000, 2005, 2010, 2015, and 2020. The data are sourced from the Data Center for Resources and Environmental Sciences at the Chinese Academy of Sciences (https://www.resdc.cn/), with a spatial resolution of 30 m, ensuring sufficient accuracy for detailed geographical analysis. Based on the “Current land use classification” (GBT 21010-2017) [25] and taking into account the actual conditions of the study area alongside previous research, the land use classification system for WJL is divided into six categories: cultivated land (including paddy and dry land), grassland (high-cover, medium-cover, and low-cover grasslands), forest land (including forested areas, shrublands, sparse forests, and other forest types), construction land (including urban areas, rural settlements, and other built environments), water bodies (including rivers, lakes, reservoirs, and wetlands), and unused land (including sandy areas, gravel deserts, saline–alkaline soils, marshes, bare land, and bare rocky areas). This classification system not only follows national standards but also takes into account the ecological and environmental characteristics of WJL, providing a scientific foundation for subsequent land use change analysis and ecological functional zoning.
2.3. Research Framework
From the perspective of PLES, this study first employs remote sensing data and GIS technology to explore the evolution process of this space, utilizing a comprehensive analysis method of LUI and landscape pattern index to assess the spatiotemporal distribution characteristics of LUI and LER. Secondly, the CCD model is used to reveal the coupling coordination relationship between LUI and LER. Finally, based on the heterogeneity of the CCD, ecological zoning is conducted using ArcGIS 10.7 (Figure 2).
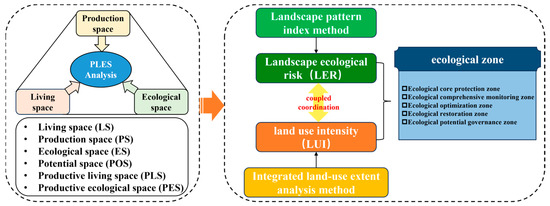
Figure 2.
Research framework.
2.4. Division of Research Units
To accurately reflect the land use characteristics of the WJL, this study adopts the PLES framework based on the functional characteristics of land use types. The framework aims to comprehensively assess the multiple functions of land use and analyze the impact of different spatial types on the ecological environment. The PLES framework, as a comprehensive land use management tool, supports sustainable land use management by evaluating the production, living, and ecological functions of land use. This framework recognizes the diversity of land use functions, emphasizes the symbiotic and complementary relationships between these functions, and takes into account the differences and interactions between urban and rural areas. It proposes an optimization strategy based on functional synergy and spatial gradients. Through the analysis of these functions, the PLES framework helps reveal the coupling relationship between LUI and LER, providing a theoretical basis for optimizing land use and ecological risk management.
In this study, the PLES framework, in combination with the “Current land use classification” (GBT21010-2017) the actual conditions of the study area, and previous research findings, systematically classifies land use types into six categories: cultivated land, water bodies, grassland, forest land, built-up land, and unused land. Given that different land use types have multiple functions, and that variations in LUI and methods lead to significant differences in their dominant functions, this study evaluates the dominant functions of the land from a functional perspective, scoring them as high (5 points), medium (3 points), low (1 point), or none (0 points) [26]. The scoring criteria refer to the classification formulas in Duan et al. (2021) [27] and Song et al. (2024) [28]. Finally, the land use types are classified into six categories: production space (PS), living space (LS), ecological space (ES), production–ecological space (PES), production-living space (PLS), and potential space (POS).
Research based on administrative divisions has certain regional limitations. To further improve the accuracy of the evaluation, this study uses a 1 km × 1 km grid as the evaluation unit, with a total of 51,514 grids. Each grid serves as a basic unit for ecological research, spatial sampling, and calculation.
2.5. Analysis of LUI
Variations in land use methods, scope, and intensity result in differences in the presentation of functions within the space, leading to distinctions in priority and strength. Therefore, we adopted the comprehensive analysis method of land use degree proposed by Zhuang and Liu (1997) [29]. Based on the natural balance state of land natural complexes influenced by social factors, the degrees of PLES are categorized into six levels, with the following decomposition indices for LUI: PS = 3, LS = 4, ES = 2, PLS = 6, PES = 5, and PS = 1.
In the formula, LUI represents land use intensity; represents the area of the ith type of PLES; S denotes the total area of the PLES; is the classification index of the degree of the ith type; and n is the number of types of PLES. The LUI in the study area is divided into five levels using the natural breakpoint method: weakest (0~0.14), weaker (0.14~0.32), middle (0.32~0.46), stronger (0.46~0.64), and strongest (0.64~1).
2.6. Calculation of LER Index
LER is an important indicator of an ecosystem’s sensitivity to external disturbances and its internal resilience. This study adopts a spatial pattern perspective, employing landscape pattern indices to establish a risk assessment model that quantitatively analyzes the relationship between landscape patterns and ecological risk. Based on existing research [30], this paper selects the landscape disturbance index (), landscape vulnerability index (), and landscape loss index () as evaluation indicators. A model is constructed to analyze the ecological risk of the “PLES” in the WJL, aiming to reveal its spatiotemporal differentiation characteristics.
In the formula, represents the ecological risk of the ith evaluation unit of the PLES; is the area of landscape type i in the kth evaluation unit; and is the landscape loss index for landscape type i. Specific indices and formulas are detailed in Table 1. The LER in the study area is divided into five levels using the natural breakpoint method: lowest (0~0.23), lower (0.23~0.50), medium (0.50~0.69), higher (0.69~0.88), and highest (0.88~1).

Table 1.
Calculation methods for landscape pattern indices.
2.7. Ecological Zoning Based on LUI-LER Coupling Coordination
Despite the effectiveness of returning farmland to forest and grassland policies in improving land use conditions in the WJL, the area continues to face dual challenges between development and conservation, complicating the coordination of PLES. Based on the CCD model, a LUI-LER coupling coordination framework has been developed to delineate ecological zones. Here, LUI reflects the degree of land resource exploitation, while LER indicates the overall loss of ecosystem services and ecological functions within the landscape. This approach, combining LUI and LER to identify the impacts of interactions between different functional areas, enables policymakers to identify and comprehend different regions’ ecological status rapidly. Furthermore, heterogeneous ecological policy recommendations can be formulated based on the coupling coordination relationships of LUI-LER in various areas. The LUI-LER coupling coordination calculations are conducted using Formulas (3) to (5) (Table 2), and the spatial evolution trends of the CCD status from 2000 to 2020 are analyzed using the raster calculator tool in ArcGIS 10.7 [33]. Based on the results of the LUER analysis, the ecological zones are categorized into five distinct areas (Table 3).
Table 2.
CCD Levels and Corresponding CCD States.
Table 3.
Information on the delineation of ecological zones.
In the formula, D represents the CCD, while C and T denote the coupling degree and coordination degree, respectively. E and U are the standardized values of LUI and LER. The coefficients α and β represent the importance of LUI and LER. Given that LUI and LER are considered equally important, we set α = β = 0.5 [18,34].
In the formula, LUER represents the dynamic distribution of the coupling level between LUI and LER from 2000 to 2020. Meanwhile, , , , , and correspond to the codes for the coupling levels of LUI and LER for the years 2000, 2005, 2010, 2015, and 2020, respectively.
3. Results
3.1. Space Pattern of LUI and LER Based on “PLES”
3.1.1. Evolution of the “PLES” Land Use Type
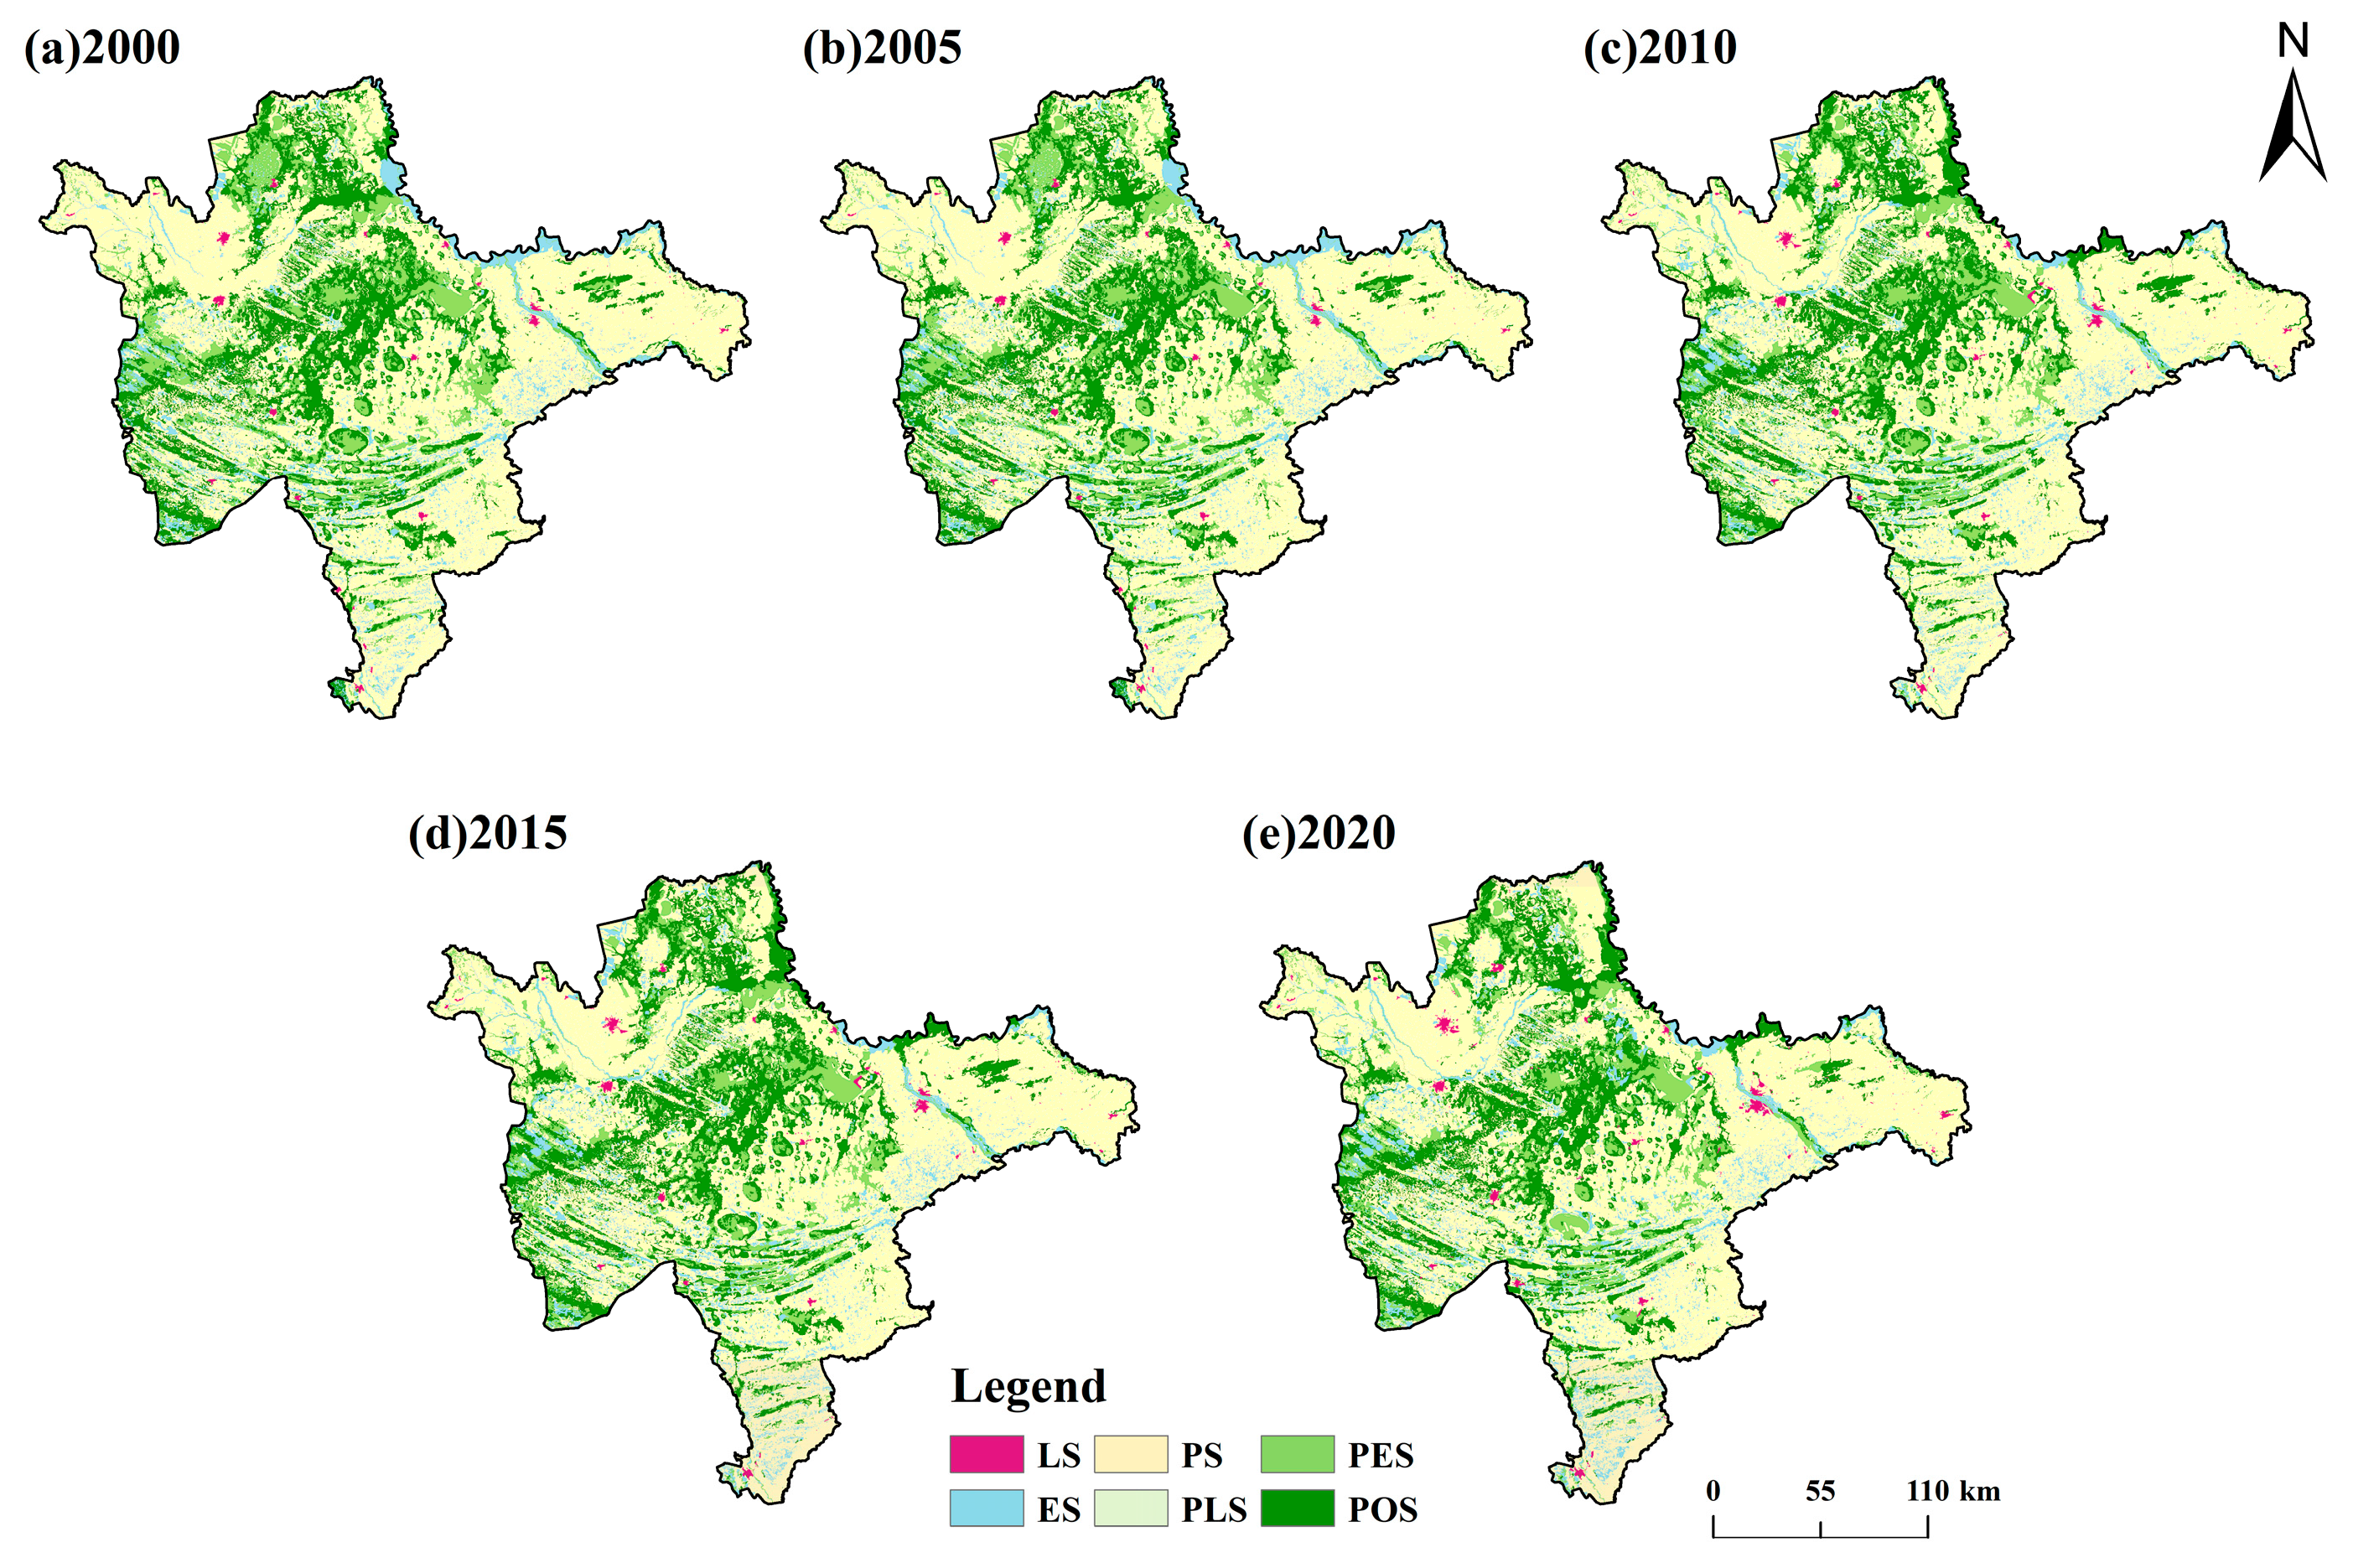
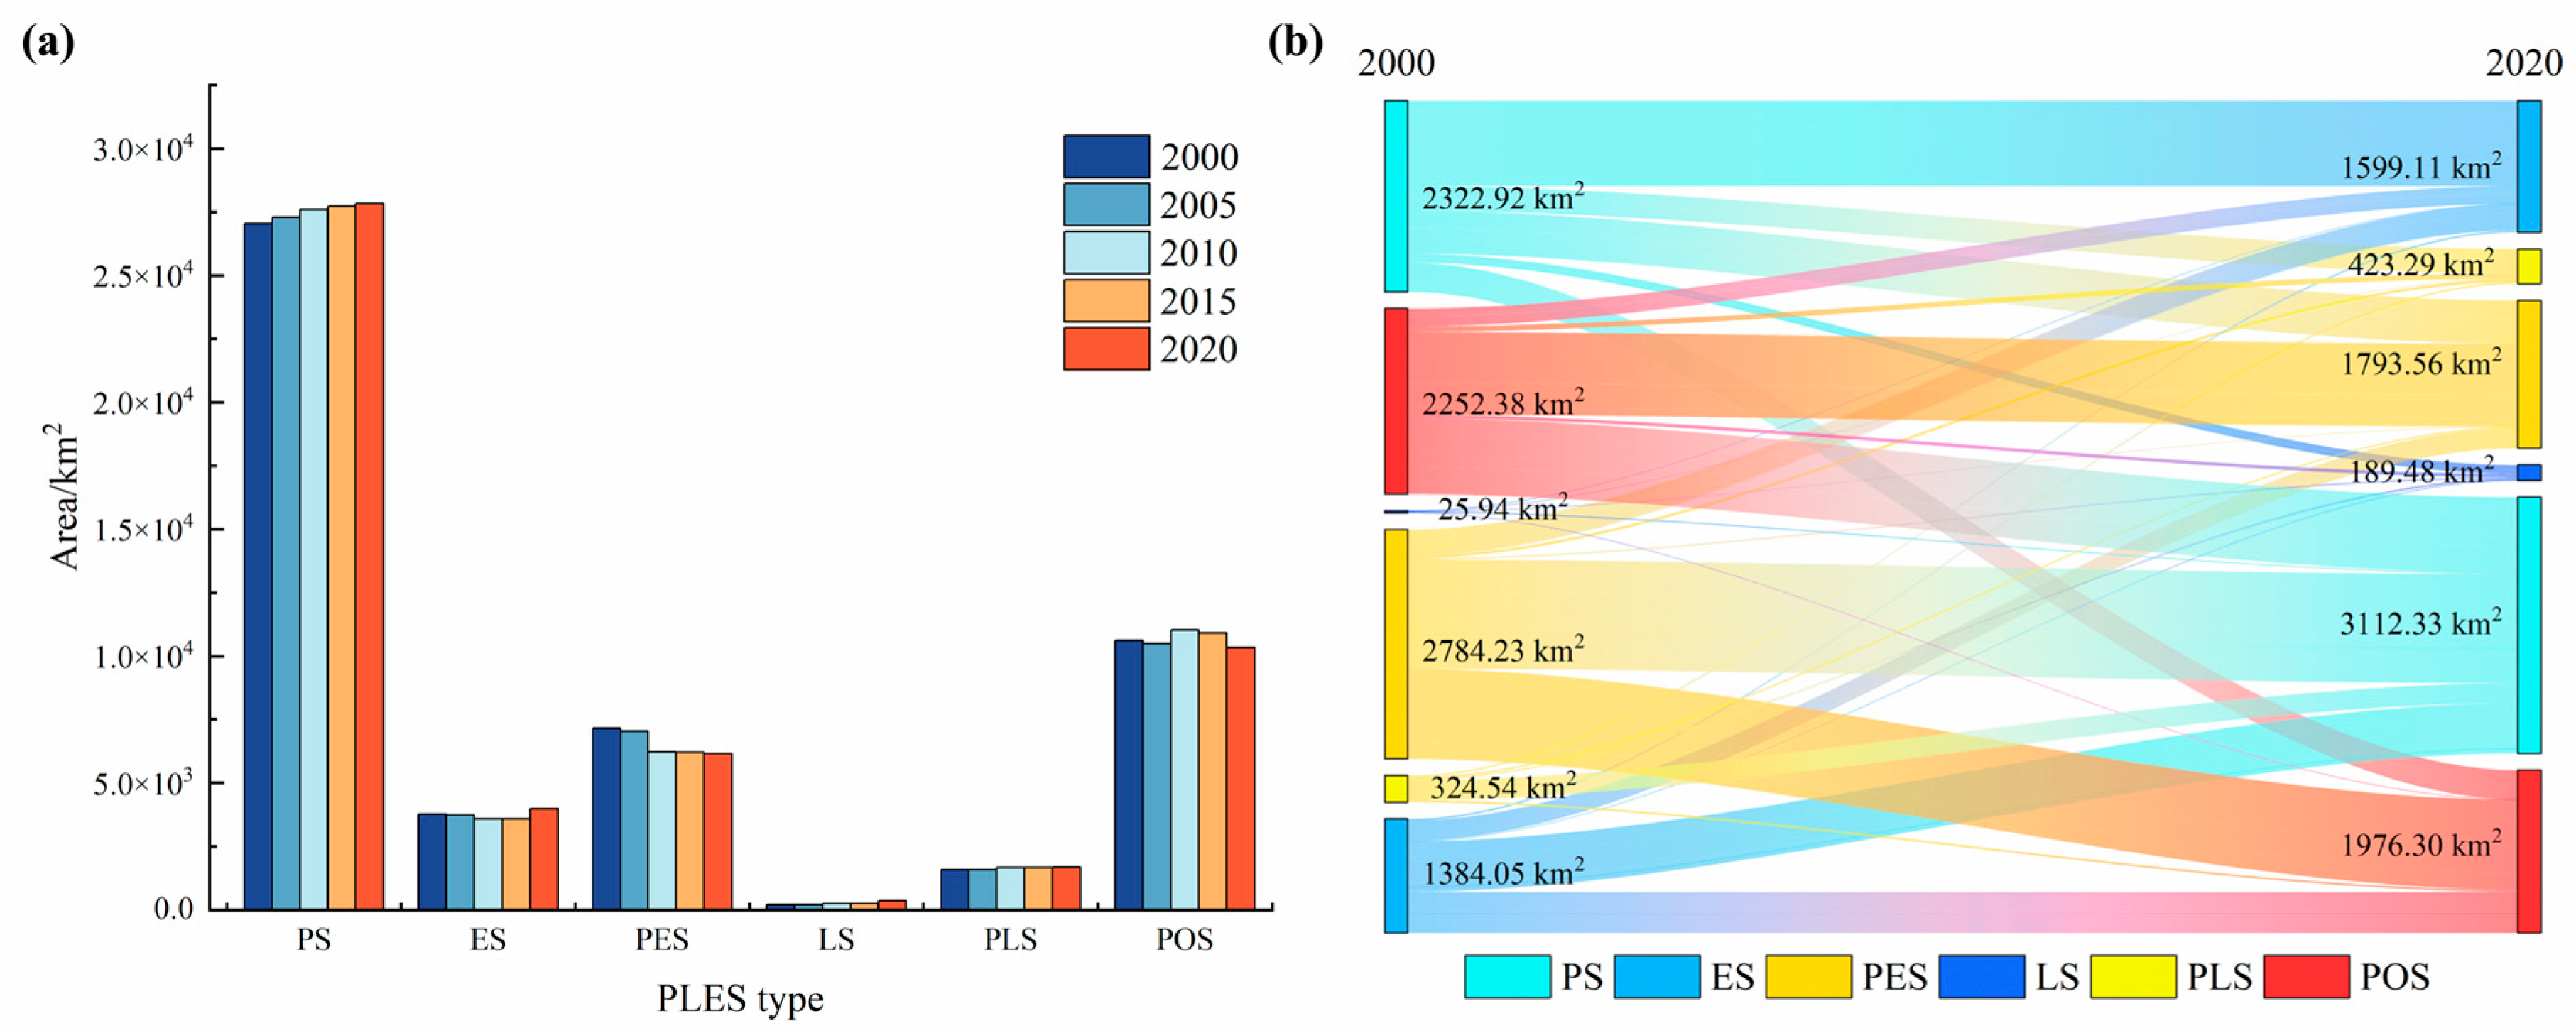
The PLES in the WJL exhibit a distinct hierarchical structure (Figure 3). PS is widely distributed and predominates. At the same time, ES is primarily concentrated in the northern part, extending in an east–west direction. POS and PES are mixed in distribution across the central, northwestern, and southwestern areas, whereas the extent of LS and PLS is relatively limited.
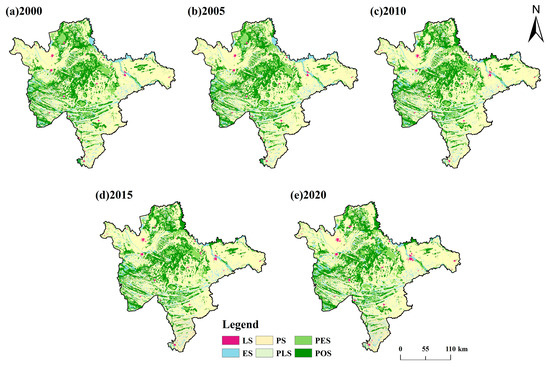
Figure 3.
Spatiotemporal distribution of PLES.
During the study period, the area of PS significantly increased by 788.92 km2, while ES exhibited a trend of initial decrease followed by an increase, with a total net gain of 213.12 km2. Concurrently, LS and PLS increased by 163.54 km2 and 98.72 km2, respectively. In contrast, the areas of PES and POS decreased by 1000.27 km2 and 276.14 km2, respectively (Figure 4a). Through Sankey diagram analysis (Figure 4b), it was observed that from 2000 to 2020, the total transfer area of PS was 2322.92 km2, primarily transferring to ES (1036.89 km2) and PES (525.60 km2), while the area transferred from PES to PS was 1325.15 km2. The transfer area of PES was the largest, totaling 2784.23 km2, mainly moving to ES and POS, with an area of 3112.33 km2 shifting from other spaces into PES, further driving its increase. The total transfer area of POS was 2252.38 km2, predominantly converting to PES (1006.30 km2) and PS (921.09 km2). Significant changes in the conversion of ES to POS began around 2005, particularly in the northeastern region of Zhenlai, the northeast part of Da’an, and the northern water areas of Ningjiang. Over the past two decades, rapid economic growth has significantly facilitated the expansion of PLS and LS, with transfer areas of 324.54 km2 and 189.48 km2, respectively, primarily sourced from PS and POS, indicating that PS has not been effectively protected and that the utilization of POS has led to an imbalance in land spatial functions.

Figure 4.
Area share of PLES types (a) and transfer map (b).
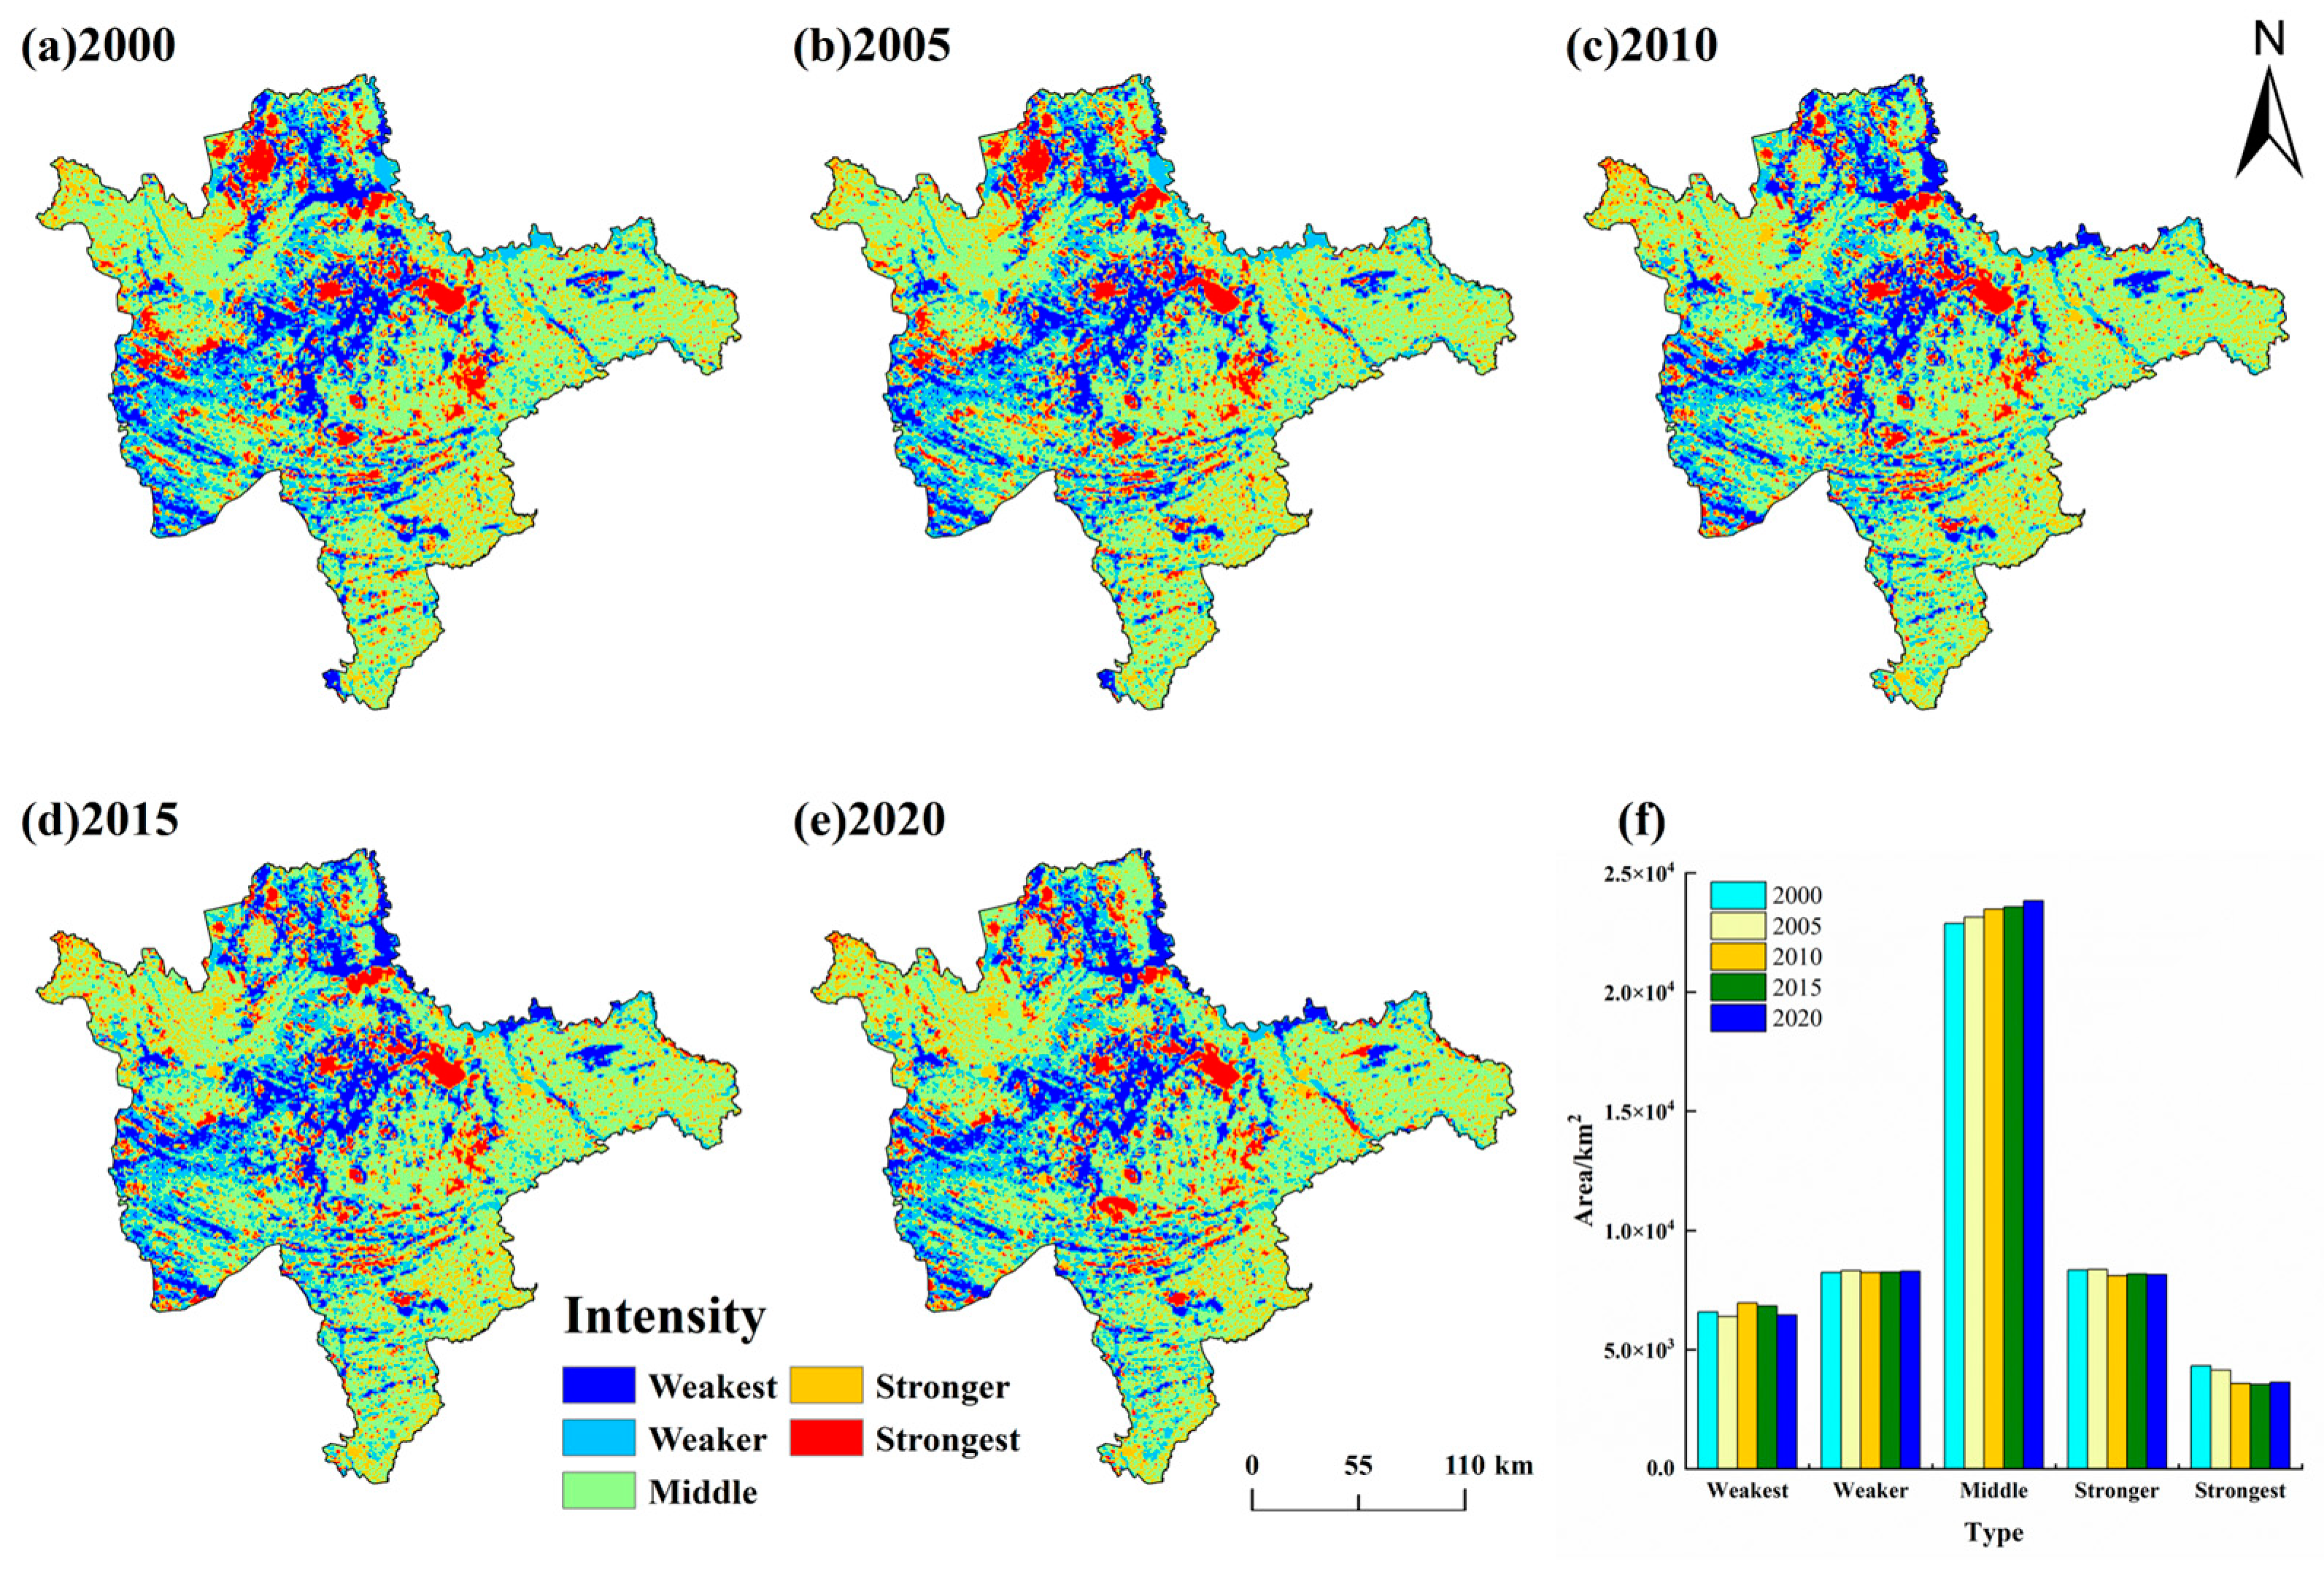
3.1.2. Characteristics of Spatiotemporal Distribution of LUI Based on “PLES”
To comprehensively investigate the functionality and utilization status of PLES, this study quantifies the LUI from 2000 to 2020, revealing a spatial distribution characterized by being “moderate high in the center, lower in the east and west” (Figure 5). The “weakest” intensity areas are primarily located in Zhenlai, Da’an, and Tongyu, with other regions exhibiting a more scattered distribution. By 2010, the “weaker” intensity areas in northeastern Zhenlai and the northern part of Ningjiang transformed into “weakest” intensity areas. The “weaker” intensity zones encircle the “weakest” intensity areas, including Zhenlai, Da’an, Tongyu, and Changling, while the remaining areas remain relatively stable. The “middle” intensity areas are predominantly concentrated in the western and eastern parts of the study area. By 2010, the “strongest” intensity area in the southwestern part of Zhenlai shifted to a “middle” intensity zone, primarily influenced by regional economic development, policy adjustments, or land use patterns. The “stronger” intensity areas are dispersed within the study area, and by 2020, the area of “stronger” intensity in Shuangliao has decreased.

Figure 5.
Spatiotemporal distribution of LUI (a–e) and proportion of area by classification (f).
The “moderate” intensity zone dominates in the study area, accounting for approximately 46%, indicating a relative balance between resource development and environmental protection. The area of “weakest” intensity zones increased from 6574.23 km2 at the beginning of the study to 6955.50 km2 in 2010, reflecting an increase of 381.28 km2; however, by 2020, it decreased to 6450.07 km2, representing a reduction of 505.43 km2. In contrast, the “weaker” and “strongest” intensity zones exhibited similar trends, increasing from 2000 to 2005. By 2020, the area of “weaker” intensity zones had risen by 48.23 km2 compared to in 2000, whereas the “stronger” intensity zones had decreased by 682.89 km2. Furthermore, from 2000 to 2005, the area of “stronger” intensity zones expanded but subsequently began to decline, resulting in a cumulative decrease of 193.83 km2 compared to 2000 (Figure 5f).
3.1.3. Characteristics of Spatiotemporal Distribution of LERs Based on “PLES”
The spatial distribution of LER exhibits a characteristic of “low in the center, high in the east and west” (Figure 6). The “highest” risk zones dominate, accounting for 45%, primarily located in the eastern and western parts of the study area, with a dispersed presence in the central region. Since 2010, the “highest” risk zones have expanded to varying degrees within the study area, particularly notable in the southwestern part of Zhenlai, as well as in Taonan and Taobei. The “higher” risk zones are situated at the intersections of different ecological functional areas, including central Zhenlai, western Da’an, eastern Taonan, Tongyu, western Changling, and Shuangliao. The “medium” risk zones are mainly distributed in Zhenlai, northern Taobei, Da’an, Tongyu, northwestern Changling, and southern Qianguo, with the “lower” risk zones in the central part of the study area converting to “medium” risk zones by 2005. The “lower” risk zones are found in southern Zhenlai, western Qianguo, Da’an, Changling, and Taonan, as well as in south Tongyu. From 2010 onwards, the “medium” risk zones in the central part of the study area transitioned to “lower” risk zones. The “lowest” risk zones are primarily located within LS, with a limited distribution range.
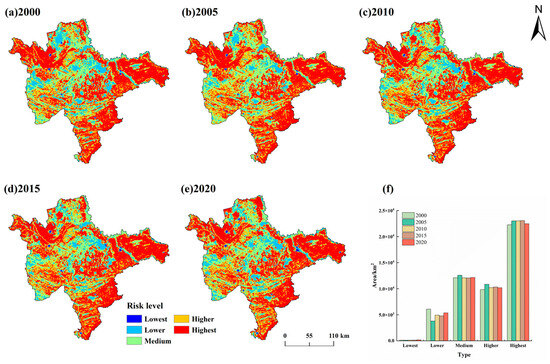
Figure 6.
Spatiotemporal distribution of LER (a–e) and proportion of area by classification (f).
2000–2020, the “lowest” risk areas exhibited a gradually increasing trend, while the “lower” risk areas demonstrated a pattern of initial reduction followed by an increase. Specifically, between 2000 and 2005, the “lower” risk areas decreased by 2281.99 km2. From 2005 to 2020, the “lower” risk zone area increased to 5353.75 km2. Concurrently, from 2000 to 2005, the “medium” and “higher” risk areas increased by 490.66 km2 and 1036.71 km2, respectively. After 2005, both risk categories experienced a slight reduction, though the changes were minimal. The “highest” risk areas increased from 22,260.95 km2 to 23,018.60 km2 during the 2000–2005 period, reflecting an increase of 757.65 km2, but after that, until 2015, their area remained relatively stable, decreasing by 588.69 km2 by 2020. This change indicates a reduction in the areas of both “highest” and “higher” risk zones, suggesting an overall weakening of LER (Figure 6f).
3.2. CCD Spatiotemporal Distribution Characteristics of LUI-LER
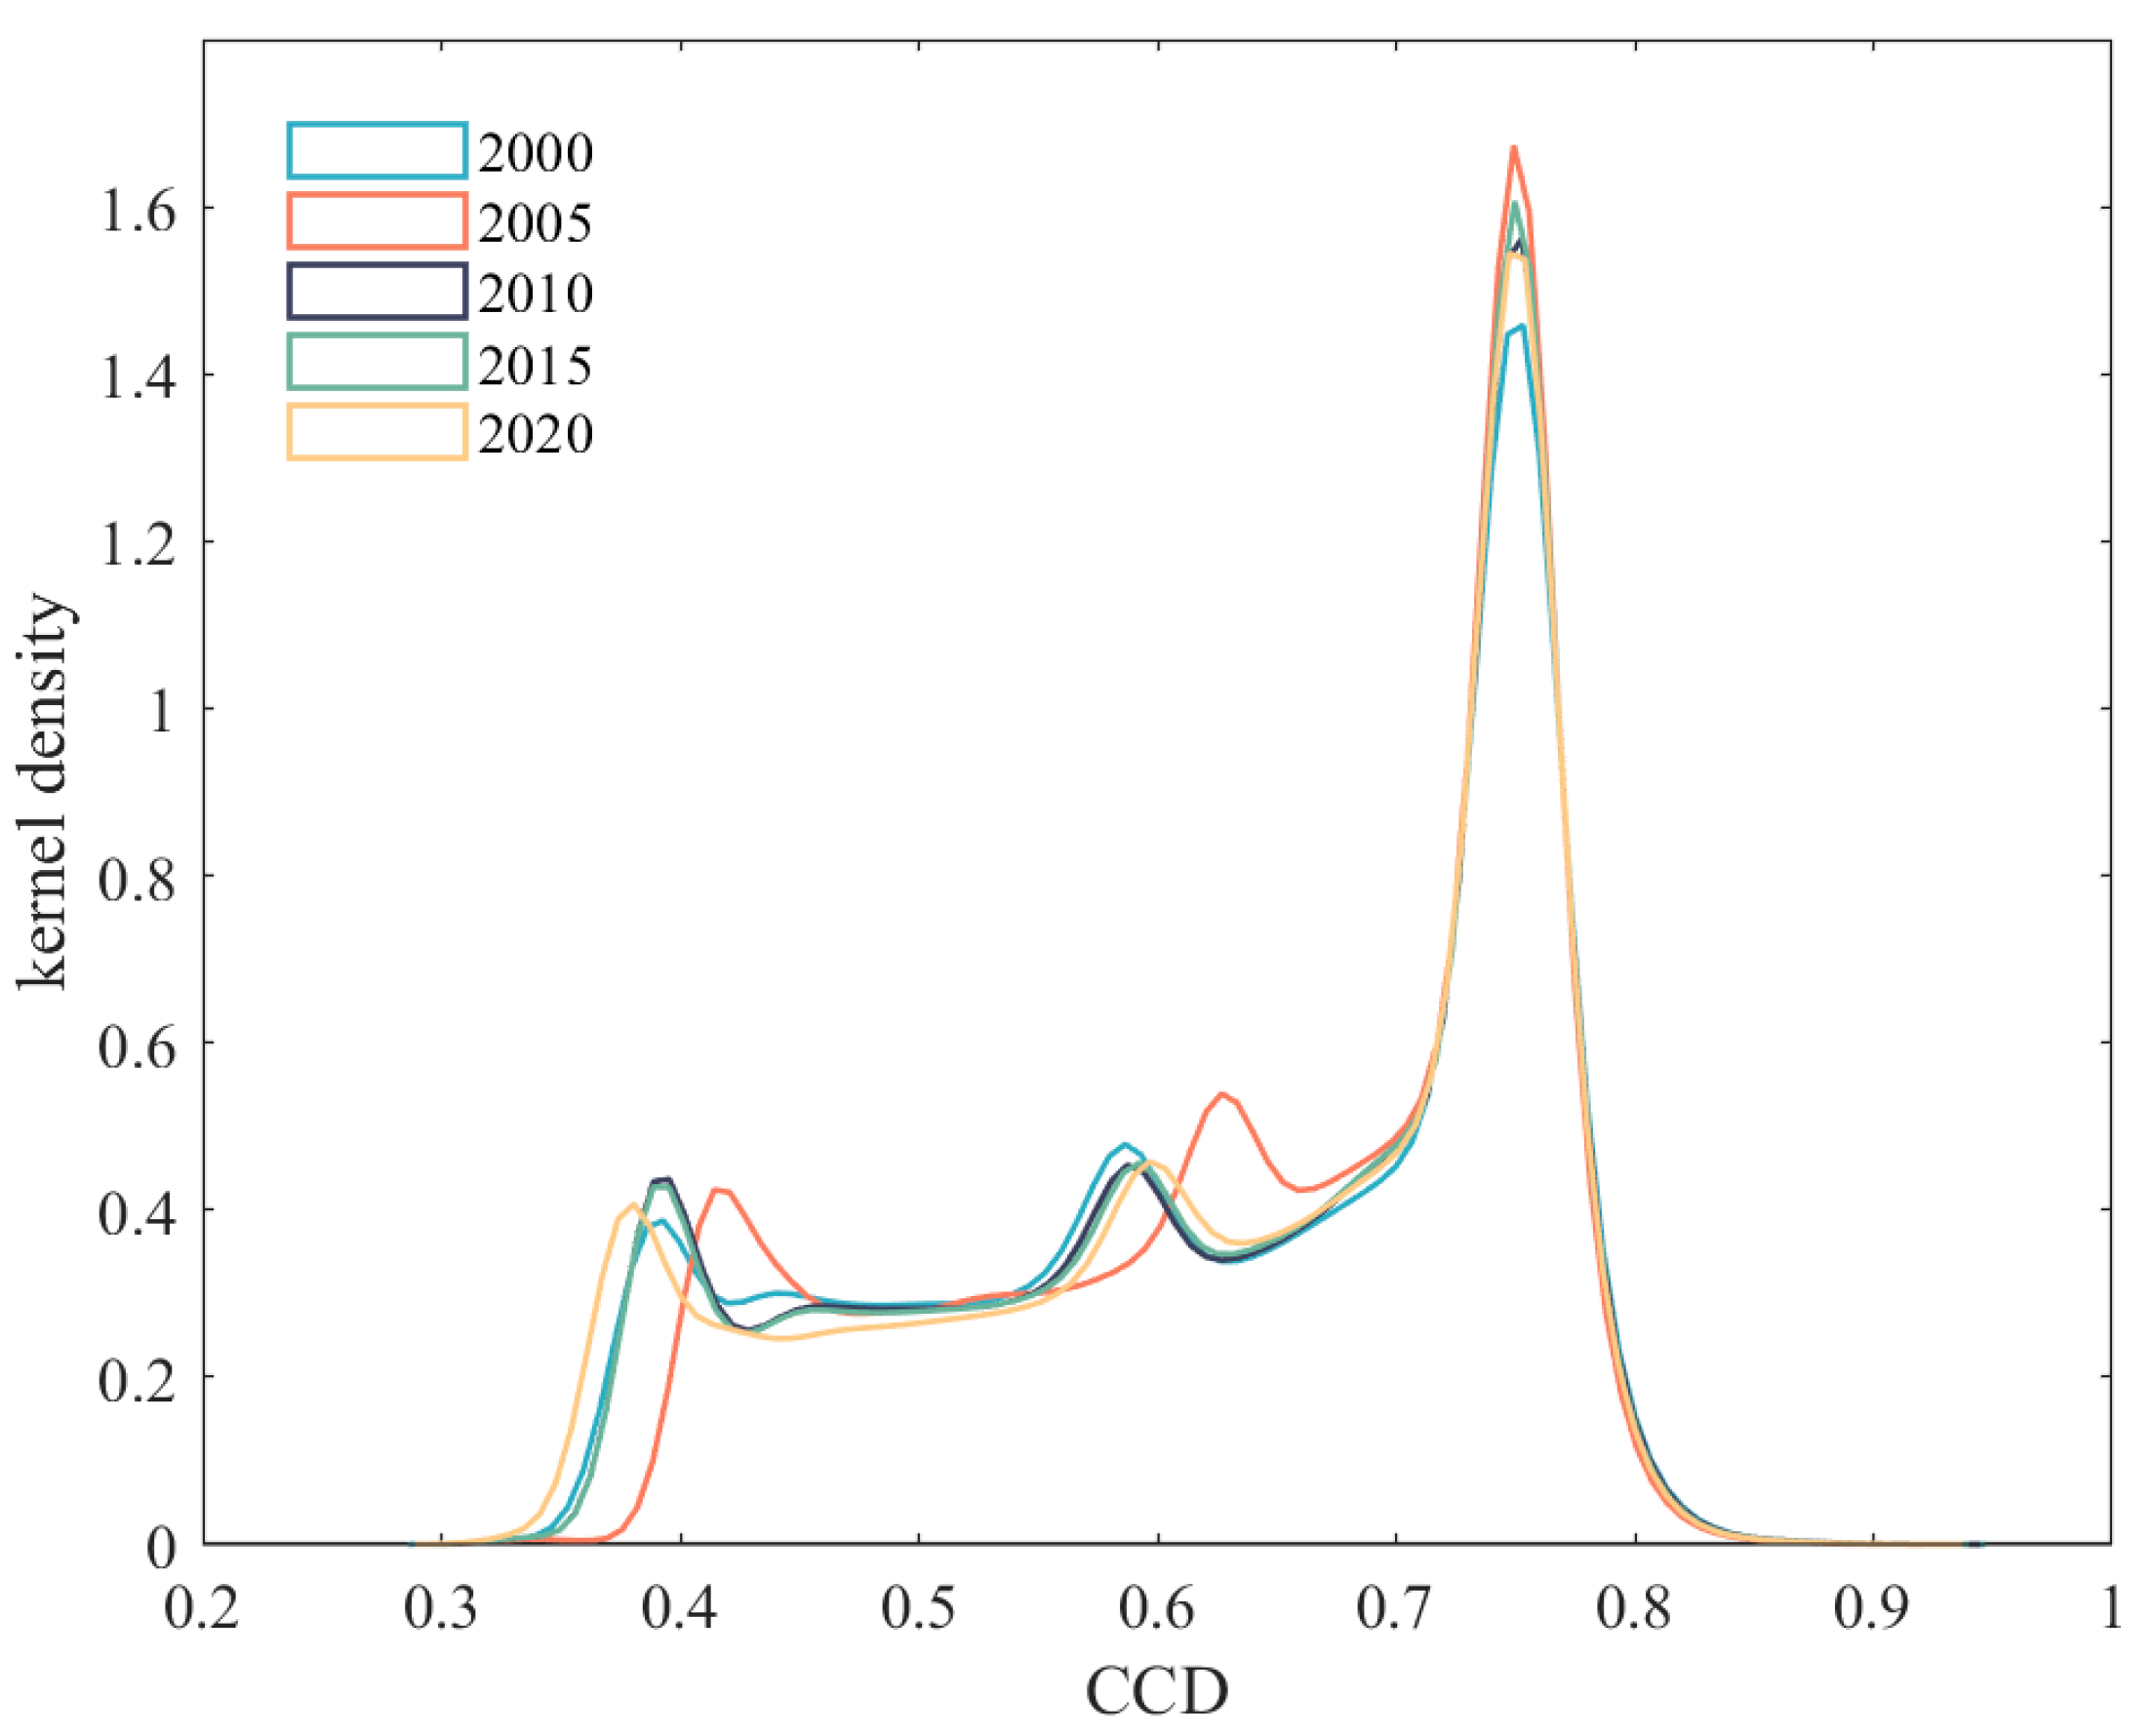
The kernel density estimation results indicate that from 2000 to 2020, the CCD of LUI-LER in WLJ gradually increased (Figure 7). Specifically, the center of gravity of the kernel density curve progressively shifted to the right, with the peak of the curve rising and becoming more pronounced. Additionally, the triple-peak phenomenon observed in the kernel density curve reveals a polarization characteristic of the CCD. Examining the extent of the kernel density curve, it is evident that the left tail is significantly elongated, while changes on the right side are relatively minor. This suggests a catching-up effect in the areas with low coupling coordination, whereas the growth in high coupling coordination areas is slower.
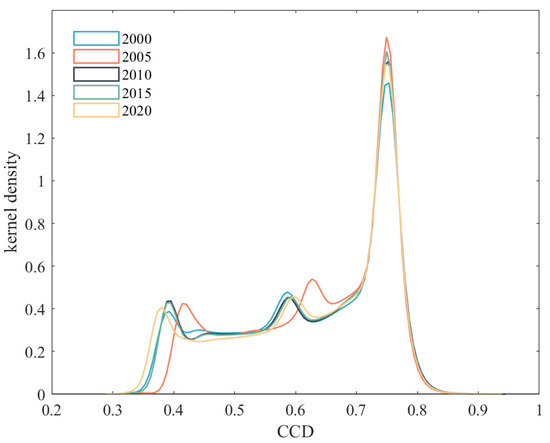
Figure 7.
CCD change trend of LUI and LER from 2000 to 2020.
Between 2000 and 2020, the spatial distribution of the LUI-LER CCD exhibited an overall upward trend from the center to the periphery (Figure 8). The “highly” and “moderate” coupling coordination zones dominated the landscape, with the “moderate” coupling coordination areas in the central region (Qian’an and Da’an), southeastern region (Tongyu and Taonan), and northwestern region (Zhenlai) transitioning to “highly” coupling coordination zones by 2005. The “severe” and “moderate” uncoordinated zones were primarily concentrated in the central (Da’an), southern (Tongyu and Taonan), and northern (Zhenlai, Ningjiang, and Fuyu) regions. Notably, from 2010 onward, significant changes occurred in the northern (Zhenlai and Ningjiang) and southern (Tongyu) areas, where the “basic” coupling coordination zones transformed into “severe” uncoordinated areas. The “highly” and “moderate” coupling coordination zones were particularly pronounced in the western (Taobei and Taonan) and eastern regions of the study area. The “basic” coupling coordination zones were primarily distributed in the west and central areas (Zhenlai, Da’an, Tongyu, and Changling), with Zhenlai’s “basic” coupling coordination transitioning to “highly” coupling coordination from 2010 to 2020.
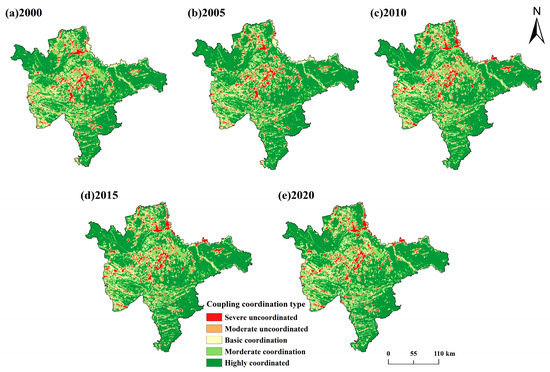
Figure 8.
Spatiotemporal changes in the CCD of LUI and LER.
3.3. Identifying Ecological Zones Based on LUI-LER Coupling
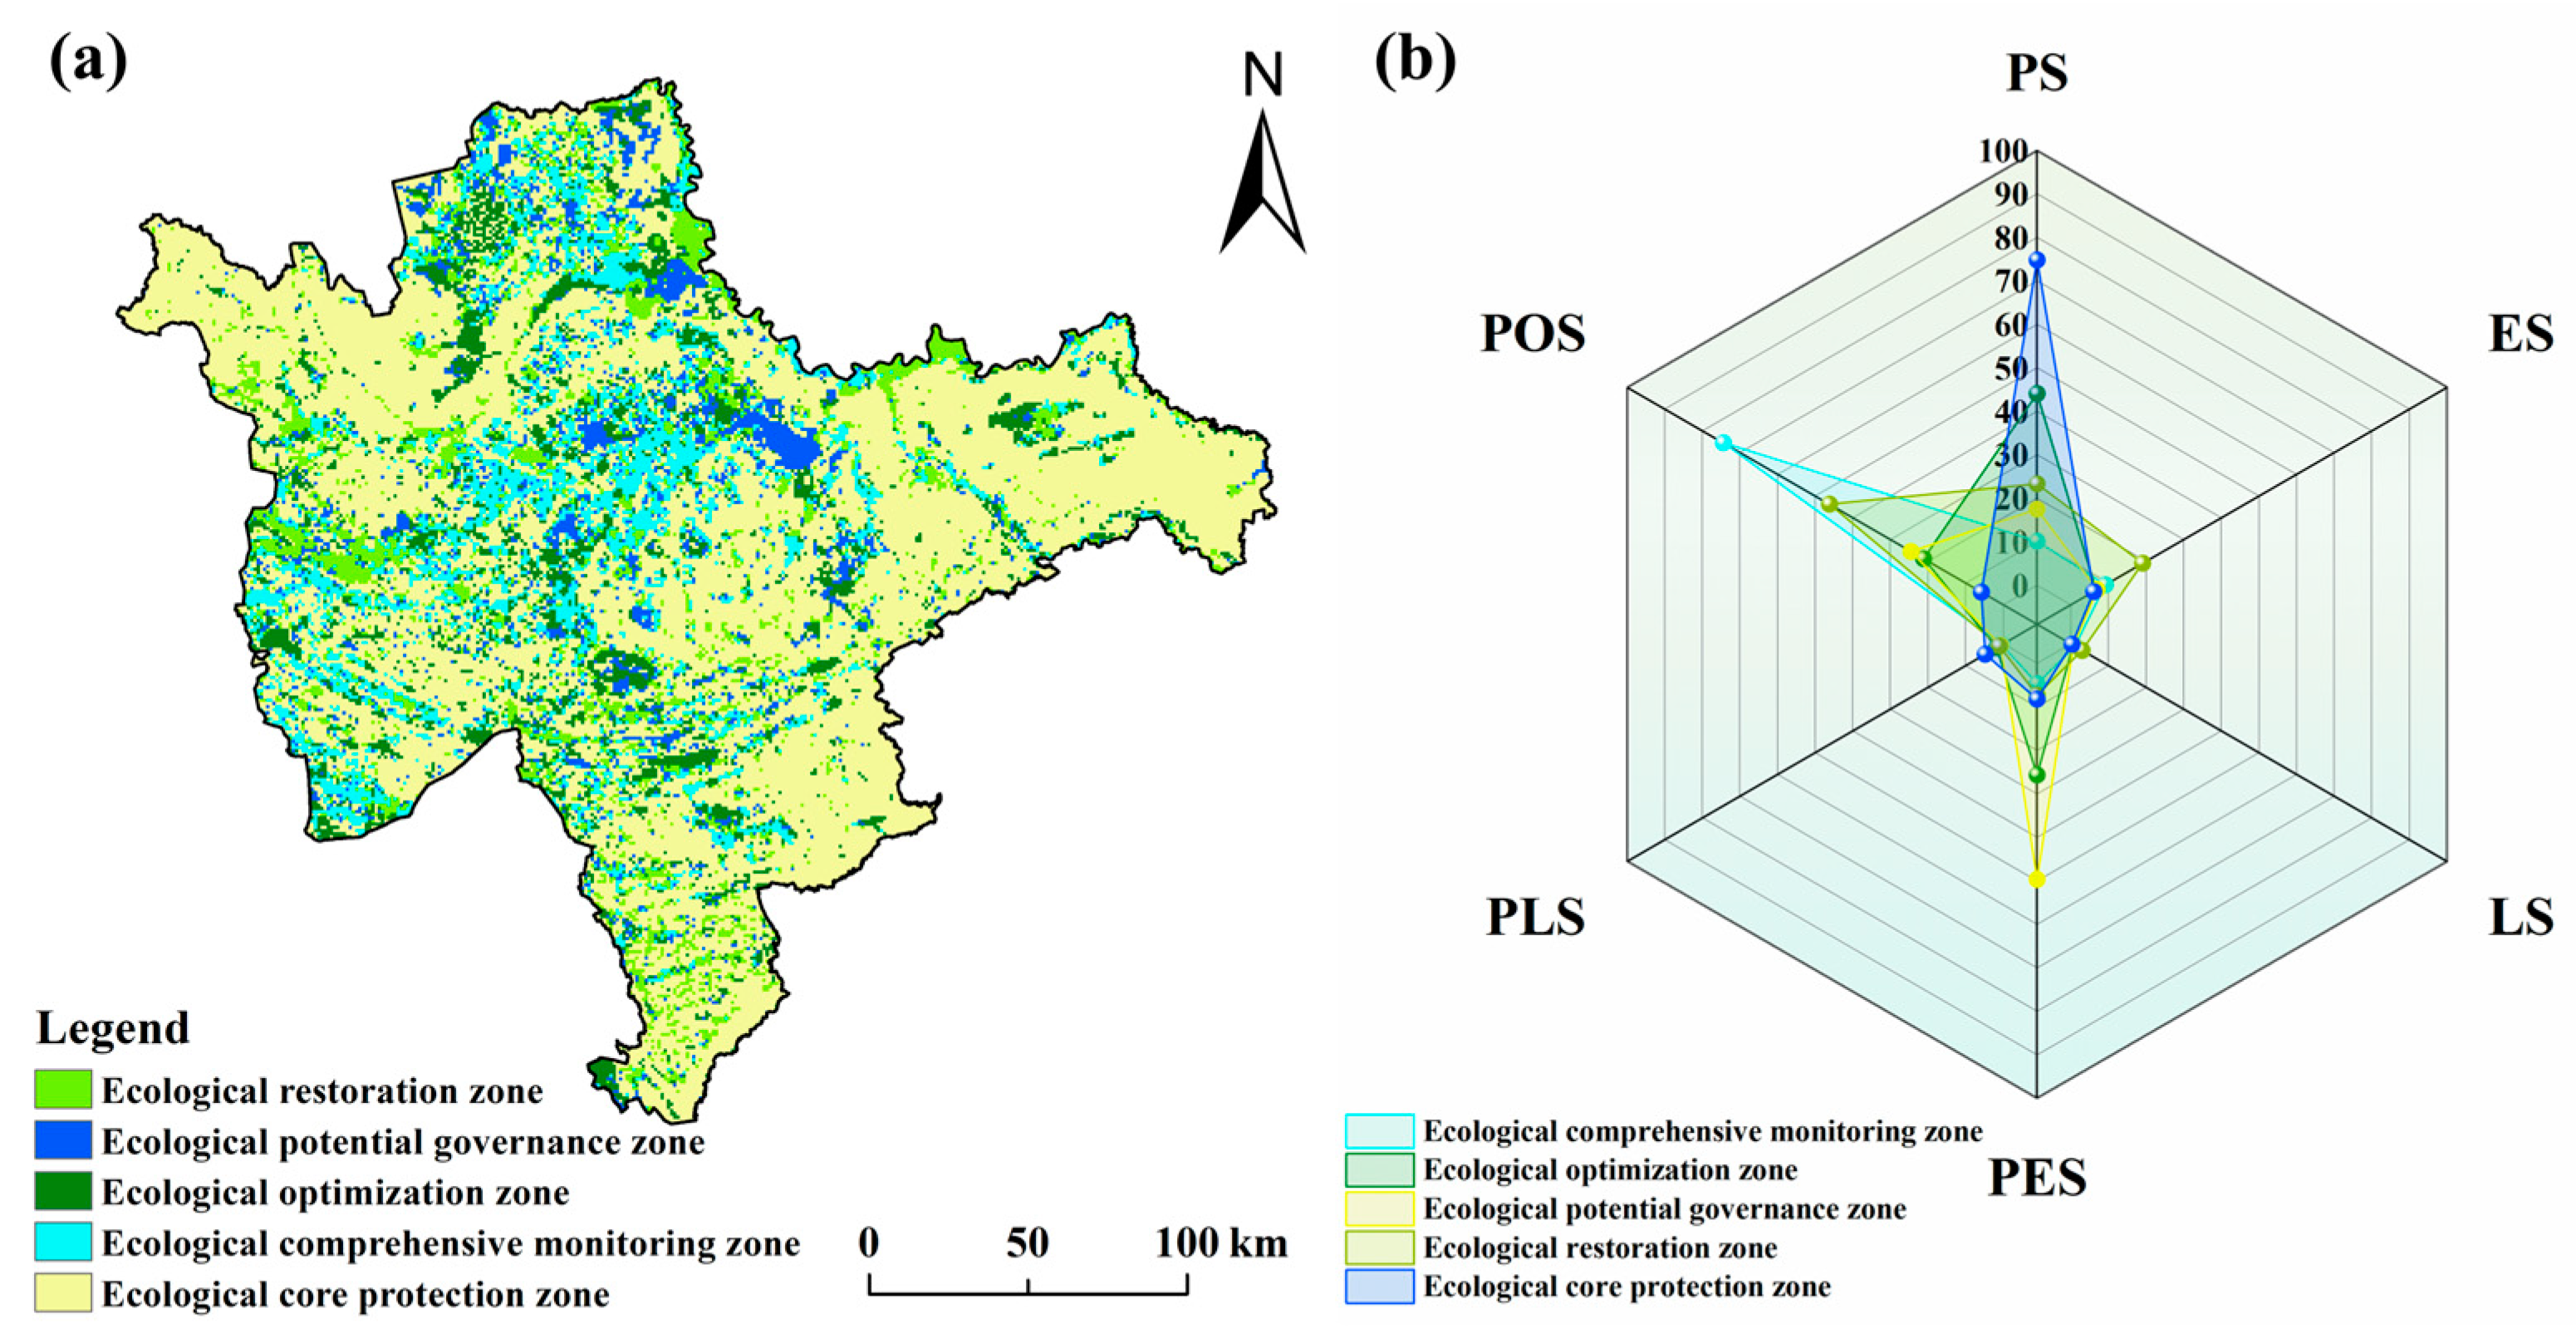
Between 2000 and 2020, this study employed the LUI-LER coupling coordination degree to perform ecological zoning of the study area. This approach integrates multiple dimensions of land use and ecological risk assessment, aiming to effectively delineate distinct ecological functional zones. The study area was systematically classified into an ECP zone, ECM zone, EO zone, ER zone, and EPG zone (Figure 9).
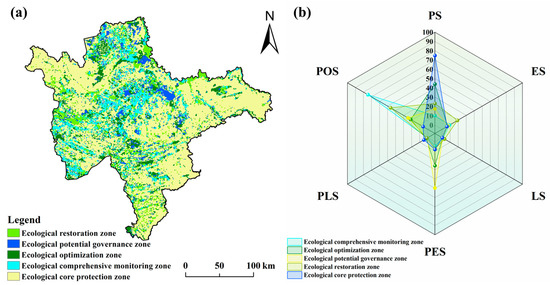
Figure 9.
Spatiotemporal distribution of ecological zones (a) and visualization of changes in the area of each ecological zone in PLES (b).
The ECP zone, which requires stringent conservation due to its high production value, accounts for 61.63% of the total area and exhibits the most extensive distribution in the PS zone. This area provides critical ecosystem services and is highly sensitive to ecological protection measures. The ECM zone, located primarily in the central and western parts of the study area, covers 11.24% of the total area and is the most prominent in the POS zone. This region requires ongoing monitoring and management to maintain ecological stability and promote sustainable development. The EO zone, found in the central, northwestern, and southwestern regions, covers 10.18% of the total area and has the broadest coverage in the POS zone. Although its ecological environment is gradually improving, further optimization is needed. With appropriate land use planning and management, its ecological service functions can be enhanced. The ER zone, concentrated in the central, northwestern, and southeastern regions, occupies 10.31% of the total area, with the largest coverage in the PS zone. Due to anthropogenic degradation, this area urgently requires restoration efforts to recover its ecological functions. The EPG zone, primarily located in the central and northwestern regions, covers 6.64% of the total area and is the most widely distributed in the PES zone. While its ecological condition is currently stable, potential environmental risks persist, necessitating early intervention and governance strategies.
4. Discussion
Based on the perspective of PLES, this study assesses the spatiotemporal distribution characteristics of LUI and LER, revealing their coupling coordination relationship, and subsequently determines the ecological zoning. The findings provide scientifically sound strategies for the sustainable development and management of the regional ecological environment.
4.1. Response of LUI to PLES Changes
The Chinese government has proposed a land spatial development strategy from a global and strategic perspective, emphasizing “intensive and efficient PS, livable and moderate LS, and beautiful ES.” Within this strategic context, PLES refers to spatial entities formed by interacting with human activities and geographical environments characterized by specific structures and functions. The development goals of this space aim to achieve sustainable development, carbon neutrality, and coordinated development. In this regard, LUI emerges as a crucial indicator for measuring the impact of human activities on natural ecosystems.
Previous studies have indicated that changes in PLES affect environmental quality and ecosystem services, altering fundamental ecological processes such as material cycling and biodiversity and exerting profound influences on socioeconomic factors and resource utilization. According to the research findings, areas with high LUI are primarily located in regions where the natural environment, economic activities, and social demands significantly interact, focusing mainly on PES, PLS, and LS (Figure 5). This finding aligns with the results of Pan et al. (2024) [35], which demonstrate that regions with high LUI exhibit notable human disturbances, a general increase in built-up land, and significant urbanization. Conversely, areas with low LUI are predominantly found in POS and ES, where natural environmental conditions limit development or protective measures reduce human activity intensity. The research by Qi et al. (2023) [36] further corroborates this conclusion.
Since the overall planning for the ecological economy zone in WJL was proposed in 2014, practical measures such as grassland and wetland restoration, conservation and rational utilization, comprehensive management of saline–alkaline land, sand land management, agricultural ecosystem protection, and green corridor construction have contributed to the recovery and improvement of PLES in WJL. Specifically, during the study period, changes in the PLES in the research area showed increases in the regions of PS, ES, PLS, and LS, with increases of 1.58%, 0.43%, 0.20%, and 0.33%, respectively, while areas of PES and POS decreased by 1.98% and 0.54%, respectively (Figure 4), leading to an overall decline in LUI. This suggests that when the government formulates planning policies focused on ecological restoration and management, it helps maintain LUI. For instance, Wang and Bai (2024) [37] investigated the spatiotemporal characteristics and driving mechanisms of land use transformation and landscape patterns due to ecological restoration projects in the mountainous areas of Guizhou, finding that such projects significantly influenced changes in land use patterns and promoted landscape resilience and diversity. This indicates that enhancing ecological protection under the premise of coordinating ecology and economy is beneficial for maintaining LUI. However, LUI may rise when the government emphasizes economic development in spatial planning policies. Subsequent studies further validate this finding; for example, Zhang, S. et al. (2023) [38] found that policy clusters effectively regulated built-up land intensity in the Yangtze River Economic Belt, with economic incentive policies significantly increasing LUI, especially in economically developed regions. Additionally, Yin et al. (2021) [39] observed that in the Hengduan Mountains of China, adjustments in LUI and management policies significantly impacted land system evolution, with strengthened protection policies aiding ecosystem recovery and enhancing regional ecosystem service functions.
4.2. Response of LER to PLES Changes
Changes in PLES accurately reflect land use policies and regional development planning. However, LERs reveal the interactions between landscape patterns and ecosystems, focusing on the risk effects generated by various landscapes in spatial configurations. Therefore, the composition and structural changes in PLES are closely related to the temporal and spatial distribution and dynamics of ecological risks within the landscape. For instance, the expansion of PS often leads to the growth of LS and the compression of ES (Figure 4), affecting ecosystem health and increasing ecological risks. For example, Cao et al. (2024) [40] analyzed the northern slope of the Tianshan Mountains from the perspective of PLES and found that the dynamic conversions among oasis areas (agricultural production land), deserts (other ecological land), and high-altitude regions (pastoral ecological land) led to a complex ecological environment.
During the period from 2000 to 2020, regions with PS often experienced higher LER, primarily due to excessive agricultural activities, the use of fertilizers and pesticides, and concentrated land development, which exerted pressure on ecosystems and resulted in functional degradation and declines in biodiversity [41]. PS accounted for approximately 45% of the total area of the study region, with the “highest” risk areas being the primary LER, reflecting an unstable ecological security status. Notably, the conversion of production ecological space to PS in the southwestern part of Zhenlai (Figure 3 and Figure 6) triggered soil erosion, reductions in biodiversity, excessive water resource consumption, and land degradation, exacerbating LER [42]. Similar phenomena have been observed in studies in other regions. For instance, Tan et al. (2023) [43] indicated that in China’s South-to-North Water Diversion Project, the transformation of non-productive land to agricultural production land increased LER during the 2010–2015 period, further validating the accuracy of this study’s findings. In 2005, Jilin Province implemented policies to support county-level economic development, leading to functional changes in PLES, which made ecosystems more vulnerable and created conflicts over land use, remarkably increasing the “medium” risk areas in the central region of the study area. Xiong et al. (2024) [44] found that in the Dongting Lake region, the rapid development of the Yangtze River Economic Belt exacerbated conflicts in the core area of Dongting Lake, indicating that PLES would become increasingly imbalanced. However, starting in 2010, Jilin Province worked towards achieving energy conservation and emission reduction goals set during the Eleventh Five-Year Plan, initiating the construction of ecological demonstration zones in coastal wetlands and implementing projects for natural forest protection and soil erosion control.
Consequently, the ecological environment of the ecological space improved, enhancing ecological security and reducing ecological risks in the central region of the study area. Yang et al. (2024) [45] further confirmed this by analyzing the coupling coordination of PLES in the Xianghai Wetland of Jilin Province, revealing that the most significant decline in coupling coordination occurred from 2000 to 2010, followed by gradual stabilization. Thus, with the intensification of human activities and changes in the natural environment, precise adjustments to land use policies and regional development planning are essential to effectively respond to these changes and optimize the overall level of ecological risk within the landscape [46].
4.3. Analysis of the Coupled Coordinated Relationship LUI-LER
The CCD between LUI and LER reflects the relationship between human activities and ecological protection. This relationship reveals whether land use is balanced within an acceptable range of ecological risk [35]. In WJL, the LUI-LER CCD is gradually increasing (Figure 7), primarily due to policy support, technological advancements, and effective climate change adaptation strategies. These factors significantly enhance the coordination between economic activities and ecological protection. Research by Wei et al. (2024) [47] further supports this viewpoint. The study shows that under different policies, land use and LER exhibit varying states, indicating that policy measures significantly impact environmental conditions. Spatially, there is notable heterogeneity in the LUI-LER coupling coordination in WJL. In production spaces, the CCD of LUI-LER is relatively high, whereas it is lower in ES, LS, and POS. This discrepancy primarily arises from differences in geographical environments, economic development conditions, and the implementation of policies in different regions, as well as being influenced by changes in landscape patterns, regional natural conditions, and levels of socioeconomic development [48].
Additionally, conflicts among PS, LS, and ES, insufficient management planning, ineffective ecological protection measures, and the excessive expansion of LSs have led to imbalances in land use and ecological degradation [49], thereby reducing the CCD. Nevertheless, the LUI-LER CCD in Zhenlai in the northwest of the study area has significantly improved (Figure 8), primarily due to the comprehensive ecological restoration projects implemented by the local government and the application of advanced agricultural technologies. These measures have effectively improved the coordination between land use and ecological protection, demonstrating the positive impact of sound policies and technological measures on the ecological environment [50].
4.4. Advantages and Applicability of Ecological Zoning Based on the Coupling of LUI and LER
This study conducts ecological zoning from the perspective of PLES, using LUI and LER as the core indicators. Previous studies on ecological zoning have typically focused on land use changes, relying primarily on land use classification without integrating the analysis of production, living, and ecological spaces [51]. For example, the study by Xie, H. K. et al. (2024) [52] analyzed the distribution of rural land resources in northern Shaanxi and classified land resources across 302 township-level administrative areas. However, this study did not comprehensively consider the production, living, and ecological functions of land use, which limited the ecological zoning based solely on land use. In contrast, this study adopts a comprehensive approach that incorporates all three dimensions of PLES and classifies regions based on quantitative indicators, offering a more holistic ecological zoning method. The study by Li, Y. P. et al. (2024) [53] analyzed the PLES of the central Yunnan urban agglomeration, dividing it into 18 functional areas and optimizing the classification into 13. This demonstrates that applying the PLES perspective in ecological zoning can accurately capture the spatial relationships between land use and ecological functions, thus providing stronger decision-making support for regional ecological zoning [54] and further validating the approach adopted in this study.
LUI and LER are key indicators for assessing ecological quality [55,56]. By considering the coupling relationship between these two indicators, this study divides the study area into five zones: ECP, ECM, EO, ER, and EPG. In contrast, Tian, F. H. et al. (2020) [54] divided China into five ecological restoration zones based on a single ecosystem health index. However, this approach does not account for the multiple interacting factors within ecosystems, which may overlook key ecological processes and spatial variability, thus limiting the accuracy of the zoning. To address this limitation, this study couples LUI and LER for ecological zoning, analyzing their spatiotemporal evolution and interrelationship, which enhances the zoning process. Similarly, Gong, J. et al. (2021) [57] used a subjective weighted grid overlay analysis to combine ecosystem services and LER, dividing the Bailongjiang River Basin into ecological zones. However, this method focused solely on the high or low levels of ecosystem services and LER, without adequately capturing the spatial correlations of ecological functions. In contrast, by using a coupling approach, this study avoids subjective bias and fully accounts for the interaction between LUI and LER, improving the spatial correlation of ecological functions and significantly enhancing the scientific rigor and adaptability of zoning. The study by Wu, Y. et al. (2024) [58] proposed ecological zoning based on the changes in landscape patterns and ecological environmental quality, combined with hotspot analysis. While differing in methodology, both studies focus on ecological zoning based on the relationships between key indicators, aligning with their core objectives and analytical frameworks. Both aim to provide scientific support for regional ecological management through ecological zoning.
Furthermore, the ecological zoning method based on coupling LUI and LER, as proposed in this study, is highly adaptable and can be applied across different ecological regions. Given that ecological characteristics vary significantly between regions, the method should be adjusted to fit local conditions during implementation. For example, tropical regions face more intense pressures in biodiversity conservation, while colder regions focus more on ecological restoration and climate change adaptation. Therefore, the weights and calculation methods for LUI and LER can be flexibly adjusted according to regional land use types, climate conditions, ecological sensitivity, and other factors. Additionally, significant variations in human activities across regions can influence the spatial distribution of ecological risk and LUI. Urbanized areas may face higher LUI, while agricultural regions may experience greater LERs. Hence, when applying this method, the design of LUI and LER indicators, as well as the evaluation methods, should be tailored to reflect local human activity patterns (e.g., industrialization, urbanization, agricultural intensification) to better capture actual ecological pressures. Lastly, when promoting this method, interregional collaborative management should be considered, as ecological issues in watershed or transboundary ecosystems often involve multiple regions. Ecological risk and land use data from different areas can be integrated based on watershed or transboundary ecological characteristics, further improving the zoning results and facilitating collaborative management and optimal resource allocation across regions.
4.5. Policy Recommendations
This paper couples the two indicators of LUI and LER to construct ecological zoning and adaptive management strategies, ultimately dividing the study area into five ecological zones. The strategy aims to reduce ecological risks and provide targeted policy recommendations for each ecological zone.
1. ECP zone: Primarily located in the grain production area (PS) of the study area, this zone exhibits a “moderate” to “highly” coupling coordination of LUI and LER, indicating a dynamic balance and mutual adaptation (Figure 9). However, agricultural facilities are inadequate, relying heavily on flood irrigation, which leads to soil salinization. Therefore, it is essential to maintain ecological protection policies to safeguard soil quality. Given the area’s unique characteristics, large-scale afforestation and grassland restoration are unsuitable; instead, promoting water-saving irrigation techniques, such as drip and spray irrigation, is recommended to reduce evaporation and salinization. Additionally, organic farming and crop rotation can enhance soil fertility and biodiversity.
2. ECM zone: This zone encompasses POS, ES, and LS, such as uncultivated land, residential areas, water bodies, and forests. The LUI and LER indices show “severe”, “moderate” uncoordinated and “basic” coordination, indicating weak interaction and coordination (Figure 9). The increase in saline–alkali landscapes due to severe human impact has led to heightened land fragmentation and vulnerability. To improve this situation, it is crucial to mitigate human activity impacts and develop land use plans that limit activities potentially harmful to ecological balance. Establishing buffer zones at the edges of monitoring areas and implementing vegetation restoration and ecological rehabilitation projects (e.g., afforestation and wetland restoration) can reduce land fragmentation and vulnerability, preventing the expansion of ecologically fragile areas. An ecological monitoring system should be established to promptly identify and halt activities that may cause ecological degradation, along with providing technical support and training for residents to adopt more environmentally friendly lifestyles, thus enhancing public awareness of ecological protection.
3. EO zone: This zone mainly includes uncultivated land and grasslands, where the coupling coordination of LUI and LER shows a gradual upward trend, indicating enhanced interaction and coordination. With increased environmental protection efforts, the coordination level continues to rise (Figure 9). To further promote this harmonious state, strict ecological protection regulations should be enacted to restrict human activities within core areas, alongside economic incentives to encourage local communities’ participation in ecological protection efforts. Additionally, maintaining existing environmental policies, strengthening environmental monitoring and assessment, and ensuring the effectiveness of ecological protection measures are crucial. Establishing an ecological compensation mechanism can compensate areas or individuals affected by ecological conservation.
4. ER zone: This zone includes PES, ES, and LS, primarily featuring landscapes like forests, water bodies, and uncultivated land. LUI and LER coupling coordination show a downward trend, indicating a gradual decoupling (Figure 9). However, with decreasing precipitation, increasing evaporation, and rising temperatures, vegetation is transitioning from forest–meadow steppe to meadow steppe. At the same time, soil parent material changes from clayey to sandy, resulting in increased soil pH and lime content. Specific ecological restoration plans should be formulated and implemented to address these changes, including vegetation recovery, soil improvement, and soil and water conservation. For PESs, promoting mixed agricultural systems that combine crop cultivation with livestock farming can enhance ecosystem resilience. Additionally, scientific research should be conducted to identify the most effective restoration techniques and methods in collaboration with local communities to ensure restoration efforts align with local needs and cultural practices.
5. EPG zone: This zone is mainly found in PES and POS, where the coupling coordination of LUI and LER exhibits fluctuations but ultimately remains stable (Figure 9). Human induced social activities and their expanding scope have led to ecological degradation, but effective management can facilitate recovery. Therefore, subsequent efforts should promote ecological projects such as returning cultivated land to forests and grasslands in peripheral ecological restoration areas to maintain ecological stability and restore ecosystems. Activities that could lead to ecological degradation, such as overgrazing and illegal mining, should be limited. Economic incentives should be provided to encourage farmers’ participation in ecological restoration projects. Establishing a long-term monitoring and evaluation mechanism will ensure the sustainability and effectiveness of restoration efforts, along with strengthening the enforcement of laws and regulations to protect ecological governance zones from degradation.
4.6. Limitations and Prospects
This study is based on the PLES framework, coupling LUI and LER to identify ecological zones, explore the characteristics of each ecological zone, and provide targeted policy recommendations. By adopting a systematic framework, this research offers new perspectives for each ecological zone, promotes the study of the correlation between LUI and LER, and provides theoretical support for balancing conservation and economic development. In conclusion, our research contributes new insights toward achieving sustainable development goals.
Ecological risk analysis based on landscape thinking exhibits significant scale dependency. This study uses a 1 km × 1 km grid scale but has not fully considered the potential differences in landscape structure and ecological risk expression across varying scales. Future research should explore ecological risk variations at multiple scales, balancing the assessment results from different scales to ensure comprehensiveness, accuracy, and adaptability in the analysis.
In the coupled coordination model, we mainly considered LUI and LER from the perspectives of natural factors and human activities but did not delve into indirect influencing factors such as policy changes and climate change. Future research could further account for these potential factors, integrating indicators from multiple fields, including socio-economic factors, land use changes, and ecological risks, with multisource data for a comprehensive analysis. This would enhance the model’s comprehensiveness and applicability.
This study relies on 30 m resolution land use data from the Institute of Resources and Environmental Sciences, Chinese Academy of Sciences. Although these data have high accuracy, for studies requiring higher precision, it may be necessary to integrate more detailed remote sensing data or high-resolution ground observation data to further improve the accuracy of the results. At the same time, the model assumptions used in this study, such as the expression of ecological risk and the weighting of LUI, may not fully adapt to the unique characteristics of certain regions or ecosystems. Future research could combine additional data sources and optimize the model framework for broader validation and adjustments, thereby enhancing the model’s generalizability and accuracy.
Although this study conducted ecological zoning using LUI and LER, reflecting the external disturbances and internal vulnerabilities of ecosystems through the three main indicators of LER, these indicators do not encompass all factors that may influence ecological risk. To present a more comprehensive and objective view of ecological conditions, future research should further introduce a series of quantitative indicators that accurately reflect ecological vulnerability, such as the ecological sensitivity index, ecological resilience index, and biodiversity index. These indicators could help improve the ecological risk assessment model, provide deeper insights into their specific impacts on ecological vulnerability, and further enhance the accuracy and scientific rigor of ecological zoning.
5. Conclusions
This study innovatively proposes an ecological zoning method from a multidimensional perspective of PLES, coupling the interactions LUI-LER. Taking WJL as the research area, we first explored the evolution of PLES and assessed the spatiotemporal distribution characteristics of LUI and LER. Finally, ecological zones were delineated based on the LUI-LER CCD.
The study yields the following main conclusions: (1) Between 2000 and 2020, PS dominated, with PS, LS, and PLS showing a continuous growth trend, while ES exhibited a trend of first decreasing and then increasing. During this period, the area of outgoing PES was the largest, reaching 2784.23 km2, while the area of incoming PS was the largest, amounting to 3112.33 km2. (2) LUI displayed a spatial distribution characteristic of “high in the center, low in the east and west.” During 2000–2020, the “middle” intensity zone was the predominant type, accounting for 46%. During this period, the areas of “weakest,” “stronger,” and “strongest” intensity zones decreased by 124.16 km2, 193.83 km2, and 682.89 km2, respectively, while the area of the “weaker” intensity zone increased by 48.23 km2, indicating an overall declining trend in LUI. (3) LER exhibited a spatial distribution characteristic of “low in the center, high in the east and west.” During 2000–2020, the “highest” risk zone was the predominant type, constituting 45%. Over this period, the “lowest” risk zone gradually increased, while the “lower” risk zone showed a trend of first decreasing and then increasing. Between 2000 and 2005, the areas of “medium,” “higher,” and “highest” risk zones increased by 490.66 km2, 1036.71 km2, and 757.65 km2, respectively, but remained stable or decreased by 2020. (4) From 2000 to 2020, the CCD of LUI and LER displayed polarized characteristics, indicating a catching-up effect in low-coupling coordination areas, while growth in high-coupling coordination areas was relatively slow. Overall, the CCD of LUI and LER in the study area exhibited an upward trend. (5) The ecological zoning in WJL can be categorized into an ECP zone, EPG zone, ECM zone, EO zone, and ER zone, with ECP zone dominating, accounting for 61.63% of the total area of the study area.
In summary, the research findings provide a scientific basis for sustainable development in the spatial planning and ecological management zoning of the study area.
Author Contributions
Conceptualization, S.R. and Y.B.; methodology, S.R. and Z.T.; software, B.M.; validation, Z.T.; formal analysis, F.Z.; investigation, X.L.; resources, B.M.; data curation, J.X.; writing—original draft preparation, S.R.; writing—review and editing, S.R. and Y.B.; supervision, J.Z. All authors have read and agreed to the published version of the manuscript.
Funding
This research was funded by the Science and Technology Development Planning of Jilin Province, (China) (20210203176SF); the Major Science and Technology Program of Jilin Province (YDZJ202303CGZH023).
Institutional Review Board Statement
Not applicable.
Informed Consent Statement
Not applicable.
Data Availability Statement
The data presented in this study are available on request from the corresponding author.
Conflicts of Interest
The authors declare no conflicts of interest.
References
- Stephenson, J.; Crane, S.F.; Levy, C.; Maslin, M. Population, development, and climate change: Links and effects on human health. Lancet 2013, 382, 1665–1673. [Google Scholar] [CrossRef] [PubMed]
- Jiang, X.T.; Zhai, S.Y.; Liu, H.; Chen, J.; Zhu, Y.Y.; Wang, Z. Multi-scenario simulation of production-living-ecological space and ecological effects based on shared socioeconomic pathways in Zhengzhou, China. Ecol. Indic. 2022, 137, 108750. [Google Scholar] [CrossRef]
- Li, W.; Kang, J.; Wang, Y. Effects of habitat fragmentation on ecosystem services and their trade-offs in Southwest China: A multi-perspective analysis. Ecol. Indic. 2024, 167, 112699. [Google Scholar] [CrossRef]
- Hasan, S.S.; Zhen, L.; Miah, M.G.; Ahamed, T.; Samie, A. Impact of land use change on ecosystem services: A review. Environ. Dev. 2020, 34, 100527. [Google Scholar] [CrossRef]
- Zheng, H.N.; Peng, J.; Qiu, S.J.; Xu, Z.H.; Zhou, F.; Xia, P.; Adalibieke, W. Distinguishing the impacts of land use change in intensity and type on ecosystem services trade-offs. J. Environ. Manag. 2022, 316, 115206. [Google Scholar] [CrossRef]
- Canelas, J.V.; Pereira, H.M. Impacts of land-use intensity on ecosystems stability. Ecol. Model. 2022, 472, 110093. [Google Scholar] [CrossRef]
- Dadashpoor, H.; Azizi, P.; Moghadasi, M. Land use change, urbanization, and change in landscape pattern in a metropolitan area. Sci. Total Environ. 2019, 655, 707–719. [Google Scholar] [CrossRef] [PubMed]
- Wang, J.; Sun, Q.; Zou, L. Spatial-temporal evolution and driving mechanism of rural production-living-ecological space in Pingtan islands, China. Habitat Int. 2023, 137, 110093. [Google Scholar] [CrossRef]
- Zhao, J.; Zhao, Y. Synergy/trade-offs and differential optimization of production, living, and ecological functions in the Yangtze River economic Belt, China. Ecol. Indic. 2023, 147, 109925. [Google Scholar] [CrossRef]
- Zhang, Q.-H.; Wang, J.-B. Multi-functional coupling-based rural ecological pattern construction and network prioritization evaluation: A case study of Jiangning District, Nanjing. Ecol. Indic. 2024, 166, 112277. [Google Scholar] [CrossRef]
- Zhang, Y.; Zheng, M.; Qin, B. Optimization of spatial layout based on ESV-FLUS model from the perspective of “Production-Living-Ecological”: A case study of Wuhan City. Ecol. Model. 2023, 481, 110356. [Google Scholar] [CrossRef]
- Wang, H.; Liu, X.; Zhao, C.; Chang, Y.; Liu, Y.; Zang, F. Spatial-temporal pattern analysis of landscape ecological risk assessment based on land use/land cover change in Baishuijiang National nature reserve in Gansu Province, China. Ecol. Indic. 2021, 124, 107454. [Google Scholar] [CrossRef]
- Wan, H.; Wang, S.; Chen, B.; Xia, C.; Su, R. Ecological risk assessment and spatial threshold analysis of wetlands in the Sanjiang Plain. Acta Ecol. Sin. 2022, 42, 6595–6606. [Google Scholar]
- Liu, L.; Wei, J.; Luo, P.; Zhang, Y.; Wang, Y.; Elbeltagi, A.; Zainol, M.R.R.M.A. A novel quantity assessment of landscape ecological risk using human-nature driving mechanism for sustainable society. Sci. Total Environ. 2024, 947, 173892. [Google Scholar] [CrossRef]
- Kang, L.; Yang, X.; Gao, X.; Zhang, J.; Zhou, J.; Hu, Y.; Chi, H. Landscape ecological risk evaluation and prediction under a wetland conservation scenario in the Sanjiang Plain based on land use/cover change. Ecol. Indic. 2024, 162, 112053. [Google Scholar] [CrossRef]
- Jiang, X.; Wang, B.; Fang, Q.; Bai, P.; Guo, T.; Wu, Q. Ecological Zoning Management Strategies in China: A Perspective of Ecosystem Services Supply and Demand. Land 2024, 13, 1112. [Google Scholar] [CrossRef]
- Du, L.; Dong, C.; Kang, X.; Qian, X.; Gu, L. Spatiotemporal evolution of land cover changes and landscape ecological risk assessment in the Yellow River Basin, 2015–2020. J. Environ. Manag. 2023, 332, 117149. [Google Scholar] [CrossRef] [PubMed]
- Zeng, J.; Wu, J.; Chen, W. Coupling analysis of land use change with landscape ecological risk in China: A multi-scenario simulation perspective. J. Clean. Prod. 2024, 435, 140518. [Google Scholar] [CrossRef]
- Li, J.; Hu, D.; Wang, Y.; Chu, J.; Yin, H.; Ma, M. Study of identification and simulation of ecological zoning through integration of landscape ecological risk and ecosystem service value. Sustain. Cities Soc. 2024, 107, 105442. [Google Scholar] [CrossRef]
- Liu, H.; Tang, D. Ecological zoning and ecosystem management based on landscape ecological risk and ecosystem services: A case study in the Wuling Mountain Area. Ecol. Indic. 2024, 166, 112421. [Google Scholar] [CrossRef]
- Xie, Y.; Wang, S.; Xiang, S.; Wang, Z.; Li, Y.; Wang, Z.; Zhou, M.; Wang, Y.; Gao, M. Ecological zoning and dynamic assessment of effectiveness in the Three Gorges Reservoir Area, China. Ecol. Model. 2024, 487, 110563. [Google Scholar] [CrossRef]
- Li, Y.; Li, Q.; Guo, D.; Liang, S.; Wang, Y. Ecological stoichiometry homeostasis of Leymus chinensis in degraded grassland in western Jilin Province, NE China. Ecol. Eng. 2016, 90, 387–391. [Google Scholar] [CrossRef]
- Li, T.; Bian, J.; Ruan, D.; Xu, L.; Zhang, S. Groundwater health risk assessment and its temporal and spatial evolution based on trapezoidal fuzzy number-Monte Carlo stochastic simulation: A case study in western Jilin province. Ecotoxicol. Environ. Saf. 2024, 282, 116736. [Google Scholar] [CrossRef]
- Wang, F.; Han, Y.; Xu, Y.; Zhu, R.; Qu, C.; Zhang, P.; Martin, S.; Zhuang, L.; Liu, Z.; Zhang, J.; et al. Spatial-temporal variation and influencing factors of ecological environment quality in Jilin Province (China). Front. Environ. Sci. 2024, 12, 1446313. [Google Scholar] [CrossRef]
- GB/T 21010-2017; Current Land Use Classification. Standardization Administration of China: Beijing, China, 2017; p. 16.
- Wang, A.; Liao, X.; Tong, Z.; Du, W.; Zhang, J.; Liu, X.; Liu, M. Spatial-temporal dynamic evaluation of the ecosystem service value from the perspective of “production-living-ecological” spaces: A case study in Dongliao River Basin, China. J. Clean. Prod. 2022, 333, 130218. [Google Scholar] [CrossRef]
- Song, Z.; Bao, Y.; Zhang, J.; Ersi, C.; Riao, D.; Bao, Y.; Bao, Y. Threshold-determined ecological risk early warning models are effective tools for conservation strategies guiding. J. Clean. Prod. 2024, 462, 142630. [Google Scholar] [CrossRef]
- Duan, Y.; Wang, H.; Huang, A.; Xu, Y.; Lu, L.; Ji, Z. Identification and spatial-temporal evolution of rural “production-living-ecological” space from the perspective of villagers’ behavior—A case study of Ertai Town, Zhangjiakou City. Land Use Policy 2021, 106, 105457. [Google Scholar] [CrossRef]
- Zhuang, D.; Liu, J. Modeling of regional differentiation of land-use degree in China. Chin. Geogr. Sci. 1997, 7, 302–309. [Google Scholar] [CrossRef]
- Zhang, Y.; Hu, X.; Wei, B.; Zhang, X.; Tang, L.; Chen, C.; Wang, Y.; Yang, X. Spatiotemporal exploration of ecosystem service value, landscape ecological risk, and their interactive relationship in Hunan Province, Central-South China, over the past 30 years. Ecol. Indic. 2023, 156, 111066. [Google Scholar] [CrossRef]
- Huang, L.; Yuan, L.; Xia, Y.; Yang, Z.; Luo, Z.; Yan, Z.; Li, M.; Yuan, J. Landscape ecological risk analysis of subtropical vulnerable mountainous areas from a spatiotemporal perspective: Insights from the Nanling Mountains of China. Ecol. Indic. 2023, 154, 110883. [Google Scholar] [CrossRef]
- Meng, R.; Meng, Z.; Li, H.; Cai, J.; Qin, L. Changes in landscape ecological risk in the Beijing-Tianjin Sandstorm source control project area from a spatiotemporal perspective. Ecological Indicators 2024, 167, 112569. [Google Scholar] [CrossRef]
- Xu, C.; Li, B.; Kong, F.; He, T. Spatial-temporal variation, driving mechanism and management zoning of ecological resilience based on RSEI in a coastal metropolitan area. Ecol. Indic. 2024, 158, 111447. [Google Scholar] [CrossRef]
- Ma, H.; Lu, S.; Zhang, W. Coupling process and mechanism of urbanization and innovation in Beijing-Tianjin-Hebei Urban Agglomeration. Geogr. Res. 2020, 39, 303–318. [Google Scholar]
- Pan, H.; Du, Z.; Wu, Z.; Zhang, H.; Ma, K. Assessing the coupling coordination dynamics between land use intensity and ecosystem services in Shanxi’s coalfields, China. Ecol. Indic. 2024, 158, 111321. [Google Scholar] [CrossRef]
- Qi, Y.; Wang, R.; Shen, P.; Ren, S.; Hu, Y. Impacts of Land Use Intensity on Ecosystem Services: A Case Study in Harbin City, China. Sustainability 2023, 15, 14877. [Google Scholar] [CrossRef]
- Wang, Q.; Bai, X. Spatiotemporal characteristics and driving mechanisms of land-use transitions and landscape patterns in response to ecological restoration projects: A case study of mountainous areas in Guizhou, Southwest China. Ecol. Inform. 2024, 82, 102748. [Google Scholar] [CrossRef]
- Zhang, S.; Zhang, J.; Sha, A.; Zhang, Y.; Zhang, D. How to recognize the role of policy clusters in built-up land intensity: An empirical case of the Yangtze River Economic Belt of China. Land Use Policy 2023, 134, 106909. [Google Scholar] [CrossRef]
- Yin, L.; Dai, E.; Xie, G.; Zhang, B. Effects of Land-Use Intensity and Land Management Policies on Evolution of Regional Land System: A Case Study in the Hengduan Mountain Region. Land 2021, 10, 528. [Google Scholar] [CrossRef]
- Cao, Y.; Zhang, M.; Zhang, Z.; Liu, L.; Gao, Y.; Zhang, X.; Chen, H.; Kang, Z.; Liu, X.; Zhang, Y. The impact of land-use change on the ecological environment quality from the perspective of production-living-ecological space: A case study of the northern slope of Tianshan Mountains. Ecol. Inform. 2024, 83, 102795. [Google Scholar] [CrossRef]
- Qu, Y.; Su, D.; Wei, C.; Zhang, Q.; Jiang, G. How to prevent landscape ecological risk with a land use optimal allocation system: An empirical study of the Yellow River Delta in China. Ecol. Indic. 2023, 154, 110888. [Google Scholar] [CrossRef]
- Leal Pacheco, F.A.; Sanches Fernandes, L.F.; Valle Junior, R.F.; Valera, C.A.; Tarle Pissarra, T.C. Land degradation: Multiple environmental consequences and routes to neutrality. Curr. Opin. Environ. Sci. Health 2018, 5, 79–86. [Google Scholar] [CrossRef]
- Tan, L.; Luo, W.; Yang, B.; Huang, M.; Shuai, S.; Cheng, C.; Zhou, X.; Li, M.; Hu, C. Evaluation of landscape ecological risk in key ecological functional zone of South-to-North Water Diversion Project, China. Ecol. Indic. 2023, 147, 109934. [Google Scholar] [CrossRef]
- Xiong, S.; Yang, F.; Zhang, J.; Tang, Y. An integrated model chain for diagnosing and predicting conflicts between production-living-ecological space in lake network regions: A case of the Dongting Lake region, China. Ecol. Indic. 2024, 166, 112237. [Google Scholar] [CrossRef]
- Yang, D.; Yang, Q.; Tong, Z.; Du, W.; Zhang, J. Coupling coordination analysis of production, living, and ecological spaces in wetlands: A case study of Xianghai Wetland nature reserve, China. Ecol. Indic. 2024, 158, 111578. [Google Scholar] [CrossRef]
- Gries, T.; Redlin, M.; Ugarte, J.E. Human-induced climate change: The impact of land-use change. Theor. Appl. Climatol. 2019, 135, 1031–1044. [Google Scholar] [CrossRef]
- Wei, Y.; Zhou, P.; Zhang, L.; Zhang, Y. Spatio-temporal evolution analysis of land use change and landscape ecological risks in rapidly urbanizing areas based on Multi-Situation simulation—A case study of Chengdu Plain. Ecol. Indic. 2024, 166, 112245. [Google Scholar] [CrossRef]
- Deng, G.; Jiang, H.; Zhu, S.; Wen, Y.; He, C.; Wang, X.; Sheng, L.; Guo, Y.; Cao, Y. Projecting the response of ecological risk to land use/land cover change in ecologically fragile regions. Sci. Total Environ. 2024, 914, 169908. [Google Scholar] [CrossRef] [PubMed]
- Zhang, L.; Hu, B.; Zhang, Z.; Liang, G. Research on the spatiotemporal evolution and mechanism of ecosystem service value in the mountain-river-sea transition zone based on “production-living-ecological space”—Taking the Karst-Beibu Gulf in Southwest Guangxi, China as an example. Ecol. Indic. 2023, 148, 109889. [Google Scholar] [CrossRef]
- Liang, Y.; Song, W. Integrating potential ecosystem services losses into ecological risk assessment of land use changes: A case study on the Qinghai-Tibet Plateau. J. Environ. Manag. 2022, 318, 115607. [Google Scholar] [CrossRef] [PubMed]
- Pang, R.; Hu, N.; Zhou, J.; Sun, D.; Ye, H. Study on Eco-Environmental Effects of Land-Use Transitions and Their Influencing Factors in the Central and Southern Liaoning Urban Agglomeration: A Production–Living–Ecological Perspective. Land 2022, 11, 937. [Google Scholar] [CrossRef]
- Xie, H.K.; Huang, M.H.; Lei, W.T.; Wang, Y.; Ou, L. Quantitative analysis of big data for land resource classification and zoning at the township level in Northern Shaanxi. Big Data Res. 2024, 36, 100458. [Google Scholar] [CrossRef]
- Li, Y.P.; Zhang, S.Q.; Zhao, J.S.; Zhang, G.R.; Qu, G.X.; Ma, S.L.; Liu, X.B. Spatiotemporal evolution and Sustainably comprehensive zoning optimization of production-living-ecological functions in the Mountain-Flatland areas. Heliyon 2024, 10, e23425. [Google Scholar] [CrossRef] [PubMed]
- Tian, F.H.; Li, M.Y.; Han, X.L.; Liu, H.; Mo, B.X. A Production-Living-Ecological Space Model for Land-Use Optimisation: A case study of the core Tumen River region in China. Ecol. Model. 2020, 437, 109310. [Google Scholar] [CrossRef]
- Xu, Y.; Tang, H.; Wang, B.; Chen, J. Effects of land-use intensity on ecosystem services and human well-being: A case study in Huailai County, China. Environ. Earth Sci. 2016, 75, 416. [Google Scholar] [CrossRef]
- Bian, J.; Chen, W.; Zeng, J. Ecosystem services, landscape pattern, and landscape ecological risk zoning in China. Environ. Sci. Pollut. Res. 2023, 30, 17709–17722. [Google Scholar] [CrossRef] [PubMed]
- Gong, J.; Cao, E.J.; Xie, Y.C.; Xu, C.X.; Li, H.Y.; Yan, L.L. Integrating ecosystem services and landscape ecological risk into adaptive management: Insights from a western mountain-basin area, China. J. Environ. Manag. 2021, 281, 111817. [Google Scholar] [CrossRef] [PubMed]
- Wu, Y.; Wu, Y.; Li, C.; Gao, B.; Zheng, K.; Wang, M. Construction of ecological zoning of plateau lake basin based on spatial conflict and eco-environmental quality: A case of Dianchi Lake Basin. Acta Ecol. Sin. 2024, 44, 1052–1066. [Google Scholar]


Disclaimer/Publisher’s Note: The statements, opinions and data contained in all publications are solely those of the individual author(s) and contributor(s) and not of MDPI and/or the editor(s). MDPI and/or the editor(s) disclaim responsibility for any injury to people or property resulting from any ideas, methods, instructions or products referred to in the content. |
© 2024 by the authors. Licensee MDPI, Basel, Switzerland. This article is an open access article distributed under the terms and conditions of the Creative Commons Attribution (CC BY) license (https://creativecommons.org/licenses/by/4.0/).