Article

Measurement of Synergy Management Performance in Prefabricated Building Project Supply Chain

School of Civil Engineering and Architecture, East China Jiaotong University, Nanchang 330013, China
*
Author to whom correspondence should be addressed.
Sustainability 2024, 16(24), 11025; https://doi.org/10.3390/su162411025
Submission received: 5 November 2024 / Revised: 6 December 2024 / Accepted: 11 December 2024 / Published: 16 December 2024

Abstract

:
Prefabricated building (PB) involves many participating enterprises. Its implementation faces many challenges, mainly in the areas of technology, cost, construction management, management of supply chain (SC), and sustainability. The purpose of synergy management of a prefabricated building project supply chain (PBPSC) is to help the whole SC obtain better benefits. This study establishes a measurement index system from the perspective of green sustainability in terms of cost control, technology, information, reliability of SC, and environmental protection. The COWA-CRITIC ideal point method is used to calculate the subjective and objective combination weights, and a cloud model based on this combination weight is constructed for measurement, which is validated by taking the project of a residential building as an example. The results are compared with those of other measurement models to verify the applicability of the measurement model of this study in the synergy management performance of the PBPSC. The sensitivity of the indexes within the five subsystems is analyzed using the one-way rotation OAT method to allow decision makers to identify the most sensitive indexes. This study shows that the synergy management performance of SC in this project is better. The measurement model used in this study is consistent with the results obtained from other measurement models and is in line with the actual situation. Sensitivity analysis using the one-factor rotation OAT method shows that among the secondary indexes, specialized technical staff is the most sensitive to changes in weights; among the primary indexes, cost control is the most sensitive to changes in weights. This provides a new method for measuring the synergy management performance of the PBPSC. Based on the results of this study, corresponding countermeasures are proposed for the synergy management of the PBPSC, which will provide a reference for the synergy management of SCs with similar projects in the future.

1. Introduction

The construction industry is a key sector of China’s energy consumption and carbon emissions. Its high pollution and high energy consumption problems have always existed. The construction industry in China accounts for 38% of the total global carbon emissions, and the challenge of carbon emission reduction is significant [1,2]. Green building in China started in 2008, later than developed countries, but it is developing rapidly. The “dual-carbon” targets set out in September 2020 are to peak carbon dioxide emissions by 2030 and to achieve carbon neutrality by 2060, respectively [3]. Prefabricated building (PB) is a type of construction in which the components are prefabricated in a factory and then assembled at the construction site [4,5]. In recent years, the state has strongly supported PB, and in February 2022, the Ministry of Housing and Urban–Rural Development released the “14th Five-Year Plan” for the development of the construction industry, proposing that by 2025, PB should account for more than 30% of the proportion of new buildings [6,7].
For the construction industry in a complex environment, problems all interact with each other, causing knock-on losses [8]. Market competition in the industry of PB has realized a shift from competition between single enterprises to competition between each supply chain (SC) [9]. The Chinese government proposes to lay out the industrial chain around the development of new quality productivity and improve the resilience of SC [10]. The importance of new quality productivity in the process of transformation and upgrading of the construction industry is self-evident. PB is a specific application of new quality productivity in the transformation and upgrading of the construction industry [11]. Separation of design and construction, poor enterprise synergy, and low application of information technology are often problems in the process of PB project management, leading to difficulties in cost control [12]. The essential link in the construction process is the management of SC, which is currently facing certain challenges, mainly material procurement, cost control, information flow, and so on. For companies, the prefabricated building project supply chain (PBPSC) has different characteristics, varying in terms of company size, production capacity, and profitability [13]. In the event of an emergency, SC may be at risk of disruption, jeopardizing the progress of the project and weakening the overall competitiveness of key enterprises in SC [14,15]. A favorable synergy management of SC can effectively improve construction efficiency [16]. The single management mode of PBPSC affects the development of PB to promote the better development of PB. It is necessary to continuously optimize the management mode of SCs and efficiently maintain the synergistic relationship of PBPSC to allow each participating enterprise to obtain better benefits. Based on this, this study conducts research from the perspective of green sustainability to effectively leverage the synergistic effects of SCs and enhance the stability of SCs, thereby improving the market competitiveness of PB and promoting the development of the industry.

2. Literature Review

2.1. Prefabricated Building Project Supply Chain

As a special branch of the building supply chain, PBPSC has a unique complexity and dynamic. SC processes in the manufacturing industry usually consist of procurement, production, logistics, and inventory [17]. In contrast, the building supply chain, especially PBPSC, is more complex because it involves a number of links such as the design, production, construction, and assembly of prefabricated components [4,13,18]. The characteristics of the building supply chain are more complex and unpredictable than those of the manufacturing industry. In 1992, Koskela applied the first management model of SC to the construction industry [19], emphasizing the importance of strategically working with subcontractors and suppliers to meet the owner’s needs by systematically analyzing logistics, financial, and information flows [20].
In recent years, scholars have paid great attention to the resilience, sustainability, and risk management of PBPSCs [21,22,23,24,25,26,27,28,29,30,31,32,33,34,35,36]. From the perspective of resilience, it is crucial for PBPSCs to demonstrate the ability to adapt and evolve in the face of risky changes [21,22,23,24,25,26]. Scholars have explored key factors to improve the resilience of SCs, such as predictability, flexibility, financial resources, and resources, by constructing ISM models and applying SNA and SDM analysis [21,22,23]. In addition, the sustainability of SC is also regarded as key to achieving the management objectives of SCs in the long term, especially in terms of environmental protection, which needs to be improved [27,28,29]. In terms of risk management, scholars have thoroughly studied the various risks and their influencing factors in PBPSCs. Issues such as project changes, the inexperience of contractors, the complexity of the prefabrication process, and diverse suppliers have all been pointed out as factors that exacerbate risks in SCs [30,31,32]. To effectively control these risks, scholars have proposed a variety of strategies and methods, such as the implementation of risk response strategies, reasonable control of transportation distance, and assembly cycle time [33,34,35,36].

2.2. Synergy in Prefabricated Building Project Supply Chains

Collaborative decision making is an effective means for enterprises in SCs to achieve mutual benefits and sustainable development [37]. The collaboration of SCs emphasizes that firms work together in a closer way by sharing information and resources to improve efficiency, shorten lead times, and reduce costs [38]. PB is critical to ensure effective collaboration among all parties due to its high dependency on prefabricated component production, transportation, and installation and the need for coordination among different stakeholders. However, in practice, these collaboration challenges often make projects inefficient and even lead to delays and cost overruns. For example, the residential project of PB from Brawl Ree, Singapore, achieved the comprehensive coordination and optimization of design, production, construction, and management of SCs. All parties involved are able to share data in real-time and make precise collaborative decisions to ensure the smooth progress of the project. This not only improved construction efficiency but also reduced costs. Akintoye et al. [39] identified factors such as workplace culture, lack of managerial commitment, insufficient knowledge of management concepts in SCs, and irrational organizational structure as barriers to synergy in the building supply chain. Toroghi Bidabadi et al. [40] emphasized the impact of managerial, financial, and structural factors on the synergy of SCs in the construction industry in Iran.
To improve the synergy efficiency of PBPSCs, scholars have conducted extensive research. Koolwijk [41] argued that improving the degree of collaboration in SCs cannot solely rely on the improvement of project delivery methods. Shi et al. [42] found that co-innovation activities and BIM applications can promote knowledge sharing among member firms through the establishment of SEM models to enhance the innovative performance of SCs. Meanwhile, Liu and Zhu [43] identified the factors affecting synergy management in PBPSCs from the perspective of the general contractor and emphasized the continuous innovation of synergy management concepts. In addition, information sharing is considered to be the key to synergy optimization, while cost control is one of the current urgent issues [44,45].
Although research on PBPSCs has made significant progress in terms of resilience, sustainability, and risk management, there is still insufficient research on measuring the performance of the collaborative management of PBPSCs from a green and sustainable perspective. Most of the current studies have limitations, which restrict the generalizability and representativeness of the findings. In addition, the performance measurement indexes used in many studies are relatively homogeneous, failing to comprehensively reflect the multidimensional collaborative management performance of SCs, and also failing to fully consider the new requirements of green and sustainable development and the application of new technologies. To address these shortcomings, this study will focus on the measurement of collaborative management performance in PBPSCs. A cloud model based on the COWA-CRITIC ideal point method is proposed, aiming to overcome the limitations of existing studies, assess the collaborative management performance more comprehensively, and provide a scientific basis for promoting the green and sustainable development of PB.

3. Measurement Index System

3.1. Identification of Influencing Factors

Various links in PBPSCs are closely interconnected, and identifying the influencing factors and establishing an index system is the key to measuring the performance of synergy management in PBPSCs. Therefore, this study starts from a green and sustainable perspective, analyzing relevant standard documents to sort out the factors that appear more than three times in the literature about PBPSCs [46,47]. These were categorized into cost control, technology, information, reliability of SC, and environmental protection, as shown in Table 1.

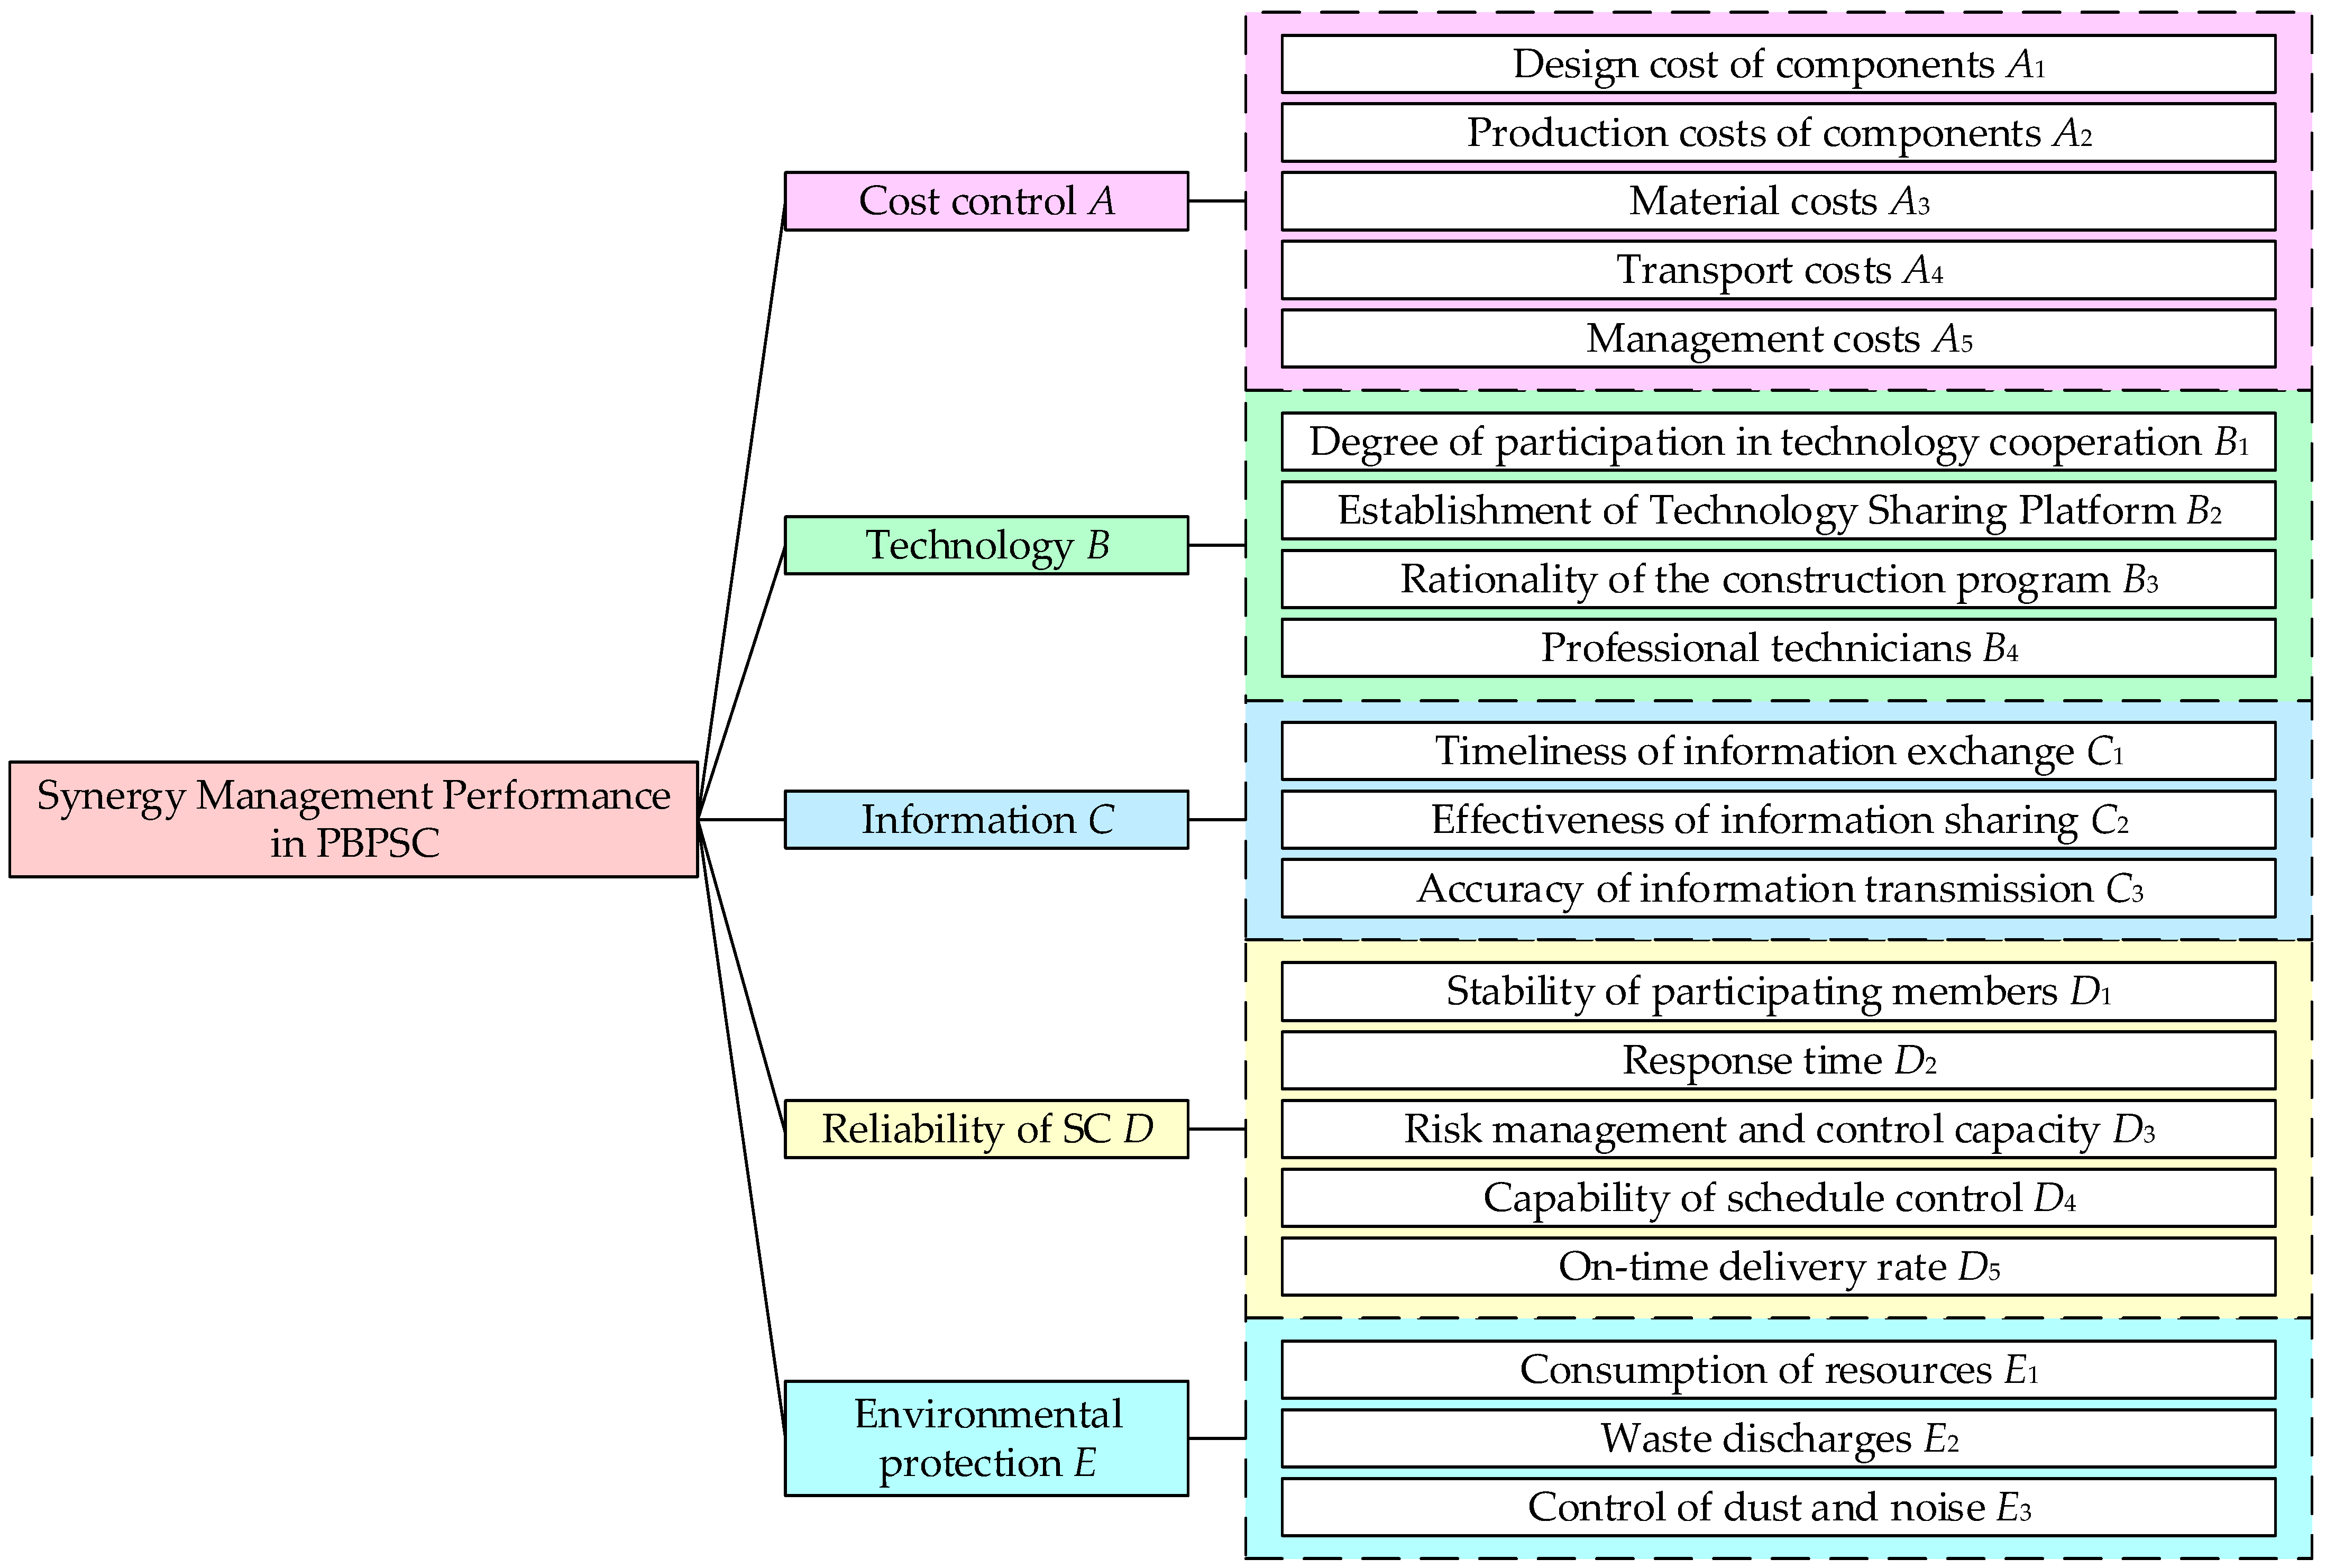
3.2. Establishment of the Measurement Index System

3.2.1. Cost Control

Cost control can directly respond to the degree of synergy among enterprises, and the key to improving the competitiveness of enterprises is to realize the goals while controlling costs reasonably. In the projects of PB, if the design cost of components is too high, it may lead to the use of excessively expensive or unnecessary materials and processes in the design and production process, resulting in a waste of resources. The production cost of components is directly related to the efficiency, cost-effectiveness, and overall competitiveness of SCs. If the production cost is too high, it will increase the burden on each participating enterprise in the SC and reduce the incentive for synergy and participation. In the synergy management of SCs, the control of material cost is a core issue of common concern for each enterprise participating in the SC. Material cost is an important part of the cost of a project in PB, which directly affects the profitability and market competitiveness of the project, and also determines the effect of the synergy management in SCs. Transportation cost is an important expense in PBPSCs, and directly affects the overall cost of a project. The level of transportation cost directly affects the transportation efficiency and response speed of SCs. Management costs include all kinds of expenses involved in the management process of an enterprise. In the collaborative management of PBPSCs, whether the management costs are effectively controlled and optimized determines the synergy efficiency. In comparison with the existing literature, this part of the index highlights the characteristics of the projects in PB while taking into account the generic cost elements, and it is highly relevant and universal.

3.2.2. Technology

Synergy management in PBPSCs requires personnel with a good understanding of PB and the concept of synergy management, and the success of the project lies in the level of participation in technical cooperation among the various firms. The higher the level of participation in technical cooperation, the more complementary each participating enterprise in the SC is in terms of technology, market, and resources. A technology-sharing platform provides a centralized and unified information exchange channel for each participating enterprise in PBPSCs. Through technical exchanges, knowledge sharing, and cooperative research and development activities on the platform, the innovation and standardization process of technology in PB can be promoted, so that the technical level and competitiveness of the whole SC can be improved. Unreasonable construction programs can lead to confusion and schedule delays at the construction site, further affecting the stability of SC and leading to a reduction in the efficiency of the synergy between the participating enterprises. In comparison with the existing literature, the indexes in this section are more focused on the practical operational aspects of technology cooperation and sharing, while taking into account the importance of construction programs and technical personnel to ensure the comprehensiveness and practicality of the index system.

3.2.3. Information

The PB has very high requirements for information flow, and efficient and accurate information transfer is the key to the collaboration of PBPSCs. In PB projects, through timely information exchange, each participating enterprise in a SC is able to keep abreast of market dynamics and changes in customer demand to ensure that the project can be delivered on time and meet customer needs. Information sharing is a key factor that enables participating companies to manage projects effectively [62]. The effectiveness of information sharing can directly affect the allocation of resources in SCs. When information sharing is effective, the participating enterprises in a SC can know the demand and supply of materials and components in real time, and the information transfer between each link is smoother so that they can respond to the market demand and changes. Whether the information exchange is accurate or not can determine whether each participating enterprise can respond to market demand and changes more quickly and efficiently mediate the synergy of the SC. In comparison with the existing literature, this part of the indicator focuses more on the actual transmission and exchange process of information, especially the timeliness and accuracy of information sharing and the timeliness of the information, so as to be closer to the actual needs of collaborative management in SCs.

3.2.4. Reliability of SCs

In PBPSCs, if the response time is too long, it will lead to poor information transfer, affecting the communication and collaboration between the various participating enterprises, which may lead to the phenomenon of information islands in SCs. Poor risk control ability will increase the possibility of risk events and also make the participating enterprises unable to keep abreast of the latest progress and changes in the project, which affects the synergistic efficiency of the SC. The extension of the construction period will not only lead to greater economic losses—for example, a prefabricated building project in Nanchang City resulted in a delay of more than three months due to errors in the design and processing of components, resulting in greater economic losses—but also affect the cooperation of the participating enterprises in various segments, as prefabricated components, production, and transportation plans need to be adjusted, which will increase the complexity of the SC and costs. PB materials need to be prefabricated and processed in factories and then assembled on-site, and whether the components can be delivered on time can determine the trust and cooperation between the various links in SCs. In comparison with the existing literature, this part of the index focuses more on the actual operational aspects of SCs while taking into account the importance of risk management and on-time delivery, which can more accurately reflect the reliability of SCs.

3.2.5. Environmental Protection
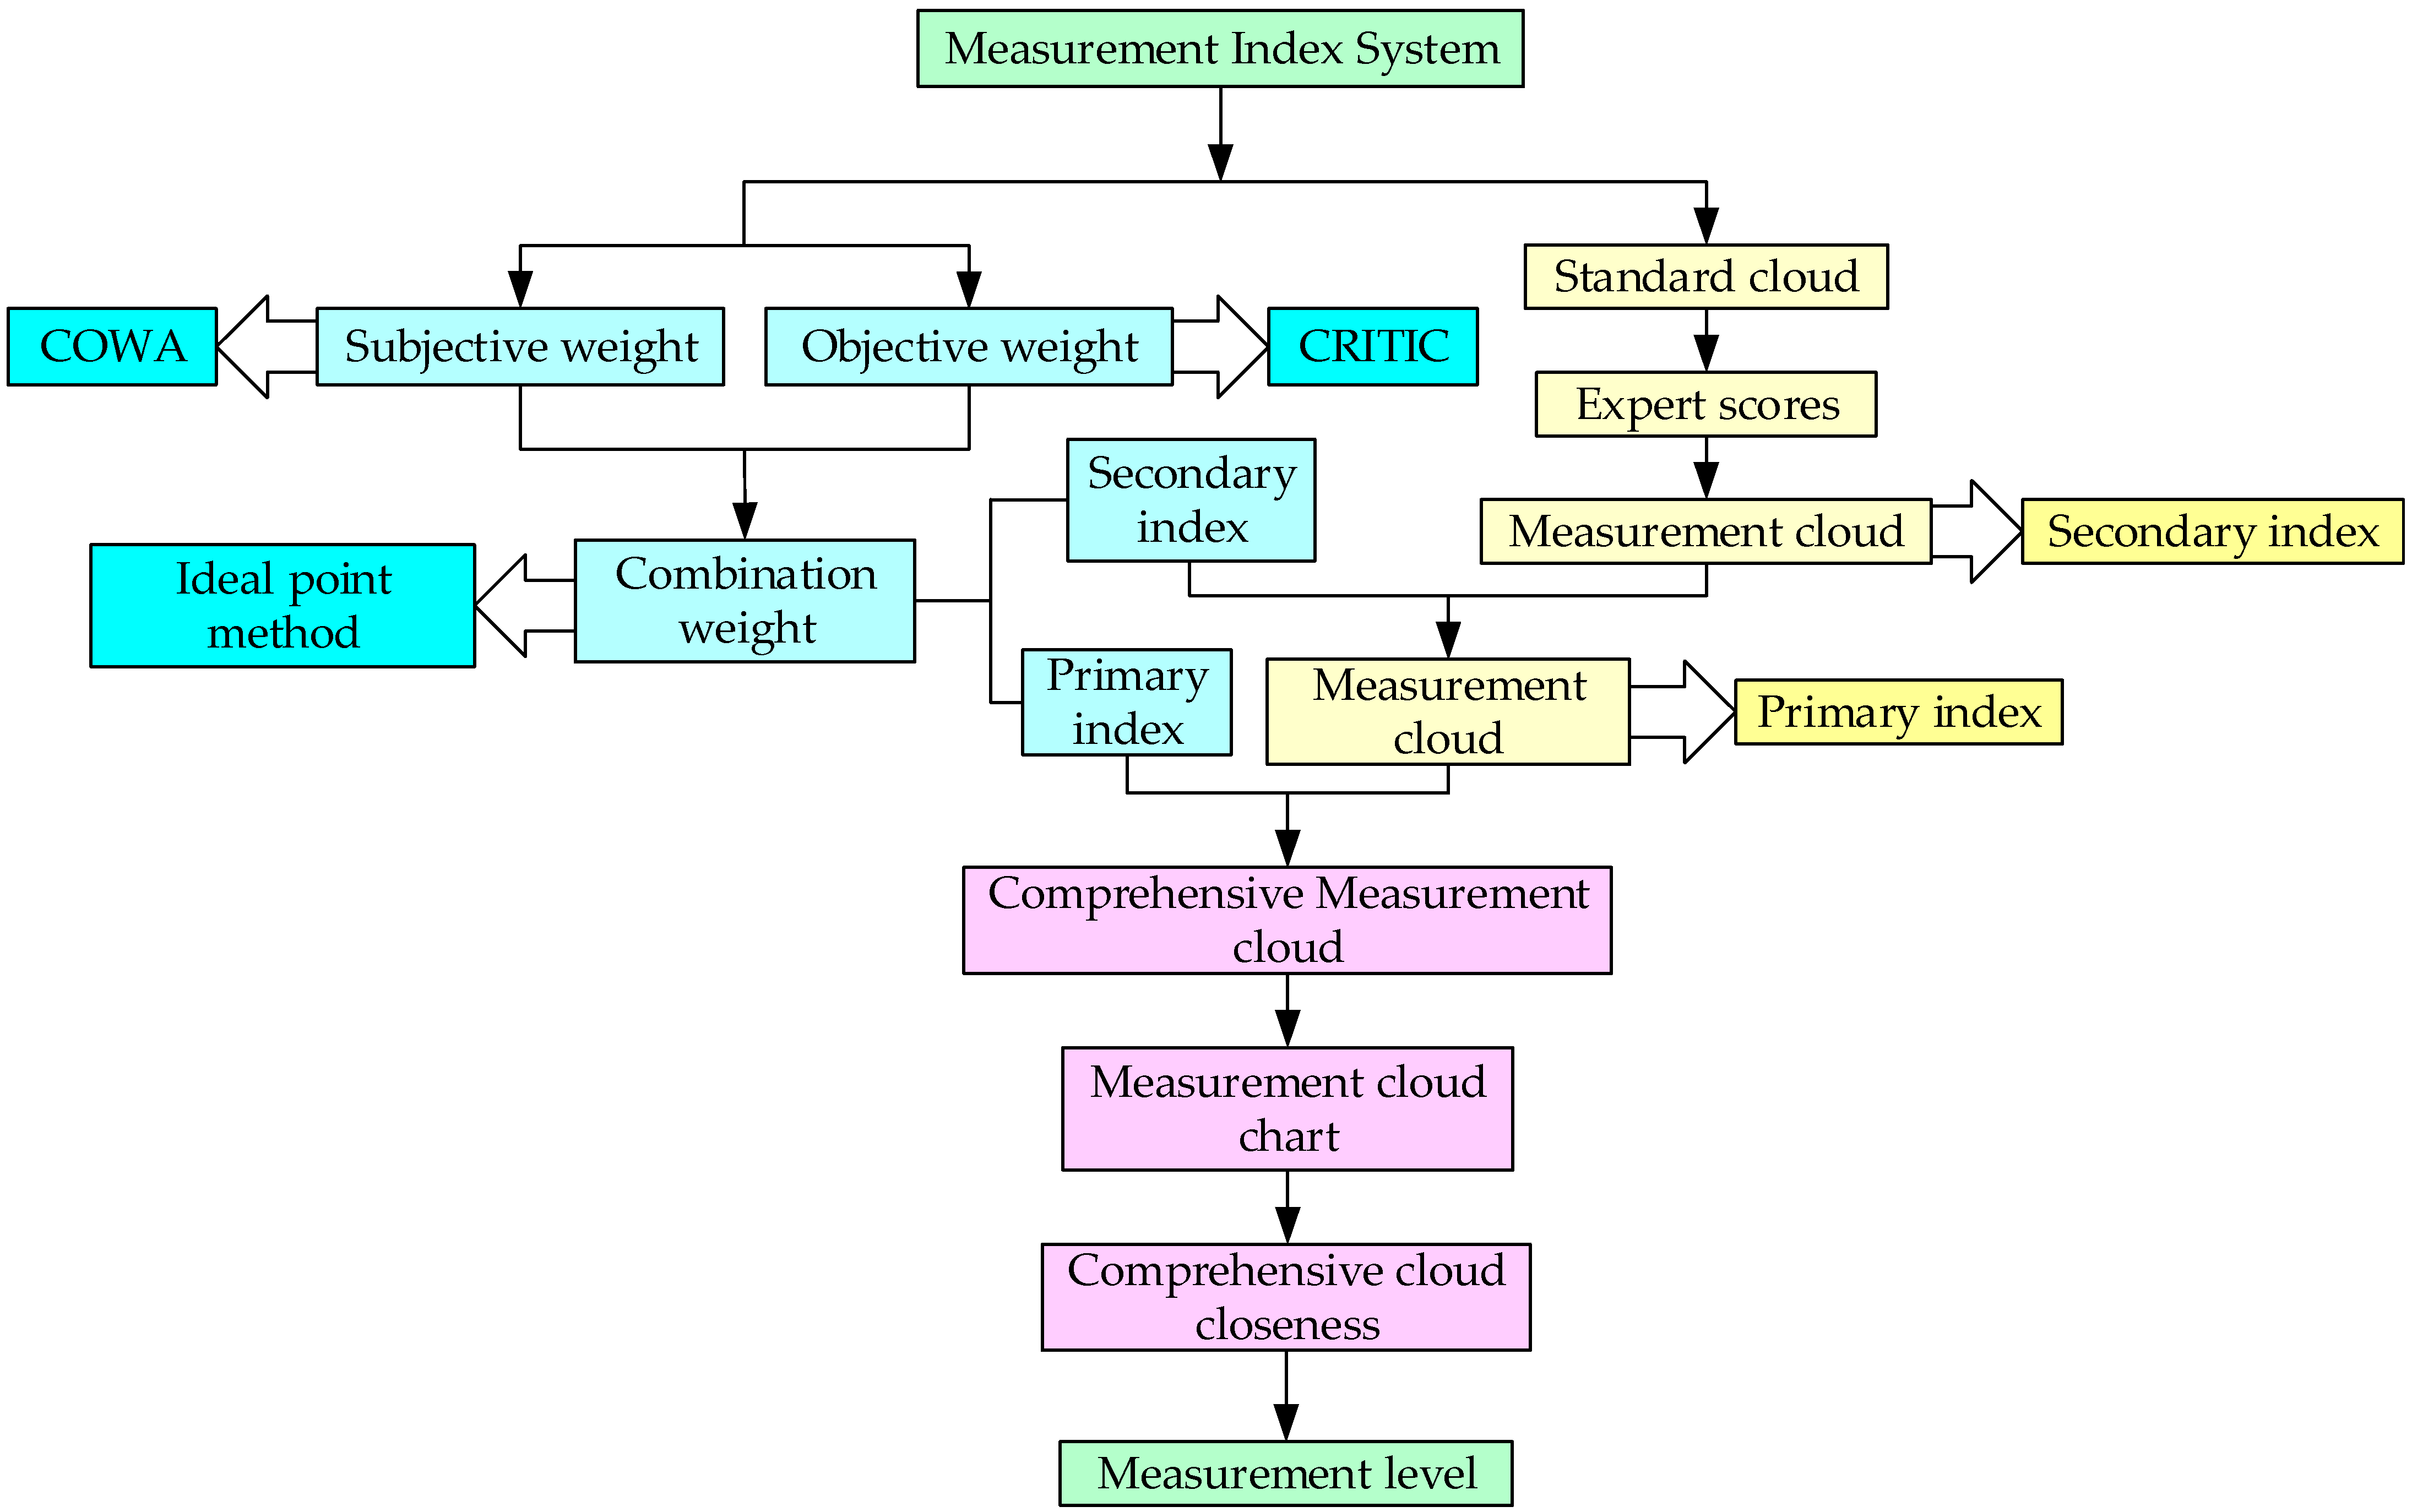
If the green management of PBPSCs is inefficient, it has an impact on the sustainable development of SCs; however, factors in the construction process can affect the ecological environment. In PB, if resources are consumed too much or managed poorly, it will lead to problems such as production delays and inventory backlogs, which in turn will affect the smooth operation of SCs. In PBPSCs, if there is excessive waste emission, it means that raw materials are not fully utilized, which will lead to the waste of resources and an increase in cost. An increase in waste emissions can affect the sustainability of SCs, and it may also lead to the need for some parts of SCs to invest more resources in waste treatment and recycling. The industrialization of construction is still at an early stage of development, and PBs still carry some of the crude characteristics of the traditional construction mode. The control of dust and noise not only has an impact on the environmental compliance of SCs but also affects the competitiveness and sustainability of SCs. Improper control of dust and noise in a certain link may lead to the whole SC facing environmental penalties, which in turn affects the reputation. In comparison with the existing literature, this part of the index focuses more on the actual environmental management level while taking into account the environmental impact of the construction process, which can more accurately reflect the performance of SCs in terms of environmental protection.
On the basis of the above analysis and combining the opinions of experts, the background information is shown in Table 2, and the establishment of the measurement index system is shown in Figure 1.

4. Methodology

4.1. Index Weights

4.1.1. Subjective Weights

Ronald R. Yager, a professor at American University, proposed Ordered Weighted Averaging (OWA) in 1988 [69]. OWA can help managers in PBPSCs to consider multiple decision criteria comprehensively and make optimized decisions based on the weights of each factor. Subsequently, numerous scholars have improved it by studying Continuous Ordered Weighted Averaging (COWA) based on the number of combinations [70]. COWA, formerly known as Combined Counted Ordered Weighted Arithmetic, reduces some unreasonable data by rearranging and integrating the original data in order from largest to smallest and weighting the related data from different positions [2,71]. This method has high requirements for data quality, complex calculation processes, subjective influence, and insufficient interpretability. The COWA operator can consider various factors that affect the coordination performance of PBPSCs comprehensively, and quantitatively evaluate and rank them, thereby helping decision makers to identify key factors and enable SCs to better play their coordinating role. The steps for determining the subjective weights of the indexes using the COWA method are as follows:
The first step is to invite n experts engaged in the industry of PB to score the indexes at the same level, which constitutes the original dataset A = {a1, a2, …, an}, according to their degree of importance to represent the original dataset, and the original dataset is sorted in a descending order to obtain a new dataset B = {b1, b2, …, bn}.
The second step is to compute the weighting vector of the scored data using the number of combinations, i.e., the number of combinations determines the weights of the new dataset B to obtain the weighting vector βj+1.
β j + 1 = C n 1 j k = 0 n 1 C n 1 j = C n 1 j 2 n 1 ( j = 0 , 1 , , n 1 )
where C n 1 j indicates the number of combinations of j data removed from n − 1 data.
The third step is to weight the decision data and calculate the absolute weight w j ¯ of each index.
w j ¯ = j = 0 n 1 β j + 1 b j
where βj ∊ [0, 1], j ∊ [1, n].
The fourth step is to calculate the relative weights of the indexes w1.
w 1 = w j ¯ j = 1 n w j ¯

4.1.2. Objective Weights

Danae DIAKOULAKI proposed the CRITIC method in 1995, which is an objective weighting method that calculates weights based on the importance criterion of the correlation between index levels [72]. In general, the smaller the correlation coefficient, the weaker the correlation between the indexes, the lower the repeatability of the information, and the higher the weight of the indexes; the higher the coefficient of variation, the higher the variation within the indexes, and the higher the weight of the indexes. This method makes up for the shortcomings of the entropy weight method which does not take into account the correlation between indexes. In practical applications, there are often problems such as missing data and outliers, which increase the difficulty and complexity of data preprocessing. However, this method has the advantages of objectivity, comprehensiveness, wide applicability, and strong explainability of results, and it provides the scientific basis for optimizing the coordination of SCs. The steps for determining indexes for calculating objective weights using the CRITIC method are as follows:
The first step is to invite m experts engaged in the industry of PB to score each index, which is organized to form the original data matrix X = (xij)m×n.
X = x 11 x 1 n x m 1 x m n ( i = 1 , 2 , ...... , m   j = 1 , 2 , ...... , n )
xmn indicates that the mth expert rated the nth index.
The second step is to normalize the raw data matrix X.
(1) Calculate the mean of x j ¯ the scores given by the m experts for each index.
x j ¯ = i = 1 m x i j m
(2) Calculate the sample standard deviation of the scores of m experts for each index σj.
σ j = x i j x j ¯ 2 m 1
(3) Calculate the normalization matrix X = x i j m × n .
x i j = x i j x j ¯ σ j
The third step is to calculate the coefficient of variation vj of the index.
v j = σ j x j ¯
The fourth step is to calculate the correlation coefficient rij. The Pearson’s coefficient calculated in this study using SPSS26.0 software is then the correlation coefficient rij.
The fifth step is to calculate the conflicting values of the indexes Fj.
F j = j = 1 n 1 r i j
The sixth step is to calculate the comprehensive coefficient Cj.
C j = σ j × F j = σ j j = 1 n 1 r i j
The seventh step is to calculate the weights w2 of the indexes.
w 2 = C j j = 1 n C j

4.1.3. Combination Weights

In this study, the ideal point method is used for the combined assignment of COWA subjective weights and CRITIC objective weights. The ideal point method assists decision makers in selecting the optimal solution by defining the objective function, solving for ideal and anti-ideal points, evaluating the quality of the solution based on its distance from the ideal point, and considering the situation of unreachable ideal points [73]. The basic idea of combining weighting with the ideal point method is to minimize the deviation between the vector objective function and the ideal point of the considered problem, and to then automatically solve the weights of each indicator by establishing a mathematical programming model [74]. Let the subjective weight vector obtained by the operator COWA method be w1 = (w11, w12, w13, , w1n)T, the weight vector obtained by the CRITIC method be w2 = (w21, w22, w23, , w2n)T, and the combination weight be w3 = (w31, w32, w33, , w3n)T.
The weights of the indexes are unitized according to Equation (12).
w 1 = w 1 w 11 2   +   w 12 2   +     +   w 1 n 2 w 2 = w 2 w 21 2   +   w 22 2   +     +   w 2 n 2 w 3 = w 3 w 31 2   +   w 32 2   +     +   w 3 n 2
The final combination weights are derived from Equations (13) and (14).
w 3 j = w 1 j 2 + w 2 j 2 2
w 3 = w 3 j j = 1 n w 3 j

4.2. Cloud Model

4.2.1. Definition

The cloud model is a model that realizes the mutual transformation of qualitative concepts and quantitative values, which can effectively overcome the ambiguity, randomness, and discretization existing in the evaluation system, and its three numerical features include the expected value Ex, entropy En, and hyper entropy He [2,75]. Expectation Ex is the point that best represents the categorization level of collaborative management performance for PBPSC. Entropy En reflects the degree of ambiguity of the boundaries of the collaborative management performance level in PBPSC. Hyperentropy He reflects the randomness of synergy management performance in PBPSC measures and demonstrates the degree of discrete cloud.

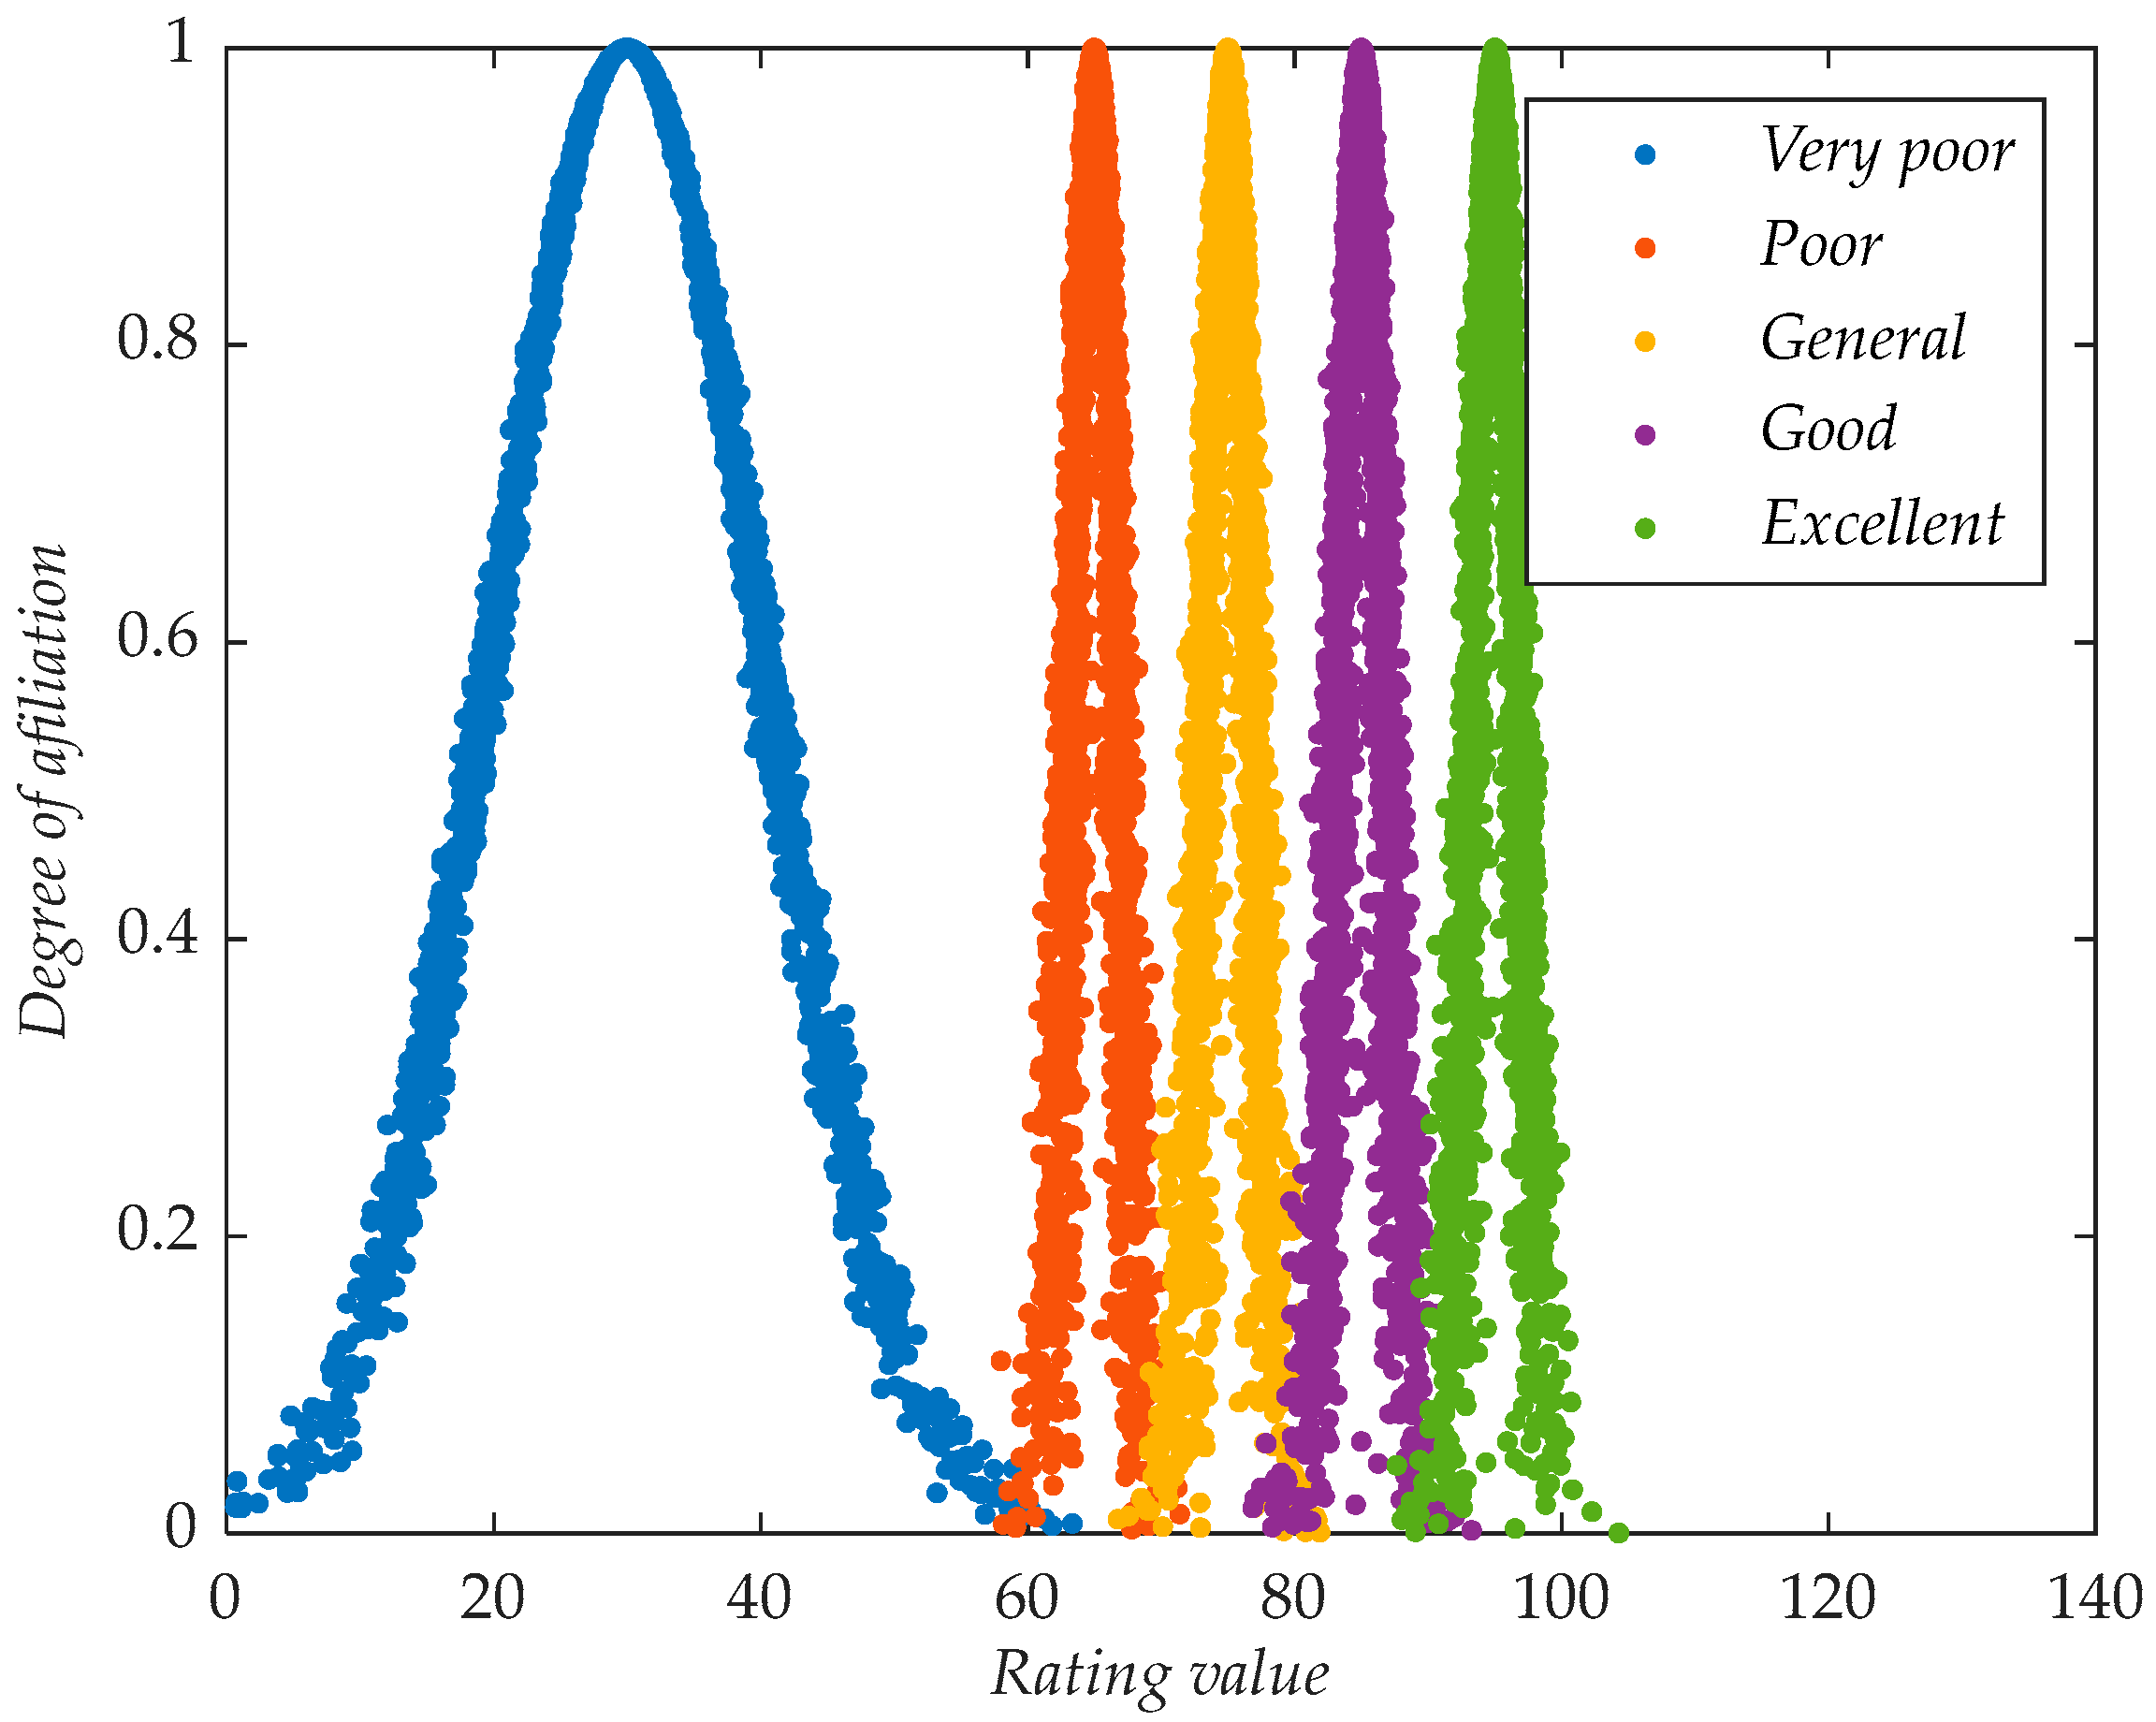
4.2.2. Standard Measurement Cloud

The performance level of collaborative management of PBPSCs is divided according to the actual situation. The standard cloud numerical characteristics of each performance interval [Zmin, Zmax] are derived according to the following equations.
E x 1 = Z m i n + Z m a x 2
E n 1 = Z m a x Z m i n 6
H e = k
where k is a constant.
Referring to the documents on green building and PB, this study measures the collaborative management performance of PBPSCs in terms of “very poor”, “poor”, “ general”, “good”, and “very good” [46,76]. The score interval is set to [0, 100] to avoid ambiguity and randomness in the measurement results. In particular, the initial interval [0, 60) is designed as a wide range, aiming to specify the basic pass line for collaborative management performance, and any item below this threshold is considered substandard. This helps to identify and focus on items with low management performance efficiently. The ranges are progressively narrowed in 10-point increments from 60 to the performance score increments. This strategy not only achieves finer differentiation within the high-performance interval but also matches the non-linear cognitive characteristics that people generally have when evaluating things. In addition, the interval division method not only promotes the convenience of statistical analysis and facilitates the capture of key change nodes in the data, but also fully considers the high dependence of the collaborative management of PBPSCs and can accurately map the influence of multiple complex factors at different performance levels, effectively avoiding the ambiguity and randomness of the evaluation results and ensuring the accuracy and scientificity of the measurements. Therefore, the intervals in this study were divided into [0, 60), [60, 70), [70, 80), [80, 90), and [90, 100], respectively. The standard cloud was calculated according to Equations (15)–(17) with k taking the value of 0.5, as is shown in Table 3. Each interval was taken 3000 times and the standard cloud was plotted by using MATLAB R2019b software, as shown in Figure 2.

4.2.3. Measurement Cloud of Indexes

By inviting experts to score each of the secondary indexes according to the specifics of a project, the scores of the experts are synthesized according to the following equation to form a measurement cloud for each secondary index.
E x 2 j = V ¯ = i = 1 m v j m
S 2 j 2 = i = 1 m v j E x 2 j 2 m 1
E n 2 j = π 2 i = 1 m v j E x 2 j m
H e 2 j = S 2 j 2 E n 2 j 2
The measurement cloud of the above secondary indexes is integrated to derive the measurement cloud of the primary indexes and the composite measurement cloud according to the following equation to generate the cloud diagram.
E x = j = 1 n w 3 E x 2 j
E n = j = 1 n w 3 E n 2 j 2
H e = j = 1 n w 3 H e 2 j
The performance of the collaborative management of PBPSCs is measured by calculating the comprehensive cloud closeness. Cloud closeness measures the degree of similarity between the measurement cloud and the standard cloud; the larger the cloud closeness, the more similar the measurement cloud and the standard cloud are [75]. The absolute value of the difference between the expectation of the metric cloud and the standard cloud, ΔEx, represents the relative cloud distance. The absolute value of the difference between the entropy of the metric cloud and the standard cloud, ΔEn, indicates the relative cloud distance for ambiguity. The absolute value of the difference between the hypertrophy of the metric cloud and the standard cloud, ΔHe, indicates the random relative cloud distance. The comprehensive cloud closeness S* is the combination of the individual cloud closeness values and is calculated as follows:
S * = φ 1 Δ E x + φ 2 Δ E n + φ 3 Δ H e
where φ1, φ2, and φ3 are the weights of the three cloud closeness values and satisfy φ1 + φ2 + φ3 = 1. The specific values of φ1, φ2, and φ3 are determined by experts according to the actual situation. The standard cloud level corresponding to the maximum value of the integrated cloud closeness is the performance level of the collaborative management of PBPSCs.
In summary, Figure 3 demonstrates the process of measuring the performance of synergy management in the PBPSC based on the cloud model of the COWA-CRITIC ideal point method.

5. Case Applications

In this study, a representative case of PB located in a new area of the city, 6# residential building of a neighborhood, was selected for in-depth analysis after consideration. This residential building has a total construction area of 26,119.77 m2, of which the above ground construction area is 24,531.52 m2 and the underground construction area is 1588.25 m2. The above ground is a residential area, and there is a storeroom under the ground, 30 floors above the ground and two floors under the ground, with a total height of 88.90 m. The prefabricated assembly rate of prefabricated walls, floor slabs, and staircases reached 60.8%, 62.5%, and 100%, and the single prefabricated assembly rate reached 45.03%. The foundation of the building adopts the technology of bored piles with a pile diameter of 800 mm, while cast-in-place concrete shear wall structure is used for floors 1–6 and the two underground floors, and an assembled concrete shear wall structure is used for floors 6 and above, which demonstrates the general characteristics of the current PB and their complexity.
The project covers multiple aspects such as design, construction, material supply, etc. The implementation process faces multiple challenges such as cost, information, and risk, and involves multiple participating companies, which highlights the importance of the collaborative management of the SC and can provide valuable experience and insights for similar projects.

5.1. Calculation of Measurement Index Weights

The importance of the indicator was scored by inviting the 9 experts in Table 2. The scoring interval was (0, 100). Subjective weights w1 were calculated according to Equations (1)–(3). Objective weights w2 were calculated according to Equations (4)–(9). Combination weights were calculated according to Equations (10)–(12), as shown in Table 4.

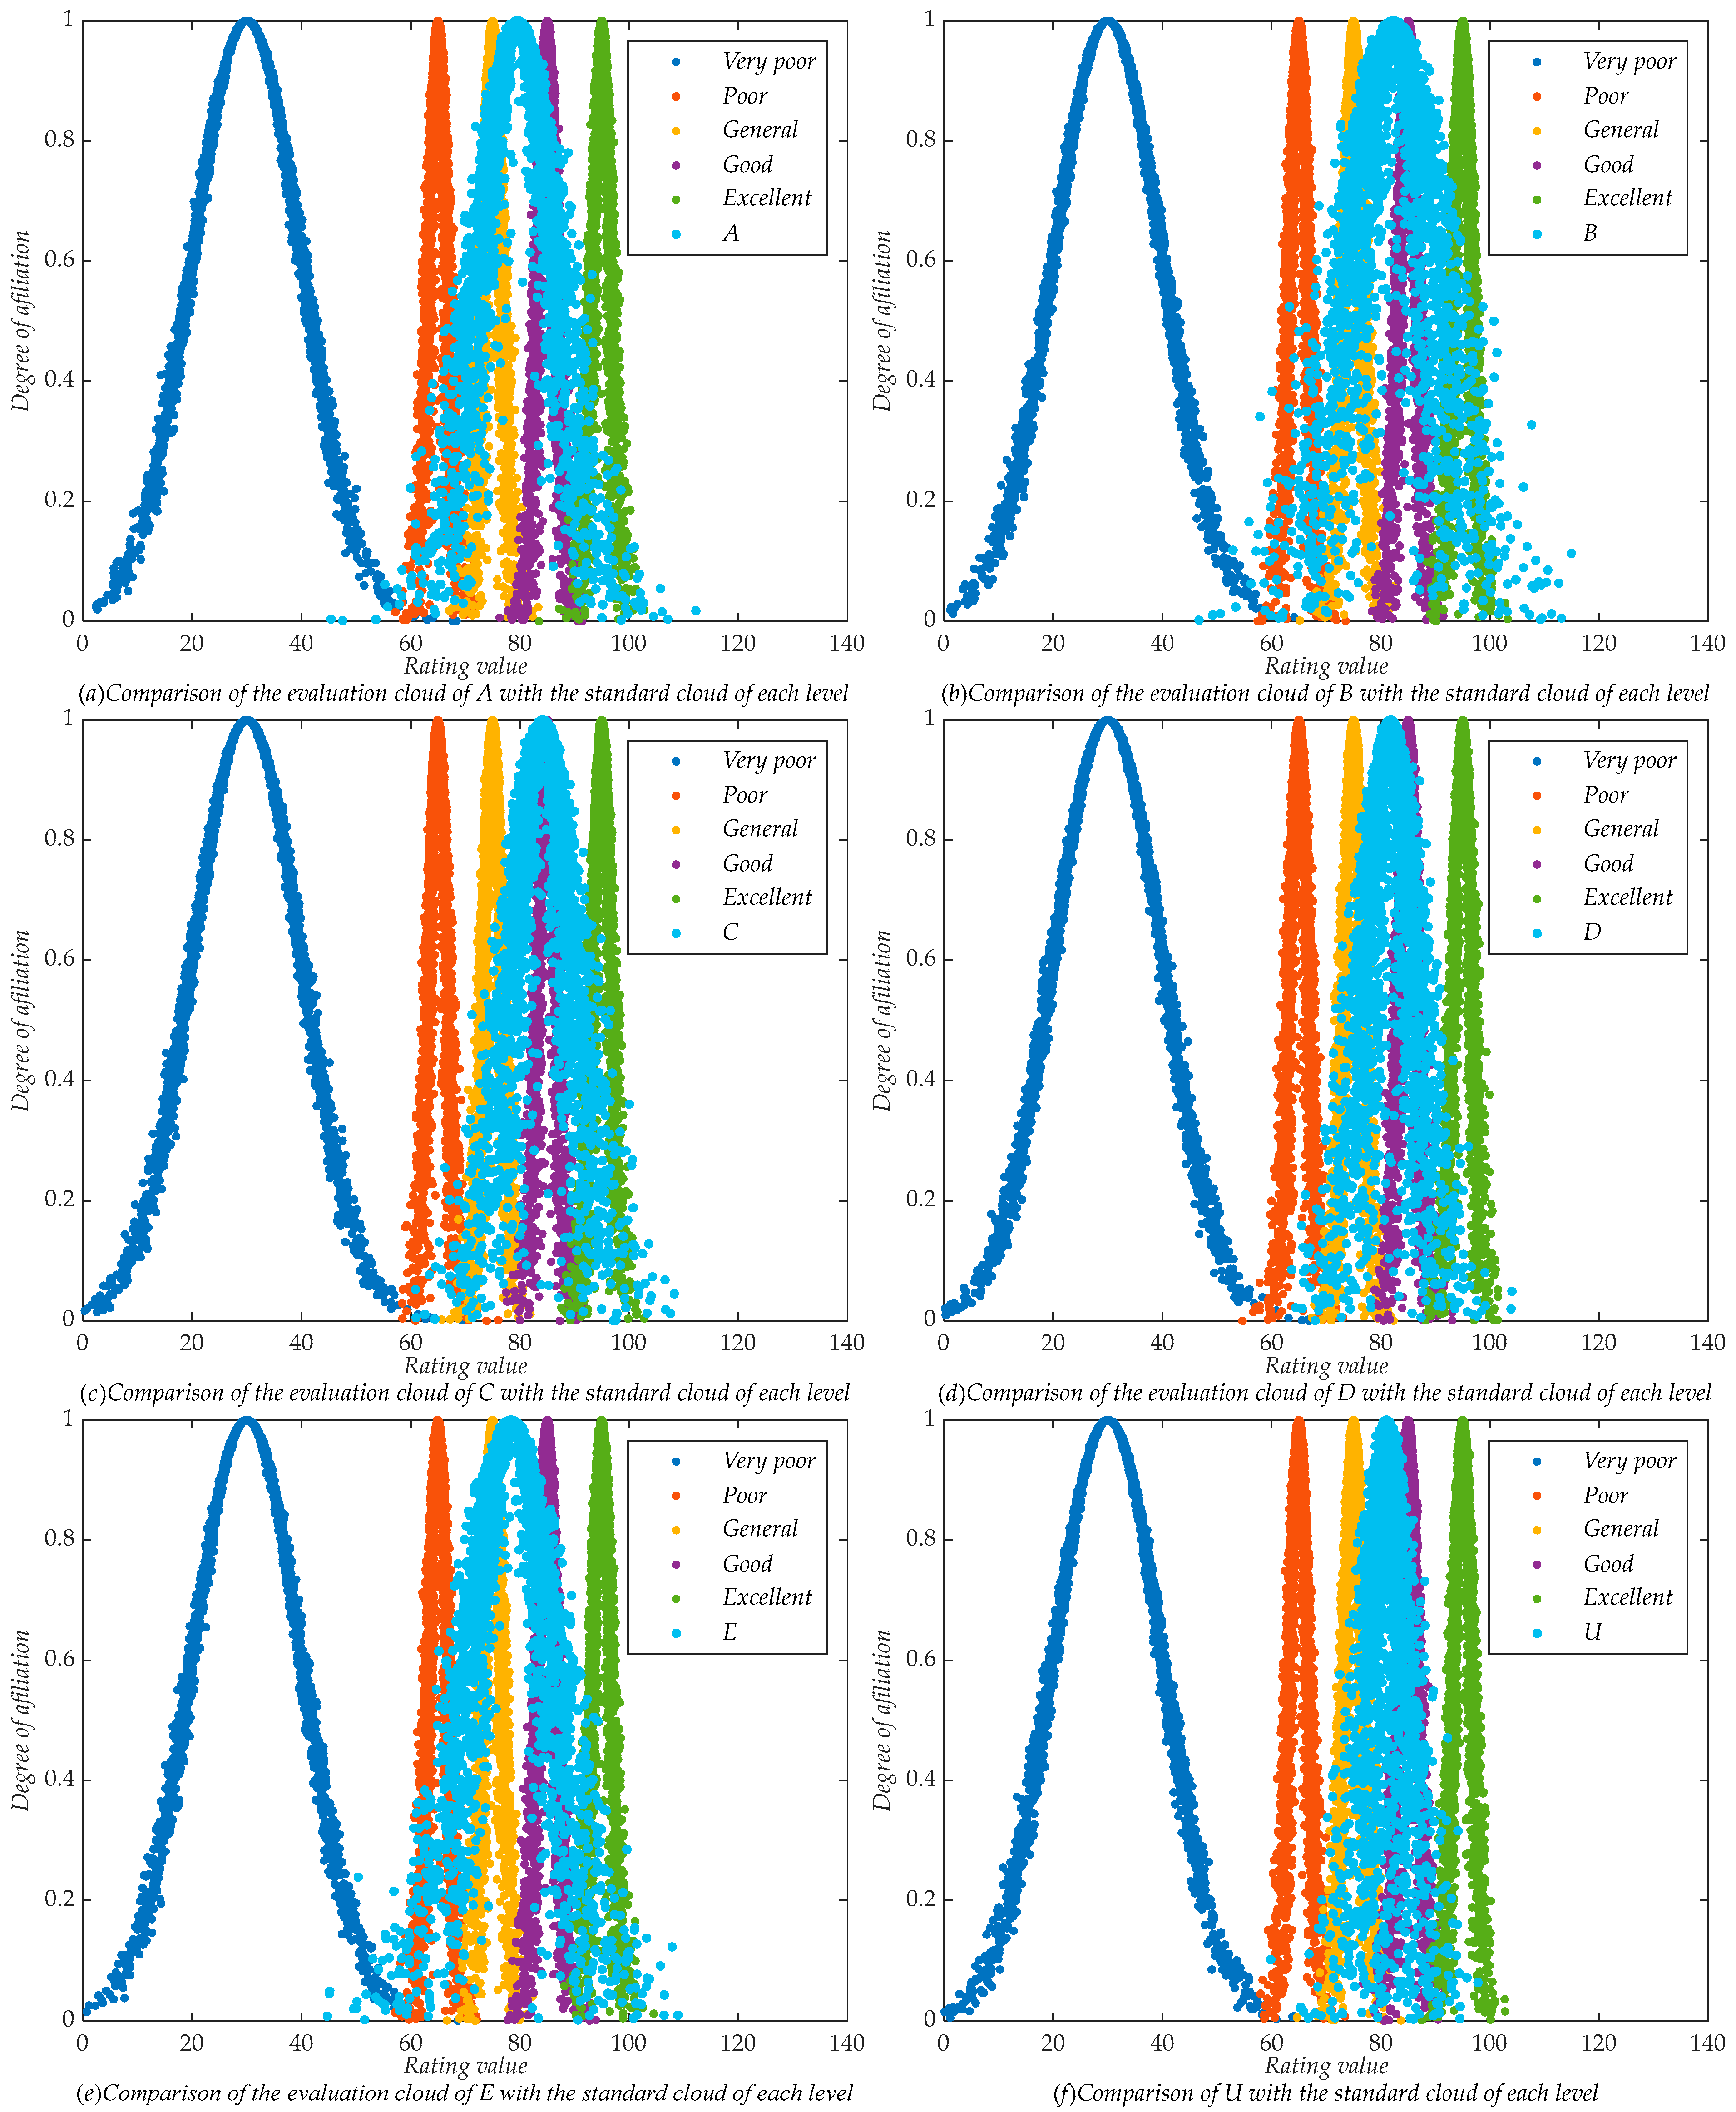
5.2. Calculation of Measurement Cloud

Based on the above questionnaire data, the measurement cloud of each secondary index was calculated according to Equations (18)–(21). The measurement cloud of each index was integrated according to Equations (22)–(24) to obtain the measurement cloud of each primary index. The comprehensive measurement cloud and the results are shown in Table 5 below.
We used the software of MATLAB R2019b to plot the comparison cloud diagram, as shown in Figure 4.

5.3. Determination of Performance Levels

By observing (a) and (e) in Figure 4, it is not easy to derive the rank by observing the cloud diagram, so it is derived by calculating the composite cloud closeness. The cloud closeness of expected value Ex has the largest weight because it best reflects the synergy management performance measurement level. According to the consensus of each expert, the weights of the three cloud closeness values are determined: φ1 = 0.6, φ2 = 0.2, and φ3 = 0.2. Due to the relatively large difference in the values of the individual cloud digital features, after normalizing the individual cloud closeness, the comprehensive cloud closeness is calculated according to Equation (25), and the results are shown in Table 6.

5.4. Results and Discussion

5.4.1. Analysis of Measurement Results

Since the weights of the three cloud closeness values come directly from the opinions of experts, the resulting measurements are subjective. To verify the reliability of this approach, the results of the elemental topology, attribute identification, and fuzzy comprehensive measurement models were selected for comparison, and these three models are described in the Supplementary Material [52,77,78]. All three methods yielded a performance measure rating of T4(good), which is consistent with the results derived from the measurement model of this study (see Table S1 in the Supplementary Material for details of the results). Therefore, the weights of the above three cloud closeness values are reasonable and suitable for measuring the performance of synergy management in PBPSC.
The results of the comprehensive cloud closeness values in Table 6 show that the comprehensive measurement cloud of the synergy management performance of SCs in the project has the largest comprehensive cloud closeness with the standard cloud of T4(good), but it also has a larger comprehensive cloud closeness progress with the standard cloud of T3(general). The following can be seen by analyzing the result of comprehensive cloud closeness in Table 6:
The measurement cloud for cost control A has the largest comprehensive cloud closeness with the standard cloud of T3(general). The SC of this project is generally performing with synergy management in terms of cost control [52]. Based on the comprehensive cloud closeness of the secondary indexes in Table 6, it can be seen that both the production cost A2 of components and the management cost A5 have the largest comprehensive cloud closeness with the standard cloud of T4(good). The material cost A3, transportation cost A4, and design cost of components A1 all have the largest comprehensive cloud closeness with the standard cloud of T3(general). The SC of this project will need to improve the control of these three costs. Although the management cost A5 has the largest comprehensive cloud closeness with the standard cloud of T4(good), it does not mean that the management cost does not need to be controlled more. This is because its comprehensive cloud closeness with the standard cloud of T3(general) is also larger.
The measured cloud for technology B has the largest comprehensive cloud closeness with the standard cloud of T4(good). The SC of this project shows good synergy management in terms of technology. According to the comprehensive cloud closeness of the secondary indexes in Table 6, it can be seen that the participation of technical cooperation B1, the rationality of the construction program B3, and the professional technicians B4 have the largest comprehensive cloud closeness with the standard cloud of T4(good). The project has a good and harmonious cooperative relationship among enterprises of SCs with strong expertise, and a reasonable construction program is developed through effective technical cooperation. The construction of the technology sharing platform B2 has the largest comprehensive cloud closeness with the standard cloud of T3(general). The technology-sharing platform needs to be continuously improved to enhance the synergy of SCs and enable PB to progress in technology [43].
The measured cloud of information C has the greatest progress of comprehensive cloud closeness with the standard cloud of T4(good). The SC of this project is better performing in synergy management in terms of information. Based on the comprehensive cloud closeness values of the secondary indexes in Table 6, it can be seen that all of them have the largest comprehensive cloud closeness with the standard cloud of T4(good). The SC in this project has a perfect information collaboration management system, which ensures the effectiveness of information sharing, the timeliness of information exchange, and the accuracy of information transmission, and reduces the emergence of the problem of information silos [43,54].
The measured cloud with the reliability of SC D has the largest comprehensive cloud closeness with the standard cloud of T4(good). The SC of this project has a certain degree of reliability and efficiently utilizes the synergy of the SC. Based on the comprehensive cloud closeness of the secondary indexes in Table 6, it can be seen that all of them have the greatest comprehensive cloud closeness with the standard cloud of T4(good). Although the measured clouds of risk control capability D3 and schedule control capability D4 have the greatest comprehensive cloud closeness with the standard cloud of T4(good), they also have greater comprehensive cloud closeness with the standard cloud of T3(general). Therefore, the SC of this project needs to be improved in terms of risk management and schedule control [53,54].
The measured cloud of environmental protection E has the largest comprehensive cloud closeness with the standard cloud of T3(general). The SC of this project shows a general performance of synergy management in terms of environmental protection. On the basis of the comprehensive cloud closeness of the secondary indexes in Table 6, it can be seen that the consumption of resources E1 has the largest comprehensive cloud closeness with the standard cloud of T4(good), but the comprehensive cloud closeness is also larger with the standard cloud of T3(general), with a tendency to favor the grade of “general”. Waste discharges E2, control of dust, and noise E3 have the largest comprehensive cloud closeness with the standard cloud of T3(general). As far as the assembly rate of this project is concerned, the SC of this project is further enhanced in terms of resource consumption, waste, dust, and noise. Improvement of benefit cannot be achieved at the expense of the environment; to foster the long-term development of the enterprise while realizing an improvement in benefit, pay attention to environmental protection issues [28].

5.4.2. Sensitivity Analysis

In this study, the sensitivity analysis on the results of the performance measurement for the synergy management of SC in projects was conducted by using the one-factor rotation OAT method [79]. The range and increment of the index values are respectively ±30% and ±3%. The absolute mean change rate (MACR) is shown in Figure 5. The specific values are detailed in Tables S2–S7 of the Supplementary Materials.
As can be seen from Figure 5, the MACR of each subsystem shows a linear trend. The larger the slope, the greater the sensitivity of the corresponding index to the subsystem collaborative management performance measurement. When the absolute value of the change rate of the same index measurement is the same, its sensitivity to the measurement results is the same, i.e., the change rate values are positive and negative but have similar sensitivity.
Through (a)–(e) in Figure 5, the following can be known:
The sensitivity index of the cost control system of SC in this project is the production cost of components.
The sensitivity index of the technical system of SC in this project is the specialized technical staff.
The sensitivity index of the information system of SC in this project is the timeliness of information exchange.
The system for the reliability of SC in this project has a sensitivity index of on-time delivery rate.
The sensitivity index of the environmental protection system of SC in this project is the control of dust and noise.
By comparing the sensitivity indicators of each sub-system, it can be seen that the specialized technicians have the strongest sensitivity to the change in weights. The sensitivity of the remaining indicators to changes in weights also basically corresponds to the size of their own weights. As can be seen through (f) in Figure 5, cost control has the strongest sensitivity to changes in weights. For example, when the weight change rate is 30%, the MACR value of professional technicians is 1.361%, and the MACR value of cost control is 6.161%, which is much lower than the size of its weight change rate, indicating that the results of the comprehensive measure of the collaborative management performance of SC are stable. In summary, the initial weights determined in this study are reasonable and effective and able to objectively reflect the synergy management performance of the PBPSC. The sensitivity analysis of the initial weights can verify the stability of the weights derived from the COWA-CRITIC ideal point method when performing the measurement.

5.4.3. Suggestion

Although the cases that are selected for this study are specific projects, the findings are generally applicable to other PB projects and even the collaborative management of SCs in other fields. The constructed measurement index system comprehensively covers core common factors such as cost control, technology, information, reliability of SC, and environmental protection, and is not limited to a single project. The following improvement suggestions are put forward in combination with the actual operation of PBPSCs:
Controlling the prefabrication and assembly rates of components is crucial for reducing their design costs. To this end, components must be more heavily standardized upfront. With regard to the production costs of the components, the manufacturer can make full use of technology and experience to continuously optimize the production process of the components and to increase the turnover rate of the components. When purchasing materials, the cost-effectiveness of materials should be emphasized. When choosing suppliers, consider their performance ability, qualification, and reputation. According to the actual situation of construction, the accurate calculation of the amount of materials is needed to avoid the waste of materials is critical to ensure that balance of materials and to prepare for emergencies.
It realizes the unified procurement and management of components and materials by establishing an information base for components and materials. The provision of standardized design drawings, the introduction of advanced encryption technology, and regular data security checks to identify and repair any loopholes can be employed to build a systematic, comprehensive, and scientific technology-sharing platform [43].
The management of PBPSC has high requirements for information flow, and poor timeliness will lead to untimely information transfer, so constant optimizing of the information synergy management platform is recommended [43]. The warehousing of materials, the design and production of components, and the assembly process can be connected to the Internet through information-sensing devices to realize the intelligence of management in PBPSCs. The application of 5G technology and cloud computing to the information synergy management in PBPSC can be used to establish a digital platform integrating design, production, logistics, and construction. BIM technology can be integrated into the information synergy platform of SCs, realizing the seamless connection of information in the stages of design, production, and construction, and improving the effect of information sharing among the participating enterprises [42,43,80].
The signing of long-term cooperation agreements by each member of an SC and the clarification of the rights and obligations of each participating enterprise will contribute to the enhancement of mutual trust and the reduction in the impact of short-term behaviors on the stability of SCs. Conducting comprehensive and precise planning at the early stage of construction is suggested. The establishment of a rapid response mechanism, in response to changes in the market and customer demand, allows for quick adjustment of the design program and construction plan. According to the scale of the project, the choice of vehicles should be reasonable. Integrating transportation routes and reducing distances between construction sites and warehouses can reduce the likelihood of delivery delays and ensure that components reach the construction sites on time [68]. Utilizing IoT technology to remotely monitor and manage the construction site can keep track of construction progress and quality to respond to emergencies in a better and more timely manner. The risks to which SC may be exposed should be regularly assessed and monitored, and measures should be put in place accordingly. A detailed response to possible disruption risk events of SC can be developed to minimize losses from the risk. A combination of proactive and reactive controls in project implementation can be employed to reduce risks and improve operational efficiency [15].
Since the assembly rate of most of the existing PB is below 60%, companies still need to strengthen their awareness of environmental protection. Strengthening cooperative relations with other enterprises in green technology can lead to conforming to the green sustainable development strategy and realizing the sustainable development of enterprises. The environmental protection supervision of production, transportation, and construction should be strengthened. Green, recyclable, sound-absorbing, and sound-insulating materials should be prioritized to reduce the impact of dust and noise on the ecological environment. All types of waste can be separated and managed to provide the possibility of renewable utilization of materials. Harmful waste should be disposed of on time. Using more low-carbon materials and making full use of renewable energy sources, as well as applying mechanized, green construction and assembly processes, can reduce resource consumption [2].
Given this, due to the one-time nature of these projects, the cooperative relationship between most of the participating enterprises ends after the project is completed, and this short-term cooperative relationship tends to make each participant focus on their interests, ignoring the benefits of long-term, stable, and trusting relationships [63]. In China, PB may face high costs. These regions should consider introducing low-cost technologies for PB and choosing locally appropriate models for the management of SCs. In regions with a low level of technology, consider simplifying technical solutions in the context of the project, adopting construction methods with lower infrastructure requirements, and gradually improving the level of technology. However, enterprises should emphasize the high-quality development at their own scale and strengthen the cooperative relationship with enterprises with trading links, so that the overall operation level of PBPSCs can be improved.

6. Conclusions

The concept of synergy management in PBPSCs should be optimized continuously; however, the most critical factors should be grasped in the process of management, and measures should be taken to cope with the weaker areas in the management process. Starting from the perspective of green sustainability, this study summarizes the relevant literature and establishes an index system by combining the opinions of industry experts, constructs a cloud model based on the COWA-CRITIC ideal point method for the study, and applies a case study of a residential building for validation. Single-factor rotation OAT method for sensitivity analysis of indexes is introduced. Combining the study results and the practical operation of SC, corresponding recommendations are put forward to promote the sustainable development of PB. The model applied in this research institute can provide a reference for the management of SCs in similar projects, further enhance the overall competitiveness of SCs, and promote industrial upgrading and sustainable development. However, it also prompts the government and relevant departments to pay more attention to the integrity of SCs when formulating policies, thereby promoting the improvement of relevant policies. The results of the study can help decision makers gain a comprehensive understanding of the management of SCs in PB, improve the efficiency of management, and make it a model project. The key findings of this study are as follows:
This study established a measurement index system consisting of 5 primary indexes and 20 secondary indexes in terms of cost control, technology, information, reliability of SC, and environmental protection.
In this study, the calculation of weights used the operator COWA method and CRITIC method to calculate the subjective weights and objective weights, respectively. The weights of the primary and secondary indicators were derived by calculating the combination assignment through the ideal point method, which made the weights more reasonable. As can be seen through the calculation of weights, cost control had the greatest impact on the synergy management performance of the PBPSC. To solve the problem of ambiguity and uncertainty of indicators, this study established a cloud model based on the COWA-CRITIC ideal point method to measure the collaborative management performance of SCs. The one-factor rotation OAT method was introduced into it for sensitivity analysis of the indexes to verify the stability of the measurement results.
Taking a residential building as an example, by calculating the comprehensive cloud closeness to determine the level of measurement, it can be seen that the total integrated measurement cloud had the largest integrated cloud closeness to the standard cloud of T4(good), but there was a tendency of bias towards the standard cloud of T3(general). Comparing the results with those obtained from the three measurement models of matter element extension, attribute identification, and fuzzy synthesis, it can be seen that they are consistent with the results obtained from the model of this study. The collaborative management performance of SCs in the project corresponds to T4(good), which is in line with the actual situation. The model used in this study is suitable for measuring the collaborative management performance of PBPSCs. When the weights were changed by 30%, the maximum MACR values in the primary and secondary indexes were 1.361% and 6.161%, respectively, which are much lower than the size of the rate of change in weights. This indicates that the measurement results are relatively stable in general. The weights initially determined in this paper were also reasonable. The model can objectively reflect the collaborative management performance of PBPSCs.
Since the measure in this study can be effectively applied to the field of performance measurement, future research can focus on using the method in other fields to improve its applicability. Although this study provides some insights into improving the synergy management performance of SCs, certain limitations of this study need to be considered for future research. The high cost of PB and the management complexity of SCs require the consideration of numerous influencing factors. Although the relevant literature has been referred to, it is still not considered comprehensively enough and indexes may be omitted. In the future, more consideration will be given to the potential impact of the index system to enhance its scientific, representative, and operational character. Although this study constructed a cloud model based on the COWA-CRITIC ideal point method, the scoring data were obtained using a questionnaire. It was inevitably subject to some degree of subjective influence. Therefore, there are certain specificities in data collection that need to be analyzed in light of the actual operation of SCs with the project. In the future, we will strengthen ties with experts who have experience in the management of SCs and the construction of PBs. Leveraging cloud computing and big data platforms can further optimize data collection to support performance prediction and optimization, improve information sharing and transparency, and drive sustainable development goals for PB.

Supplementary Materials

The following supporting information can be downloaded at https://www.mdpi.com/article/10.3390/su162411025/s1, Table S1: Comparison of Results; Table S2: The MACR of cost control; Table S3: The MACR of technology; Table S4: The MACR of information; Table S5: The MACR of reliability of SC; Table S6: The MACR of environmental protection; Table S7: The MACR of Primary index.

Author Contributions

Conceptualization, W.L. and Z.F.; investigation, Z.F. and X.L.; methodology, W.L. and Z.F.; resources, W.L.; supervision, W.L.; validation, Z.F.; writing—original draft, Z.F. and X.L.; writing—review and editing, Z.F. and X.L. All authors have read and agreed to the published version of the manuscript.

Funding

National Natural Science Foundation of China project (Project number: 72261012); Jiangxi Provincial Natural Science Foundation (Project number: 20242BAB204088); Jiangxi University Humanities and Social Sciences Research Program (Project number: GL23123).

Institutional Review Board Statement

Not applicable.

Informed Consent Statement

Not applicable.

Data Availability Statement

The data presented in this study are available on request from the corresponding author.

Conflicts of Interest

The authors declare no conflicts of interest.

References

  1. Li, D.; Huang, G.; Zhu, S.; Chen, L.; Wang, J. How to Peak Carbon Emissions of Provincial Construction Industry? Scenario Analysis of Jiangsu Province. Renew. Sustain. Energy Rev. 2021, 144, 110953. [Google Scholar] [CrossRef]
  2. Sun, S.; Chen, Y.; Wang, A.; Liu, X. An Evaluation Model of Carbon Emission Reduction Effect of Prefabricated Buildings Based on Cloud Model from the Perspective of Construction Supply Chain. Buildings 2022, 12, 1534. [Google Scholar] [CrossRef]
  3. Six Challenges in Achieving “Dual Carbon” in China. Available online: https://roll.sohu.com/a/616550542_260616 (accessed on 2 November 2024).
  4. Du, Q.; Yang, M.; Wang, Y.; Wang, X.; Dong, Y. Dynamic Simulation for Carbon Emission Reduction Effects of the Prefabricated Building Supply Chain under Environmental Policies. Sustain. Cities Soc. 2024, 100, 105027. [Google Scholar] [CrossRef]
  5. Jin, R.; Hong, J.; Zuo, J. Environmental Performance of Off-Site Constructed Facilities: A Critical Review. Energy Build. 2020, 207, 109567. [Google Scholar] [CrossRef]
  6. Li, X.; Xie, W.; Xu, L.; Li, L.; Jim, C.Y.; Wei, T. Holistic Life-Cycle Accounting of Carbon Emissions of Prefabricated Buildings Using LCA and BIM. Energy Build. 2022, 266, 112136. [Google Scholar] [CrossRef]
  7. Chang, Y.; Li, X.; Masanet, E.; Zhang, L.; Huang, Z.; Ries, R. Unlocking the Green Opportunity for Prefabricated Buildings and Construction in China. Resour. Conserv. Recycl. 2018, 139, 259–261. [Google Scholar] [CrossRef]
  8. Braglia, M.; Dallasega, P.; Marrazzini, L. Overall Construction Productivity: A New Lean Metric to Identify Construction Losses and Analyse Their Causes in Engineer-to-Order Construction Supply Chains. Prod. Plan. Control 2022, 33, 925–942. [Google Scholar] [CrossRef]
  9. Vrijhoef, R.; Koskela, L. The Four Roles of Supply Chain Management in Construction. Eur. J. Purch. Supply Manag. 2000, 6, 169–178. [Google Scholar] [CrossRef]
  10. Zhu, Y. Accelerate the Development of New Quality Productivity Solidly Promote High-Quality Development. Available online: https://www.gov.cn/yaowen/liebiao/202402/content_6929446.htm (accessed on 30 October 2024).
  11. Ye, H.; Su, Y. Research and Exploration on Promoting the Transformation and Development of the Construction Industry with New Quality Productivity. J. Eng. Manag. 2024, 38, 1–5. [Google Scholar] [CrossRef]
  12. An, K.; Wang, X.; Liao, X. Research on Transaction Cost of Prefabricated Buliding Supply Chain under EPC Mode. Constr. Econ. 2020, 41, 49–53. [Google Scholar] [CrossRef]
  13. Zhang, R.; Li, L. Research on Evolutionary Game and Simulation of Information Sharing in Prefabricated Building Supply Chain. Sustainability 2023, 15, 9885. [Google Scholar] [CrossRef]
  14. RezaHoseini, A.; Noori, S.; Ghannadpour, S.F. Integrated Scheduling of Suppliers and Multi-Project Activities for Green Construction Supply Chains under Uncertainty. Autom. Constr. 2021, 122, 103485. [Google Scholar] [CrossRef]
  15. Li, N.; Wang, H.; Mei, J. Risk Early Warning of Prefabricated Building Supply Chain Based on Cloud Matter Element Theory. J. Civ. Eng. Manag. 2020, 37, 123–129. [Google Scholar] [CrossRef]
  16. Goh, M.; Goh, Y.M. Lean Production Theory-Based Simulation of Modular Construction Processes. Autom. Constr. 2019, 101, 227–244. [Google Scholar] [CrossRef]
  17. Chen, Q.; Hall, D.M.; Adey, B.T.; Haas, C.T. Identifying Enablers for Coordination across Construction Supply Chain Processes: A Systematic Literature Review. Eng. Constr. Archit. Manag. 2021, 28, 1083–1113. [Google Scholar] [CrossRef]
  18. Du, J.; Wang, W.; Hu, M. SEM and Multi–Agent Simulation–Based Design Change Risk Management in Prefabricated Construction. J. Shanghai Univ. (Nat. Sci. Ed.) 2022, 28, 1038–1050. [Google Scholar] [CrossRef]
  19. Koskela, L. Application of the New Production Philosophy to Construction; Stanford University: Stanford, CA, USA, 1992; Volume 72. [Google Scholar]
  20. Yang, S.; Jiang, G. Risk Management of EPC Construction Supply Chain Based on Theory of Constraints and Set Pair Analysis. Technol. Econ. 2016, 35, 111–117. [Google Scholar] [CrossRef]
  21. Zhu, L.; Chen, J.; Yuan, J. Research on Critical Factors Influencing the Resilience of Prefabricated Building Supply Chain Based on ISM. J. Civ. Eng. Manag. 2020, 37, 108–114. [Google Scholar] [CrossRef]
  22. Ekanayake, E.M.A.C.; Shen, G.Q.P.; Kumaraswamy, M.M.; Owusu, E.K.; Saka, A.B. Modeling Supply Chain Resilience in Industrialized Construction: A Hong Kong Case. J. Constr. Eng. Manag. 2021, 147, 05021009. [Google Scholar] [CrossRef]
  23. Wang, Q.; Duan, H.; Shen, C.; Zhu, K. Study on the Influencing Factors of Prefabricated Building Resilient Supply Chain. Constr. Econ. 2021, 42, 79–82. [Google Scholar] [CrossRef]
  24. Liu, W.; Liu, Z. Simulation Analysis of Supply Chain Resilience of Prefabricated Building Projects Based on System Dynamics. Buildings 2023, 13, 2629. [Google Scholar] [CrossRef]
  25. Wang, Y.; Wang, T.; Cui, W.; Zhou, G.; Liu, H. Selecting Resilient Strategies for Cost Optimization in Prefabricated Building Supply Chains Based on the Non-Dominated Sorting Genetic Algorithm-II: Facing Diverse Disruption Scenarios. Sustainability 2024, 16, 6256. [Google Scholar] [CrossRef]
  26. Lin, M.; Ren, Y.; Feng, C.; Li, X. Analyzing Resilience Influencing Factors in the Prefabricated Building Supply Chain Based on SEM-SD Methodology. Sci. Rep. 2024, 14, 17393. [Google Scholar] [CrossRef] [PubMed]
  27. Liu, Z.; Zhang, Y.; Ouyang, H.; Song, L. Sustainability Evaluation of Prefabricated Building Supply Chain Based on Cloud Matter Element Theory. J. Civ. Eng. Manag. 2020, 37, 109–115+122. [Google Scholar] [CrossRef]
  28. Zhao, S.; Wang, J.; Ye, M.; Huang, Q.; Si, X. An Evaluation of Supply Chain Performance of China’s Prefabricated Building from the Perspective of Sustainability. Sustainability 2022, 14, 1299. [Google Scholar] [CrossRef]
  29. Izadikhah, M.; Saen, R.F. Assessing Sustainability of Supply Chains by Chance-Constrained Two-Stage DEA Model in the Presence of Undesirable Factors. Comput. Oper. Res. 2018, 100, 343–367. [Google Scholar] [CrossRef]
  30. Wang, L.; Cheng, Y.; Zhang, Y. Exploring the Risk Propagation Mechanisms of Supply Chain for Prefabricated Building Projects. J. Build. Eng. 2023, 74, 106771. [Google Scholar] [CrossRef]
  31. Wang, Y.; Sun, R.; Ren, L.; Geng, X.; Wang, X.; Lv, L. Risk Propagation Model and Simulation of an Assembled Building Supply Chain Network. Buildings 2023, 13, 981. [Google Scholar] [CrossRef]
  32. Wang, X.; Zhou, S.; Guo, Y.; Duan, Y. Study on Supply Chain Risk of Prefabricated Building Based on EFA and CFA. Math. Pract. Theory 2021, 51, 286–299. [Google Scholar]
  33. Wu, Q.; Tian, Y. Research on Risk Factors of Prefabricated Construction Supply Chain Based on AHP-DEMATEL-ISM Model. J. Eng. Manag. 2022, 36, 29–34. [Google Scholar] [CrossRef]
  34. Zhang, A.; Wang, G.; Ding, C.; Zhao, N.; Cui, B. Key Risk Factors of Prefabricated Building Supply Chain Based on Social Network Analysis. Sci. Technol. Eng. 2024, 24, 8372–8381. [Google Scholar] [CrossRef]
  35. Cai, Q.; Du, Y.; Wang, R. Analysis on Supply Chain Risk Factors of Prefabricated Buildings Using AHP-DEMATEL-ISM Model. Teh. Vjesn. 2023, 30, 1379–1386. [Google Scholar] [CrossRef]
  36. Zhu, T.; Liu, G. A Novel Hybrid Methodology to Study the Risk Management of Prefabricated Building Supply Chains: An Outlook for Sustainability. Sustainability 2022, 15, 361. [Google Scholar] [CrossRef]
  37. Guan, Y.; Wan, C.; Wang, W. Dual-Channel Supply Chain Coordination Considering Green and Service Inputs. Sustainability 2024, 16, 6492. [Google Scholar] [CrossRef]
  38. Rose-Anderssen, C.; Baldwin, J.; Ridgway, K. Communicative Interaction as an Instrument for Integration and Coordination in an Aerospace Supply Chain. J. Manag. Dev. 2010, 29, 193–209. [Google Scholar] [CrossRef]
  39. Akintoye, A.; McIntosh, G.; Fitzgerald, E. A Survey of Supply Chain Collaboration and Management in the UK Construction Industry. Eur. J. Purch. Supply Manag. 2000, 6, 159–168. [Google Scholar] [CrossRef]
  40. Toroghi Bidabadi, Z.; Hosseinalipour, M.; Hamidizadeh, M.R.; Mohebifar, A. Supply Chain Collaboration within the Iranian Construction Industry. Organ. Technol. Manag. Constr. Int. J. 2016, 8, 1437–1445. [Google Scholar] [CrossRef]
  41. Koolwijk, J.S.J.; Van Oel, C.J.; Wamelink, J.W.F.; Vrijhoef, R. Collaboration and Integration in Project-Based Supply Chains in the Construction Industry. J. Manag. Eng. 2018, 34, 04018001. [Google Scholar] [CrossRef]
  42. Shi, Q.; Wang, Q.; Guo, Z. Knowledge Sharing in the Construction Supply Chain: Collaborative Innovation Activities and BIM Application on Innovation Performance. Eng. Constr. Archit. Manag. 2022, 29, 3439–3459. [Google Scholar] [CrossRef]
  43. Liu, G.; Zhu, T. Influencing Factors of Collaborative Management of Prefabricated Building Supply Chain Based on the Perspective of General Contractor Research. J. Shenyang Jianzhu Univ. (Soc. Sci.) 2022, 24, 496–502. [Google Scholar] [CrossRef]
  44. Mei, T.; Qin, Y.; Li, P.; Deng, Y. Influence Mechanism of Construction Supply Chain Information Collaboration Based on Structural Equation Model. Sustainability 2023, 15, 2155. [Google Scholar] [CrossRef]
  45. Wang, H.; Liu, H. Research on Collaborative Pricing of Prefabricated Building Supply Chain: Based on BIM-RFID Information Sharing Platform. Constr. Econ. 2020, 41, 54–59. [Google Scholar] [CrossRef]
  46. Evaluation Standard for Assembled Buildings (GB/T51129-2017). Available online: https://www.mohurd.gov.cn/gongkai/zc/wjk/art/2018/art_17339_234899.html (accessed on 28 November 2024).
  47. Opinions of the General Office of the State Council on Promoting the Sustainable and Healthy Development of the Construction Industry(000014349/2017-00040). Available online: https://www.gov.cn/zhengce/zhengceku/2017-02/24/content_5170625.htm (accessed on 28 November 2024).
  48. Zhang, F.; Xie, J. Risk Assessment of Assembly Construction Supply Chain Based on Cloud Model. Intell. Build. Smart City 2020, 48, 123–124. [Google Scholar] [CrossRef]
  49. Zhu, X.; Zhao, Z.; Yang, Y. Research on the Impact Path of the Resilience of Prefabricated Building Supply Chain on Construction Cost. Constr. Econ. 2024, 45, 55–64. [Google Scholar] [CrossRef]
  50. Liu, L.; Ren, X.; Dai, X. Research on Cooperative Subject Selection of Prefabricated Building Supply Chain for Dynamic Alliance. Constr. Econ. 2021, 42, 61–66. [Google Scholar] [CrossRef]
  51. Miao, Z.; Zhang, L. Research on the Influencing Factors of Supply Chain Risk Management of Assembly Building Based on SEM. Proj. Manag. Technol. 2023, 21, 95–98. [Google Scholar]
  52. Qu, F.; Yan, W.; Chen, C. Research on Construction of Coordination Performance Evaluation Index System of Prefabricated Construction Supply Chain. Constr. Econ. 2019, 40, 97–102. [Google Scholar] [CrossRef]
  53. Dan, W.; Jingyi, L.; Yongkun, W. Multifactor Uncertainty Analysis of Prefabricated Building Supply Chain: Qualitative Comparative Analysis. Eng. Constr. Archit. Manag. 2024, 31, 1994–2010. [Google Scholar] [CrossRef]
  54. Zhang, L.; Dong, Y. On the Operation Efficiency Evaluation of the Assembled Building Supply Chain. J. Hefei Univ. 2023, 40, 71–76+113. [Google Scholar] [CrossRef]
  55. Li, Q.; Chen, W. Safety evaluation of prefabricated building construction based on entropy correction BWM. J. Saf. Environ. 2023, 23, 2580–2588. [Google Scholar] [CrossRef]
  56. He, Z.; Tian, Y. Safety Risk Factors of Prefabricated Building Construction from the Perspective of Participating Units. Sci. Technol. Eng. 2023, 23, 321–326. [Google Scholar] [CrossRef]
  57. Tian, X.; Hu, Q.; He, Z. Safety Risk Assessment of Hoisting Construction of Prefabricated Buildings Based on Improved Combined Weighting-dynamic Fuzzy Theory. J. Civ. Eng. Manag. 2021, 38, 187–193. [Google Scholar] [CrossRef]
  58. Zhou, Y.; Wang, R.; She, J. Safety performance evaluation of prefabricated building construction from perspective of three-dimensional space. J. Saf. Sci. Technol. 2022, 18, 210–217. [Google Scholar]
  59. Gao, J.; Zhao, W.-H.; Liu, W.-H. Evaluation of Influencing Factors on the Supply Chain of Prefabricated Buildings under Engineering Procurement Construction Model: A Case Study in China. Buildings 2024, 14, 1680. [Google Scholar] [CrossRef]
  60. Chen, J.; Xu, H.; Wu, M. Research on Collaborative Efficiency Evaluation of Prefabricated Building Supply Chain from Stakeholder Perspective. Constr. Technol. 2024, 16, 6–9. [Google Scholar] [CrossRef]
  61. Zhang, Y.; Qu, F.; Chen, C. Research on Performance Evaluation of Prefabricated Building Supply Chain Based on PCSCOR-FANP. Constr. Econ. 2021, 42, 172–176. [Google Scholar] [CrossRef]
  62. Li, C.Z.; Hong, J.; Xue, F.; Shen, G.Q.; Xu, X.; Mok, M.K. Schedule Risks in Prefabrication Housing Production in Hong Kong: A Social Network Analysis. J. Clean. Prod. 2016, 134, 482–494. [Google Scholar] [CrossRef]
  63. Zhang, M.; Liu, Y.; Ji, B. Influencing Factors of Resilience of PBSC Based on Empirical Analysis. Buildings 2021, 11, 467. [Google Scholar] [CrossRef]
  64. Wuni, I.Y.; Shen, G.Q. Critical Success Factors for Modular Integrated Construction Projects: A Review. Build. Res. Inf. 2020, 48, 763–784. [Google Scholar] [CrossRef]
  65. Hull, B. The Role of Elasticity in Supply Chain Performance. Int. J. Prod. Econ. 2005, 98, 301–314. [Google Scholar] [CrossRef]
  66. Deng, Q.; Huang, X.; Zou, J.; He, Y. Screening of Sustainable Supply Chain Performance Evaluation Indicators Based on the Ill-Conditioned Index Cycle Method. PLoS ONE 2024, 19, e0293038. [Google Scholar] [CrossRef] [PubMed]
  67. Guo, R.; Wu, Z. Social Sustainable Supply Chain Performance Assessment Using Hybrid Fuzzy-AHP–DEMATEL–VIKOR: A Case Study in Manufacturing Enterprises. Env. Dev Sustain 2023, 25, 12273–12301. [Google Scholar] [CrossRef] [PubMed]
  68. Hsu, P.-Y.; Aurisicchio, M.; Angeloudis, P. Risk-Averse Supply Chain for Modular Construction Projects. Autom. Constr. 2019, 106, 102898. [Google Scholar] [CrossRef]
  69. Yager, R.R. Families of OWA Operators. Fuzzy Sets Syst. 1993, 59, 125–148. [Google Scholar] [CrossRef]
  70. Xu, Z. Dependent OWA Operators. In Modeling Decisions for Artificial Intelligence; Torra, V., Narukawa, Y., Valls, A., Domingo-Ferrer, J., Eds.; Lecture Notes in Computer Science; Springer: Berlin/Heidelberg, Germany, 2006; Volume 3885, pp. 172–178. ISBN 978-3-540-32780-6. [Google Scholar]
  71. Duan, S.; Li, X.; Jiang, X.; Huang, X.; Yang, Y.; Du, H.; Xiao, W. Extension Cloud Model and Grey Clustering Evaluation of Enterprise Safety Management System: Based on COWA-CRITIC Combination Weighting. Sustainability 2023, 15, 15734. [Google Scholar] [CrossRef]
  72. Diakoulaki, D.; Mavrotas, G.; Papayannakis, L. Determining Objective Weights in Multiple Criteria Problems: The Critic Method. Comput. Oper. Res. 1995, 22, 763–770. [Google Scholar] [CrossRef]
  73. Liu, Q.; Liang, Y.; Liu, C.; Xue, J.; Zhang, H.; Tu, R.; Zou, X.; Liang, Y. Developing an Integrated and Collaborated Evaluation Index System for Crude Oil Supply Chains: A Case Study from China. Chem. Eng. Res. Des. 2024, 211, 405–420. [Google Scholar] [CrossRef]
  74. Xue, L.; Liu, B.; Zheng, Z.; Li, C.; Zhang, S.; Zhu, L.; Su, C.; Xu, C. Evaluation of Sustainable Capacity of Coal Resources Based on Extension Cloud Theory and Ideal Point Method. J. Nat. Resour. 2018, 33, 1657–1665. [Google Scholar] [CrossRef]
  75. Xun, Z.; Zhang, L.; Zhao, Z.; Xu, Y. Cost Risk Evaluation of Prefabricated Buildings Based on Combined Weighted Cloud Model. J. Civ. Eng. Manag. 2020, 37, 8–13. [Google Scholar] [CrossRef]
  76. Green Building Evaluation Standard (GB/T50378-2019). Available online: https://www.mohurd.gov.cn/gongkai/zc/wjk/art/2024/art_17339_779172.html (accessed on 3 December 2024).
  77. Luo, Z.; Guo, J.; Han, J.; Wang, Y. Research on the Construction Safety Risk Assessment of Prefabricated Subway Stations in China. Eng. Constr. Archit. Manag. 2024, 31, 1751–1787. [Google Scholar] [CrossRef]
  78. Wang, J.; Li, S.; Li, L.; Lin, P.; Xu, Z.; Gao, C. Attribute Recognition Model for Risk Assessment of Water Inrush. Bull. Eng. Geol. Environ. 2019, 78, 1057–1071. [Google Scholar] [CrossRef]
  79. Zhao, X.; Ye, Y.; Zhou, J.; Liu, L.; Dai, W.; Wang, Q.; Hu, Y. Comprehensive Evaluation of Cultivated Land Quality and Sensitivity Analysis of Index Weight in Hilly Region of Pearl River Delta. Trans. Chin. Soc. Agric. Eng. 2017, 33, 226–235. [Google Scholar] [CrossRef]
  80. Lin, Y.-C. Construction 3D BIM-Based Knowledge Management System: A Case Study. J. Civ. Eng. Manag. 2014, 20, 186–200. [Google Scholar] [CrossRef]
Figure 1. Measurement index system of synergy management performance in PBPSCs.
Sustainability 16 11025 g001
Figure 2. Standard measurement cloud chart of synergy management performance in PBPSCs.
Sustainability 16 11025 g002
Figure 3. Measurement process of synergy management performance in PBPSC.
Sustainability 16 11025 g003
Figure 4. Comparison cloud of performance measurement of synergy management in PBPSC.
Sustainability 16 11025 g004
Figure 5. Sensitivity analysis of synergy management performance in PBPSC.
Sustainability 16 11025 g005aSustainability 16 11025 g005b
Table 1. Selected influencing factors of synergy management performance in PBPSCs.
CategoryElementLiterature Sources
Cost controlDesign cost of components [15,27,48,49]
Production costs of components [15,27,48,49,50]
Material costs [33,48,51]
Transport costs[26,34,49,52]
Management costs[40,52,53]
TechnologyDegree of participation in technology cooperation[43,53,54]
Establishment of Technology Sharing Platform[22,43,45]
Rationality of the construction program[48,55,56,57,58]
Professional technicians[43,48,49,59,60]
InformationTimeliness of information exchange[44,52,61]
Effectiveness of information sharing[13,15,26,33,36,44,45,52,62,63]
Accuracy of information transmission[52,59,61]
Reliability of SCStability of participating members[28,53,64]
Response time[50,54,60,65]
Risk management and control capacity[23,28,49,50,53,59,60,63,66]
Capability of schedule control[15,32,34,54]
On-time delivery rate[15,28,50,60,67,68]
Environmental protectionConsumption of resources[2,27,28,29,66]
Waste discharges[2,27,28,29,50]
Control of dust and noise[2,27,28,29]
Table 2. Background information of experts.
CategoryProfileNumber
Educational backgroundSpecialized and below7
Undergraduate1
Master1
Work unitsDevelopment organization6
Construction unit1
Designing institute2
Working experience3–5 years1
6–10 years1
11–20 years3
More than 20 years4
Table 3. Standard measurement cloud of synergy management performance in PBPSCs.
LevelIntervalStandard Cloud
T1(Very poor)[0, 60)(30, 10, 0.5)
T2(Poor)[60, 70)(65, 1.667, 0.5)
T3(General)[70, 80)(75, 1.667, 0.5)
T4(Good)[80, 90)(85, 1.667, 0.5)
T5(Very good)[90, 100](95, 1.667, 0.5)
Table 4. Index weight of synergy management performance in PBPSCs.
Primary IndexWeightSecondary Indexw1w2w3Relative Weight
A0.258A10.0470.0550.0510.198
A20.0510.0550.0530.205
A30.0490.0510.0490.192
A40.0470.0640.0560.217
A50.0520.0460.0490.188
B0.207B10.0510.0460.0480.231
B20.0490.0620.0550.267
B30.0510.0490.0500.241
B40.0530.0560.0540.262
C0.145C10.0510.0500.0500.346
C20.0500.0490.0490.339
C30.0540.0360.0460.316
D0.227D10.0520.0360.0450.197
D20.0510.0390.0450.199
D30.0500.0450.0470.209
D40.0500.0350.0430.190
D50.0500.0430.0470.205
E0.162E10.0500.0520.0500.311
E20.0470.0610.0540.334
E30.0460.0680.0580.355
Table 5. The measurement cloud of synergy management performance in PBPSCs.
Comprehensive Measurement CloudPrimary IndexMeasurement CloudSecondary IndexMeasurement Cloud
U = (81.0, 2.5, 2.0)A(79.6, 6.8, 1.8)A1(77.1, 7.1, 1.4)
A2(81.9, 7.7, 1.8)
A3(78.6, 4.4, 1.0)
A4(77.3,8.1, 3.0)
A5(83.6, 5.6, 1.9)
B(82.3, 7.2, 2.5)B1(82.3, 7.1, 3.1)
B2(79.3, 8.4, 1.6)
B3(83.8, 5.0, 1.9)
B4(86.6, 7.5, 3.2)
C(84.2, 5.3, 1.9)C1(83.9, 5.1, 2.6)
C2(82.0, 6.1, 2.4)
C3(86.9, 4.4, 1.1)
D(81.8, 4.2, 1.7)D1(83.4, 3.8, 1.1)
D2(82.1, 4.3, 2.3)
D3(80.9, 4.0, 1.6)
D4(80.3, 3.8, 2.7)
D5(82.0, 4.7, 1.0)
E(78.4, 7.5, 2.2)E1(80.9, 6.5, 1.1)
E2(77.3, 6.9, 2.0)
E3(77.1, 8.8, 3.2)
Table 6. Comprehensive cloud closeness of synergy management performance in PBPSCs.
IndexComprehensive Cloud ClosenessMaximum ValueLevel
T1T2T3T4T5
A10.1200.1390.4480.1740.1180.448T3(General)
A20.1370.1280.2110.3810.1440.381T4(Good)
A30.0820.1590.3700.2420.1460.370T3(General)
A40.2490.1020.4410.1280.0810.441T3(General)
A50.2100.1190.2330.3100.1280.310T4(Good)
A0.1180.1500.3090.2770.1460.309T3(General)
B10.1220.1260.1960.4110.1450.411T4(Good)
B20.1660.1380.3110.2530.1320.311T3(General)
B30.0790.1120.1450.5320.1320.532T4(Good)
B40.2220.0780.1040.4700.1250.470T4(Good)
B0.1230.1260.1970.4100.1450.410T4(Good)
C10.0840.1010.1230.5760.1170.576T4(Good)
C20.1030.1350.2150.3960.1520.396T4(Good)
C30.0750.1190.1480.4820.1770.482T4(Good)
C0.0790.1020.1250.5750.1180.575T4(Good)
D10.0680.1210.1630.5050.1420.505T4(Good)
D20.0790.1390.2160.4080.1570.408T4(Good)
D30.0790.1520.2650.3430.1610.343T4(Good)
D40.0770.1570.2890.3180.1600.318T4(Good)
D50.0840.1400.2190.4010.1570.401T4(Good)
D0.0780.1440.2300.3880.1590.388T4(Good)
E10.1130.1440.2570.3350.1520.335T3(General)
E20.1160.1430.4340.1840.1230.434T4(Good)
E30.1770.1250.4340.1600.1040.434T4(Good)
E0.1350.1460.3680.2210.1310.368T3(General)
U0.0660.1540.2620.3540.1640.354T4(Good)
Disclaimer/Publisher’s Note: The statements, opinions and data contained in all publications are solely those of the individual author(s) and contributor(s) and not of MDPI and/or the editor(s). MDPI and/or the editor(s) disclaim responsibility for any injury to people or property resulting from any ideas, methods, instructions or products referred to in the content.

