Abstract
In the last decade, rapid technological development and a simultaneous increase in social awareness related to environmental protection have been determinants of the research and development of new techniques for generating energy from renewable sources. The international situation after 24 February 2022 in turn caused an increase in demand for energy that can be generated locally. This trend has not bypassed Poland either, where dynamic development of the market related to generating energy from renewable sources has been observed for many years. The aim of this article is to identify regularities in the degree of impact of the production and consumption of renewable energy on economic growth in Poland in 2005–2022. In this study, we used power econometric models. The results obtained by the authors show that energy consumption including renewable energy affects economic growth. In Poland, in the period under review, the increase in the consumption and production of energy from renewable sources, both on a national scale and on the scale of separate regions (city agglomerations, towns and suburbs, rural areas), contributed to the increase in measures characterizing economic development.
1. Introduction
The systematic growth of the human population has caused a demand for essential resources, including food and energy. Importantly, the population in developed countries tends to consume much more resources than the population in developing countries []. The functioning and progression of the economy are mainly based on the use of fossil fuels, but these are no longer effective in the face of the depletion of many deposits. In addition, excessive consumption of fossil fuels has a negative impact on the environment, causing increased health risks and the threat of global climate change caused by greenhouse gas emissions [,,,,]. Due to the negative impact of climate change on the functioning of society and the economy, the structure of global energy consumption has changed. There is an urgent need to use clean and sustainable energy, and the levels of renewable energy (RES) consumption have started to grow rapidly around the world [,,,].
Renewable energy refers to energy produced from natural resources, such as sunlight, wind, rain, and geothermal heat. These resources are renewable and do not run out after use. The most important advantage of renewable energy is its sustainable development. Furthermore, renewable energy can be produced locally, reducing dependence on imported fossil fuels and increasing energy security. At the same time, the cost of its production is lower than its equivalent generated from fossil sources [].
In Poland, which will be the subject of this study, a regular increase in the importance of renewable energy sources in the energy balance has been observed for many years []. In accordance with the European Union law [], Poland was obliged to generate 15% of energy from RESs in 2020 and achieved this goal with a surplus. In 2022, the share of energy from renewable sources in the gross final energy consumption amounted to 16.81% and increased by 1.2 p.p. compared to 2021.
With the increasing use of renewable energy, a large number of scientific publications have emerged to investigate the relationship between renewable energy consumption and economic growth [,,,,,,,,,]. The results show that renewable energy has various effects on economic development, which can be positive, negative or insignificant. For example, Chen et al. [] found that the relationship between renewable energy consumption and economic growth depends on the amount of renewable energy used, and the impact of renewable energy consumption on economic growth is positive and significant only when developing countries or non-OECD countries exceed a certain threshold of renewable energy consumption. If developing countries use renewable energy below a certain threshold level, the effect of renewable energy consumption on economic growth is negative. On the other hand, renewable energy consumption has no significant effect on economic growth in developed countries.
Against this background, this article examines the relationship between economic growth and renewable energy consumption in Poland in the years 2005–2022. The aim of the article is to identify regularities in the degree of impact of the production and consumption of renewable energy on economic growth in Poland in 2005–2022. This study uses power econometric models. The basic dependent variable is the gross domestic product per capita, which is considered the most important indicator of economic growth. In addition, the study was extended to include three dependent variables. The variables concern the mean equivalized net income in city agglomerations, towns and suburbs, and rural areas. The added value of the research presented in this article is a detailed analysis of the impact of energy consumption and production on economic growth not only within the entire country, but also in its individual regions (city agglomerations, towns and suburbs, rural areas). This is a significant contribution of the authors to the ongoing global discussion related to the impact of renewable energy on economic growth.
The structure of this article includes an introduction, which presents the main objective of the work and explains the authors’ main motivations for conducting research on the impact of renewable energy on economic growth. Then, a review of the literature related to the research topic is carried out. The rest of the paper presents the statistical data used in the study and describes the research procedure used in the work. The paper ends with a presentation of the research results and a discussion and conclusions resulting from the conducted research.
2. Literature Review
2.1. Renewable Energy and Economic Growth
The role of renewable energy generation in economic growth remains unexplored, even though the production of electricity from these sources reduces CO2 emissions and lowers the unit costs of electricity production []. Researchers attempting to determine the impact of renewable and natural resources on economic recovery in countries with different levels of development obtain different results. Some studies support the view that it affects economic growth [,,,], while others do not confirm such a relationship [,].
According to Bhattacharya et al. [], the relationship between energy consumption and economic growth can be analyzed based on four hypotheses:
- The growth hypothesis, which assumes that energy is the main input to the growth process and that a unidirectional causality exists from energy consumption to economic growth: in this scenario, energy conservation policies will have a negative impact on economic growth;
- The conservation hypothesis, which assumes that economic growth causes energy consumption: in this situation, nature conservation policies will not affect economic growth;
- The feedback hypothesis, which assumes a bidirectional relationship between energy consumption and economic growth: this hypothesis suggests that any change in energy consumption will affect economic growth in the opposite way;
- The neutrality hypothesis, which suggests that energy consumption and economic growth are independent and do not affect each other.
The research results obtained by the authors, using the panel estimation technique, in 38 countries with the largest consumption of renewable energy (in the years 1991–2012) allowed the division of the studied countries into three groups:
- Group one—23 countries (60.5%, including Poland), in which renewable energy sources were considered a significant factor of economic growth;
- Group two—4 countries (10.5%) where renewable energy sources had a negative impact on economic growth;
- Group three—11 countries (29.0%), in which it was not possible to clearly state that renewable energy sources would be a significant factor driving or constituting a barrier to economic growth.
These results are confirmed by studies presented, among others, by Schahbaz et al. [], conducted for a slightly longer period (1990–2018), using the same methods, on the same group of entities.
Studies focused on the energy consumption–economic growth relationship in developed countries were conducted, among others, by Yu et al. []. Their results indicate that the development of natural resources can become an important driving force for ecological economic recovery. The hypothesis of behavior between economic growth and renewable energy consumption and the hypothesis of feedback between non-renewable energy consumption and economic growth in developed countries were confirmed by the results of Mohammadi, Saghaian and Zandi Dareh Gharibi []. On the other hand, causality tests performed by these authors for developing countries showed that energy consumption and economic growth are interdependent and complementary. On the one hand, growth drives energy consumption; on the other hand, higher energy consumption is sponsored by increased economic growth. This confirms the hypothesis of feedback between energy consumption (non-renewable and renewable) and economic growth in these countries.
Many studies analyzing this relationship focus on emerging economies, as many of them currently struggle with energy security issues. Increasing the use of renewable energy provides these economies with one way to diversify their energy needs and reduces their dependence on imported oil []. Fang [] attempted to assess the role of both the volume and share of renewable energy consumption in China’s economic well-being in the years 1978–2008, using the Cobb–Douglas production function. His results indicate that a 1% increase in bioenergy consumption increases real GDP by 0.120%, GDP per capita by 0.162%, annual income per capita of rural households by 0.444% and annual income per capita of urban households by 0.368%. According to this author, these increases are not strictly related to the increased share of renewable energy consumption, but they are increasing due to the country’s policies and institutional factors.
The positive relationship between real GDP and energy consumption in the long term is confirmed by the research of Lee and Chang [] and Apergis and Payne []. According to them, economic growth and energy consumption do not have a causal relationship in the short term, but there is a long-term unidirectional causality running from energy consumption to economic growth. This means that reducing energy consumption does not negatively affect GDP in the short term, but it does in the long term. A similar research problem in relation to African countries was raised in the works by Menyah and Wolde-Rufael [] (Republic of South Africa—RSA), Odhiambo [] (3 African countries) and Al-mulali and Binti Che Sab [] (30 countries of Sub-Saharan Africa). The results of their research show that in the case of the Republic of South Africa and Kenya, there is a unidirectional causal flow from energy consumption to economic growth. However, in the case of Congo, it is economic growth that drives energy consumption. In contrast, research results in Sub-Saharan African countries have shown that energy consumption has played an important role in increasing both economic growth and financial development in these countries, but with the consequences of high pollution.
A positive assessment of the impact of both renewable and non-renewable energy consumption on economic growth in developing countries was obtained by Hieu and Mai []. The authors recommend that these countries prioritize investments in renewable energy to increase production and development. According to AlNemer, Hkiri and Tissaoui [], there is a positive causal relationship between the use of renewable energy and economic growth in Saudi Arabia, while non-renewable energy sources slow down economic growth in the short and medium term and contribute to environmental pollution.
The conducted broad review of the literature also indicates the fact that not all studies confirm the positive relationship between the analyzed phenomena. This includes analyses of relationships using econometric methods for OECD countries conducted by Dogan et al. [], extending the research of Inglesi-Lotz [], who conducted an analysis of the relationships using econometric methods for OECD countries. This is important because these countries declared their intention to achieve sustainable development goals and made significant investments in the development of green technologies, i.e., renewable energy sources. Also, the results of studies of Menegaki [] do not confirm the relationship between renewable energy consumption and GDP. Such results are seen in the uneven and insufficient exploitation of renewable energy sources in Europe. On the other hand, the research by Ozcan and Oztruk [], who analyzed data from 17 emerging countries, confirms the lack of relationship between renewable energy consumption and GDP, except for the case of Poland, where the consumption of energy from renewable sources has a positive effect on GDP; this is evidenced by the significant positive value of the regression coefficient at the level of 0.10. Therefore, greater energy consumption will result in greater economic growth in the Polish economy. This means that energy-saving policy aimed at reducing energy demand may have a detrimental effect on Polish economic outcomes. The results of the study conducted by Bhattacharya et al. [] indicate that the increase in renewable energy consumption has led to a slowdown in production growth in countries such as India, Ukraine, the USA and Israel.
Table 1 presents a collective classification of selected scientific works focusing on the problem of the impact of energy consumption on economic growth according to the obtained results.

Table 1.
Classification of selected scientific works depending on the direction of the relationship between energy consumption and economic growth.
Apergis and Tang [] emphasize that the problems with establishing a clear answer regarding the causal relationship between energy consumption and economic growth are caused by the use of different methods (and different numbers of variables) in the study and the different levels of economic development of the countries studied. In their work, they attempted to verify the hypothesis that this relationship is positive, and the data for the study came from as many as 85 countries at different stages of development. The results they obtained indicate that developed and developing countries are more likely to support the hypothesis of energy-driven growth compared to less developed or low-income countries. Chen et al. [] also indicate that the results of studies in the discussed area may vary depending on the country or the set of data used for analysis.
The political aspect of such dependence is worth emphasizing. The use of energy from renewable sources allows problems to be counteracted, such as volatility of fuel prices affecting energy poverty, environmental issues and the energy security of importing countries. The International Energy Agency (IEA) [] assumes that renewable energy will be the fastest growing segment of the energy industry by 2030. This growth is driven by the fact that it is to some extent a solution to problems related to energy security and climate change [].
Belke et al. [] discussed the political aspects of the relationship between renewable energy consumption and economic growth in more detail, analyzing the causality of the issue by taking into account various variables (energy supply infrastructure, energy efficiency considerations or institutional constraints). Domac et al. [] argued that bioenergy should help increase macroeconomic efficiency by creating jobs and other economic benefits. Awerbuch and Sauter [] indicated that renewable energy sources have a positive impact on economic growth by reducing the negative effects of oil price volatility. In addition, they contribute to the security of energy supplies. Dogan and Ozturk [], based on their research confirming the impact of renewable energy consumption on economic growth, proposed possible solutions: (1) increasing the use of energy from renewable sources while limiting the use of non-renewable sources, (2) legal regulations contributing to the increase in the use of energy from renewable sources, (3) adopting renewable energy sources and environmentally friendly technologies at every stage of production, and (4) supporting projects involving the use of environmental protection methods.
2.2. Impact of Renewable Energy on GDP in Poland and Central and Eastern European Countries
The countries of Central and Eastern Europe have the potential to diversify their energy sources. Environmental pollution, depletion of non-renewable energy sources and high costs of their acquisition speak in favor of increasing the share of renewable sources in total energy production. The argument for this is the research results of, among others, Kasperowicz, Bilan and Štreimikienė [], and Fedajev et al. [], which indicate a positive impact of using energy from RESs (renewable energy sources) on GDP and added value of industry in these countries. Policy supporting green energy and infrastructure will contribute to sustainable economic development. Additionally, as indicated by the research results of Simionescu, Radulescu and Belascu [], increasing the consumption of energy from renewable sources in these countries will reduce CO2 emissions and, indirectly, energy poverty. Marinaș et al. [] show that in the short term, the dynamics of gross domestic product (GDP) and renewable energy consumption (REC) are independent in Romania and Bulgaria, while in Hungary, Lithuania and Slovenia, the increasing use of renewable energy improves economic growth. The hypothesis of bidirectional causality between renewable energy consumption and economic growth in the long term was confirmed for the whole group of analyzed countries from Central and Eastern Europe.
Slightly different conclusions were drawn by Suproń and Myszczyszyn [], who assessed the impact of both renewable and non-renewable energy consumption on economic growth in the Visegrad Group countries (V4: Czech Republic, Hungary, Poland and Slovakia). Their results indicate that non-renewable energy significantly affects economic growth in countries such as Poland, the Czech Republic and Slovakia. This is mainly due, especially in Poland, to the predominance of fossil fuels for energy production. In Hungary, on the other hand, renewable energy is playing an increasingly important role. The country had fulfilled its renewable energy commitments by 2020, but this result is lower than the European Union average. There are several reasons: (1) the country is poor in hydropower; (2) since 2016, regulations have prohibited the installation of new wind farms in the country; (3) the expansion of solar energy began late compared to other EU member states []. Ślusarczyk et al. [] compared the impact of renewable energy sources on economic growth in a lower-income country—Poland—and a high-income country (Sweden). The authors confirmed positive correlations between energy-related variables and the level of economic growth in both Poland and Sweden. Poland, together with the so-called new EU member states (EU-13), was also the subject of energy consumption research conducted by Meyer, Magda and Bozsik []. The authors determined which non-renewable energy carriers were replaced by renewable energy carriers. Renewable energy has replaced coal in Poland, the Czech Republic, Slovakia, Bulgaria, and Cyprus; oil in Malta; and gas in Lithuania. In other countries, a relationship between renewable and non-renewable energy could not be detected.
The growing interest in renewable energy in Poland became visible in the early 1990s. Initially, the development of this sector took place without state aid, almost exclusively as a result of grassroots initiatives undertaken by investors, with the support of a few non-governmental institutions, and later on, local governments []. It was only under the Kyoto Protocol that Poland committed to reducing greenhouse gases by 6% compared to 1989. The next act regulating the development of renewable energy was the Act of 10 April 1997—Energy Law, amended in 2005 due to the need to adjust the national energy policy to the guidelines of the EU policy after Poland’s accession (2004) to the European Union. In the following years, further acts and regulations were issued, including the Act on Renewable Energy Sources of 16 May 2016.
According to public statistics, the acquisition of primary energy from renewable sources showed a growing trend (Figure 1). In 2022, the production of this energy amounted to 13.45 MTOE (megatons of oil equivalent), which was 296% higher compared to 2005. The above increase translated into an increase in the share of energy from renewable sources in total primary energy. This share in 2022 amounted to 16.9%, which means an increase of 10 percentage points compared to 2005.
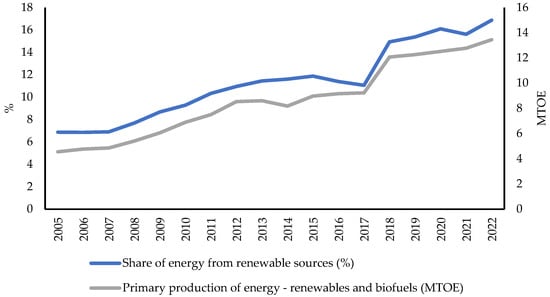
Figure 1.
Share of energy from renewable sources and primary production of energy (renewables and biofuels) in Poland in 2005–2022.
In the domestic acquisition (and consumption) of energy from renewable sources, the dominant position was occupied by solid biofuels (Table 2). However, their share in the period under review showed a decreasing trend and in 2021 amounted to 69.35%, which means a decrease compared to 2005 by 21.85 percentage points. In 2021, wind energy achieved a relatively high position in the acquisition of energy from renewable sources by carrier, overtaking liquid biofuels, solar energy and heat pumps. In the years 2005–2021, excluding solid biofuels, the share of energy obtained from water decreased from 4.2% to 1.57%. The remaining renewable energy carriers showed an increasing trend, with information on solar energy, energy obtained from municipal waste and heat pumps appearing only in 2010.
Table 2.
The share of renewable energy commodities in the total renewable energy obtained in the years 2005–2021.
3. Materials and Methods
3.1. Statistical Material
In the analysis of the impact of renewable energy use on the economic development of Poland, a wide set of both dependent and independent variables was used. Due to the aim of the study and the method used, 4 dependent variables (Y1–Y4) were selected to characterize the level of economic development and the country’s prosperity, as well as 18 independent variables, 2 of which reflect production factors (X1—capital; X2—employment); variable X3 characterizes technological progress, and the remaining 15 variables (X4–X18) concern renewable energy and were divided into three sets:
- Set 1 (X4, X5, X6, X7) contains variables characterizing the use and production of energy from renewable sources in general, i.e., without division into specific energy carriers;
- Set 2 (X8, X9, X10, X11, X12) includes variables characterizing the consumption of final energy from renewable sources, taking into account energy carriers;
- Set 3 (X13, X14, X15, X16, X17, X18) contains variables characterizing the level of gross electricity production from renewable sources, divided into energy carriers.
Information about the symbols, names and units of individual variables and their brief description are presented in Table 3.
The statistical data used in the study come from the Eurostat database [] and cover the years 2005–2022. The description of Poland’s economic development used generally recognized measures for assessing the level of prosperity of the country []. The variables characterizing the factors of production and technological progress are in line with the proposal presented by Fang [], and the selection of characteristics describing the production and consumption of renewable energy was based on the methodology for measuring this phenomenon used by Eurostat []. The availability of data determined the time period adopted in the study.
Table 3.
Detailed information on the dependent and independent variables used in model construction.
Table 3.
Detailed information on the dependent and independent variables used in model construction.
| Symbol | Name | Unit | Description |
|---|---|---|---|
| Y1 | Real GDP per capita | Chain-linked volumes (2010), EUR per capita | The ratio of real GDP to the average population in a given year. To measure the rate of growth of GDP in volume terms, GDP at current prices is valued at the prices of the previous year and the resulting volume changes are superimposed on the level of a reference year; this approach is called a chain series [,]. Gross domestic product describes the aggregate value of final goods and services produced by domestic and foreign factors of production within a given country in a given unit of time (usually a year). GDP = C + I + G + Ne where C—consumption; I—investment; G—government spending; Ne—net exports. |
| Y2 | Mean equivalized net income—cities | EUR | The equivalized income is calculated by dividing the household’s total income from all sources by its equivalent size, which is calculated using the modified OECD equivalence scale. This scale attributes a weight to all members of the household: 1.0 to the first adult; 0.5 to the second and each subsequent person aged 14 and over; 0.3 to each child aged under 14. The equivalent size is the sum of the weights of all the members of a given household []. |
| Y3 | Mean equivalized net income—towns and suburbs | EUR | |
| Y4 | Mean equivalized net income—rural areas | EUR | |
| X1 | Gross capital formation | Current prices, EUR million | Gross fixed capital formation, abbreviated as GFCF, consists of resident producers’ investments, deducting disposals, in fixed assets during a given period. It also includes certain additions to the value of non-produced assets realized by producers or institutional units. Fixed assets are tangible or intangible assets produced as outputs from production processes that are used repeatedly, or continuously, for more than one year []. |
| X2 | Employment (persons aged 15–64) | Thousand persons | The employment level is defined as the number people engaged in productive activities in an economy. The concept includes both employees and the self-employed. The two main measures used for employment are the number of persons employed or the number of employees []. |
| X3 | Gross domestic expenditure on R&D | EUR per inhabitant | Gross domestic expenditure on R&D (GERD) includes expenditure on research and development by business enterprises, higher education institutions, and government and private non-profit organizations []. |
| X4 | Share of energy from renewable sources | Percentage | The share of renewable energy is the ratio of renewable energy used in a country/region to the total amount of energy used by the country/region. It is calculated based on the level of gross available energy, gross energy consumption in the country and total energy supply []. |
| X5 | Primary production of energy—renewables and biofuels | Gigawatt-hour (GWh) | Primary production of energy is any extraction of energy products in a useable form from natural sources. This occurs either when natural sources are exploited (for example, in coal mines, crude oil fields, hydro power plants) or in the fabrication of biofuels. Transforming energy from one form into another, such as electricity or heat generation in thermal power plants (where primary energy sources are burned), or coke production in coke ovens, is not primary production []. |
| X6 | Gross electricity production—renewables and biofuels | Gigawatt-hour (GWh) | Gross electricity production refers to the process of producing electrical energy. It is the total amount of electrical energy produced by transforming other forms of energy, for example, nuclear or wind power. Total gross electricity generation covers gross electricity generation in all types of power plants []. |
| X7 | Gross heat production—renewables and biofuels | Gigawatt-hour (GWh) | Gross heat production is the total heat produced by the installation and includes the heat used by the installation’s auxiliaries which use a hot fluid (space heating, liquid fuel heating, etc.) and losses in the installation/network heat exchanges, as well as heat from chemical processes used as a primary energy form []. |
| X8 | Final consumption of energy—primary solid biofuels | Terajoule (TJ) | Final energy consumption is the total energy consumed by end users, such as households, industry and agriculture. It is the energy which reaches the final consumer’s door and excludes that which is used by the energy sector itself []. |
| X9 | Final consumption of energy—geothermal | Terajoule (TJ) | |
| X10 | Final consumption of energy—solar thermal | Terajoule (TJ) | |
| X11 | Final consumption of energy—biogases | Terajoule (TJ) | |
| X12 | Final consumption of energy—renewable municipal waste | Terajoule (TJ) | |
| X13 | Gross electricity production—hydro | Gigawatt-hour (GWh) | See (X6) |
| X14 | Gross electricity production—wind | Gigawatt-hour (GWh) | |
| X15 | Gross electricity production—solar photovoltaic | Gigawatt-hour (GWh) | |
| X16 | Gross electricity production—primary solid biofuels | Gigawatt-hour (GWh) | |
| X17 | Gross electricity production—biogases | Gigawatt-hour (GWh) | |
| X18 | Gross electricity production—renewable municipal waste | Gigawatt-hour (GWh) |
3.2. Econometric Modeling of the Impact of Renewable Energy Production and Consumption on Economic Development
Classical econometric models estimated using the least squares method can be used to analyze complex phenomena that combine various aspects, including economic, social and others []. In such a model, the studied phenomenon is explained by means of a set of factors that are directly or indirectly related to it []:
where Y—dependent variable; X—set of independent variables.
Due to the nature of the relationships between the dependent variable and independent variables, we distinguish linear and nonlinear models [,,], among which the most frequently used in the analysis of economic phenomena is the power model [,,]. An important advantage of both the linear model and the power model is the easy interpretation of the values of structural parameters (coefficients) associated with the explanatory variables.
The process of examining the impact of the production and consumption of energy from renewable sources on the economic development of the country and the regions identified in the study was carried out in the following stages:
- Calculation of Pearson correlation coefficients between individual variables;
- Estimation of the Cobb–Douglas function for each dependent variable, taking into account a fixed set of independent variables (X1, X2, X3, X4, X5):where Y—variable characterizing economic development (Y1–Y4); X1—variable characterizing capital; X2—variable characterizing employment; X3—variable related to technological progress; X4—share of energy from renewable sources; X5—primary production of energy (renewables and biofuels); —intercept; , , , , —structural coefficients of the model, which inform about the direction and magnitude of the impact of individual independent variables on economic development; ε—random component.
- Estimation of the Cobb–Douglas function for each dependent variable, taking into account variables X1, X2 and X3 and individually introduced variables characterizing the production and consumption of energy from renewable sources:where Y and X1–X3 are as in Equation (2); Xi—i-th variable characterizing the production and consumption of renewable energy; , , , , , and are as in Equation (2).
- Estimation of the power function for each dependent variable without variables X1–X3, but with independent variables characterizing the production and consumption of renewable energy, taking into account their division into three groups:where Y—as in Equation (2); Xil—i-th variable from the l-th group of variables characterizing the production and consumption of renewable energy; kl—number of independent variables in the l-th group; , , and —as in Equation (2).
The models estimated in stage 1 are consistent with the proposal presented by Fang [], while the models estimated in stages 3 and 4 are the authors’ proposals.
The models recorded in Equations (2)–(4) were estimated using the least squares method after previously reducing them to a linear form by logarithmization (a necessary condition for using the least squares method).
The quality of the estimated models was assessed based on the measures R2 and SE, as well as RESET (Ramsey Regression Equation Specification Error Test), the Breush–Pagan test and the significance of the structural coefficients of the model. RESET is a general specification test for the linear regression model, and the Breush–Pagan test is used to examine the heteroscedasticity of the distribution of residuals (see [,]).
The selection of variables for the model in stage 4 was performed using backward stepwise regression, the essence of which is presented in Section 3.3.
3.3. Selecting Explanatory Variables for the Model—Stepwise Regression
The basic problem in the construction of econometric cross-sectional models is the selection of independent variables, which, on the one hand, should provide a high degree of explanation of the variance in the dependent variable and, on the other hand, should be characterized by appropriate levels of correlation, both with the dependent variable and with each other. There are several statistical methods that support this process [], and one of them is the stepwise regression method. It belongs to the class of iterative methods, which means that the final result is obtained in a specified number of steps by optimizing the solution from the previous step. Three basic types of cork regression can be distinguished []:
- Forward—in this method, independent variables are added to the model in such a way that each subsequent iteration significantly increases its level of fitness;
- Backward—in this method, a model is built with a complete potential set of independent variables, and then in subsequent steps, those whose impact on the level of model fit is the least significant are removed;
- Mixed—combining elements of the two above methods.
In the classical stepwise regression method, the most commonly used criterion for measuring the influence of variables on the level of model fit is the F statistic [], the limit values of which are selected by the researcher or automatically by the used program. Another criterion used is the Akaike information criterion []. A value of this criterion higher (in the case of forward regression) or lower (in the case of backward regression) than the limit value results in adding the independent variable to the model (forward regression) or removing it from the model (backward regression) [].
4. Results
4.1. Assessment of the Strength and Direction of the Influence of Variables Characterizing the Production and Consumption of Energy from Renewable Sources (Stage 1)
The study of the impact of renewable energy production and consumption on economic growth in Poland in 2005–2022 began with the calculation of Pearson correlation coefficients, the values of which—taking into account the division into three sets of independent variables related to renewable energy—are presented in Table 4, Table 5 and Table 6. Each table also provides the correlation coefficients of individual variables with variables X1–X3, while the correlations of these variables with variables Y1–Y4 and among themselves are presented only in Table 4.
Table 4.
Correlation coefficients between dependent variables, variables X1–X3 and independent variables from set 1.
Table 5.
Correlation coefficients between dependent variables, variables X1–X3 and independent variables from set 2.
Table 6.
Correlation coefficients between dependent variables, variables X1–X3 and independent variables from set 3.
Table 4 shows that independent variables characterizing both production factors and technological progress, as well as the production and consumption of energy from renewable sources in general, are very strongly or strongly correlated with individual dependent variables, and this is a positive relationship. All independent variables from this table are also very strongly correlated with each other. In the case of taking into account individual renewable energy carriers (Table 5 and Table 6), the relationships with dependent variables and variables X1–X3 are weaker, but also positive. The weakest relationships were observed for variables X12 and X16. It is worth noting that the correlation between carriers related to electricity production is in several cases moderate (between X14 and X15), weak (between X13 and X15) or very weak (between X15 and X6 and X17 and X18). The positive relationship between the analyzed variables indicates a positive impact of the proposed independent variables on the variables characterizing the economic development of Poland in the years studied. In other words, the growth of production factors, technological progress and the production and consumption of energy from renewable sources cause an increase in the measures characterizing the economic development of the country and the regions distinguished in the study: city agglomerations, towns and suburbs, and rural areas.
Figure 2 presents the relationships between the individual dependent variables (Y1–Y4) and the variables characterizing the share of energy from renewable sources (X4) and the primary production of energy—renewables and biofuels (X5).
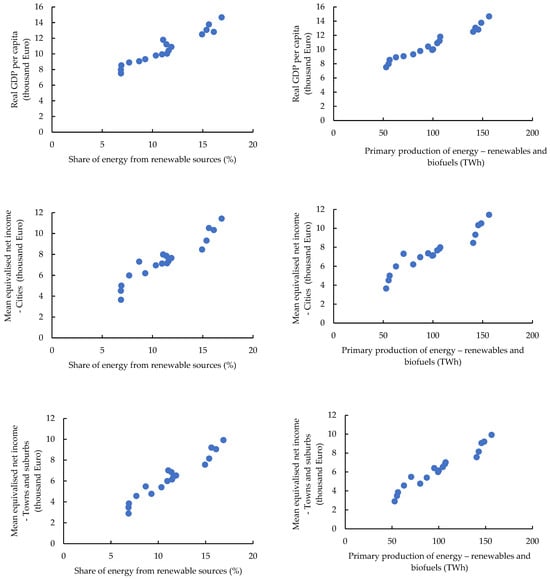
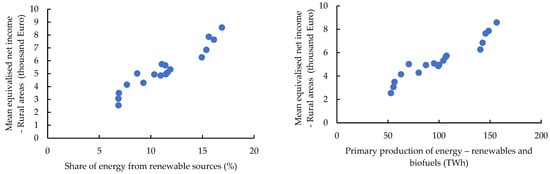
Figure 2.
Dependent variables Y1–Y4 against the background of independent variables X4 and X5.
4.2. Results of Estimation of Models Obtained in Stage 2
At this stage, for each dependent variable (Y1–Y4), the Cobb–Douglas model was estimated, in which in the set of independent variables—in addition to the determinants of economic growth such as capital (X1), employment (X2) and technological progress (X3)— characterizing the share of energy from renewable sources (X4) and the primary production of energy (renewables and biofuels) (X5) was introduced. For all estimated models, the SE and R2 measures were at an appropriate level (SE close to 0, and R2 close to 1), and the critical values of the RESET and Breush–Pagan tests clearly suggested the acceptance of the null hypotheses, indicating the correctness of the specification of the functional form of the models and the homoscedasticity of their random components. Despite the good quality of the models, it turned out that only in a few cases were the structural parameters statistically significant, and these were parameters represented variables characterizing the production and consumption of renewable energy (X4, X5). Unfortunately, none of the estimated models yielded significant parameters for the determinants of economic growth.
According to the basic principle of econometric modeling, if there are independent variables in the estimated model for which coefficients are statistically insignificant, then these variables should be removed from the model and the model should be re-estimated without these variables. Therefore, a decision was made not to assess the impact of variables related to the production and consumption of energy from renewable sources on economic growth in Poland in 2005–2022 based on these models.
The results of the estimation of the models obtained at this stage are presented in Table A1 in the Appendix A.
4.3. Estimation Results of Models Obtained in Stage 3
In stage 3, models for variables Y1–Y4 were estimated, in which variables X1–X3 were always among the independent variables, while variables characterizing the production and consumption of renewable energy (X4–X18) were entered individually. This was to check whether the insignificance of parameters in the determinants of economic growth in the models estimated in stage 2 was caused by too-strong dependencies between the independent variables used in these models. A total of 60 models were estimated, in which, again, the SE and R2 measures, as well as the critical values of the RESET and Breush–Pagan tests, were at levels indicating good model quality. In these models, the significance of coefficients occurring both in the determinants of economic growth and in the variables characterizing the production and consumption of energy from renewable sources improved. However, only in a few models were all coefficients significant, but then at least one of the coefficients was negative (lack of coincidence, i.e., agreement of the parameter sign with the sign of the correlation coefficient). This in turn limited the possibilities of their interpretation, despite the fact that they were significant. The inconsistency of signs occurred most often for the variable describing capital (X1) and for some variables characterizing the production and consumption of renewable energy in general and taking into account energy carriers. It is worth noting that, in many models, the parameters for variables X2 (employment) and X3 (variable characterizing technological progress) turned out to be significant, but then the coefficients for the other variables were insignificant and very often negative. It was also observed that in the case of GDP per capita (Y1), the coefficient for the variable characterizing technological progress was most often significant and positive, while for net income (Y2–Y4) such properties were most often exhibited by the parameter for employment.
Since, at this stage, models with all significant and positive parameters were not obtained, it was also decided not to assess the impact of variables concerning the production and consumption of energy from renewable sources on economic growth in Poland in the years 2005–2022 on their basis.
The estimation results of the models obtained at this stage are presented in Table A2 in Appendix A.
4.4. Estimation Results of the Models Obtained in Stage 4
In Stage 4—due to the fact that, in the previous stages, the coefficients of variables characterizing capital, employment and technological progress were rarely significant—it was decided to estimate power models only with variables characterizing renewable energy production and consumption, taking into account their division into three groups. The selection of these variables was made using backward stepwise regression. All estimated models were characterized by very good quality, and moreover, the coefficients for the independent variables were statistically significant.
In the models estimated at this stage, there are no determinants of economic growth resulting from economic theory; however, they can be used to answer the question of how many percentage points a given dependent variable will increase when the independent variable increases by 1%. This is a supplement to the information obtained on the basis of the correlation coefficients presented in Table 4, Table 5 and Table 6, according to which all variables proposed in the study related to the production and consumption of energy from renewable sources have a positive effect on the dependent variables and the strength of this influence is at least moderate.
The values of coefficients for independent variables together with the assessment of their significance are presented in Table 7.
Table 7.
Coefficients for independent variables characterizing renewable energy production and consumption obtained as a result of estimating models in stage 4 (average estimation errors are given in brackets).
Based on the results presented in Table 7, the following conclusions were drawn regarding the impact of variables characterizing the production and consumption of renewable energy on individual variables characterizing the economic development of Poland in the years 2005–2022 (when interpreting the coefficients, the ceteris paribus principle was adopted, i.e., no changes in the remaining variables in the model):
- GDP per capita (Y1):
- An increase in the primary production of energy (renewables and biofuels) (X5) by 1% causes an increase in GDP per capita by 0.521%;
- An increase in the final consumption of energy (primary solid biofuels) (X8) by 1% causes an increase in GDP per capita by 0.281%;
- An increase in the final consumption of energy (biogases) (X11) by 1% causes an increase in GDP per capita by 0.347%;
- An increase in gross electricity production (biogases) (X17) by 1% causes an increase in GDP per capita by 0.166%;
- An increase in gross electricity production (renewable municipal waste) (X18) by 1% causes an increase in GDP per capita by 0.012%.
- Mean equivalized net income in city agglomerations (Y2):
- An increase in the share of energy from renewable sources (X4) by 1% causes an increase in the average equivalent net income by 0.529%;
- An increase in gross heat production (renewables and biofuels) (X7) by 1% causes an increase in the average equivalent net income by 0.181%;
- An increase in the final consumption of energy (primary solid biofuels) (X8) by 1% causes an increase in the average equivalent net income by 0.322%;
- An increase in the final consumption of energy (solar thermal) (X10) by 1% causes an increase in the average equivalent net income by 0.145%;
- An increase in gross electricity production (primary solid biofuels) (X16) by 1% causes an increase in the average equivalent net income by 0.326%;
- An increase in gross electricity production (renewable municipal waste) (X18) by 1% causes an increase in the average equivalent net income by 0.030%.
- Mean equivalized net income in towns and suburbs (Y3):
- A 1% increase in gross electricity production (renewables and biofuels) (X6) causes an increase in the average equivalent net income by 0.244%;
- A 1% increase in the primary production of energy (renewables and biofuels) (X5) causes an increase in the average equivalent net income by 0.461%;
- A 1% increase in the final consumption of energy (primary solid biofuels) (X8) causes an increase in the average equivalent net income by 0.388%;
- A 1% increase in the final consumption of energy (solar thermal) (X10) causes an increase in the average equivalent net income by 0.116%;
- A 1% increase in gross electricity production (biogases) (X17) causes an increase in the average equivalent net income by 0.416%.
- Mean equivalized net income in rural areas (Y4):
- A 1% increase in the primary production of energy (renewables and biofuels) (X5) causes an increase in the average equivalent net income by 0.846%;
- A 1% increase in the final consumption of energy (primary solid biofuels) (X8) causes an increase in the average equivalent net income by 0.414%;
- A 1% increase in the final consumption of energy (solar thermal) (X10) causes an increase in the average equivalent net income by 0.100%;
- A 1% increase in gross electricity production (primary solid biofuels) (X16) causes an increase in the average equivalent net income by 0.328%;
- A 1% increase in gross electricity production (renewable municipal waste) (X18) causes an increase in the average equivalent net income by 0.035%.
5. Discussion
Studies on the links between energy production and consumption and economic growth have been conducted by many researchers and cover virtually all countries in the world. They usually concern one or a group of countries in a specific time period. The selection of entities for research, the research period, variables used, methods applied, and the results obtained are primarily determined by the availability of data (see []). If the research tool in the discussed topic was econometric models, in most cases, several variables were used (e.g., [,]). On the other hand, in our research—concerning Poland in the years 2005–2022—we used four dependent variables measuring the level of economic growth and eighteen independent variables concerning production factors (capital, employment), technological progress and energy from renewable sources in total and by type of energy carrier. This allowed us to obtain detailed results not only for the entire country, but also for its individual regions. They confirm that the production and final consumption of energy from renewable sources have a positive impact on the economic development and prosperity of Poland. Similar conclusions regarding other countries and regions can be found, among others, in [,,,,,,].
The econometric models interpreted in this study indicate that the largest increase in the variable Y1 (real GDP per capita) caused an increase in the primary production of energy—renewables and biofuels (X5). The increase in the same variable also contributed to the largest increase in the dependent variables Y3–Y4, which characterize the mean equivalized net income in towns and suburbs and in rural areas, respectively. In the case of the dependent variable Y2, which reflects the mean equivalized net income in city agglomerations, the largest increase in this variable was obtained with the increase in the share of energy from renewable sources (X4).
These results are generally consistent with the results of previous studies focusing on European countries (e.g., [,,,]). In turn, the models estimated by Marinaș et al. [] for ten European Union (EU) member states from Central and Eastern Europe (CEE) in the years 1990–2014 confirm our results only for some of the countries analyzed by them, including Poland. For countries such as Romania and Bulgaria, a positive relationship was not observed in the short term. However, in the long term, for the entire group of analyzed countries, the hypothesis of bidirectional causality between renewable energy consumption and economic growth was confirmed by them. The existence of such a relationship between real GDP and renewable energy consumption is also confirmed by [,,,].
Among the analyzed types of renewable energy, a significant impact on economic growth was observed for energy obtained from primary solid biofuels, biomass and renewable municipal waste. These variables turned out to be significant in models explaining the formation of dependent variables. Similar results were obtained by Armeanu et al. [], who examined the causal relationships between renewable energy both in general and by type of carrier and the sustainable economic growth of 28 European Union countries in the years 2003–2014.
The analysis of models estimated at the regional level (city agglomerations, towns and suburbs, rural areas) showed that regardless of the type of region, similar independent variables affect the mean equivalized net income. On the other hand, the degree of urbanization affected the values of the coefficients of the estimated models. For example, the increase in the level of urbanization caused a decrease in the value of the coefficients for the primary production of energy (renewables and biofuels) (X5), gross heat production (renewables and biofuels) (X7), the final consumption of energy (solar thermal) (X10) and gross electricity production (renewable municipal waste) (X18). This may be a consequence of the specificity of the analyzed areas, as explained in the publication by Nie et al. []. According to the authors, these differences may result from both the habits of residents regarding energy use and the infrastructure base itself—its quality and degree of development. In city agglomerations, due to the dense network of energy infrastructure, the availability of energy is less important than the cost of energy. Renewable energy sources are more cost-effective than fossil sources, which is confirmed by the results of analyses presented in [,]. According to Madlener et al. [], this is primarily due to the growth of income in cities, which lead to changes in consumer needs, which results in increasing energy consumption, e.g., due to the growing number of electrical devices in urban households. A similar approach is presented by Zhang et al. [], who draw attention to the need to build integrated RES systems in cities, among others, in order to reduce costs for recipients.
In turn, for rural residents, this relationship is different; accessibility is a priority, while the cost of energy itself is secondary. This may be due to several reasons, including, among others, a lower level of infrastructure development and the specificity of energy consumption. The first of these determinants is reflected in the EU sections conducted within the cohesion policy [] and the REPowerEU [] program, resulting, among others, in increased expenditure on the development of energy infrastructure (see []). Referring to the differing specificity of energy consumption, households in rural areas will use it not only for living purposes, but also for production. Evidence of this fact can be found, for example, in Aden et al.’s [] report in relation to China, as well as in a study [] taking into account both selected countries of the world and individual states of the USA, indicating a higher level of energy consumption per capita with decreasing urbanization.
6. Policy Implications
The results of our research may prove useful for government decision-makers in the process of designing and managing the country’s transition to sustainable energy. In particular, it is recommended that decision-makers responsible for the development of the energy market coordinate and combine their efforts in designing and implementing innovations in this area in this market. It is recommended to establish advisory teams consisting of representatives of energy markets, governments, scientists and other stakeholders. These teams will be responsible for preparing a strategy for the development of the energy market, taking into account a significant share of renewable energy sources, together with proposing sources of their financing. The specific conditions of functioning of countries and regions should be taken into account.
Poland is a country where mainly fossil fuels such as hard coal and lignite are used for energy production. The coal industry in our country has been a pillar of the economy for decades, and many citizens, especially the older generation, find it difficult to imagine giving up, even partially, this source of energy. Some regions of Poland provided their residents with jobs in this sector of the economy, so for many of them and their families, the closure of some mines may result in a significant deterioration in living conditions. Therefore, political changes in this area should address the problem comprehensively, taking into account support for the coal sector. Renewable energy sources, especially wind farms and solar panels, have been present in the Polish landscape for almost thirty years. The first windmill and the first photovoltaic installation producing electricity were installed in Poland in 1991. Since then, there has been an annual increase in energy production from renewable sources. The results obtained by the authors of this article indicate the following implications for energy policy for Poland:
- Changing the proportions in energy production: reducing Poland’s dependence on fossil fuels and increasing the use of renewable energy sources will improve GDP;
- Support for regions with a predominance of the coal industry;
- Investments in energy projects to increase energy efficiency and reduce environmental pollution;
- Implementing technological innovations (e.g., [,,,,]) to improve energy efficiency;
- Promoting the development of renewable energy sources and strengthening international cooperation in this area.
7. Conclusions
Based on the conducted research, the following regularities were observed for Poland:
- All proposed independent variables measuring the level of production and consumption of energy from renewable sources were positively and significantly correlated with dependent variables characterizing economic development;
- If the modeling used variables characterizing capital, employment, technological progress and variables related to the production and consumption of energy from renewable sources, no models were obtained that would allow assessing the impact of renewable energy use on economic growth, as most of the coefficients in these models were insignificant or negative (lack of coincidence);
- If only variables related to renewable energy were used in the modeling, the following was observed:
- –
- The growth of GDP per capita was most influenced by primary production of energy (renewables and biofuels) (X5), final consumption of energy (primary solid biofuels) (X8), final consumption of energy (biogases) (X11), gross electricity production (biogases) (X17), and gross electricity production (renewable municipal waste) (X18);
- –
- The growth of net income in city agglomerations was most influenced by the share of energy from renewable sources (X4), gross heat production (renewables and biofuels) (X7), final consumption of energy (primary solid biofuels) (X8), final consumption of energy (solar thermal) (X10), gross electricity production (primary solid biofuels) (X16), and gross electricity production (renewable municipal waste) (X18);
- –
- The growth of net income in towns and suburbs was most influenced by gross electricity production (renewables and biofuels) (X6), primary production of energy (renewables and biofuels) (X7), final consumption of energy (primary solid biofuels) (X8), final consumption of energy (solar thermal) (X10), and gross electricity production (biogases) (X17);
- –
- The growth of net income in rural areas was influenced the most by primary production of energy (renewables and biofuels) (X5), final consumption of energy (primary solid biofuels) (X8), final consumption of energy (solar thermal) (X10), gross electricity production (primary solid biofuels) (X16), and gross electricity production (renewable municipal waste) (X18).
It follows from the above that among the variables characterizing the production and consumption of renewable energy, in which the division into individual renewable energy carriers was not taken into account, the greatest impact on the GDP per capita and mean equivalized net income in towns and suburbs and in rural areas in Poland in the years 2005–2022 was had by primary production of energy from renewable sources and biofuels (X5). On the other hand, the mean equivalized net income in city agglomerations was influenced most by the share of energy from renewable sources (X4). In the case of variables taking into account individual renewable energy carriers, it turned out that the most important carriers in the context of economic growth are in the case of the final energy consumption (solid biofuels (X8), solar energy (X10) and biogas (X11)) and in the case of electricity production (solid biofuels (X16), municipal waste and biogas (X18)).
The assessment of the direction and magnitude of the impact of the consumption and production of energy from renewable sources on Poland’s economic growth in 2005–2022 is very important in light of the extensive and numerous studies on this issue conducted in various regions of the world. The results obtained by the authors are consistent with this research trend, which shows that energy consumption (including renewable energy) affects economic growth. The authors showed that in Poland in the period under review, this was a positive impact; i.e., the increase in the consumption and production of energy from renewable sources (in total and taking into account individual energy carriers), both on a national scale and on the scale of separate regions (city agglomerations, towns and suburbs, rural areas), contributed to the increase in measures characterizing economic development.
It is worth mentioning that the economy is “a set of interconnected vessels”; therefore, the increase in the production and consumption of energy from various renewable energy carriers affects not only the structure of the energy market, but also the market related to the development and production of devices generating and storing energy, as well as related services. For example, in 2022 compared to 2021, the installed capacity in photovoltaics in Poland increased by 61% (from 7.7 GW to 12.4 GW) [,]. Therefore, education on and promotion of renewable energy sources are important, both at the national and local level, while at the same time encouraging and facilitating the use of energy from renewable sources in households and enterprises, hence the key role of politicians, whose decisions can affect not only the improvement of the quality of the natural environment, but also the stimulation of economic development.
The authors are aware that the theoretical considerations and research results presented in the work do not exhaust the entire problem. It is important to continue research in this area, especially since not all renewable energy carriers were included in this study due to the adopted study period.
8. Limitations and Future Research
A significant limitation in the research process resulted from the need to ensure comprehensive access to data and their comparability. In addition, the selection of variables used for the study may not have included those that could significantly affect economic growth in Poland in the analyzed period. Based on the review of the literature and the authors’ own research, it should be stated that the obtained research results in the discussed scope may differ depending on the methods used, the set of variables and the analyzed regions (e.g., [,]). Hence, the results of econometric models on the basis of which proposals regarding energy policy are formulated should be interpreted with caution, as they may not be reliable enough to clearly and categorically justify the selection of a specific development strategy or an acceptable or unacceptable political option. In turn, future research should concern comparisons of countries with similar geopolitical and historical conditions, e.g., the so-called post-communist countries or the “old” and “new” EU. Moreover, in future research, it would be worth attempting to re-estimate the economic growth models, taking into account the determinants and variables characterizing the production and consumption of energy from renewable sources, but for a shorter period, e.g., for the years 2015–2023 (2024), i.e., from the year of signing the Paris Agreement, because from that moment, the use of renewable energy sources increased, and perhaps then, the obtained results would be consistent with the economic theory in this respect.
Author Contributions
Conceptualization, I.B., E.B.-K., M.O., B.S., K.W. and P.S.; methodology, I.B., E.B.-K., M.O., B.S., K.W. and P.S.; software, I.B., E.B.-K., M.O., B.S., K.W. and P.S.; validation, I.B., E.B.-K., M.O., B.S., K.W. and P.S.; formal analysis, I.B., E.B.-K., M.O., B.S., K.W. and P.S.; investigation, I.B., E.B.-K., M.O., B.S., K.W. and P.S.; resources, I.B., E.B.-K., M.O., B.S., K.W. and P.S.; data curation, I.B., E.B.-K., M.O., B.S., K.W. and P.S.; writing—original draft preparation, I.B., E.B.-K., M.O., B.S., K.W. and P.S.; writing—review and editing, I.B., E.B.-K., M.O., B.S., K.W. and P.S.; visualization, I.B., E.B.-K., M.O., B.S., K.W. and P.S.; supervision, I.B.; project administration, I.B.; funding acquisition, I.B. All authors have read and agreed to the published version of the manuscript.
Funding
This research received no external funding.
Institutional Review Board Statement
Not applicable.
Informed Consent Statement
Not applicable.
Data Availability Statement
The data presented in this study are available on request from the corresponding author.
Conflicts of Interest
The authors declare no conflicts of interest.
Appendix A
Table A1.
Results of model estimation for stage 1 (average estimation errors are given in brackets).
Table A1.
Results of model estimation for stage 1 (average estimation errors are given in brackets).
| Independent Variables | Coefficients | Y1 | Y2 | Y3 | Y4 |
| Intercept | 2.025 (2.777) | −36.651 *** (7.159) | −30.371 *** (7.013) | −35.902 *** (6.263) | |
| X1 | −0.219 (0.143) | 0.569 (0.369) | 0.285 (0.362) | 0.542 (0.338) | |
| X2 | 0.162 (0.146) | 0.109 (0.377) | 0.289 (0.369) | 0.084 (0.346) | |
| X3 | 0.034 (0.060) | −0.054 (0.154) | −0.180 (0.151) | −0.020 (0.141) | |
| X4 | 0.435 (0.287) | 4.616 *** (0.739) | 3.839 *** (0.724) | 4.464 *** (0.677) | |
| X5 | 0.287 *** (0.075) | −0.228 (0.192) | 0.008 (0.188) | −0.152 (0.176) | |
| SE | 0.020 | 0.051 | 0.050 | 0.046 | |
| R2 | 0.993 | 0.979 | 0.985 | 0.985 | |
| RESET test | 3.046 | 1.563 | 2.602 | 0.983 | |
| p-value | 0.093 | 0.257 | 0.123 | 0.408 | |
| Breush–Pagan Test | 2.993 | 5.894 | 3.853 | 7.782 | |
| p-value | 0.701 | 0.317 | 0.571 | 0.169 |
* Significance: 10% level. ** Significance: 5% level. *** Significance: 1% level.
Table A2.
Coefficients for independent variables obtained from the model estimation in stage 3 (mean estimation errors are given in brackets).
Table A2.
Coefficients for independent variables obtained from the model estimation in stage 3 (mean estimation errors are given in brackets).
| Dependent Variables | Independent Variables | |||
|---|---|---|---|---|
| X1 | X2 | X3 | X4 | |
| Y1 | 0.017 (0.058) | 0.452 (0.289) | 0.330 *** (0.064) | −0.100 (0.096) |
| Y2 | −0.065 (0.143) | 4.628 *** (0.771) | −0.199 (0.159 | 0.649 ** (0.236) |
| Y3 | −0.210 (0.144) | 3.871 *** (0.712) | 0.085 (0.159) | 0.497 * (0.236) |
| Y4 | −0.029 (0.131) | 4.473 *** (0.651) | −0.130 (0.145) | 0.604 ** (0.216) |
| Dependent variables | Independent variables | |||
| X1 | X2 | X3 | X5 | |
| Y1 | 0.035 (0.056) | 0.511 (0.306) | 0.285 *** (0.039) | −0.015 (0.026) |
| Y2 | −0.147 (0.149) | 4.137 *** (0.808) | 0.043 (0.104) | 0.135 * (0.069) |
| Y3 | −0.215 * (0.116) | 3.289 *** (0.628) | 0.184 ** (0.081) | 0.175 *** (0.053) |
| Y4 | −0.144 (0.150) | 4.159 *** (0.811) | 0.155 (0.105) | 0.077 (0.069) |
| Dependent variables | Independent variables | |||
| X1 | X2 | X3 | X6 | |
| Y1 | 0.045 (0.062) | 0.468 (0.300) | 0.271 ** (0.078) | −0.005 (0.102) |
| Y2 | −0.082 (0.161) | 4.531 *** (0.775) | −0.186 (0.200) | 0.544 * (0.263) |
| Y3 | −0.194 (0.147) | 3.797 *** (0.711) | 0.029 (0.184) | 0.507 * (0.241) |
| Y4 | −0.047 (0.148) | 4.383 *** (0.715) | −0.113 (0.185) | 0.499 * (0.243) |
| Dependent variables | Independent variables | |||
| X1 | X2 | X3 | X7 | |
| Y1 | 0.019 (0.053) | 0.618 * (0.296) | 0.289 *** (0.027) | −0.022 (0.015) |
| Y2 | −0.087 (0.109) | 3.625 *** (0.613) | 0.077 (0.055) | 0.132 *** (0.031) |
| Y3 | −0.202 (0.102) | 2.971 *** (0.574) | 0.277 *** (0.052) | 0.120 *** (0.029) |
| Y4 | −0.078 (0.121) | 3.696 *** (0.682) | 0.149 ** (0.061) | 0.100 ** (0.034) |
| Dependent variables | Independent variables | |||
| X1 | X2 | X3 | X8 | |
| Y1 | 0.047 (0.051) | 0.525 * (0.295) | 0.243 *** (0.033) | 0.045 (0.044) |
| Y2 | −0.258 (0.150) | 4.325 *** (0.862) | 0.293 *** (0.096) | −0.159 (0.130) |
| Y3 | −0.358 ** (0.129) | 3.525 *** (0.744) | 0.508 *** (0.083) | −0.210 * (0.112) |
| Y4 | −0.207 (0.145) | 4.317 *** (0.834) | 0.275 *** (0.093) | −0.049 (0.125) |
| Dependent variables | Independent variables | |||
| X1 | X2 | X3 | X9 | |
| Y1 | 0.081 (0.057) | 0.434 (0.285) | 0.218 *** (0.045) | 0.069 (0.055) |
| Y2 | −0.322 * (0.176) | 4.595 *** (0.876) | 0.303 ** (0.139) | −0.134 (0.169) |
| Y3 | −0.358 ** (0.166) | 3.797 *** (0.827) | 0.400 *** (0.131) | −0.003 (0.159) |
| Y4 | −0.281 (0.160) | 4.454 *** (0.798) | 0.355 ** (0.126) | −0.149 (0.154) |
| Dependent variables | Independent variables | |||
| X1 | X2 | X3 | X10 | |
| Y1 | 0.027 (0.062) | 0.577 (0.348) | 0.280 *** (0.031) | −0.004 (0.007) |
| Y2 | −0.071 (0.162) | 3.529 *** (0.906) | 0.094 (0.082) | 0.037 * (0.018) |
| Y3 | −0.143 (0.135) | 2.644 *** (0.751) | 0.265 *** (0.068) | 0.043 ** (0.015) |
| Y4 | −0.090 (0.163) | 3.751 *** (0.907) | 0.177 ** (0.082) | 0.024 (0.018) |
| Dependent variables | Independent variables | |||
| X1 | X2 | X3 | X11 | |
| Y1 | 0.055 (0.057) | 0.470 (0.299) | 0.253 *** (0.048) | 0.020 (0.058) |
| Y2 | −0.251 (0.171) | 4.531 *** (0.893) | 0.200 (0.142) | 0.012 (0.172) |
| Y3 | −0.289 * (0.151) | 3.819 *** (0.785) | 0.274 ** (0.125) | 0.172 (0.152) |
| Y4 | −0.223 (0.158) | 4.375 *** (0.821) | 0.280 * (0.131) | −0.042 (0.158) |
| Dependent variables | Independent variables | |||
| X1 | X2 | X3 | X12 | |
| Y1 | 0.046 (0.057) | 0.465 (0.308) | 0.268 *** (0.036) | −0.0002 (0.0048) |
| Y2 | −0.202 (0.165) | 4.704 *** (0.891) | 0.141 (0.103) | 0.012 (0.014) |
| Y3 | −0.255 * (0.138) | 4.123 *** (0.741) | 0.270 *** (0.086) | 0.023 * (0.012) |
| Y4 | −0.178 (0.155) | 4.474 *** (0.836) | 0.213 ** (0.097) | 0.006 (0.013) |
| Dependent variables | Independent variables | |||
| X1 | X2 | X3 | X13 | |
| Y1 | 0.032 (0.055) | 0.547 * (0.307) | 0.281 *** (0.029) | −0.146 (0.174) |
| Y2 | −0.181 (0.155) | 4.134 *** (0.868) | 0.139 (0.081) | 0.726 (0.491) |
| Y3 | −0.250 * (0.126) | 3.239 *** (0.705) | 0.300 *** (0.065) | 1.022 ** (0.398) |
| Y4 | −0.169 (0.151) | 4.185 *** (0.846) | 0.215 ** (0.079) | 0.360 (0.478) |
| Dependent variables | Independent variables | |||
| X1 | X2 | X3 | X14 | |
| Y1 | 0.042 (0.057) | 0.490 (0.312) | 0.274 *** (0.037) | −0.003 (0.011) |
| Y2 | −0.202 (0.165) | 4.303 *** (0.904) | 0.135 (0.107) | 0.029 (0.033) |
| Y3 | −0.240 * (0.129) | 3.307 *** (0.710) | 0.239 ** (0.084) | 0.063 ** (0.026) |
| Y4 | −0.191 (0.156) | 4.317 *** (0.855) | 0.229 ** (0.101) | 0.008 (0.031) |
| Dependent variables | Independent variables | |||
| X1 | X2 | X3 | X15 | |
| Y1 | 0.047 (0.054) | 0.473 (0.317) | 0.266 *** (0.040) | 0.00004 (0.00088) |
| Y2 | −0.226 (0.155) | 4.815 *** (0.908) | 0.118 (0.114) | 0.003 (0.003) |
| Y3 | −0.295 ** (0.121) | 4.370 *** (0.708) | 0.215 ** (0.089) | 0.005 ** (0.002) |
| Y4 | −0.188 (0.146) | 4.553 *** (0.855) | 0.195 * (0.107) | 0.001 (0.002) |
| Dependent variables | Independent variables | |||
| X1 | X2 | X3 | X16 | |
| Y1 | 0.018 (0.047) | 0.642 ** (0.270) | 0.279 *** (0.021) | −0.024 ** (0.011) |
| Y2 | −0.158 (0.132) | 3.928 *** (0.751) | 0.167 ** (0.059) | 0.082 ** (0.030) |
| Y3 | −0.251 ** (0.109) | 3.151 *** (0.621) | 0.353 *** (0.049) | 0.088 *** (0.025) |
| Y4 | −0.149 (0.140) | 4.032 *** (0.799) | 0.225 *** (0.063) | 0.047 (0.032) |
| Dependent variables | Independent variables | |||
| X1 | X2 | X3 | X17 | |
| Y1 | 0.043 (0.058) | 0.485 (0.325) | 0.271 *** (0.038) | −0.003 (0.024) |
| Y2 | −0.195 (0.169) | 4.217 *** (0.939) | 0.132 (0.111) | 0.060 (0.069) |
| Y3 | −0.226 (0.134) | 3.127 *** (0.747) | 0.235 ** (0.088) | 0.128 ** (0.055) |
| Y4 | −0.191 (0.160) | 4.301 *** (0.888) | 0.230 ** (0.105) | 0.015 (0.065) |
| Dependent variables | Independent variables | |||
| X1 | X2 | X3 | X18 | |
| Y1 | 0.061 (0.037) | 0.402 * (0.208) | 0.235 *** (0.019) | 0.0015 *** (0.0004) |
| Y2 | −0.289 ** (0.130) | 4.684 *** (0.734) | 0.285 *** (0.065) | −0.0036 ** (0.0014) |
| Y3 | −0.384 *** (0.123) | 3.929 *** (0.695) | 0.464 *** (0.062) | −0.0031 ** (0.014) |
| Y4 | −0.224 (0.138) | 4.465 *** (0.777) | 0.291 *** (0.069) | −0.0020 (0.0015) |
* Significance: 10% level. ** Significance: 5% level. *** Significance: 1% level.
References
- Guliyev, H.; Yerdelen Tatoğlu, F. The Relationship between Renewable Energy and Economic Growth in European Countries: Evidence from Panel Data Model with Sharp and Smooth Changes. Renew. Energy Focus 2023, 46, 185–196. [Google Scholar] [CrossRef]
- Jenniches, S. Assessing the Regional Economic Impacts of Renewable Energy Sources—A Literature Review. Renew. Sustain. Energy Rev. 2018, 93, 35–51. [Google Scholar] [CrossRef]
- Bąk, I.; Spoz, A.; Zioło, M.; Dylewski, M. Dynamic Analysis of the Similarity of Objects in Research on the Use of Renewable Energy Resources in European Union Countries. Energies 2021, 14, 3952. [Google Scholar] [CrossRef]
- Bhuiyan, M.A.; Zhang, Q.; Khare, V.; Mikhaylov, A.; Pinter, G.; Huang, X. Renewable Energy Consumption and Economic Growth Nexus—A Systematic Literature Review. Front. Environ. Sci. 2022, 10, 878394. [Google Scholar] [CrossRef]
- Makieła, K.; Mazur, B.; Głowacki, J. The Impact of Renewable Energy Supply on Economic Growth and Productivity. Energies 2022, 15, 4808. [Google Scholar] [CrossRef]
- Bąk, I.; Cheba, K. (Eds.) Green Energy—A Review of the Definitions and the Main Directions of Development. In Green Energy: Meta-Analysis of the Research Results–Green Energy and Technology (Paperback) Zoom Green Energy: Meta-Analysis of the Research Results—Green Energy and Technology; Springer: Berlin/Heidelberg, Germany, 2023; pp. 1–16. [Google Scholar]
- Chen, C.; Pinar, M.; Stengos, T. Renewable Energy Consumption and Economic Growth Nexus: Evidence from a Threshold Model. Energy Policy 2020, 139, 111295. [Google Scholar] [CrossRef]
- Solangi, Y.A.; Longsheng, C.; Shah, S.A.A. Assessing and Overcoming the Renewable Energy Barriers for Sustainable Development in Pakistan: An Integrated AHP and Fuzzy TOPSIS Approach. Renew. Energy 2021, 173, 209–222. [Google Scholar] [CrossRef]
- Tutak, M.; Brodny, J. Renewable Energy Consumption in Economic Sectors in the EU-27. The Impact on Economics, Environment and Conventional Energy Sources. A 20-Year Perspective. J. Clean. Prod. 2022, 345, 131076. [Google Scholar] [CrossRef]
- Jia, H.; Fan, S.; Xia, M. The Impact of Renewable Energy Consumption on Economic Growth: Evidence from Countries along the Belt and Road. Sustainability 2023, 15, 8644. [Google Scholar] [CrossRef]
- Howell, B.; Birch, T. Is Renewable Energy Cheaper Than Fossil Fuels? Available online: https://www.theecoexperts.co.uk/blog/is-renewable-energy-cheaper-than-fossil-fuels (accessed on 15 March 2023).
- Eurostat. Share of Energy from Renewable Sources. Available online: https://ec.europa.eu/eurostat/databrowser/view/nrg_ind_ren/default/table?lang=en&category=nrg.nrg_quant.nrg_quanta.nrg_ind_share (accessed on 19 September 2024).
- EU. Directive 2009/28/EC of the European Parliament and of the Council of 23 April 2009 on the Promotion of the Use of Energy from Renewable Sources and Amending and Subsequently Re-Pealing Directives 2001/77/EC and 2003/30/EC; EU: Brussels, Belgium, 2009. [Google Scholar]
- Alper, A.; Oguz, O. The Role of Renewable Energy Consumption in Economic Growth: Evidence from Asymmetric Causality. Renew. Sustain. Energy Rev. 2016, 60, 953–959. [Google Scholar] [CrossRef]
- Gyimah, J.; Fiati, M.K.; Nwigwe, U.A.; Vanessa, A.E.; Yao, X. Exploring the Impact of Renewable Energy on Economic Growth and Carbon Emissions: Evidence from Partial Least Squares Structural Equation Modeling. PLoS ONE 2023, 18, e0295563. [Google Scholar] [CrossRef] [PubMed]
- Fang, Y. Economic Welfare Impacts from Renewable Energy Consumption: The China Experience. Renew. Sustain. Energy Rev. 2011, 15, 5120–5128. [Google Scholar] [CrossRef]
- Majeed, M.T.; Anwar, A.; Luni, T. The Impact of Renewable and Non-Renewable Energy Consumption on Economic Growth: A Global Perspective with Developed and Developing Economies. Pak. J. Commer. Soc. Sci. 2021, 15, 286–307. [Google Scholar]
- Haldar, A.; Sucharita, S.; Dash, D.P.; Sethi, N.; Chandra Padhan, P. The Effects of ICT, Electricity Consumption, Innovation and Renewable Power Generation on Economic Growth: An Income Level Analysis for the Emerging Economies. J. Clean. Prod. 2023, 384, 135607. [Google Scholar] [CrossRef]
- Stern, D.I. Energy and Economic Growth in the USA. Energy Econ. 1993, 15, 137–150. [Google Scholar] [CrossRef]
- Oh, W.; Lee, K. Causal Relationship between Energy Consumption and GDP Revisited: The Case of Korea 1970–1999. Energy Econ. 2004, 26, 51–59. [Google Scholar] [CrossRef]
- Chontanawat, J.; Hunt, L.C.; Pierse, R. Does Energy Consumption Cause Economic Growth?: Evidence from a Systematic Study of over 100 Countries. J. Policy Model. 2008, 30, 209–220. [Google Scholar] [CrossRef]
- Tang, C.F.; Tan, B.W.; Ozturk, I. Energy Consumption and Economic Growth in Vietnam. Renew. Sustain. Energy Rev. 2016, 54, 1506–1514. [Google Scholar] [CrossRef]
- Karanfil, F. Energy Consumption and Economic Growth Revisited: Does the Size of Unrecorded Economy Matter? Energy Policy 2008, 36, 3029–3035. [Google Scholar] [CrossRef]
- Ozturk, I. A Literature Survey on Energy–Growth Nexus. Energy Policy 2010, 38, 340–349. [Google Scholar] [CrossRef]
- Bhattacharya, M.; Paramati, S.R.; Ozturk, I.; Bhattacharya, S. The Effect of Renewable Energy Consumption on Economic Growth: Evidence from Top 38 Countries. Appl. Energy 2016, 162, 733–741. [Google Scholar] [CrossRef]
- Shahbaz, M.; Raghutla, C.; Chittedi, K.R.; Jiao, Z.; Vo, X.V. The Effect of Renewable Energy Consumption on Economic Growth: Evidence from the Renewable Energy Country Attractive Index. Energy 2020, 207, 118162. [Google Scholar] [CrossRef]
- Yu, C.; Moslehpour, M.; Tran, T.K.; Trung, L.M.; Ou, J.P.; Tien, N.H. Impact of Non-Renewable Energy and Natural Resources on Economic Recovery: Empirical Evidence from Selected Developing Economies. Resour. Policy 2023, 80, 103221. [Google Scholar] [CrossRef]
- Mohammadi, H.; Saghaian, S.; Zandi Dareh Gharibi, B. Renewable and Non-Renewable Energy Consumption and Its Impact on Economic Growth. Sustainability 2023, 15, 3822. [Google Scholar] [CrossRef]
- Sadorsky, P. Renewable Energy Consumption and Income in Emerging Economies. Energy Policy 2009, 37, 4021–4028. [Google Scholar] [CrossRef]
- Lee, C.-C.; Chang, C.-P. Energy Consumption and Economic Growth in Asian Economies: A More Comprehensive Analysis Using Panel Data. Resour. Energy Econ. 2008, 30, 50–65. [Google Scholar] [CrossRef]
- Apergis, N.; Payne, J.E. Energy Consumption and Growth in South America: Evidence from a Panel Error Correction Model. Energy Econ. 2010, 32, 1421–1426. [Google Scholar] [CrossRef]
- Menyah, K.; Wolde-Rufael, Y. Energy Consumption, Pollutant Emissions and Economic Growth in South Africa. Energy Econ. 2010, 32, 1374–1382. [Google Scholar] [CrossRef]
- Odhiambo, N.M. Energy Consumption, Prices and Economic Growth in Three SSA Countries: A Comparative Study. Energy Policy 2010, 38, 2463–2469. [Google Scholar] [CrossRef]
- Al-Mulali, U.; Binti Che Sab, C.N. The Impact of Energy Consumption and CO2 Emission on the Economic Growth and Financial Development in the Sub Saharan African Countries. Energy 2012, 39, 180–186. [Google Scholar] [CrossRef]
- Hieu, V.M.; Mai, N.H. Impact of Renewable Energy on Economic Growth? Novel Evidence from Developing Countries through MMQR Estimations. Environ. Sci. Pollut. Res. 2023, 30, 578–593. [Google Scholar] [CrossRef] [PubMed]
- AlNemer, H.A.; Hkiri, B.; Tissaoui, K. Dynamic Impact of Renewable and Non-Renewable Energy Consumption on CO2 Emission and Economic Growth in Saudi Arabia: Fresh Evidence from Wavelet Coherence Analysis. SSRN Electron. J. 2022. [Google Scholar] [CrossRef]
- Dogan, E.; Altinoz, B.; Madaleno, M.; Taskin, D. The Impact of Renewable Energy Consumption to Economic Growth: A Replication and Extension of Inglesi-Lotz (2016). Energy Econ. 2020, 90, 104866. [Google Scholar] [CrossRef]
- Inglesi-Lotz, R. The Impact of Renewable Energy Consumption to Economic Growth: A Panel Data Application. Energy Econ. 2016, 53, 58–63. [Google Scholar] [CrossRef]
- Menegaki, A.N. Growth and Renewable Energy in Europe: A Random Effect Model with Evidence for Neutrality Hypothesis. Energy Econ. 2011, 33, 257–263. [Google Scholar] [CrossRef]
- Ozcan, B.; Ozturk, I. Renewable Energy Consumption-Economic Growth Nexus in Emerging Countries: A Bootstrap Panel Causality Test. Renew. Sustain. Energy Rev. 2019, 104, 30–37. [Google Scholar] [CrossRef]
- Payne, J.E. On the Dynamics of Energy Consumption and Output in the US. Appl. Energy 2009, 86, 575–577. [Google Scholar] [CrossRef]
- Dogan, E.; Ozturk, I. The Influence of Renewable and Non-Renewable Energy Consumption and Real Income on CO2 Emissions in the USA: Evidence from Structural Break Tests. Environ. Sci. Pollut. Res. 2017, 24, 10846–10854. [Google Scholar] [CrossRef]
- Apergis, N.; Tang, C.F. Is the Energy-Led Growth Hypothesis Valid? New Evidence from a Sample of 85 Countries. Energy Econ. 2013, 38, 24–31. [Google Scholar] [CrossRef]
- Belke, A.; Dobnik, F.; Dreger, C. Energy Consumption and Economic Growth: New Insights into the Cointegration Relationship. Energy Econ. 2011, 33, 782–789. [Google Scholar] [CrossRef]
- Destek, M.A.; Sinha, A. Renewable, Non-Renewable Energy Consumption, Economic Growth, Trade Openness and Ecological Footprint: Evidence from Organisation for Economic Co-Operation and Development Countries. J. Clean. Prod. 2020, 242, 118537. [Google Scholar] [CrossRef]
- Yildirim, E.; Saraç, Ş.; Aslan, A. Energy Consumption and Economic Growth in the USA: Evidence from Renewable Energy. Renew. Sustain. Energy Rev. 2012, 16, 6770–6774. [Google Scholar] [CrossRef]
- Ocal, O.; Aslan, A. Renewable Energy Consumption–Economic Growth Nexus in Turkey. Renew. Sustain. Energy Rev. 2013, 28, 494–499. [Google Scholar] [CrossRef]
- Chen, S.-T.; Kuo, H.-I.; Chen, C.-C. The Relationship between GDP and Electricity Consumption in 10 Asian Countries. Energy Policy 2007, 35, 2611–2621. [Google Scholar] [CrossRef]
- IEA. Renewables 2023, Analysis and Forecast to 2028; IEA: Paris, France, 2024. [Google Scholar]
- Ali, A.; Radulescu, M.; Balsalobre-Lorente, D. A Dynamic Relationship between Renewable Energy Consumption, Nonrenewable Energy Consumption, Economic Growth, and Carbon Dioxide Emissions: Evidence from Asian Emerging Economies. Energy Environ. 2023, 34, 3529–3552. [Google Scholar] [CrossRef]
- Domac, J.; Richards, K.; Risovic, S. Socio-Economic Drivers in Implementing Bioenergy Projects. Biomass Bioenergy 2005, 28, 97–106. [Google Scholar] [CrossRef]
- Awerbuch, S.; Sauter, R. Exploiting the Oil–GDP Effect to Support Renewables Deployment. Energy Policy 2006, 34, 2805–2819. [Google Scholar] [CrossRef]
- Kasperowicz, R.; Bilan, Y.; Štreimikienė, D. The Renewable Energy and Economic Growth Nexus in European Countries. Sustain. Dev. 2020, 28, 1086–1093. [Google Scholar] [CrossRef]
- Fedajev, A.; Mitić, P.; Kojić, M.; Radulescu, M. Driving Industrial and Economic Growth in Central and Eastern Europe: The Role of Electricity Infrastructure and Renewable Energy. Util. Policy 2023, 85, 101683. [Google Scholar] [CrossRef]
- Simionescu, M.; Radulescu, M.; Belascu, L. The Impact of Renewable Energy Consumption and Energy Poverty on Pollution in Central and Eastern European Countries. Renew. Energy 2024, 236, 121397. [Google Scholar] [CrossRef]
- Marinaș, M.-C.; Dinu, M.; Socol, A.-G.; Socol, C. Renewable Energy Consumption and Economic Growth. Causality Relationship in Central and Eastern European Countries. PLoS ONE 2018, 13, e0202951. [Google Scholar] [CrossRef] [PubMed]
- Suproń, B.; Myszczyszyn, J. Impact of Renewable and Non-Renewable Energy Consumption and CO2 Emissions on Economic Growth in the Visegrad Countries. Energies 2023, 16, 7163. [Google Scholar] [CrossRef]
- Bozsik, N.; Szeberényi, A.; Bozsik, N. Examination of the Hungarian Electricity Industry Structure with Special Regard to Renewables. Energies 2023, 16, 3826. [Google Scholar] [CrossRef]
- Ślusarczyk, B.; Żegleń, P.; Kluczek, A.; Nizioł, A.; Górka, M. The Impact of Renewable Energy Sources on the Economic Growth of Poland and Sweden Considering COVID-19 Times. Energies 2022, 15, 332. [Google Scholar] [CrossRef]
- Meyer, N.; Magda, R.; Bozsik, N. The Role of Renewable Energies in the New EU Member States. J. East. Eur. Cent. Asian Res. (JEECAR) 2021, 8, 18–25. [Google Scholar] [CrossRef]
- Ignarska, M. Odnawialne Zródła Energii w Polsce. Poliarchia 2021, 1, 57–72. [Google Scholar] [CrossRef]
- Eurostat. Database. Available online: https://ec.europa.eu/eurostat/web/main/data/database (accessed on 18 September 2024).
- The World Bank. Economy. Available online: https://datatopics.worldbank.org/world-development-indicators/themes/economy.html (accessed on 18 September 2024).
- Eurostat. Calculation Methodologies for the Share of Renewables in Energy Consumption. Available online: https://ec.europa.eu/eurostat/statistics-explained/index.php?title=Calculation_methodologies_for_the_share_of_renewables_in_energy_consumption (accessed on 18 September 2024).
- Eurostat. National Accounts and GDP. Available online: https://ec.europa.eu/eurostat/statistics-explained/index.php?title=National_accounts_and_GDP (accessed on 19 September 2024).
- Eurostat. Real GDP per Capita. Available online: https://ec.europa.eu/eurostat/databrowser/product/page/SDG_08_10 (accessed on 19 September 2024).
- Eurostat. Glossary: Equivalised Income. Available online: https://ec.europa.eu/eurostat/statistics-explained/index.php?title=Glossary:Equivalised_income (accessed on 18 September 2024).
- Eurostat. Glossary: Gross Fixed Capital Formation (GFCF). Available online: https://ec.europa.eu/eurostat/statistics-explained/index.php?title=Glossary:Gross_fixed_capital_formation_(GFCF) (accessed on 16 November 2024).
- Eurostat. Glossary: Employment. Available online: https://ec.europa.eu/eurostat/statistics-explained/index.php?title=Glossary:Employment (accessed on 16 November 2024).
- Eurostat. Glossary: Gross Domestic Expenditure on R&D (GERD). Available online: https://ec.europa.eu/eurostat/statistics-explained/index.php?title=Glossary:Gross_domestic_expenditure_on_R_%26_D_(GERD) (accessed on 16 November 2024).
- Eurostat. Glossary: Primary Production of Energy. Available online: https://ec.europa.eu/eurostat/statistics-explained/index.php?title=Glossary:Primary_production_of_energy (accessed on 9 October 2024).
- Eurostat. Glossary: Gross Electricity Generation. Available online: https://ec.europa.eu/eurostat/statistics-explained/index.php?title=Glossary:Gross_electricity_generation (accessed on 19 September 2024).
- IEA; Eurostat; United Nations. Electricity and Heat Annual Questionnaire 2012 and Historical Revisions. Available online: https://ec.europa.eu/eurostat/documents/38154/42195/ELE_HEAT_instructions.pdf/cb797574-951d-470e-9d3f-9924b86ed3fd (accessed on 19 September 2024).
- Eurostat. Glossary: Final Energy Consumption. Available online: https://ec.europa.eu/eurostat/statistics-explained/index.php?title=Glossary:Final_energy_consumption (accessed on 19 September 2024).
- Tanizaki, H. Computational Methods in Statistics and Econometrics; Marcel Dekker: New York, NY, USA, 2004. [Google Scholar]
- Maddala, G.S. Introduction to Econometrics; Macmillan Publishing: New York, NY, USA, 1992. [Google Scholar]
- FasterCapital. Unlocking the Predictive Power: Regression Analysis in Business Forecasting. Available online: https://fastercapital.com/content/Unlocking-the-Predictive-Power--Regression-Analysis-in-Business-Forecasting.html (accessed on 18 September 2024).
- LinkedIn. What Are the Most Commonly Used Nonlinear Regression Models? Available online: https://www.linkedin.com/advice/0/what-most-commonly-used-nonlinear-regression-models-h9trf (accessed on 18 September 2024).
- Kaw, A.; Nguyen, D. Nonlinear Regression. In Numerical Methods with Applications; LibreTexts: Davis, CA, USA, 2024. [Google Scholar]
- Pooja; Mehta, V.; Kumar, S.; Kushwaha, R. Regression Models for Forecasting Pulses Area and Production in India. Int. J. Stat. Appl. Math. 2023, 8, 109–115. [Google Scholar]
- Kubesa, J.; Černý, I. A Study of the Influence of Economic Factors on World Silver Production. GeoSci. Eng. 2023, 69, 69–81. [Google Scholar] [CrossRef]
- Wooldridge, J.M. Introductory Econometrics. A Modern Approach, 5th ed.; Cengage Learning, South-Western: Boston, MA, USA, 2013. [Google Scholar]
- Kenny, D.A.; Little, T.D. Regression Analysis and Linear Models; Guilford Press: New York, NY, USA, 2017. [Google Scholar]
- Johnsson, T. A Procedure for Stepwise Regression Analysis. Stat. Pap. 1992, 33, 21–29. [Google Scholar] [CrossRef]
- Sanderson, S.P. A Complete Guide to Stepwise Regression in R. Available online: https://www.r-bloggers.com/2023/12/a-complete-guide-to-stepwise-regression-in-r/ (accessed on 18 September 2024).
- Anderson, D.R.; Sweene, D.J.; Williams, T.A. Statistics for Business and Economics; South-Western Cengage Learning: Mason, OH, USA, 2011. [Google Scholar]
- Li, R.; Leung, G.C.K. The Relationship between Energy Prices, Economic Growth and Renewable Energy Consumption: Evidence from Europe. Energy Rep. 2021, 7, 1712–1719. [Google Scholar] [CrossRef]
- IEA. Clean Energy Is Boosting Economic Growth. Available online: https://www.iea.org/commentaries/clean-energy-is-boosting-economic-growth (accessed on 27 September 2024).
- IRENA. Renewables Competitiveness Accelerates, Despite Cost Inflation. Available online: https://www.irena.org/News/pressreleases/2023/Aug/Renewables-Competitiveness-Accelerates-Despite-Cost-Inflation (accessed on 27 September 2024).
- gramwzielone.pl. GUS Policzył Udział OZE w Polskim Miksie Energetycznym w 2022. Available online: https://www.gramwzielone.pl/trendy/20174484/gus-policzyl-udzial-oze-w-polskim-miksie-energetycznym-w-2022 (accessed on 27 September 2024).
- Saad, W.; Taleb, A. The Causal Relationship between Renewable Energy Consumption and Economic Growth: Evidence from Europe. Clean. Technol. Environ. Policy 2018, 20, 127–136. [Google Scholar] [CrossRef]
- Sebri, M.; Ben-Salha, O. On the Causal Dynamics between Economic Growth, Renewable Energy Consumption, CO2 Emissions and Trade Openness: Fresh Evidence from BRICS Countries. Renew. Sustain. Energy Rev. 2014, 39, 14–23. [Google Scholar] [CrossRef]
- Shakouri, B.; Khoshnevis Yazdi, S. Causality between Renewable Energy, Energy Consumption, and Economic Growth. Energy Sources Part B Econ. Plan. Policy 2017, 12, 838–845. [Google Scholar] [CrossRef]
- Armeanu, D.; Vintilă, G.; Gherghina, Ş. Does Renewable Energy Drive Sustainable Economic Growth? Multivariate Panel Data Evidence for EU-28 Countries. Energies 2017, 10, 381. [Google Scholar] [CrossRef]
- Nie, Y.; Zhang, G.; Zhong, L.; Su, B.; Xi, X. Urban–rural Disparities in Household Energy and Electricity Consumption under the Influence of Electricity Price Reform Policies. Energy Policy 2024, 184, 113868. [Google Scholar] [CrossRef]
- Madlener, R.; Sunak, Y. Impacts of Urbanization on Urban Structures and Energy Demand: What Can We Learn for Urban Energy Planning and Urbanization Management? Sustain. Cities Soc. 2011, 1, 45–53. [Google Scholar] [CrossRef]
- Zhang, X.; Lovati, M.; Vigna, I.; Widén, J.; Han, M.; Gal, C.; Feng, T. A Review of Urban Energy Systems at Building Cluster Level Incorporating Renewable-Energy-Source (RES) Envelope Solutions. Appl. Energy 2018, 230, 1034–1056. [Google Scholar] [CrossRef]
- Interreg. Regional Trends for Growth: Focus on Rural Areas. Available online: https://www.interregeurope.eu/policy-learning-platform/news/regional-trends-for-growth-focus-on-rural-areas (accessed on 9 October 2024).
- EU. REPowerEU: Polityka Energetyczna w Krajowych Planach Odbudowy i Zwiększania Odporności. Available online: https://www.consilium.europa.eu/pl/policies/eu-recovery-plan/repowereu/ (accessed on 9 October 2024).
- Farmer.pl. MRiRW: Ok. 4,3 mld zł na Modernizację Wiejskiej Infrastruktury Energetycznej w Ramach REPowerEU. Available online: https://www.farmer.pl/energia/oze/mrirw-ok-4-3-mld-zl-na-modernizacje-wiejskiej-infrastruktury-energetycznej-w-ramach-repowereu,138688.html (accessed on 9 October 2024).
- Aden, N.T.; Zheng, N.; Fridley, D.G. How Can China Lighten Up? Urbanization, Industrialization and Energy Demand Scenarios; Lawrence Berkeley National Lab.: Berkeley, CA, USA, 2009. [Google Scholar] [CrossRef]
- Hickle, S. Do Urban Areas or Rural Areas Consume More Energy per Capita? Available online: https://www.linkedin.com/pulse/do-urban-areas-rural-consume-more-energy-per-capita-scott-hickle (accessed on 9 October 2024).
- Curto, D.; Franzitta, V.; Guercio, A.; Panno, D. Energy Retrofit. A Case Study—Santi Romano Dormitory on the Palermo University. Sustainability 2021, 13, 13524. [Google Scholar] [CrossRef]
- Milone, D.; Curto, D.; Franzitta, V.; Guercio, A.; Cirrincione, M.; Mohammadi, A. An Economic Approach to Size of a Renewable Energy Mix in Small Islands. Energies 2022, 15, 2005. [Google Scholar] [CrossRef]
- Han, M.; Lu, L.; Sun, B. Overall Energy Performance of Building-Integrated Bifacial Photovoltaic Sunshades with Different Installation and Building Parameters in Hot and Humid Regions. Sol. Energy 2024, 275, 112619. [Google Scholar] [CrossRef]
- Ji, Y.; Yu, M.; Wang, L.; Lu, L.; Zhou, J. A Novel Dual Condensers Heat Pipe Photovoltaic/Thermal (PV/T) System: Numerical Dynamic Modelling and Effect Factors Analysis in Dual-Function Operation Mode. Renew. Energy 2024, 229, 120754. [Google Scholar] [CrossRef]
- Gong, Q.; Chun Wong, H.; Chen, J.; Li, P.; Lu, L. Solar-Driven Adaptive Radiative Cooling Coating with Polymer Carbon Dots-Enhanced Photoluminescence for Urban Skin. Chem. Eng. J. 2024, 494, 153262. [Google Scholar] [CrossRef]
- Forum Energii. Transformacja Energetyczna w Polsce. Edycja 2024; Forum Energii: Warszawa, Poland, 2024. [Google Scholar]
- IEO. Rynek Fotowoltaiki w Polsce; IEO: Milan, Italy, 2023. [Google Scholar]
Disclaimer/Publisher’s Note: The statements, opinions and data contained in all publications are solely those of the individual author(s) and contributor(s) and not of MDPI and/or the editor(s). MDPI and/or the editor(s) disclaim responsibility for any injury to people or property resulting from any ideas, methods, instructions or products referred to in the content. |
© 2024 by the authors. Licensee MDPI, Basel, Switzerland. This article is an open access article distributed under the terms and conditions of the Creative Commons Attribution (CC BY) license (https://creativecommons.org/licenses/by/4.0/).