Abstract
The aim of this study is to compare crop evapotranspiration in the Konya Plain over a period of 10 years calculated by different crop evapotranspiration estimation methods using data collected from four meteorological stations. Accurate ET estimation is vital for sustainable water management in agriculture, especially in areas where there is a limited availability of water. This study highlights how the various estimation methods, particularly the radiation equation, support water-efficient agriculture when full weather data are available. To achieve this, it calculates the water requirements of five widely cultivated crops in the region: sugar beet, maize (grain), sunflower, dry bean, and wheat. The results show a significant difference between the FAO Penman–Monteith method and each of the other methods. It is also observed that the ETc values calculated according to the radiation equation are higher for most of the stations than the ETc values calculated using the other methods. At Akşehir, the ETc of dry bean obtained by using the radiation equation ranges from 501 mm to 679 mm; at Beyşehir, it ranges from 544 mm to 727 mm; at Cihanbeyli, from 679 mm to 738 mm; and at Ereğli, it ranges from 725 mm to 767 mm. The ASCE Penman–Monteith equation recorded the lowest ETc at all meteorological stations for the 10-year period. The radiation equation can be recommended for areas where there are not enough meteorological data to calculate the FAO Penman–Monteith equation, which is considered the standard approach for determining the water requirements of plants.
1. Introduction
Over the past century, the agricultural sector has witnessed enormous improvements in technology and practices, leading to a significant growth in production [1]. However, the competition for limited resources has intensified due to the steady growth of population [2]. This makes sustainable water management essential in meeting the growing demands for food without causing further damage to the environment [3]. Irrigation is crucial in agriculture, but it is also faced with the pressure of limited water availability.
Unpredictable weather conditions, on the other hand, continue to influence interventions whose purpose is to increase food production. Temperature, atmospheric pressure, humidity, precipitation, solar radiation, and wind speed impact the amount of water accessible to plants [4]. Therefore, the efficient and sustainable management of water resources requires the accurate estimation of plants’ water needs. The accurate estimation of plants’ water needs will optimize water usage, reduce water waste, and minimize environmental impacts on water resources [5]. A number of studies have explored this, leading to the development of various methods of estimating evapotranspiration using various weather data [6].
According to Hargreaves and Samani [7], all the methods used in estimating evapotranspiration (ET) are to some degree empirical and have been derived and/or calibrated from evapotranspiration determined using a lysimeter or soil moisture depletion in a reference crop. The FAO Penman–Monteith equation [4] is one of the most widely used methods for calculating evapotranspiration. The FAO Penman–Monteith method was derived from the original Penman–Monteith equation, surface resistance, and the aerodynamic equation [4]. The Hargreaves and Samani evapotranspiration equation is an alternative to the Penman–Monteith method; it requires only air temperature and solar radiation or extraterrestrial radiation, and it is also as accurate as the Penman–Monteith equation [8]. The radiation method is a modification of the Makkink [9] formula. This method is suggested for areas where climatic data such as measured air temperature and sunshine, cloudiness, or radiation are available, excluding measured wind and humidity [10]. The original Blaney–Criddle method [11] was modified by Doorenbos and Pruitt [10] to improve the definition of the effect of climate on crop water requirements while employing the Blaney–Criddle temperature- and day-length-related f factor.
The FAO Penman–Monteith method, according to a study conducted by Howell and Evett [12], has proven effective in estimating evapotranspiration if applied correctly with high-quality weather data. The performance of the method was tested in an extreme and challenging environment. In a similar work, the ASCE Penman–Monteith method was shown to be good for the computation of evapotranspiration of well-watered crops under strong regional advection [12]. Awal et al. [13] estimated ETo using the Hargreaves–Samani method, resulting in a systematic underestimation of ETo for West Texas under limited climate data when compared against the FAO Penman–Monteith method. A comparative analysis of 31 ETo methods under humid conditions by Tabari et al. [14] showed that the 5 best methods, as compared with the PMF-56 model, included the Blaney–Criddle method. According to Gao et al. [15], the 1957 radiation-based Makkink formula is also suitable for humid regions.
Several recent studies have compared ETc estimation methods [14,16,17,18,19,20,21,22,23]. Others have focused on tracking changes in ETc over time [24,25,26,27,28]. Extensive research exists on changes in reference crop evapotranspiration (ETo) [29,30,31,32,33,34] and ETc [35,36,37] in Turkey. However, a regional evaluation of differences in crop water requirements calculated using various estimation methods is necessary for the Konya Plain.
The aim of this study was to investigate the differences in crop water requirements in the Konya Plain over a 10-year period calculated by using different estimation methods. Plant water consumption in the selected meteorological stations was investigated and determined by using five methods of calculating plant water requirements: the ASCE Penman–Monteith method, FAO 56 Penman–Monteith method, the Hargreaves and Samani method, the radiation method, and the FAO 24 Blaney–Criddle method.
2. Materials and Methods
2.1. Materials
2.1.1. Research Area and Meteorological Stations
Konya is the largest province in Turkey, with an area of 41,000 km2, and is located in central Anatolia. The total arable land in the province is about 2.6 million ha, which corresponds to 65% of the total area of the province. The irrigated area is about 0.54 million ha, which corresponds to 30% of the total arable land of the province [38]. Konya has an arid to semi-arid climate. The annual rainfall is about 322.4 mm, and the mean temperature is 11.6 °C, with a minimum mean temperature of −4.6 °C in January and a maximum mean temperature of 30.1 in July and August.
Meteorological data for the period 2009–2018 were collected from four meteorological stations where periodic records that calculated ETo were available. The meteorological stations are Akşehir, Beyşehir, Cihanbeyli, and Ereğli in Konya province. The various characteristics and location of the meteorological stations are given in Table 1 and Figure 1 below.

Table 1.
Characteristics of meteorological stations.
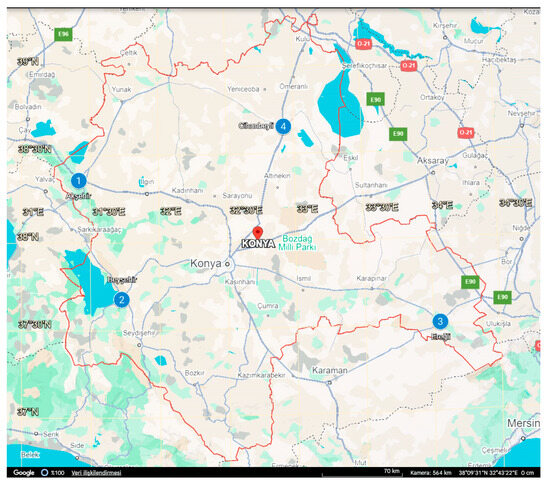
Figure 1.
Location of meteorological stations (Google Earth 10.69.0.1, 2023, Konya, [Online], Available at: https://www.google.com/maps/d/u/0/edit?mid=1r3i03zqZvfR2fblXbDH0VEmACcO8iuE&usp=sharing [accessed on 11 September 2024]).
2.1.2. Data Source, Instruments Calibration and Data Validation
All meteorological data were obtained from existing meteorological stations of Turkish State Meteorological Services (TSMS) as secondary data sources. The TSMS calibration center, accredited with ISO/IEC 17025 [39], calibrated all instruments in the stations. These stations provided the necessary climate data, which was carefully selected and validated for the study area and ETc estimation methods. The raw meteorological data was cleaned and prepared for the estimation using range checks, consistency checks, and imputation techniques.
2.2. Methods
The FAO Penman–Monteith method is derived from the original Penman–Monteith equation and incorporates principles of aerodynamics and surface resistance. This method uses standard climatological data of solar radiation (sunshine), air temperature, humidity, and wind speed [4]. The equation is given as
where ETo is the reference evapotranspiration (mm/day), Rn is the net radiation at the crop surface (MJ/m2/day), G is soil heat flux density (MJ/m2/day), T is the mean daily air temperature at 2 m height (°C), is the wind speed at 2 m height (m/s), es is the saturation vapor pressure (kPa), ea is the actual vapor pressure (kPa), is the slope of the saturated vapor pressure curve (kPa/°C), = psychrometric constant (kPa/°C).
Rn, es, , and were calculated according to procedures stated by Allen et al. [4]. The following formula was used in Rso (clear-sky solar radiation) calculation because calibrated values for as and bs were unavailable: , where z is the station elevation above sea level (m). In calculation of G, the formula , where is the main temperature of previous month (°C) and is the main temperature of next month (°C), was used.
Actual vapor pressure was calculated by using the following formula:
where e[0](Tmin) is the saturation vapor pressure at daily minimum temperature (kPa), e[0](Tmax) is the saturation vapor pressure at daily maximum temperature (kPa), RHmean is the mean relative humidity (%)
The ASCE Penman–Monteith equation is given as
where ETo is the reference evapotranspiration (mm/day), Rn is the net radiation (MJ/m2/day), G is the soil heat flux (MJ/m2/day), is the saturation vapor pressure (kPa), is the actual vapor pressure (kPa), is the mean air density at constant pressure (kg/m3), is the specific heat of the air (MJ/kg/°C), is the slope of the saturation vapor pressure–temperature relationship (kPa/°C), is a psychrometric constant (kPa/°C), rs is the (bulk) surface resistances (s/m), ra is the aerodynamic resistances (s/m), is the latent heat of vaporization (MJ/kg), ktime is the unit revolution (86,400 s/day).
The radiation method is suitable for areas where climatic data such as measured air temperature and sunshine, cloudiness, or radiation are available, excluding measured wind and humidity. Knowledge of general levels of humidity and wind is required, and these are to be estimated using published weather descriptions and extrapolation from nearby areas or from local sources [10]. The relationship is expressed as
where ETo is the reference crop evapotranspiration (mm/day), Rs is the solar radiation in equivalent evaporation (MJ/m2/day), W is the weighting factor depending on temperature and altitude, C is the adjustment factor depending on mean humidity and daytime wind conditions.
W was calculated according to the formula given by Doorenbos and Pruitt [10]:
where is the slope of the saturation vapor pressure–temperature relationship (kPa/°C), is the psychrometric constant (kPa/°C),
C was calculated according to formula suggested by Allen and Pruitt [40]:
where RHmean is the mean relative humidity (%), Ud is the mean wind speed at 2 m.
according to the Hargreaves–Samani method is estimated with the following equation [7]:
where ETo is the reference evapotranspiration (mm/day), Ra is the extraterrestrial radiation (MJ/m2/day/2.45), Tmin is the monthly minimum air temperature (°C), Tmax is the monthly maximum air temperature (°C), Tmean is the monthly mean air temperature (°C).
The FAO 24 Blaney–Criddle formula is as follows:
where ETo is the reference crop evapotranspiration (mm/day), T is the mean daily temperature (°C), P is the mean daily percentage of total annual daytime hours for given months and latitude.
The P values of the meteorology station were found by interpolation depending on its latitude [41]. The a and b are correction factors that adjust the ETo estimate based on measured or estimated mean daily minimum relative humidity in percent (RHmin), mean ratio of actual to possible sunshine hours (Nratio), and mean daytime wind speed in meters per second [42]. The a and b were calculated using the formulas given by Allen and Pruitt [42]:
where RHmin = minimum relative humidity (%), n = actual duration of sunshine (hour), N = maximum possible duration of sunshine or daylight hours (hour), Ud = mean wind speed (m/sn).
ETo values for the Blaney–Criddle method were calculated for the 7-year period between 2012 and 2018 because the RHmin records for previous years were unavailable for the meteorological stations.
Basic statistics of the minimum and maximum ETo, mean, standard deviation, and paired t-test were used to determine the differences in the mean of the ETo methods against the FAO 56 Penman–Monteith method. According to Ferro et al. [43], the paired sample t-test is a suitable statistical technique that is used to compare two population means in the case of two samples that are correlated. For the methods’ comparison, the null hypothesis assumes that the mean ETo values determined by the FAO 56 Penman–Monteith method and other methods are equal. IBM SPSS Statistical 22 software was used for the analysis.
The crop evapotranspiration was calculated by the following formula [4]:
ETc is the crop evapotranspiration (mm/day), Kc is the crop coefficient, ETo is the reference crop evapotranspiration (mm/day).
The crop evapotranspiration was calculated for five different crops commonly cultivated in the region: sugar beet, maize (Grain), sunflower, dry bean and wheat. The Kc coefficients and planting periods were taken from TAGEM and DSİ. The Kc coefficients and growth periods of the crops for the meteorological stations are given in Table 2.
Table 2.
Kc coefficients and planting periods of the crops for meteorological stations (TAGEM and DSİ [44]).
The Kc coefficients during the initial period and mid-season were considered fixed. Kc coefficients per month were determined graphically as stated by Allen et al. [4]. ETo values of the previous year’s fall months were considered in the ETc calculation for wheat.
3. Results
3.1. Reference Crop Evapotranspiration (ETo)
Daily ETo values were calculated for the meteorological stations according to the FAO 56 Penman–Monteith, ASCE Penman–Monteith, radiation, FAO 24 Blaney–Criddle and Hargreaves–Samani methods using data from meteorological stations between 2009 and 2018.
The daily ETo values calculated according to FAO 56 Penman–Monteith for Akşehir station were high in June, July, and August. The values in January and February were relatively low. January recorded the lowest ETo values, ranging from 0.55 mm to 0.93 mm/day. The maximum ETo value was recorded in July 2012 at 5.95 mm/day. The total ETo for the years is 35.06, 33.10, 32.08, 35.43, 36.62, 34.59, 33.1, 37.51, 33.94, and 32.30 mm/year from 2009 to 2018, respectively. The highest ETo value for most of the period was recorded in July 2012 at Beyşehir at 6.91 mm/day, and the minimum ETo value was 0.49 mm in January 2018. Annual ETo values varied between 33.85 mm and 39.67 mm. Cihanbeyli station followed a similar trend, with the highest ETo value of 7.70 mm/day in July 2012 and the lowest of 0.45 mm/day in January 2018. Annual ETo values ranged from 37.13 mm to 41.70 mm. Ereğli recorded its highest ETo value of 6.79 mm/day in July 2017 and its lowest of 0.47 mm/day in December 2011. The minimum total ETo for the period was 33.77 mm in 2011, and the maximum total ETo was 40.50 mm in 2009 (Figure 2).
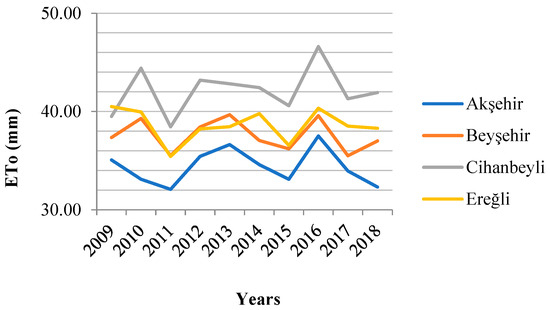
Figure 2.
Annual ETo using FAO 56 Penman–Monteith.
Using meteorological data from 2009 to 2018, daily ETo values were calculated using the ASCE Penman–Monteith method. For Akşehir station, the highest ETo value of 4.92 mm/day was recorded in July 2010, and the lowest ETo of 0.41 mm/day in January 2017. Beyşehir station recorded its highest ETo value of 5.15 mm/day in July 2012 and its lowest of 0.39 mm/day in January 2017. Cihanbeyli station’s highest ETo value was 5.35 mm/day in July 2012, and its lowest was 0.33 mm/day in January 2017. The highest ETo value at Ereğli was 5.23 mm/day in July 2010, and the lowest was 0.44 mm/day in January 2017 (Figure 3).
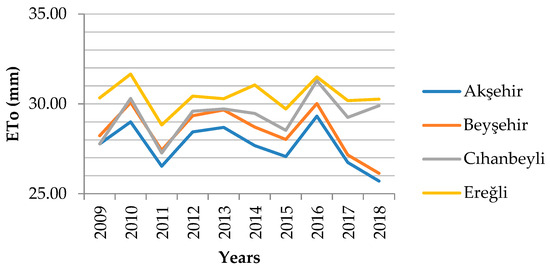
Figure 3.
Annual ETo using ASCE Penman–Monteith.
The daily ETo values were calculated using the radiation method based on data from meteorological stations from 2009 to 2018. At Akşehir station, the highest ETo value was recorded in July 2012, with 8.28 mm/day, while the lowest was 0.61 mm/day in January 2015. For Beyşehir station, the highest ETo value was also in July 2012, at 9.05 mm/day, with the lowest being 0.61 mm/day in January 2015. At Cihanbeyli station, the maximum ETo value was 8.95 mm/day in July 2012, and the minimum was 0.74 mm/day in January 2017 and December 2016. For Ereğli, the highest ETo value was recorded in July 2017, at 9.42 mm/day, and the lowest was 0.75 mm/day in December 2013 (Figure 4).
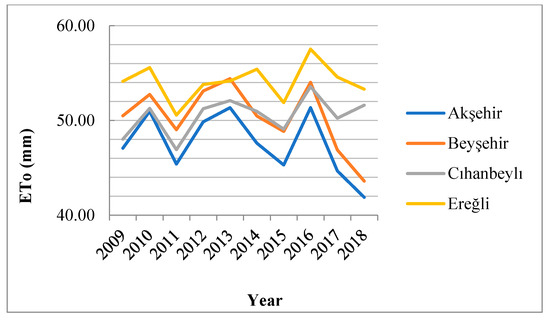
Figure 4.
Annual ETo using radiation.
The daily ETo values were calculated using the Hargreaves–Samani method with data from meteorological stations spanning 2009 to 2018. At Akşehir station, the highest ETo value of 6.38 mm/day was recorded in July 2010, while the lowest value of 0.64mm/day occurred in December 2016. Beyşehir station recorded its highest ETo value of 6.20 mm/day in July 2017 and its lowest of 0.63 mm/day in January 2017. Cihanbeyli station’s highest ETo value was 6.84 mm/day in July 2012, and its lowest was 0.60 mm/day in January 2017. Finally, Ereğli station had the highest ETo value of 6.73 mm/day in July 2017 and the lowest ETo of 0.67 mm/day in December 2013 (Figure 5).
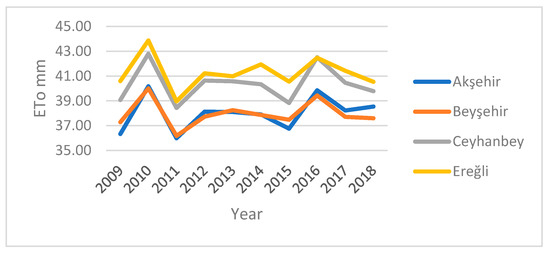
Figure 5.
Annual ETo mm using Hargreaves–Samani.
Daily ETo values were calculated using the FAO 24 Blaney–Criddle method for the period 2012–2018, based on meteorological data from the stations. Akşehir station recorded its highest ETo value of 8.02 mm/day in July and its lowest of −0.20 mm/day in January 2012. Beyşehir station’s highest ETo value was 8.38 mm/day in July 2012, and its lowest was −0.35 mm/day in January 2017. Cihanbeyli station had the highest ETo value of 8.84 mm/day in July 2012 and the lowest of −0.30 mm/day in January 2017. Finally, Ereğli station’s highest ETo value was 9.00 mm/day in July 2017, and its lowest was −0.23 mm/day in January 2013 (Figure 6).
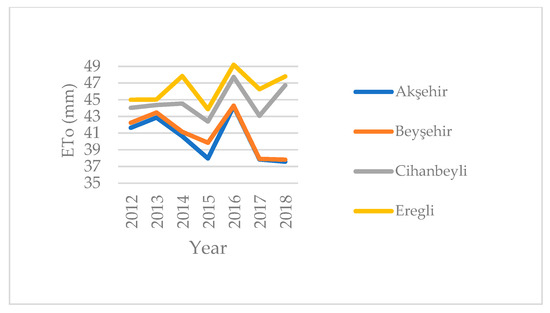
Figure 6.
Annual ETo using Blaney–Criddle.
The ETo values calculated with the radiation equation recorded the highest mean in most cases, while those calculated with the ASCE Penman–Monteith recorded the lowest mean values across most years and stations. The lowest mean ETo calculated with the ASCE Penman–Monteith equation was 1.79 mm/day in 2014 at Ereğli station. The highest mean was 4.79 mm/day in 2016 at Ereğli meteorological station using the radiation method. Figure 2, Figure 3, Figure 4, Figure 5 and Figure 6 illustrate the ETo results estimated using the radiation, FAO 56 Penman–Monteith, ASCE Penman–Monteith, and Blaney–Criddle methods for the four meteorological stations.
The different methods used to calculate the ETo for Akşehir, Beyşehir, Cihanbeyli, and Ereğli meteorological stations were compared to the FAO 56 Penman–Monteith method. The ETo mean values for all stations were calculated using the FAO 56 Penman–Monteith method to serve as a baseline for comparison. Cihanbeyli station generally recorded higher mean values, while Akşehir recorded the lowest mean value. Figure 7 shows the mean ETo for all meteorological stations from 2009 to 2018. Statistical testing was conducted to assess the differences between the ETo means derived from various methods and stations over the period 2009 to 2018. A paired t-test at the 95% confidence level was used, with the FAO 56 Penman–Monteith as a benchmark model. If p < 0.05, the hypothesis of the mean ETo calculated with the FAO 56 Penman–Monteith method not being different from other methods is rejected.
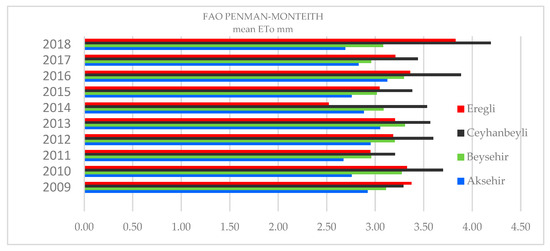
Figure 7.
Mean ETo mm for the meteorological stations from 2009 to 2018 using the FAO Penman–Monteith method.
The results show statistically significant differences among most ETo means from 2009 to 2018. At Akşehir meteorological station, several ETo evaluation methods showed significant differences compared with the FAO 56 Penman–Monteith method except for Blaney–Criddle with mean ETo values that were 0.33 to 0.52 mm/day higher than the means of the FAO 56 Penman–Monteith method in 2012, 2014, 2015, and 2017. The mean ETo values at Beyşehir station calculated with the Hargreaves–Samani and Blaney–Criddle methods in 2009 to 2018 were generally not statistically different from the ETo mean calculated with FAO 56 Penman–Monteith. The radiation method ETo in 2010 was 0.57 mm more than the FAO 56 Penman–Monteith ETo at Cihanbeyli and 0.033 mm less in 2014 at Ereğli. Figure 8 below shows differences in the ETo means of the Hargreaves–Samani and Blaney–Criddle methods compared to the FAO 56 Penman–Monteith method.
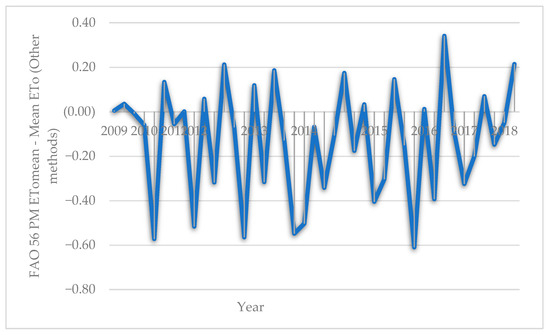
Figure 8.
Statistical differences in ETo means of various stations from FAO 56 PM.
3.2. Crop Evapotranspiration ETc
The total crop evapotranspiration of dry bean, maize, sugar beet, sunflower, and wheat was calculated for Akşehir, Beyşehir, Cihanbeyli, and Ereğli meteorological stations using FAO 56 Penman–Monteith, ASCE Penman–Monteith, radiation, and Hargreaves–Samani methods for each year over the 10-year period. The Blaney–Criddle method was used to calculate ETc for a 7-year period.
3.2.1. Dry Bean
The total crop evapotranspiration of dry bean was calculated for Akşehir, Beyşehir, Cihanbeyli, and Ereğli meteorological stations using the FAO 56 Penman–Monteith, ASCE Penman–Monteith, radiation, and Hargreaves–Samani methods for each year over a 10-year period and the Blaney–Criddle method over a 7-year period. The results are presented in Table 3.
Table 3.
Annual ETc values and precipitation during the growth period (Re) of dry bean at different meteorological stations (mm).
At Akşehir meteorological station, the radiation method recorded the highest ETc value of 500.8 mm to 678.5 mm. The ASCE Penman–Monteith method produced the lowest ETc value over the period. Both the Blaney–Criddle and Hargreaves–Samani methods yielded higher ETc values for dry bean than the FAO 56 Penman–Monteith method. The FAO 56 Penman–Monteith method recorded ETc values ranging from 405.8 mm to 477 mm for dry bean. The results shows that water requirement of dry bean was high in 2010 and low in 2018. However, when the Hargreaves–Samani method was used, the water requirement for dry bean was higher in 2018 than in subsequent years.
For Beyşehir meteorological station, the radiation method recorded the highest ETc for dry bean, ranging from a minimum of 543.5 mm and a maximum of 726.9 mm. The ASCE Penman–Monteith method recorded the lowest ETc value for dry bean over the periods considered. The Hargreaves–Samani method also yielded ETc values for dry bean closer to the FAO 56 Penman–Monteith ETc values in most years. For Cihanbeyli meteorological station, the radiation method recorded the highest ETc for dry bean, ranging from 678.8 mm to 737.5 mm.
The ASCE Penman–Monteith method recorded the lowest ETc value for dry bean over the periods considered. The ETc values for dry bean were lower in 2009 for all methods at Cihanbeyli. For Ereğli meteorological station, the radiation method recorded the highest ETc for dry bean in most years between 2009 and 2018. The ASCE Penman–Monteith method recorded the lowest ETc value for dry bean over the periods considered. ETc values dropped for most of the methods, but the Hargreaves–Samani results remained stable, with little changes over the years (Figure 9).
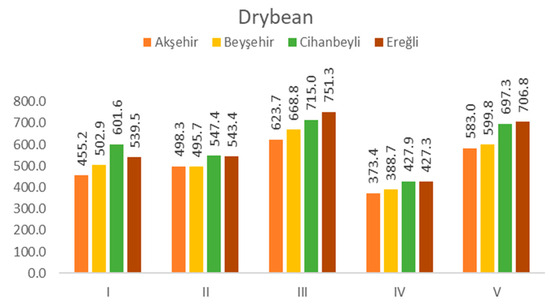
Figure 9.
Annual mean ETc values for dry bean calculated by different methods. I. FAO 56 Penman–Monteith, II. Hargreaves–Samani, III. radiation equation, IV. ASCE Penman–Monteith, V. Blaney–Criddle.
3.2.2. Maize
The total crop evapotranspiration of maize was calculated for Akşehir, Beyşehir, Cihanbeyli and Ereğli meteorological stations using FAO 56 Penman–Monteith, ASCE Penman–Monteith, radiation, and Hargreaves–Samani methods for each year over the 10-year period, and the Blaney–Criddle method for a 7-year period. The results are summarized in Table 4.
Table 4.
Annual ETc values and precipitation during the growth period (Re) of maize at different meteorological stations (mm).
At Akşehir meteorological station, the radiation method recorded the highest ETc for maize, ranging from 761.9 mm to 985.8 mm. The ASCE Penman–Monteith method recorded the lowest ETc value for maize over the period. The Blaney–Criddle and Hargreaves–Samani methods yielded ETc values for maize higher than the FAO 56 Penman–Monteith method. The FAO 56 Penman–Monteith method recorded ETc ranging from 603.9 mm to 696.3 mm for maize for the 10-year period.
For Beyşehir meteorological station, the radiation method recorded the highest ETc for maize, ranging from 821.2 mm to 1081.8 mm. The ASCE Penman–Monteith method recorded the least ETc value for dry bean over the periods considered. The Hargreaves–Samani method also yielded ETc values for maize were closer to FAO 56 Penman–Monteith ETc values in most years. For Cihanbeyli meteorological station, the radiation method recorded the highest ETc for maize, ranging from 911.2 mm to996.4 mm. The ASCE Penman–Monteith method recorded the lowest ETc value for maize over the periods considered.
The FAO 56 Penman–Monteith recorded a range of 752.6 mm to 864.8 mm for the ETc values of maize in the years 2009 to 2018 for Cihanbeyli meteorological station. At Ereğli meteorological station, the radiation method recorded the highest ETc for dry bean in most years between 2009 and 2018. The ASCE Penman–Montieth method recorded the lowest ETc value for dry bean over the periods considered. ETc values fell for most of the methods except Hargreaves–Samani, the results of which remained stable with little changes over the years (Figure 10).
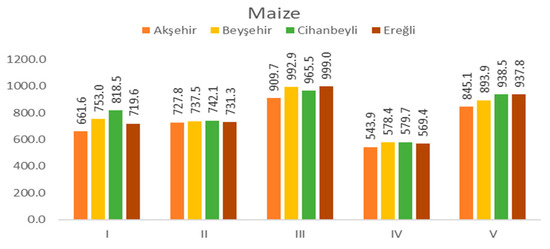
Figure 10.
Annual mean ETc values for maize calculated by different methods. I. FAO 56 Penman–Monteith, II. Hargreaves–Samani, III. radiation equation, IV. ASCE Penman–Monteith, V. Blaney–Criddle.
3.2.3. Sugar Beet
The total crop evapotranspiration of sugar beet was calculated for Akşehir, Beyşehir, Cihanbeyli, and Ereğli meteorological stations using the FAO 56 Penman–Monteith, ASCE Penman–Monteith, radiation, and Hargreaves–Samani methods for each year over the 10-year period, as well as the Blaney–Criddle method over a 7-year period. The results are presented in Table 5.
Table 5.
Annual ETc values and precipitation during the growth period (Re) of sugar beet at different meteorological stations (mm).
At Akşehir meteorological station, the radiation method recorded the highest ETc for sugar beet, ranging from 844.3 mm to 1086.6 mm. The ASCE Penman–Monteith method recorded the lowst ETc value for sugar beet over the period. The Blaney–Criddle and Hargreaves–Samani methods yielded ETc values for sugar beet higher than the FAO 56 Penman–Monteith method. The ETc range of the FAO 56 Penman–Monteith method recorded was from 665.9 mm to 778.3 mm for sugar beet from 2009 to 2018.
At Beyşehir meteorological station, the radiation method recorded the highest ETc for sugar beet, ranging from 935.2 mm to 1199.2 mm. The ASCE Penman–Monteith method recorded the lowest ETc value for sugar beet over the periods considered. The Hargreaves–Samani method also yielded ETc values for sugar beet that were closer to FAO 56 Penman–Monteith ETc values in most years at Beyşehir.
At Cihanbeyli meteorological station, the radiation method recorded the highest ETc for sugar beet, ranging from 1119.3 mm to 1211 mm. The ASCE Penman–Monteith method recorded the lowest ETc value for sugar beet over the periods considered. For Ereğli meteorological station, the radiation method recorded the highest ETc for sugar beet in most years between 2009 and 2018. The ASCE Penman–Monteith method recorded the least ETc value for sugar beet over the periods considered (Figure 11).

Figure 11.
Annual mean ETc values for sugar beet calculated by different methods. I. FAO 56 Penman–Monteith, II. Hargreaves–Samani, III. radiation equation, IV. ASCE Penman–Monteith, V. Blaney–Criddle.
3.2.4. Sunflower
The total crop evapotranspiration of sunflower was calculated for Akşehir, Beyşehir, Cihanbeyli, and Ereğli meteorological stations using the FAO 56 Penman–Monteith, ASCE Penman–Monteith, radiation, and Hargreaves–Samani methods for each year over the 10-year period. The Blaney–Criddle method was used for a 7-year period. The results are presented in Table 6.
Table 6.
Annual ETc values and precipitation during the growth period (Re) of sunflower at different meteorological stations (mm).
The radiation method recorded the highest ETc for sunflower, ranging from 631.3 mm to 815.3 mm at Akşehir meteorological station. The ASCE Penman–Montieth method also recorded the lowest ETc value for sunflower over the periods considered. The Blaney–Criddle and Hargreaves–Samani methods also yielded ETc values for sunflower higher than the FAO 56 Penman–Monteith method. The FAO 56 Penman–Monteith method recorded ETc values ranging from 499 mm to 585.3 mm for sunflower for the 10-year period.
At Beyşehir meteorological station, the radiation method recorded the highest ETc for sunflower, ranging from 663.3 mm to 880.4 mm. The ASCE Penman–Montieth method recorded the lowest ETc value for sunflower over the periods considered. The Hargreaves–Samani method also produced ETc values that were closer to FAO 56 Penman–Monteith ETc values in most years at Beyşehir. For Cihanbeyli meteorological station, the radiation method recorded the highest ETc for sunflower, ranging from 808.6 mm to 892.6 mm.
The ASCE Penman–Monteith method recorded the lowest ETc value for sunflower over the periods considered. The Hargreaves–Samani equation recorded closer ETc values for sunflower for most years. For Ereğli meteorological station, the radiation method recorded the highest ETc for sunflower in most years between 2009 and 2018. The ASCE Penman–Monteith method recorded the lowest ETc value for sunflower over the periods considered (Figure 12).
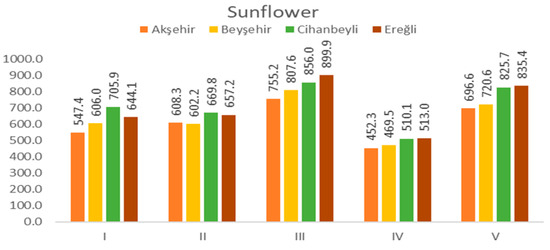
Figure 12.
Annual mean ETc values for sunflower calculated by different methods. I. FAO 56 Penman–Monteith, II. Hargreaves–Samani, III. radiation equation, IV. ASCE Penman–Monteith, V. Blaney–Criddle.
3.2.5. Wheat
The total crop evapotranspiration of wheat was calculated for Akşehir, Beyşehir, Cihanbeyli, and Ereğli meteorological stations using the FAO 56 Penman–Monteith, ASCE Penman–Monteith, radiation, and Hargreaves–Samani methods for each year over the 10-year period and over a 7-year period using Blaney–Criddle method as shown in Table 7.
Table 7.
Annual ETc values and precipitation during the growth period (Re) of wheat at different meteorological stations.
At Akşehir, the lowest ETc recorded for wheat using the radiation method was 660.9 mm, and the highest was 844.9 mm, while the ASCE Penman–Monteith method consistently recorded the lowest ETc values. The Blaney–Criddle and Hargreaves–Samani methods also yielded ETc values for wheat higher than the FAO 56 Penman–Monteith method. The FAO 56 Penman–Monteith method recorded ETc ranging from 456.7 mm to 608.8 mm for wheat for the period considered.
At Beyşehir meteorological station, the radiation method recorded the highest ETc for wheat, from 710.7 mm to 848.9 mm, with the ASCE Penman–Monteith method recording the lowest ETc value over the periods considered.
At Cihanbeyli, the radiation method recorded the highest ETc values for wheat, ranging from 536.6 mm to 677.8 mm, while the ASCE Penman–Monteith method recorded the lowest values. The ETc values for wheat calculated using the Blaney–Criddle method were generally closer to the FAO 56 Penman–Monteith values in most years.
For Ereğli, the radiation method recorded the highest ETc for wheat in most years between 2009 and 2018. For Ereğli meteorological station, the radiation method recorded the highest ETc for wheat in most years between 2009 and 2018, while the ASCE Penman–Monteith method recorded the lowest ETc values over the periods considered (Figure 13).
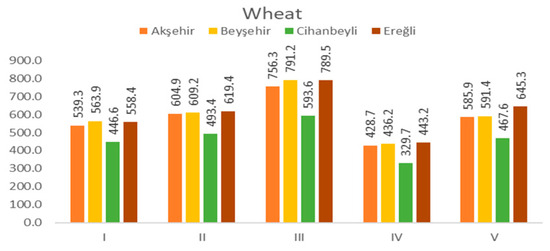
Figure 13.
Annual mean ETc values for wheat calculated by different methods. I. FAO 56 Penman–Monteith, II. Hargreaves–Samani, III. radiation equation, IV. ASCE Penman–Monteith, V. Blaney–Criddle.
4. Discussion
To be able to design a good irrigation schedule for a particular area of land, the water needs of the plant are one of the major factors to consider. Estimating water needs also depends largely on changes in climate parameters such as temperature, wind speed, humidity, and solar radiation. These parameters are not constant; they vary according to days, months, and years, requiring continuous evaluation to determine the effect of their variations on estimations of the water needs of plants to find a suitable approach for a specific crop and area. This study was mainly aimed at determining the effect of changes in climate parameters on the water needs of plants in Konya province that is Akşehir, Beyşehir, Cihanbeyli, and Ereğli meteorological stations from 2009 to 2018. The FAO 56 Penman–Monteith, ASCE Penman–Monteith, radiation, Hargreaves–Samani, and Blaney–Criddle methods were used to estimate the water need of dry bean, maize, sugar beet, sunflower, and wheat.
Data obtained from the meteorological stations show annual variations for all years resulting in changes in the ETo values for each station and year. The results of the radiation equation recorded the highest ETo at Akşehir, Beyşehir, Cihanbeyli, and Ereğli meteorological stations in all the years. Periodic data of sunlight or sunshine for all the stations were available, and as a result, higher levels of ETo values were obtained with the radiation formula. Variation in the parameters explains the unsteadiness of ETo in all the stations such that higher ETo values were estimated in months with long hours of sunshine corresponding to the study of Bayramoğlu [31] which concluded that ETo values increase in relation to the increase in climate parameters such as temperature and others with the period of evaluation. Therefore, according to the results, there were more monthly hours of sunshine at Ereğli meteorological station than most of the stations within the 10-year period.
Akşehir station recorded the lowest ETo values in most of the years, whereas Cihanbeyli recorded maximum ETo for most years when the FAO 56 Penman–Monteith equation was used for the estimation. It was observed that changes in most input parameters over the years had an effect on the model. The FAO 56 Penman–Monteith equation uses standard climate data [4] which were available in all the stations. According to the results, the year 2016 shows a higher change in ETo values from 2015, suggesting that there was an increase or decrease in the parameters. Lum et al. [45] estimated reference evapotranspiration from climatic data, and according to their observation, the variations in some input parameters influenced the performances of the models.
The ETo results estimated with the ASCE Penman–Monteith equation were the least at all stations. At Akşehir, the annual minimum ETo within the period 2012 and 2018 was 25.71 mm, and the annual maximum ETo was 29.32 mm; at Beyşehir, the minimum was 26.14 mm, and the maximum value was 30.30 mm; at Cihanbeyli, the minimum ETo was 27.27 mm, and the maximum was 31.50 mm, and at Ereğli, the minimum was 28.83 mm, and the maximum was 31.66 mm.
The parameters considered in the Hargreaves–Samani equation are minimum relative humidity, wind speed, and sunshine, and data were available for the 10-year period at all stations. The Hargreaves–Samani method recorded higher ETo values than ASCE Penman–Monteith and the FAO 56 Penman–Monteith at most of the meteorological stations. The FAO 24 Blaney–Criddle method results were computed from 2012 to 2018 because meteorological data for all the stations were not available. With the FAO 24 Blaney–Criddle method, a minimum ETo value of −0.35 mm was estimated at Beyşehir in January 2017, and maximum ETo value of 9 mm at Ereğli in July 2017.
Another consideration for this study was to measure whether there were significant differences between the methods at each meteorological station. Descriptive statistics of ETo calculated with the FAO 56 Penman–Monteith, ASCE Penman–Monteith, radiation, Hargreaves–Samani, and Blaney–Criddle methods were computed with SPSS Statistical software. The differences between the ETo means of the various methods and stations from 2009 to 2018 were tested statistically using a paired t-test at a 95% confidence interval with the FAO 56 Penman–Monteith as a benchmark model according to Allen et al. [4], and the results show statistically significant differences between most of the ETo means from 2009 to 2018.
The crop characteristics measured by the Kc coefficient were determined graphically as stated by Allen et al. [4] for dry bean, maize, sunflower, sugar beet, and wheat at Akşehir, Beyşehir, Cihanbeyli, and Ereğli. The Kcini, Kcmid, and Kcend were represented in the crop coefficient curves. The planting and harvesting periods for dry bean, maize, sugar beet, sunflower, and wheat were 4 months, 6 months, 7 months, 6 months, and 9 months respectively.
The ETc values of dry bean, maize, sunflower, sugar beet, and wheat were calculated using the respective Kc coefficients and ETo using the function ETc = Kc × ETo for the four meteorological stations considered. The ETc results show a linear relationship with ETo that is the higher the ETo, the higher the ETc in most cases, similar to Farias et al.’s [46] conclusion on the relationship between ETc and ETo. Since the changes in the parameters used in estimating ETo have been observed to have an effect on ETo, it can be deduced that changes in the climatic parameters can influence ETc.
The water requirement of dry bean calculated using the FAO Penman–Monteith method at Akşehir ranges from 406 mm to 477 mm; at Beyşehir, it ranges from 451 mm to 542 mm; at Cihanbeyli, 554 mm to 638 mm; and lastly, at Ereğli, it ranges from 513 mm to 554 mm. The water requirement of dry bean calculated using the radiation equation at Akşehir ranges from 501 mm to 679 mm; at Beyşehir, it ranges from 544 mm to 727 mm/month; at Cihanbeyli, 679 mm to 738 mm; and Ereğli, it ranges from 725 mm to 767 mm.
It was also observed that the ETc calculated according to the radiation equation was higher than that calculated according to the other equations at most of the stations. The ASCE Penman–Monteith equation recorded the lowest ETc in all the meteorological stations for the 10-year period. The Blaney–Criddle formula, which depends largely on the minimum and maximum relative humidity, yielded higher ETc values than the FAO 56 Penman–Monteith, Hargreaves–Samani, and FAO Blaney–Criddle methods in most of the locations.
5. Conclusions
This study was conducted to compare the performance of five different crop evapotranspiration (ETc) methods in Konya, a semi-arid region in Turkey, using the FAO 56 Penman–Monteith, ASCE Penman–Monteith, radiation, Hargreaves–Samani, and FAO 24 Blaney–Criddle methods. The ETc values of commonly cultivated crops—sugar beet, maize (grain), sunflower, dry bean, and wheat—were determined. Despite the need for a comprehensive dataset for the estimation of ETc using the FAO 56 Penman–Monteith method, this method produces consistent values of ETc, making it a suitable choice in the region. The radiation equation produced high values of ETc but requires further validation and calibrations to ensure accuracy in this specific climate. The Hargreaves–Samani equation and the FAO 56 Penman–Monteith method were close in most cases, inferring that both methods can be used in similar climate conditions. The FAO Blaney–Criddle method can also be recommended for areas where data on minimum relative humidity are readily available.
Selecting an ETc estimation method depends largely on the specific climatic conditions, data availability, and desired level of accuracy. For the Konya Plain, the FAO 56 Penman–Monteith method has proven to be the most robust and reliable option. However, further research is needed to improve the application of these methods in the region.
Author Contributions
Conceptualization, P.A.A. and S.S.; methodology, S.S.; software, P.A.A.; validation, S.S.; formal analysis, P.A.A.; investigation, P.A.A.; resources, S.S.; data curation, S.S.; writing—original draft preparation, S.S. and P.A.A.; writing—review and editing, S.S. and P.A.A.; visualization, P.A.A.; supervision, S.S.; project administration, S.S. All authors have read and agreed to the published version of the manuscript.
Funding
This research received no external funding.
Informed Consent Statement
Not applicable.
Data Availability Statement
The data presented in this study are available on request from the corresponding author.
Acknowledgments
This paper is extracted from the MSc thesis of the first named author who was supported by the Türkiye Scholarships which is a government-funded higher education scholarship program run by the Republic of Türkiye for international students. We thank the Türkiye Scholarships program for supporting the MSc education of the first author.
Conflicts of Interest
The authors declare no conflicts of interest.
References
- Manida, M. The Future of Food and Agriculture—Trends and Challenges; Agriculture & Food E-Newsletter 2022. Available online: https://www.researchgate.net/publication/358402720_The_Future_of_Food_and_Agriculture_Trends_and_Challenges (accessed on 11 September 2024).
- Alexandratos, N.; Bruinsma, J. World Agriculture towards 2030/2050: The 2012 Revision. In ESA Working Paper; FAO: Rome, Italy, 2012. [Google Scholar]
- Rockström, J.; Williams, J.; Daily, G.; Noble, A.; Matthews, N.; Gordon, L.; Wetterstrand, H.; DeClerck, F.; Shah, M.; Steduto, P.; et al. Sustainable Intensification of Agriculture for Human Prosperity and Global Sustainability. Ambio 2017, 46, 4–17. [Google Scholar] [CrossRef]
- Allen, R.G.; Pereira, L.S.; Raes, D.; Smith, M. Crop Evapotranspiration-Guidelines for Computing Crop Water Requirements. FAO Irrig. Drain. Pap. 1998, 56, 60–64. [Google Scholar]
- Fereres, E.; Soriano, M.A. Deficit Irrigation for Reducing Agricultural Water Use. J. Exp. Bot. 2007, 58, 147–159. [Google Scholar] [CrossRef]
- Xiang, K.; Li, Y.; Horton, R.; Feng, H. Similarity and Difference of Potential Evapotranspiration and Reference Crop Evapotranspiration–a Review. Agric. Water Manag. 2020, 232, 106043. [Google Scholar] [CrossRef]
- Hargreaves, G.H.; Samani, Z.A. Reference Crop Evapotranspiration from Temperature. Appl. Eng. Agric. 1985, 1, 96–99. [Google Scholar] [CrossRef]
- Watanabe, K.; Yamamoto, T.; Yamada, T.; Sakuratani, T.; Nawata, E.; Noichana, C.; Sributta, A.; Higuchi, H. Changes in Seasonal Evapotranspiration, Soil Water Content, and Crop Coefficients in Sugarcane, Cassava, and Maize Fields in Northeast Thailand. Agric. Water Manag. 2004, 67, 133–143. [Google Scholar] [CrossRef]
- Makkink, G.F. Testing the Penman Formula by Means of Lysimeters. J. Inst. Water Eng. 1957, 11, 277–288. [Google Scholar]
- Doorenbos, J.; Pruitt, W. Crop Water Requirements. In Land and Water Development Division; FAO: Rome, Italy, 1977. [Google Scholar]
- Blaney, H.F.; Criddle, W.D. Determining Consumptive Use and Irrigation Water Requirements; United State Department of Agriculture Technical Bullettin, 1275: Washington, DC, USA, 1962. [Google Scholar]
- Howell, T.A.; Evett, S.R. The Penman-Monteith Method; USDA-Agricultural Research Service, Conservation & Production Research Laboratory: Washington, DC, USA, 2004; Volume 14. [Google Scholar]
- Awal, R.; Habibi, H.; Fares, A.; Deb, S. Estimating Reference Crop Evapotranspiration under Limited Climate Data in West Texas. J. Hydrol. Reg. Stud. 2020, 28, 100677. [Google Scholar] [CrossRef]
- Tabari, H.; Grismer, M.E.; Trajkovic, S. Comparative Analysis of 31 Reference Evapotranspiration Methods under Humid Conditions. Irrig. Sci. 2013, 31, 107–117. [Google Scholar] [CrossRef]
- Gao, F.; Fen, G.; Ouyang, Y.; Wang, H.; Fisher, D.; Adeli, A.; Jenkins, J. Evaluation of Reference Evapotranspiration Methods in Arid, Semiarid, and Humid Regions. J. Am. Water Resour Assoc. 2017, 53, 791–808. [Google Scholar] [CrossRef]
- Yıldırım, Y.E.; Kodal, S. Ankara Koşullarında Mısır Su Tüketiminin Tahmininde Kullanılabilecek Yöntemler. J. Agric. Sci. 1996, 2, 13–18. [Google Scholar] [CrossRef]
- Djaman, K.; Balde, A.B.; Sow, A.; Muller, B.; Irmak, S.; N’Diaye, M.K.; Saito, K. Evaluation of Sixteen Reference Evapotranspiration Methods under Sahelian Conditions in the Senegal River Valley. J. Hydrol. Reg. Stud. 2015, 3, 139–159. [Google Scholar] [CrossRef]
- Ampas, V.; Baltas, E.; Papamichail, D. Comparison of Different Methods for the Estimation of the Reference Crop Evapotranspiration in the Florina Region. WSEAS Trans. Environ. Dev. 2007, 2, 1449–1454. [Google Scholar]
- Liu, X.; Xu, C.; Zhong, X.; Li, Y.; Yuan, X.; Cao, J. Comparison of 16 Models for Reference Crop Evapotranspiration against Weighing Lysimeter Measurement. Agric. Water Manag. 2017, 184, 145–155. [Google Scholar] [CrossRef]
- Mohan, S. Intercomparison of Evapotranspiration Estimates. Hydrol. Sci. J. 1991, 36, 447–460. [Google Scholar] [CrossRef]
- Şahin, M.; Kara, M. Konya Kent Merkezinde Farkli Sulama Uygulamalarinda Çim Su Tüketimi ve Bitki Katsayilarinin Belirlenmesi. Selcuk J. Agric. Food Sci. 2005, 19, 135–145. [Google Scholar]
- Süheri, S.; Amarkai, P.A.; Yavuz, D. A Comparative Study of Crop Evapotranspiration Estimation by Three Methods with Measured Crop Evapotranspiration in Konya Plain. Selcuk J. Agric. Food Sci. 2019, 33, 1–6. [Google Scholar] [CrossRef]
- Taş, İ.; Kirnak, H. Yari Kurak İklim Bölgelerinde Bitki Su Tüketiminin Tahmininde Kullanilabilecek Ampirik Modeller. Adnan Menderes Üniversitesi Ziraat Fakültesi Derg. 2011, 8, 57–66. [Google Scholar]
- Yassen, A.N.; Nam, W.H.; Hong, E.M. Impact of Climate Change on Reference Evapotranspiration in Egypt. Catena 2020, 194, 104711. [Google Scholar] [CrossRef]
- Dinpashoh, Y.; Jhajharia, D.; Fakheri-Fard, A.; Singh, V.P.; Kahya, E. Trends in Reference Crop Evapotranspiration over Iran. J. Hydrol. 2011, 399, 422–433. [Google Scholar] [CrossRef]
- Harmsen, E.W.; Miller, N.L.; Schlegel, N.J.; Gonzalez, J.E. Seasonal Climate Change Impacts on Evapotranspiration, Precipitation Deficit and Crop Yield in Puerto Rico. Agric. Water Manag. 2009, 96, 1085–1095. [Google Scholar] [CrossRef]
- Katerji, N.; Rana, G.; Ferrara, R.M. Actual Evapotranspiration for a Reference Crop within Measured and Future Changing Climate Periods in the Mediterranean Region. Theor. Appl. Climatol. 2017, 129, 923–938. [Google Scholar] [CrossRef]
- Nistor, M.M.; Cheval, S.; Gualtieri, A.F.; Dumitrescu, A.; Boţan, V.E.; Berni, A.; Hognogi, G.; Irimuş, I.A.; Porumb-Ghiurco, C.G. Crop Evapotranspiration Assessment under Climate Change in the Pannonian Basin during 1991–2050. Meteorol. Appl. 2017, 24, 84–91. [Google Scholar] [CrossRef]
- Lang, D.; Zheng, J.; Shi, J.; Liao, F.; Ma, X.; Wang, W.; Zhang, M. A Comparative Study of Potential Evapotranspiration Estimation by Eight Methods with FAO Penman–Monteith Method in Southwestern China. Water 2017, 9, 734. [Google Scholar] [CrossRef]
- Arabi, C.; Candoğan, B.N. Marmara Bölgesinde Referans Bitki Su Tüketiminin Alansal ve Zamansal Değişimi. Uluslararası Tarım Ve Yaban Hayatı Bilim. Derg. 2022, 8, 268–281. [Google Scholar] [CrossRef]
- Bayramoğlu, E. Trabzon Ilinde Iklim Değişikliğinin Mevsimsel Bitki Su Tüketimine Etkisi: Penman-Monteith Yöntemi. Kastamonu Univ. J. For. Fac. 2013, 13, 300–306. [Google Scholar]
- Dadaser-Celik, F.; Cengiz, E.; Guzel, O. Trends in Reference Evapotranspiration in Turkey: 1975–2006. Int. J. Climatol. 2016, 36, 1733–1743. [Google Scholar] [CrossRef]
- Ünlükara, A.; Yürekli, K.; Aküzüm, T.; Örs, İ.; Safi, S. Konya ve Karaman İllerinde Bitki Su Tüketimi (ETo) Değişiminin Analizi. Tarım Bilim. Araştırma Derg. 2011, 4, 1–5. [Google Scholar]
- Yürekli, K.; Ünlükara, A.; Cömert, M.M. Holt Yaklaşımı Ile Referans Bitki Su Tüketiminin Mevsimsel Değişiminin Saptanması. Gaziosmanpaşa Bilimsel Araştırma Derg. 2017, 6, 75–81. [Google Scholar]
- Ünlü, M.; Koç, M.; Barutçular, C.; Koç, L.; Kapur, B.; Tekin, S.; Kanber, R. Effect of Climate Change for Evapotranspiration and Crop Growth under the Çukurova Condition. Turkey. ICCAP Workshop 2007, 30–31. Available online: https://www.researchgate.net/profile/Servet-Tekin/publication/283784442_EFFECT_OF_CLIMATE_CHANGE_FOR_EVAPOTRANSPIRATION_AND_CROP_GROWTH_UNDER_THE_CUKUROVA_CONDITIONS_TURKEY/links/5647061d08aef646e6cf29cc/EFFECT-OF-CLIMATE-CHANGE-FOR-EVAPOTRANSPIRATION-AND-CROP-GROWTH-UNDER-THE-CUKUROVA-CONDITIONS-TURKEY.pdf (accessed on 11 September 2024).
- Nistor, M.M.; Mîndrescu, M.; Petrea, D.; Nicula, A.S.; Rai, P.K.; Benzaghta, M.A.; Dezsi, Ş.; Hognogi, G.; Porumb-Ghiurco, C.G. Climate Change Impact on Crop Evapotranspiration in Turkey during the 21st Century. Meteorol. Appl. 2019, 26, 442–453. [Google Scholar] [CrossRef]
- Saadi, S.; Todorovic, M.; Tanasijevic, L.; Pereira, L.S.; Pizzigalli, C.; Lionello, P. Climate Change and Mediterranean Agriculture: Impacts on Winter Wheat and Tomato Crop Evapotranspiration, Irrigation Requirements and Yield. Agric. Water Manag. 2015, 147, 103–115. [Google Scholar] [CrossRef]
- Yıldırım, A.İ.; Demir, S.K.; Yayla, U. Konya İl Gıda Tarım ve Hayvancılık Müdürlüğü.Şube ve İlçe Müdürlükleri 2017 Yılı Değerlendirme ve Koordinasyon Toplantısı: Sonuç Raporu; Konya Tarım İl Müdürlüğü: Ankara, Türkiye, 2017; pp. 12–14. [Google Scholar]
- ISO/IEC 17025; International Organization for Standardization & International Electrotechnical Commission. General Requirements for the Competence of Testing and Calibration Laboratories. 2017. Available online: https://www.iso.org/obp/ui/en/#iso:std:66912:en (accessed on 11 September 2024).
- Allen, R.G.; Pruitt, W.O. FAO-24 Reference Evapotranspiration Factors. J. Irrig. Drain. Eng. 1991, 117, 758–773. [Google Scholar] [CrossRef]
- Ward, A.D.; Trimble, S.W.; Burckhard, S.R.; Lyon, J.G. Environmental Hydrology, 3rd ed.; CRC Press: Boca Raton, FL, USA, 2015. [Google Scholar]
- Allen, R.G.; Pruitt, W.O. Rational Use of the FAO Blaney-Criddle Formula. J. Irrig. Drain. Eng. 1986, 12, 139–155. [Google Scholar] [CrossRef]
- Ferro, C.A.; Hannachi, A.; Stephenson, D.B. Simple Nonparametric Techniques for Exploring Changing Probability Distributions of Weather. J. Clim. 2005, 18, 4344–4354. [Google Scholar] [CrossRef]
- Anonymous Türkiye’de Sulanan Bitkilerin Bitki Su Tüketimi Rehberi. Tarımsal Araştırmalar Ve Politakalar Genel Müdürlüğü; 2016. Available online: https://www.almaatatarim.net/icerik/uploads/turkiyede-sulanan-Bitkilerin-Su-Tuuketimi-Rehberi-5-9-2016.pdf (accessed on 11 September 2024).
- Lum, M.; Bateni, S.; Shiri, J.; Keshavarzi, A. Estimation of Reference Evapotranspiration from Climatic Data. Int. J. Hydrol. 2017, 1, 25–30. [Google Scholar]
- Farias, V.D.D.S.; Lima, M.J.A.D.; Nunes, H.G.G.C.; Sousa, D.D.P.; Souza, P.J.D.O.P. Water Demand, Crop Coefficient and Uncoupling Factor of Cowpea in The Eastern Amazon1. Rev. Caatinga 2017, 30, 190–200. [Google Scholar] [CrossRef]


Disclaimer/Publisher’s Note: The statements, opinions and data contained in all publications are solely those of the individual author(s) and contributor(s) and not of MDPI and/or the editor(s). MDPI and/or the editor(s) disclaim responsibility for any injury to people or property resulting from any ideas, methods, instructions or products referred to in the content. |
© 2024 by the authors. Licensee MDPI, Basel, Switzerland. This article is an open access article distributed under the terms and conditions of the Creative Commons Attribution (CC BY) license (https://creativecommons.org/licenses/by/4.0/).