
Evolution Characteristics of Water Use Efficiency and the Impact of Its Driving Factors on the Yunnan–Guizhou Plateau in China


Abstract
1. Introduction
2. Dataset and Study Area
2.1. Dataset
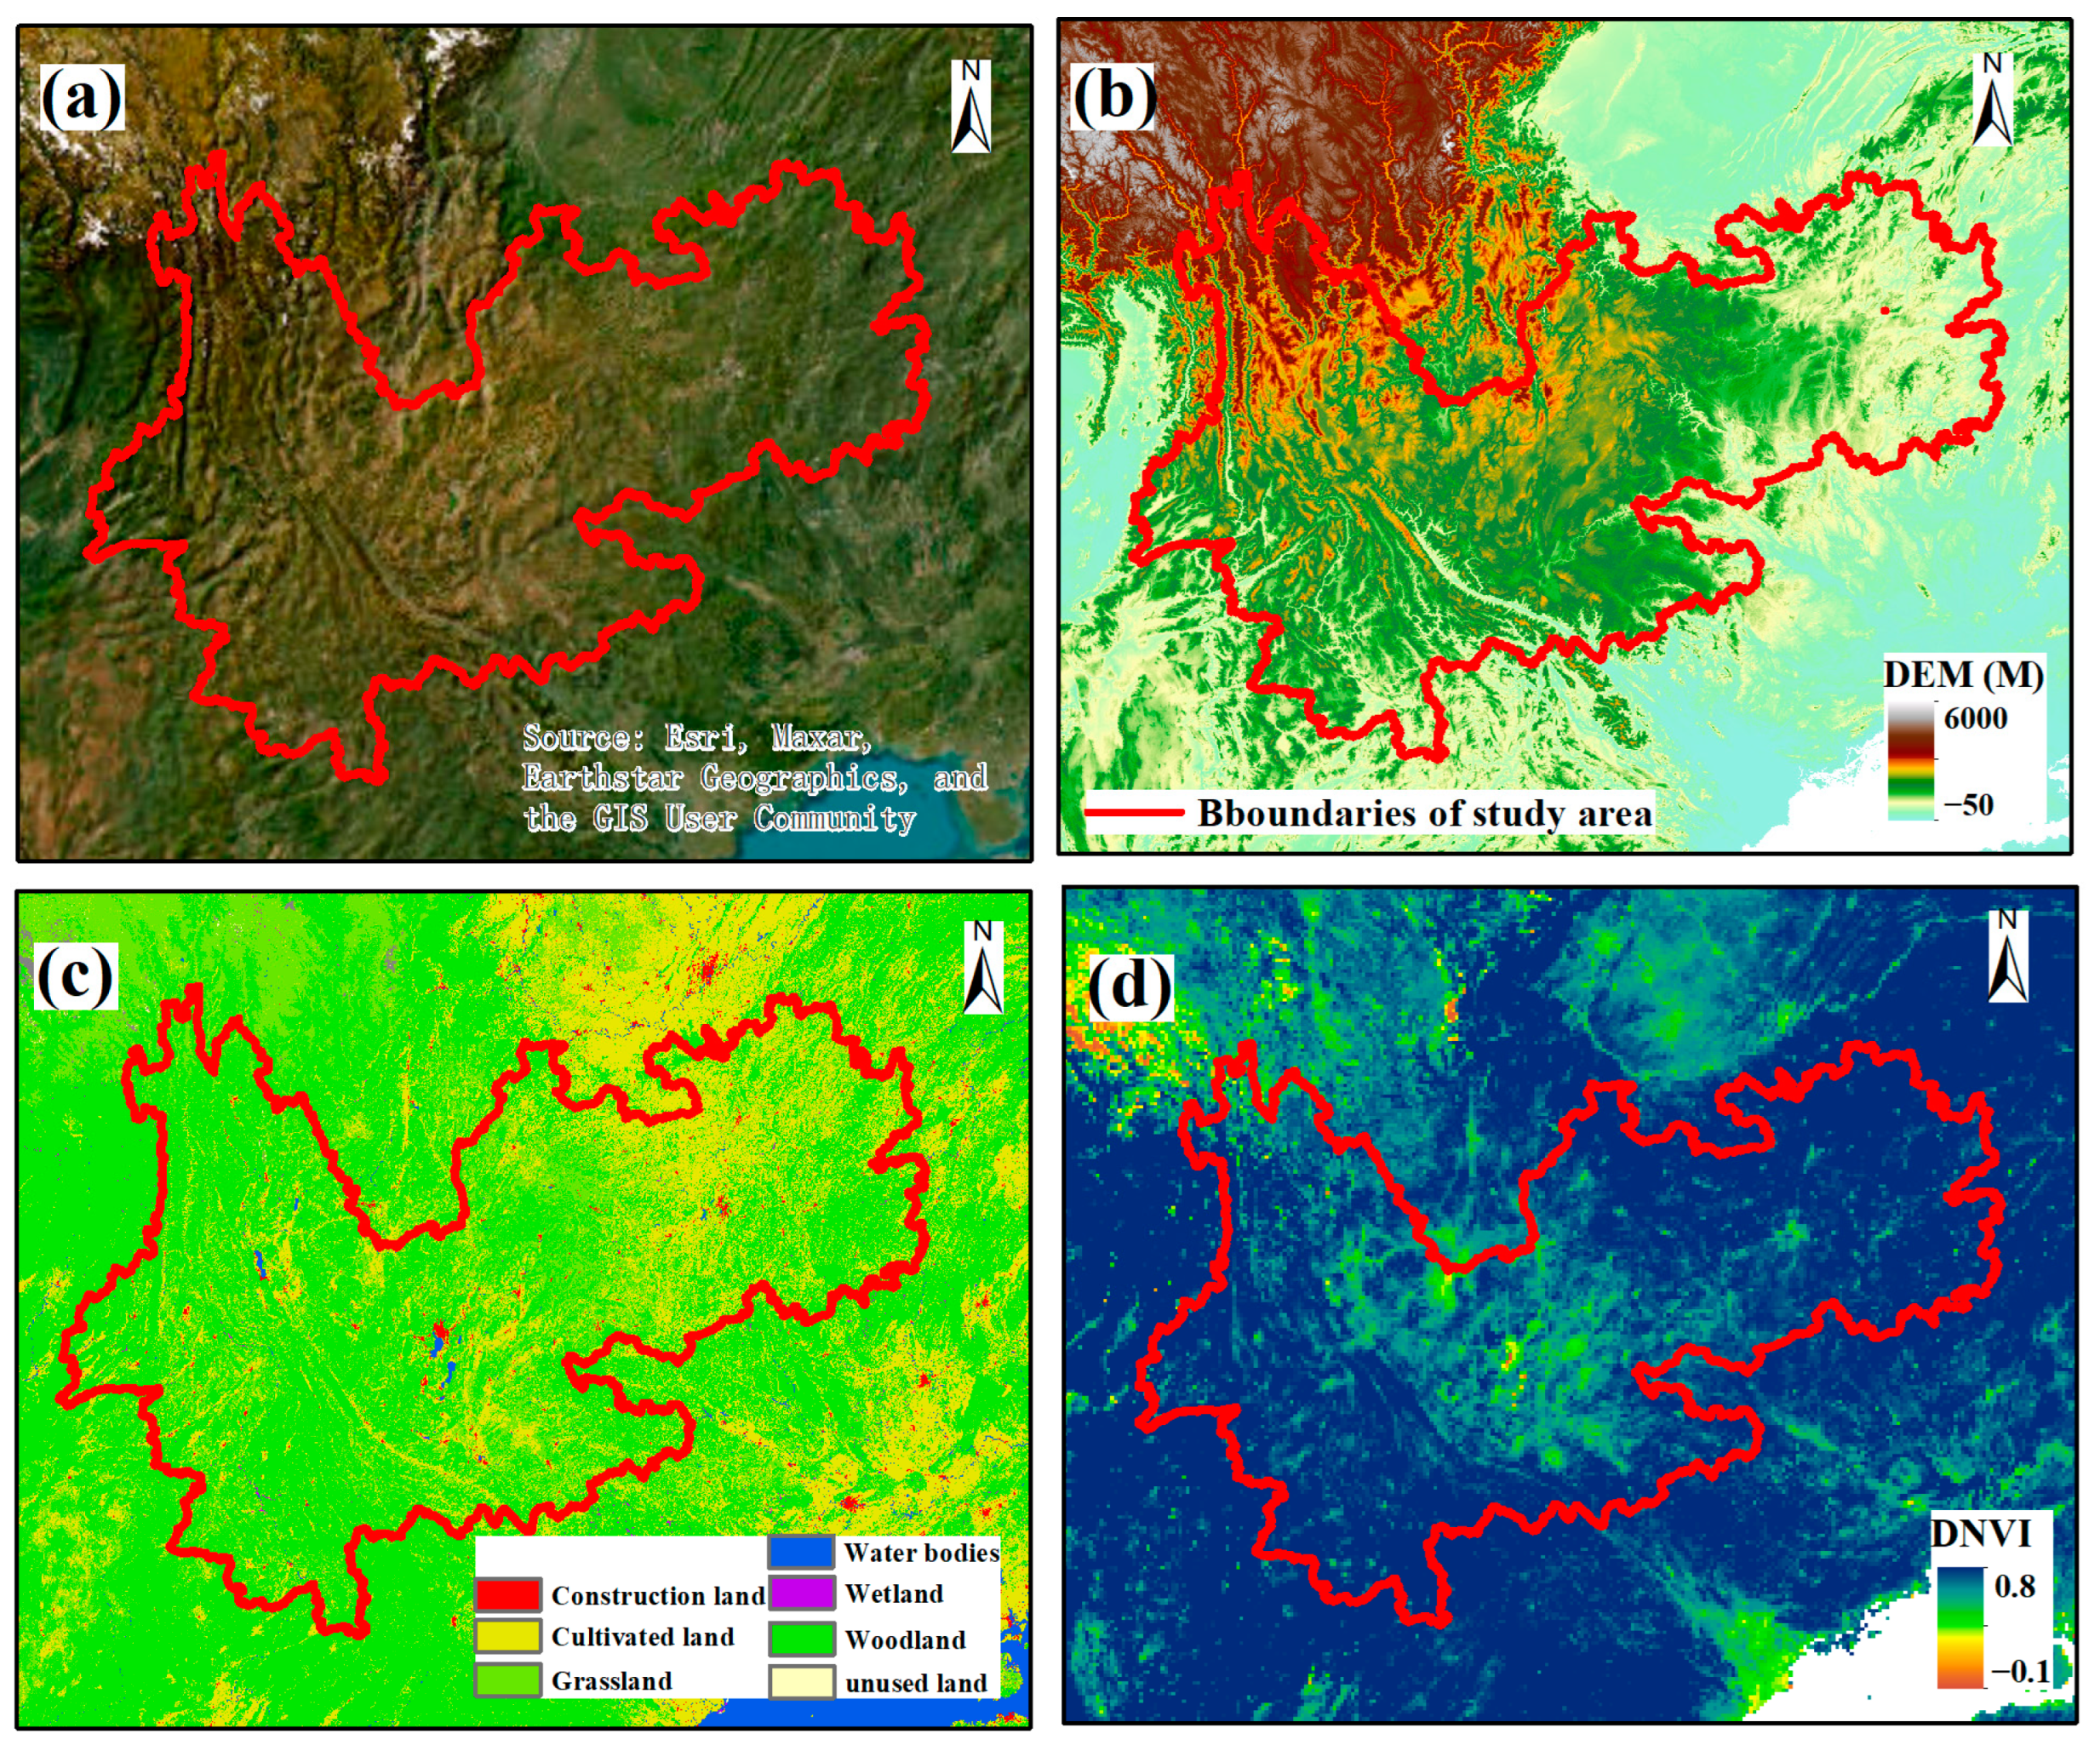
2.2. Study Area
3. Methods
3.1. WUE Estimation
3.2. Estimation of Theil–Sen Slope
3.3. Mann–Kendall Significance Analysis
3.4. XGBoost Model
3.5. SHAP Model
4. Results
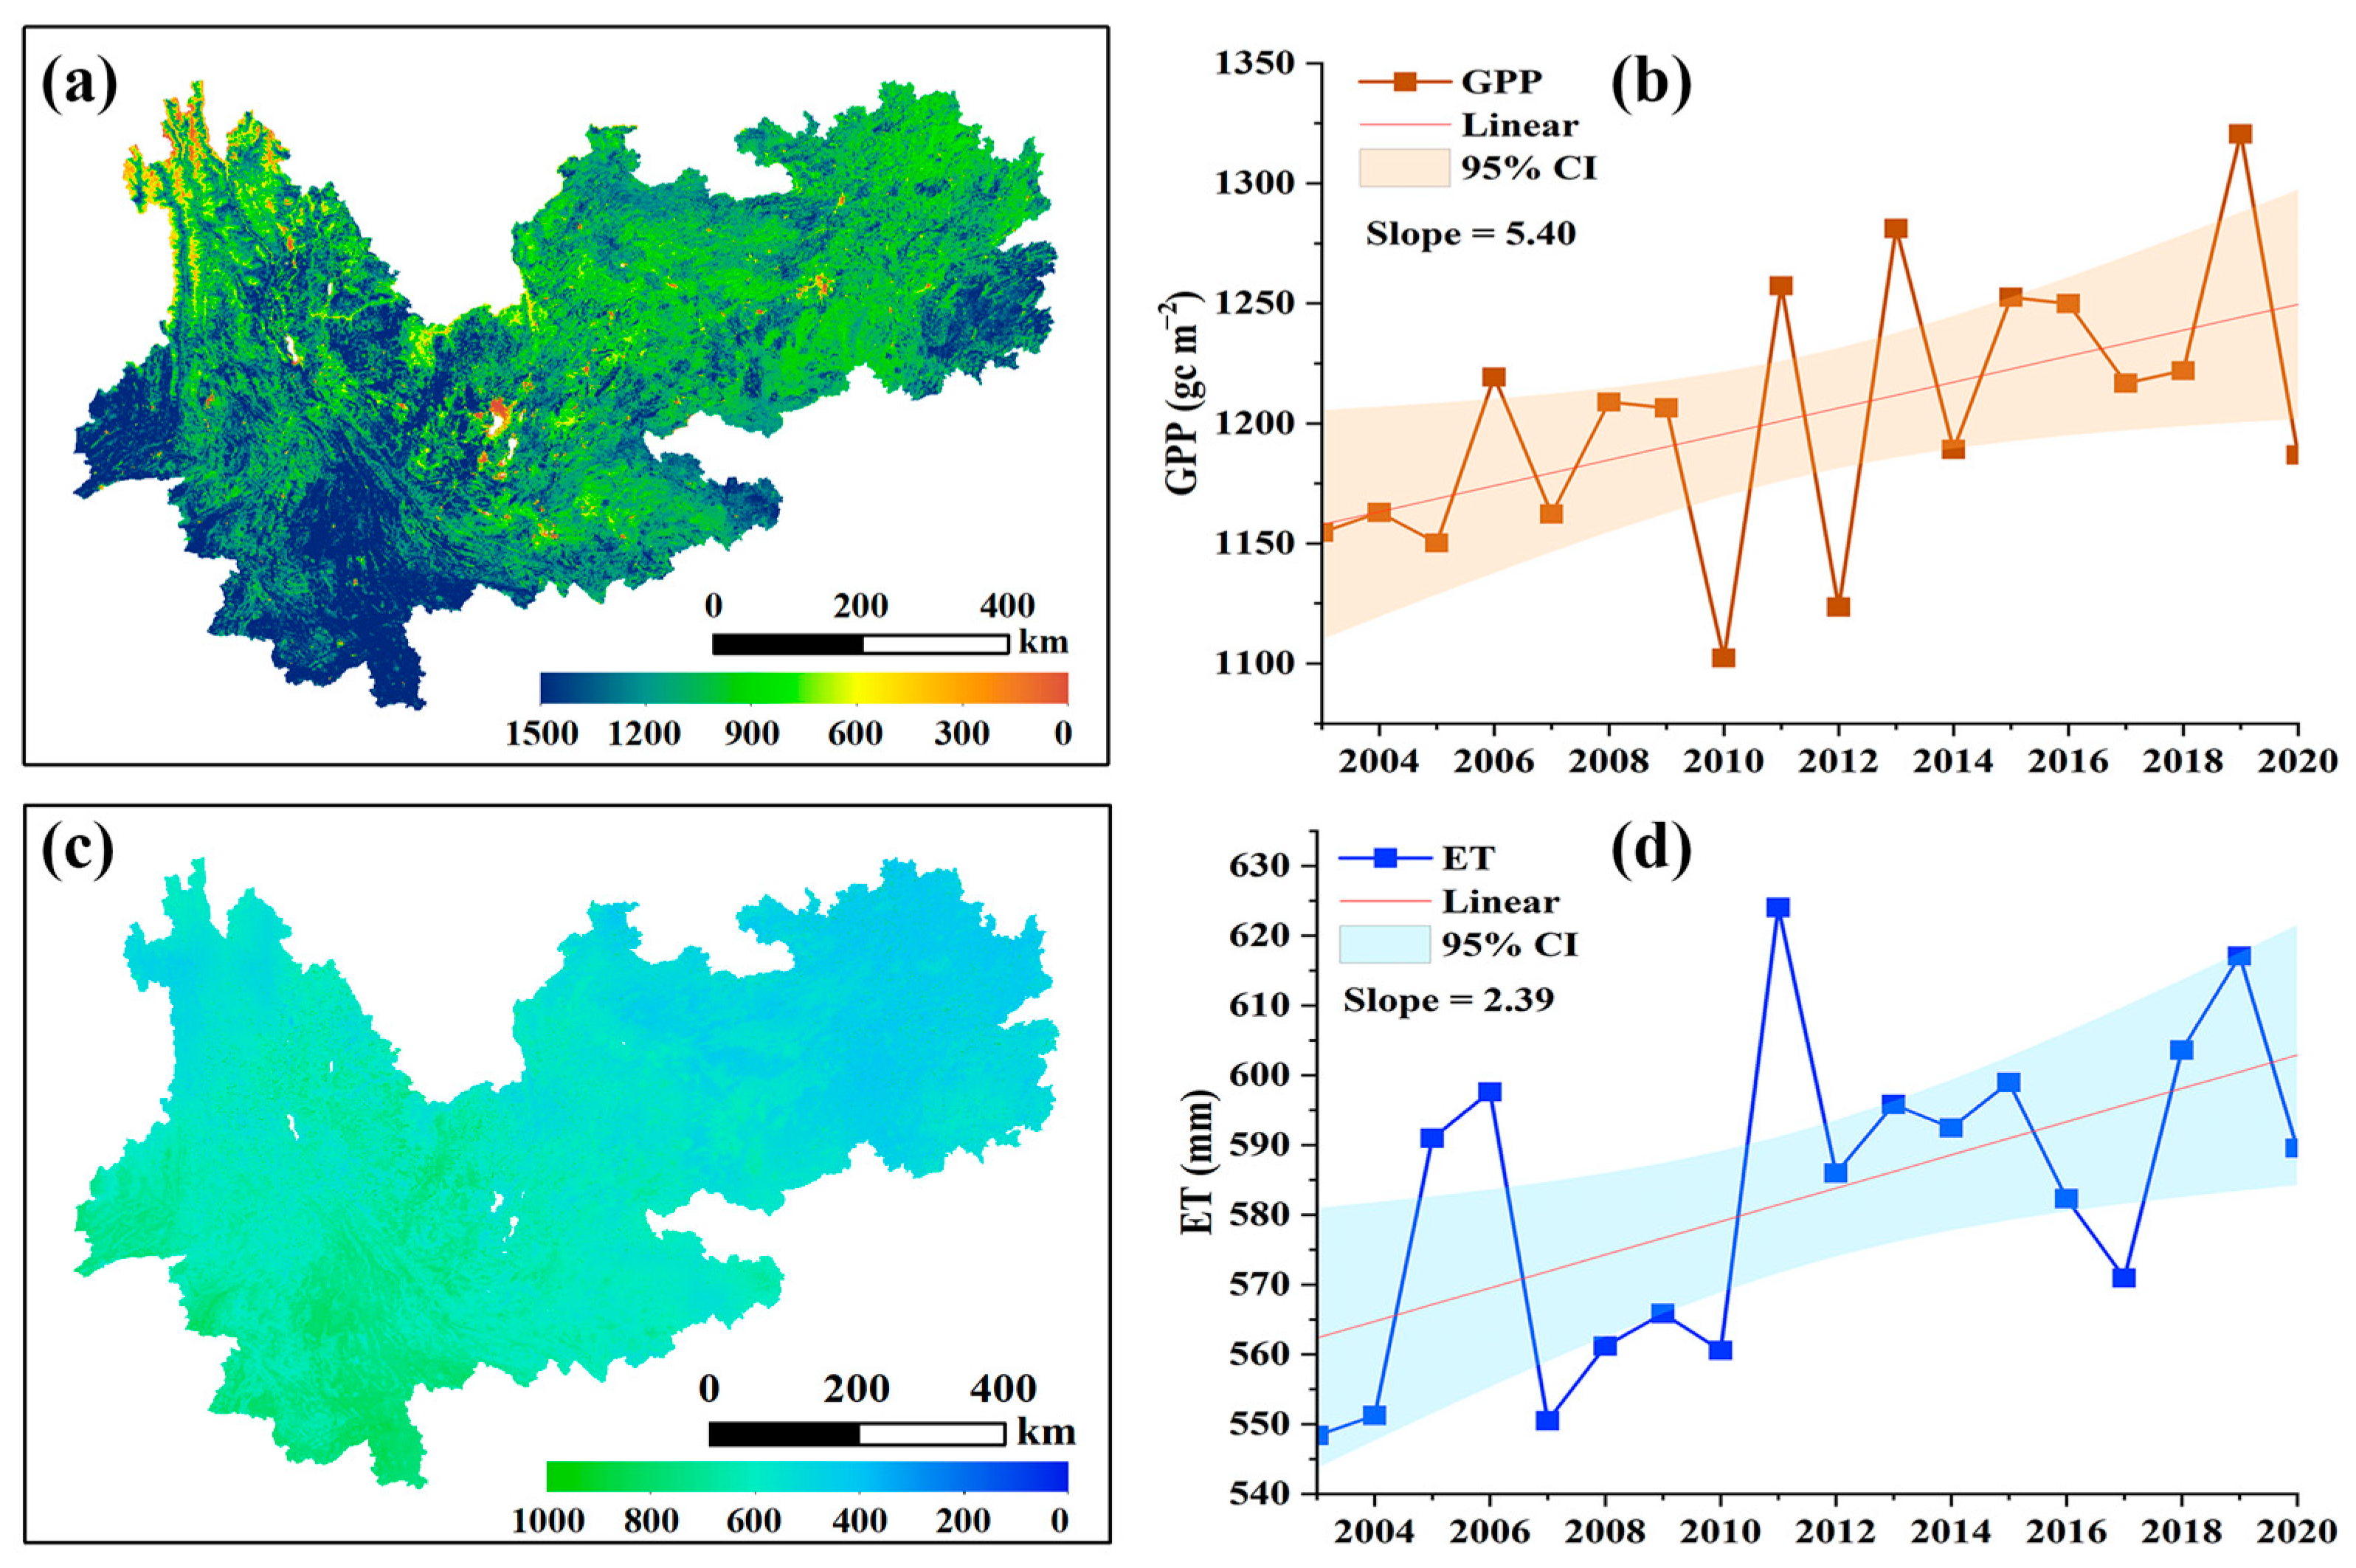
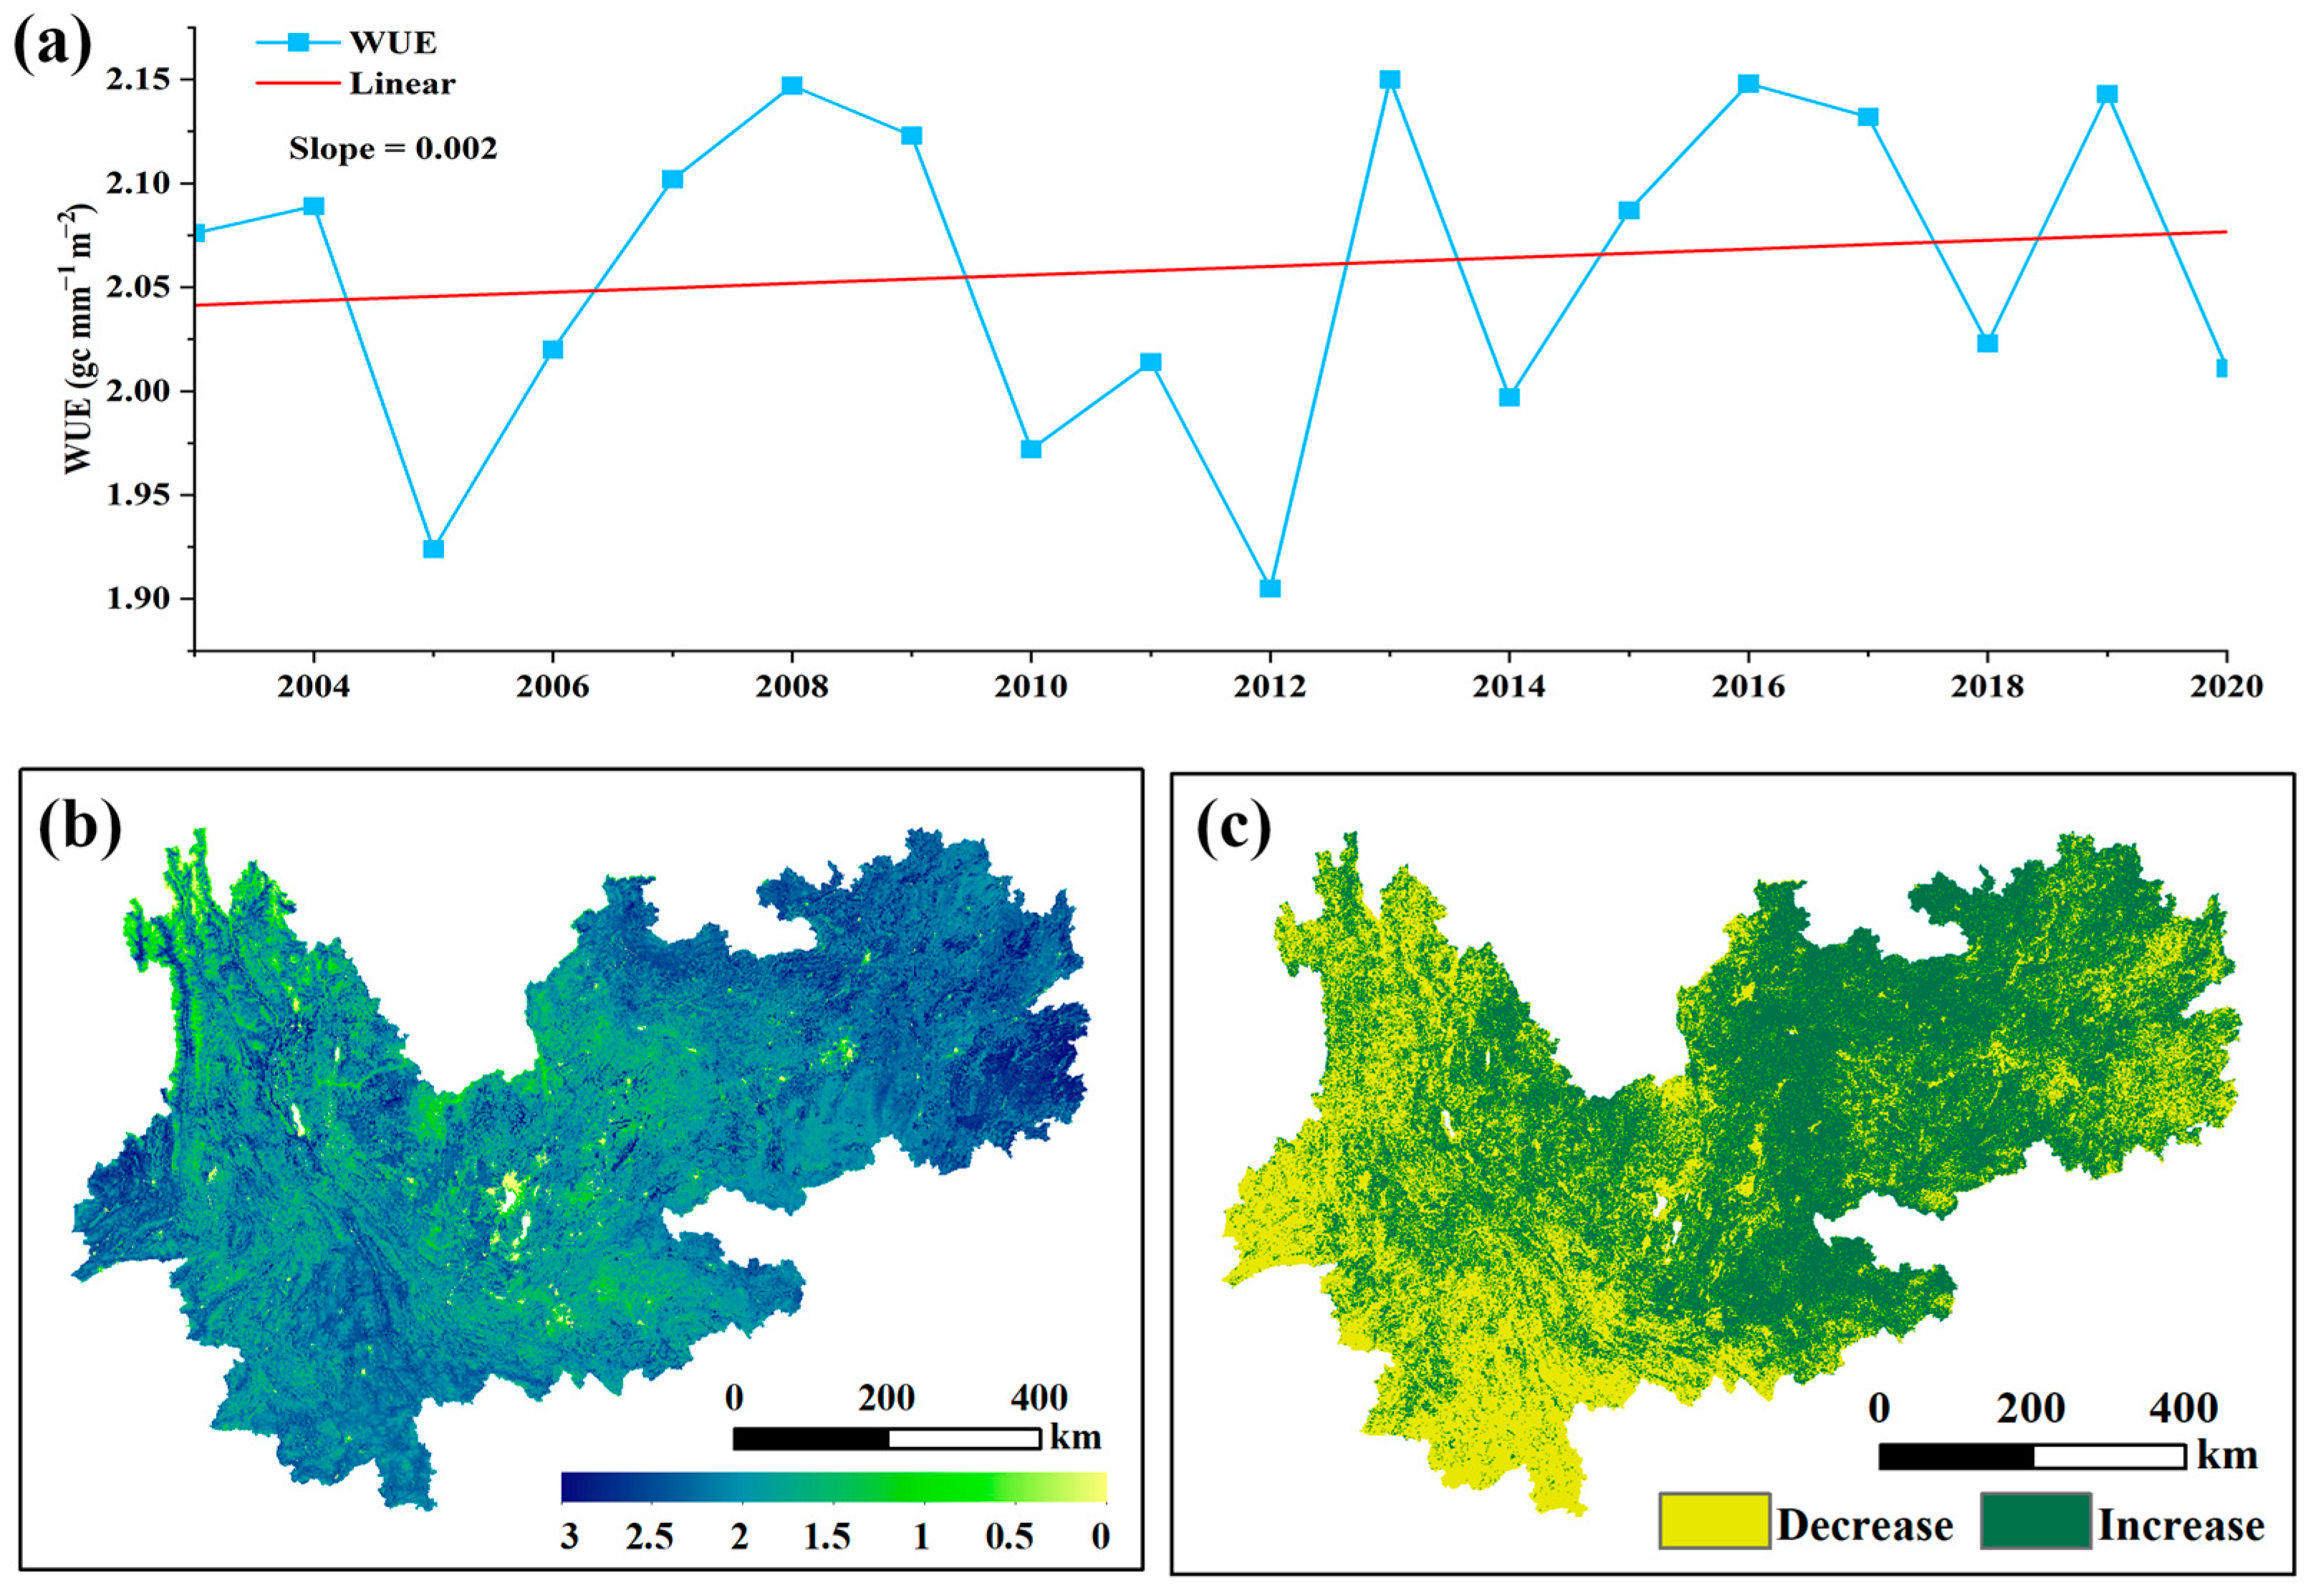
4.1. Spatiotemporal Evolution Characteristics
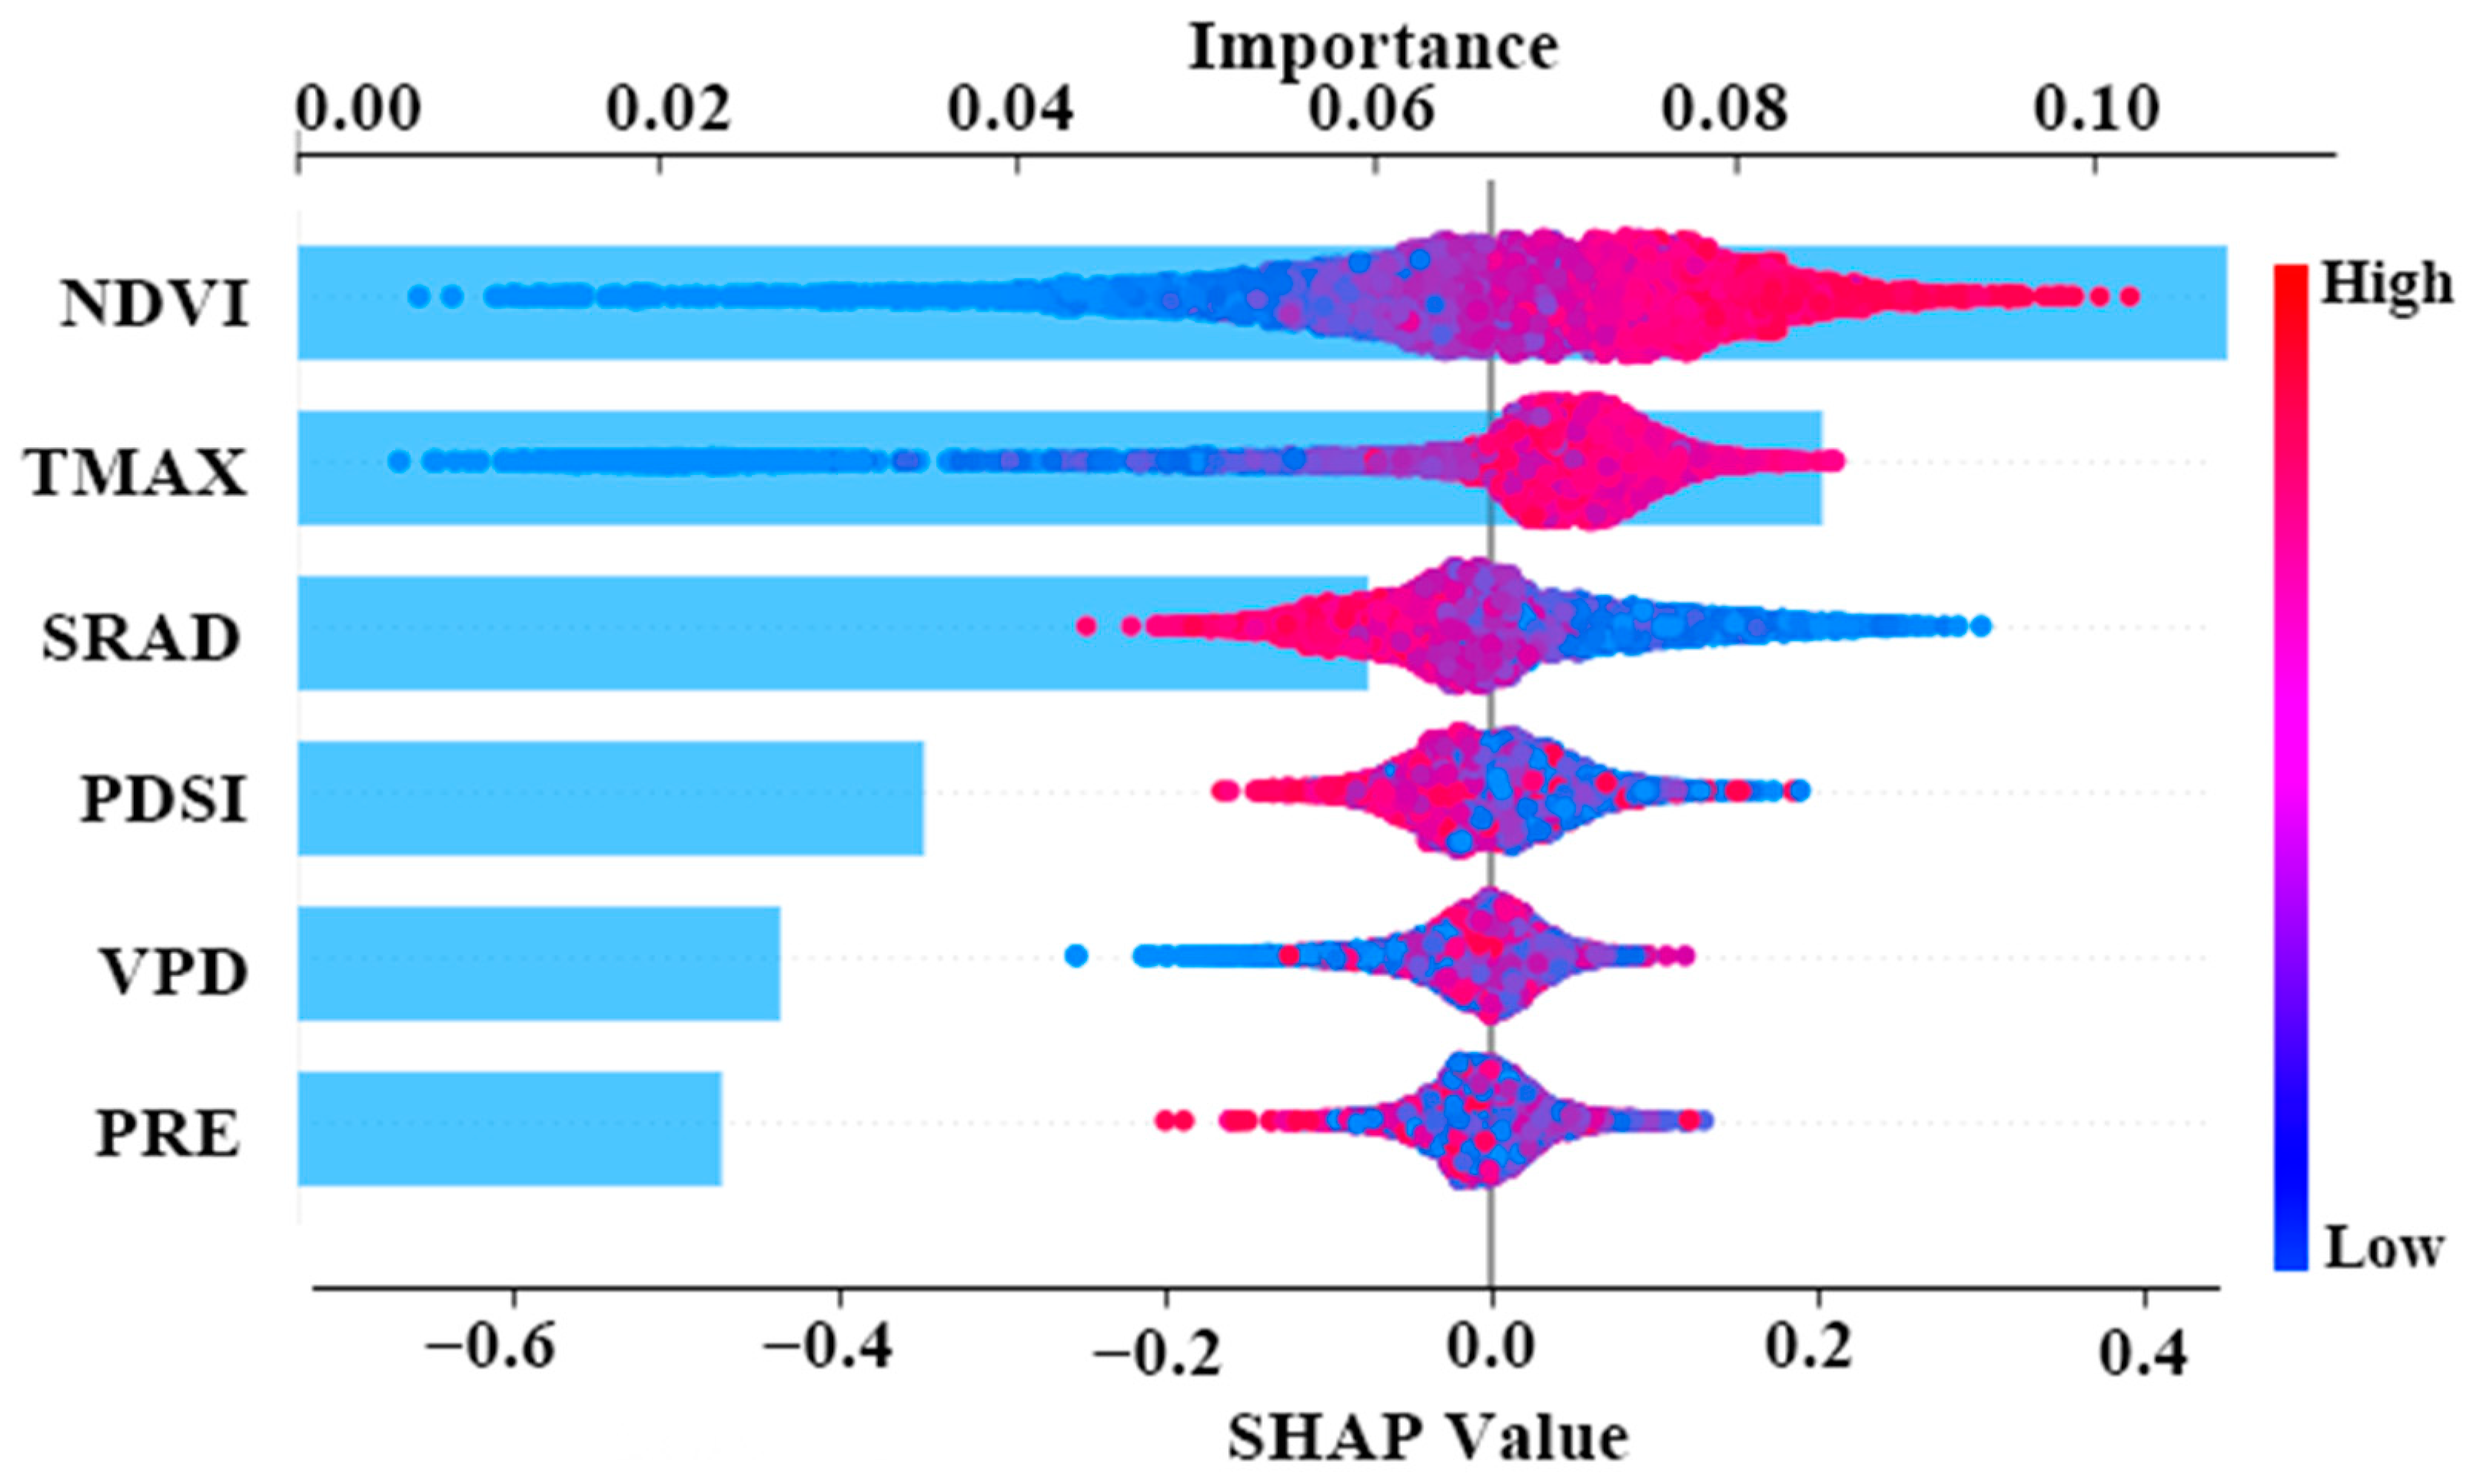
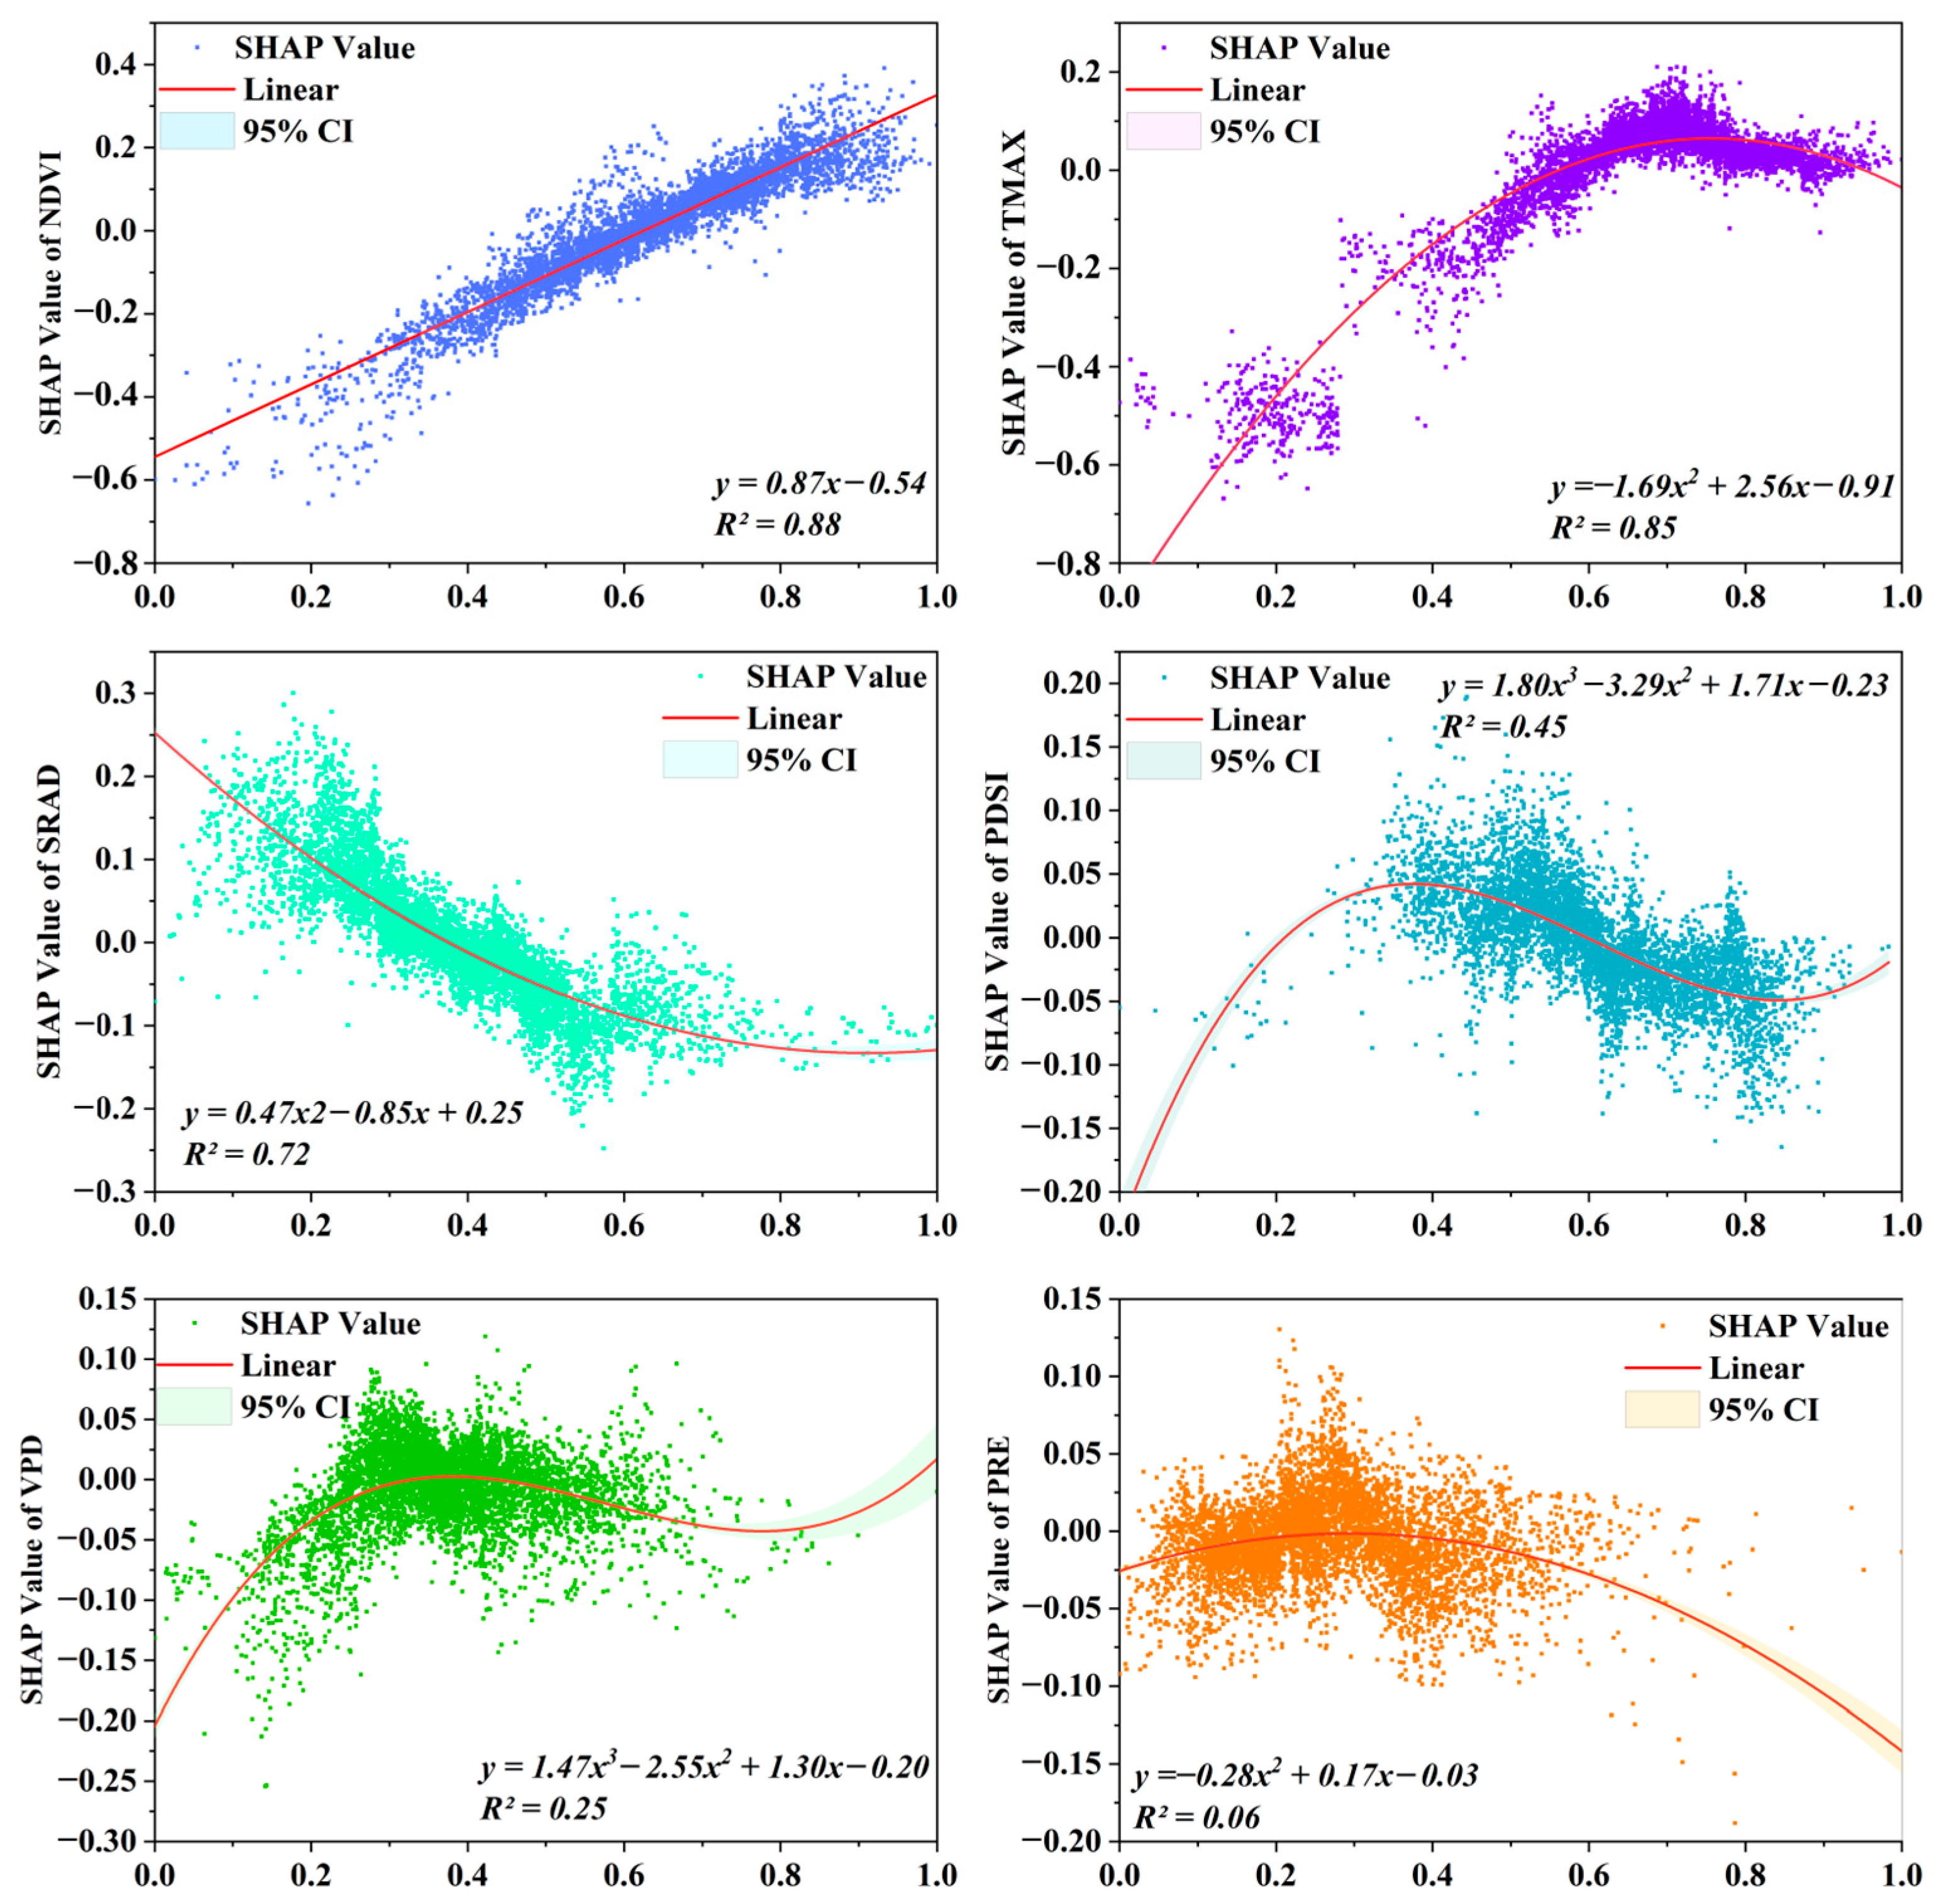
4.2. Driving Factor Analysis
5. Discussion
5.1. Spatiotemporal Evolution Characteristics
5.2. Analysis of Driving Factors
5.3. Limitations
6. Conclusions
Author Contributions
Funding
Institutional Review Board Statement
Informed Consent Statement
Data Availability Statement
Conflicts of Interest
References
- Cooley, S.S.; Fisher, J.B.; Goldsmith, G.R. Convergence in water use efficiency within plant functional types across contrasting climates. Nat. Plants 2022, 8, 341–345. [Google Scholar] [CrossRef]
- Yang, S.; Zhang, J.; Zhang, S.; Wang, J.; Bai, Y.; Yao, F.; Guo, H. The potential of remote sensing-based models on global water-use efficiency estimation: An evaluation and intercomparison of an ecosystem model (BESS) and algorithm (MODIS) using site level and upscaled eddy covariance data. Agric. For. Meteorol. 2020, 287, 107959. [Google Scholar] [CrossRef]
- Zhao, J.; Xu, T.; Xiao, J.; Liu, S.; Mao, K.; Song, L.; Yao, Y.; He, X.; Feng, H. Responses of Water Use Efficiency to Drought in Southwest China. Remote. Sens. 2020, 12, 199. [Google Scholar] [CrossRef]
- Xu, H.; Zhang, Z.; Xiao, J.; Chen, J.; Zhu, M.; Cao, W.; Chen, Z. Environmental and canopy stomatal control on ecosystem water use efficiency in a riparian poplar plantation. Agric. For. Meteorol. 2020, 287, 107953. [Google Scholar] [CrossRef]
- Li, Y.; Shi, H.; Zhou, L.; Eamus, D.; Huete, A.; Li, L.; Cleverly, J.; Hu, Z.; Harahap, M.; Yu, Q.; et al. Disentangling Climate and LAI Effects on Seasonal Variability in Water Use Efficiency Across Terrestrial Ecosystems in China. J. Geophys. Res. Biogeosciences 2018, 123, 2429–2443. [Google Scholar] [CrossRef]
- Hu, Y.; Li, G.; Chen, W. Remote Sensing of Ecosystem Water Use Efficiency in Different Ecozones of the North China Plain. Sustainability 2022, 14, 2526. [Google Scholar] [CrossRef]
- Donovan, L.A.; Dudley, S.A.; Rosenthal, D.M.; Ludwig, F. Phenotypic selection on leaf water use efficiency and related ecophysiological traits for natural populations of desert sunflowers. Oecologia 2007, 152, 13–25. [Google Scholar] [CrossRef] [PubMed]
- Sun, S.C.; Hu, X.Q.; Wei, Y.S.; Chen, X.X.; Li, Y.Z.; Cao, J. Response of WUE of maize at ear stage to the coupling effect of CO2 and temperature. Heliyon 2024, 10, e23646. [Google Scholar] [CrossRef]
- Aboelsoud, H.M.; AbdelRahman, M.A.E.; Kheir, A.M.S.; Eid, M.S.M.; Ammar, K.A.; Khalifa, T.H.; Scopa, A. Quantitative Estimation of Saline-Soil Amelioration Using Remote-Sensing Indices in Arid Land for Better Management. Land 2022, 11, 1041. [Google Scholar] [CrossRef]
- Xie, S.; Mo, X.; Hu, S.; Liu, S. Contributions of climate change, elevated atmospheric CO2 and human activities to ET and GPP trends in the Three-North Region of China. Agric. For. Meteorol. 2020, 295, 108183. [Google Scholar] [CrossRef]
- Yang, L.; Feng, Q.; Wen, X.; Barzegar, R.; Adamowski, J.F.; Zhu, M.; Yin, Z. Contributions of climate, elevated atmospheric CO2 concentration and land surface changes to variation in water use efficiency in Northwest China. Catena 2022, 213, 106220. [Google Scholar] [CrossRef]
- Jin, Z.; Liang, W.; Yang, Y.; Zhang, W.; Yan, J.; Chen, X.; Li, S.; Mo, X. Separating Vegetation Greening and Climate Change Controls on Evapotranspiration trend over the Loess Plateau. Sci. Rep. 2017, 7, 8191. [Google Scholar] [CrossRef] [PubMed]
- Wang, Y.; Zhou, L.; Ping, X.; Jia, Q.; Li, R. Ten-year variability and environmental controls of ecosystem water use efficiency in a rainfed maize cropland in Northeast China. Field Crops Res. 2018, 226, 48–55. [Google Scholar] [CrossRef]
- Gang, C.; Wang, Z.; Zhou, W.; Yizhao, C.; Li, J.-l.; Chen, J.M.; Qi, J.; Odeh, I.O.A.; Groisman, P.Y. Assessing the Spatiotemporal Dynamic of Global Grassland Water Use Efficiency in Response to Climate Change from 2000 to 2013. J. Agron. Crop. Sci. 2016, 202, 343–354. [Google Scholar] [CrossRef]
- Jiang, Y.; Still, C.J.; Rastogi, B.; Page, G.F.M.; Wharton, S.; Meinzer, F.C.; Voelker, S.; Kim, J.B. Trends and controls on water-use efficiency of an old-growth coniferous forest in the Pacific Northwest. Environ. Res. Lett. 2019, 14, 074029. [Google Scholar] [CrossRef]
- Guo, L.; Shan, N.; Zhang, Y.; Sun, F.; Liu, W.; Shi, Z.; Zhang, Q. Separating the effects of climate change and human activity on water use efficiency over the Beijing-Tianjin Sand Source Region of China. Sci. Total Environ. 2019, 690, 584–595. [Google Scholar] [CrossRef] [PubMed]
- Du, X.; Zhao, X.; Zhou, T.; Jiang, B.; Xu, P.; Wu, D.; Tang, B. Effects of Climate Factors and Human Activities on the Ecosystem Water Use Efficiency throughout Northern China. Remote Sens. 2019, 11, 2766. [Google Scholar] [CrossRef]
- Chen, J.; Cao, L. Spatiotemporal Variability in Water-Use Efficiency in Tianshan Mountains (Xinjiang, China) and the Influencing Factors. Sustainability 2022, 14, 8191. [Google Scholar] [CrossRef]
- Bejagam, V.; Singh, A.; Sharma, A. Spatiotemporal variability and controlling factors of ecosystem water use efficiency in India. Theor. Appl. Climatol. 2023, 152, 813–827. [Google Scholar] [CrossRef]
- Jin, J.; Wang, Y.; Zhang, Z.; Magliulo, V.; Jiang, H.; Cheng, M. Phenology Plays an Important Role in the Regulation of Terrestrial Ecosystem Water-Use Efficiency in the Northern Hemisphere. Remote. Sens. 2017, 9, 664. [Google Scholar] [CrossRef]
- Hu, Z.; Dai, Q.; Li, H.; Yan, Y.; Zhang, Y.; Yang, X.; Zhang, X.; Zhou, H.; Yao, Y. Response of ecosystem water-use efficiency to global vegetation greening. Catena 2024, 239, 107952. [Google Scholar] [CrossRef]
- Xiao, J.; Xie, B.; Zhou, K.; Li, J.; Xie, J.; Liang, C. Contributions of Climate Change, Vegetation Growth, and Elevated Atmospheric CO2 Concentration to Variation in Water Use Efficiency in Subtropical China. Remote Sens. 2022, 14, 4296. [Google Scholar] [CrossRef]
- Ji, R.; Wang, C.; Wang, P.; Wang, W.; Chen, N. Quantitative analysis of spatiotemporal disparity of urban water use efficiency and its driving factors in the Yangtze River Economic Belt, China. J. Hydrol.-Reg. Stud. 2024, 51, 101647. [Google Scholar] [CrossRef]
- Yang, S.; Zhang, J.; Han, J.; Wang, J.; Zhang, S.; Bai, Y.; Cao, D.; Xun, L.; Zheng, M.; Chen, H.; et al. Evaluating global ecosystem water use efficiency response to drought based on multi-model analysis. Sci. Total Environ. 2021, 778, 146356. [Google Scholar] [CrossRef] [PubMed]
- Cai, L.; Fan, D.; Wen, X.; Wang, H.; Badarifu; Wang, S. Spatiotemporal tendency of agricultural water use efficiency in the northernmost Yellow River: Indicator comparison and interactive driving factors. J. Arid Environ. 2022, 205, 104822. [Google Scholar] [CrossRef]
- Jia, B.; Luo, X.; Wang, L.; Lai, X. Changes in Water Use Efficiency Caused by Climate Change, CO2 Fertilization, and Land Use Changes on the Tibetan Plateau. Adv. Atmos. Sci. 2023, 40, 144–154. [Google Scholar] [CrossRef]
- Liu, Q.H.; Wang, X.H.; Zhang, Y.L.; Zhang, H.M.; Li, L. Vegetation Degradation and Its Driving Factors in the Farming–Pastoral Ecotone over the Countries along Belt and Road Initiative. Sustainability 2019, 11, 1590. [Google Scholar] [CrossRef]
- Wu, D.H.; Wu, H.; Zhao, X.; Zhou, T.; Tang, B.J.; Zhao, W.; Jia, K. Evaluation of Spatiotemporal Variations of Global Fractional Vegetation Cover Based on GIMMS NDVI Data from 1982 to 2011. Remote Sens. 2014, 6, 4217–4239. [Google Scholar] [CrossRef]
- Song, Q.H.; Fei, X.H.; Zhang, Y.P.; Sha, L.Q.; Liu, Y.T.; Zhou, W.J.; Wu, C.S.; Lu, Z.Y.; Luo, K.; Gao, J.B.; et al. Water use efficiency in a primary subtropical evergreen forest in Southwest China. Sci. Rep. 2017, 7, srep43031. [Google Scholar] [CrossRef]
- Tian, F.; Yang, J.H.; Du, R.H.; Lin, J.Y.; Chen, M.; Wu, J.J. Sustained vegetation greening enhanced ecosystem water-use efficiency in the Loess Plateau of China in recent 20 years. Ecol. Eng. 2022, 184, 106768. [Google Scholar] [CrossRef]
- Qu, C.M.; Han, X.G.; Su, B.; Huang, J.H.; Jiang, G.M. The characteristics of foliar δ 13C values of plants and plant water use efficiency indicated by δ 13C values in two fragmented rainforests in Xishuangbanna, Yunnan. Acta Bot. Sin. 2001, 43, 186–192. [Google Scholar]
- Li, L.; Cao, J.H.; Bao, X.Y. Pattern Dynamics of Vegetation Growth With Saturated Water Absorption. Front. Phys. 2021, 9, 721115. [Google Scholar] [CrossRef]
- Liu, Y.X.; Wu, J.W.; Wu, D.Z.; Li, S.M.; Wang, L.N. Seasonal variation in δ13C of Pinus. yunnanensis and Pinus. armandii at different stand ages. Sci. Rep. 2023, 13, 7938. [Google Scholar] [CrossRef] [PubMed]
- Su, J.X.; Fan, L.X.; Yuan, Z.L.; Wang, Z.J.; Niu, H.P. Influences of climatic variation and human activities on vegetation photosynthesis dynamics in Southwest China. J. Environ. Manag. 2024, 370, 122879. [Google Scholar] [CrossRef] [PubMed]
- Roupsard, O.; le Maire, G.; Nouvellon, Y.; Dauzat, J.; Jourdan, C.; Navarro, M.; Bonnefond, J.M.; Saint-André, L.; Mialet-Serra, I.; Hamel, O.; et al. Scaling-up productivity (NPP) using light or water use efficiencies (LUE, WUE) from a two-layer tropical plantation. Agrofor. Syst. 2009, 76, 409–422. [Google Scholar] [CrossRef]
- Yu, L.Y.; Gao, X.D.; Zhao, X.N. Global synthesis of the impact of droughts on crops’ water-use efficiency (WUE): Towards both high WUE and productivity. Agric. Syst. 2020, 177, 102723. [Google Scholar] [CrossRef]


| Name | Unit | Source | Resolution | Timeframes |
|---|---|---|---|---|
| GPP | gC m−2 | PML_V2 | Day/500 m | 2003–2020 |
| ET | mm/d | PML_V2 | Day/500 m | |
| NDVI | - | USGS | 16 Day/500 m | |
| VPD | kPa | TerraClimate | Month/4 km | |
| PDSI | - | TerraClimate | Month/4 km | |
| SRAD | W/m2 | TerraClimate | Month/4 km | |
| TMAX | °C | TerraClimate | Month/4 km | |
| PRE | mm | TerraClimate | Month/4 km |
Disclaimer/Publisher’s Note: The statements, opinions and data contained in all publications are solely those of the individual author(s) and contributor(s) and not of MDPI and/or the editor(s). MDPI and/or the editor(s) disclaim responsibility for any injury to people or property resulting from any ideas, methods, instructions or products referred to in the content. |
© 2024 by the authors. Licensee MDPI, Basel, Switzerland. This article is an open access article distributed under the terms and conditions of the Creative Commons Attribution (CC BY) license (https://creativecommons.org/licenses/by/4.0/).
Share and Cite
Wang, P.; Zhang, X.; Liu, Y.; Nie, W. Evolution Characteristics of Water Use Efficiency and the Impact of Its Driving Factors on the Yunnan–Guizhou Plateau in China. Sustainability 2024, 16, 11163. https://doi.org/10.3390/su162411163
Wang P, Zhang X, Liu Y, Nie W. Evolution Characteristics of Water Use Efficiency and the Impact of Its Driving Factors on the Yunnan–Guizhou Plateau in China. Sustainability. 2024; 16(24):11163. https://doi.org/10.3390/su162411163
Chicago/Turabian StyleWang, Pei, Xuepeng Zhang, Yang Liu, and Wei Nie. 2024. "Evolution Characteristics of Water Use Efficiency and the Impact of Its Driving Factors on the Yunnan–Guizhou Plateau in China" Sustainability 16, no. 24: 11163. https://doi.org/10.3390/su162411163
APA StyleWang, P., Zhang, X., Liu, Y., & Nie, W. (2024). Evolution Characteristics of Water Use Efficiency and the Impact of Its Driving Factors on the Yunnan–Guizhou Plateau in China. Sustainability, 16(24), 11163. https://doi.org/10.3390/su162411163