Article

Effects of Solid Dairy Manure Application on Greenhouse Gas Emissions and Corn Yield in the Upper Midwest, USA

USDA-ARS Dairy Forage Research Center, Institute for Environmentally Integrated Dairy Management, 2615 Yellowstone Drive, Marshfield, WI 54449, USA
*
Author to whom correspondence should be addressed.
Sustainability 2024, 16(24), 11171; https://doi.org/10.3390/su162411171
Submission received: 22 November 2024 / Revised: 12 December 2024 / Accepted: 17 December 2024 / Published: 20 December 2024

Abstract

:
Dairy manure is an important nitrogen (N) source for crops, but its role in greenhouse gas (GHG) emissions and farm sustainability is not fully understood. We evaluated the effects of application of two dairy manure sources (bedded pack heifer, BP, and separated dairy solids, SDS) on corn silage yield and GHG emissions (carbon dioxide, CO2; methane, CH4; nitrous oxide, N2O) compared to a urea-fertilizer-only control (80 kg N ha−1 yr−1). The BP and SDS were applied at 18.4 and 19.4 Mg dry matter ha−1 in fall 2020 in the final year of ryegrass production. No-till corn was planted from 2021 to 2023, and GHG emissions were measured each season (from May to November). The results showed significantly greater CO2-C emissions for BP in 2021 and no differences in 2022 or 2023. A small N2O-N emission increase for BP occurred in the spring after application; however, seasonal fluxes were low or negative. Mean CH4-C emissions ranged from 2 to 7 kg ha−1 yr−1 with no treatment differences. Lack of soil aeration appeared to be an important factor affecting seasonal N2O-N and CH4-C emissions. The results suggest that GHG models should account for field-level nutrient management factors in addition to soil aeration status.

1. Introduction

Climate change poses major sustainability challenges to agriculture. Greater frequency of weather extremes (excess heat and moisture or prolonged drought) associated with global climate change increases crop production risk and loss of nutrients in general. Agriculture itself contributes substantially to greenhouse gas (GHG) emissions in the US and globally, accounting for 9.6% of total US GHG emissions in 2019 [1,2,3,4]. Between 21 and 37% of GHG emissions are linked to food production systems globally [2]. The main agricultural GHGs are carbon dioxide (CO2), methane (CH4), and nitrous oxide (N2O). Approximately 60% of anthropogenic N2O emissions are attributed to agricultural soils [5].
Anthropogenic CH4 sources contributed approximately 61% of total global CH4 emissions in 2017, and 44% of the observed CH4 increases between 2006 and 2017 were attributed to enteric fermentation and manure associated with livestock production [6]. Per mole, N2O has 273 times the global warming potential (GWP) of CO2 (GWP = 1) for a 100-year timescale, whereas CH4 has a GWP of 27 [7].
Cropland GHG emissions are affected by climate, cover type, and land management, which interact with soil properties (i.e., drainage/texture, organic carbon content, and N fertility) [8,9,10,11,12,13]. Gross CO2 emissions reflect soil and root microbiological respiration and are broadly a function of hydroclimatic and soil properties; however, agronomic management, including tillage, manure application, and cropping system, also affects CO2 emissions [9,14,15]. While increased tillage intensity can increase CO2 emissions, lack of aeration from reduced and/or no-tillage systems can increase CH4 emissions [16].
In contrast to CO2, N2O emissions are more episodic in nature, with weaker correlations with temperature and weather-related variables [9,17,18]. Emission of N2O is associated with the denitrification process, whereby nitrate (NO3) is reduced to NO, N2O, or N2 [19,20]. While agroecosystem N2O emissions are generally small (0.1–3.1%), they are an important N loss mechanism and a potent GHG. Several studies note episodic N2O pulses during the growing season when rainfall follows N applications [13,20,21].
A water-filled pore space between 70 and 80% is considered ideal for N2O emission; however, emission rates also depend on the supply of nitrate (electron acceptor), gas diffusion rates, N availability, and soil pH [17,18,21,22,23,24]. Saha et al. [19] developed a machine-learning model that accounted for 65–89% of daily N2O flux variance based on a relatively small set of variables that included soil moisture, days after fertilization, soil texture, air temperature, soil carbon, precipitation, and N fertilizer rate. Manure type (solid or liquid) and nutrient characteristics are also important [23]. For example, Gregorich et al. [24] reported nearly 3-fold greater N2O-N losses after liquid manure was applied compared to semi-solid manure.
Emission of CH4 generally requires longer term water saturation and lower soil redox potentials [25,26] to stimulate methanogenesis, the microbial energy transduction pathway that reduces CO2 to CH4 in anaerobic soil zones [6]. The difference between CH4 production and oxidation to CO2 governs the CH4 available for diffusion to the atmosphere [26]. While wetlands are known CH4 sources, poorly drained agricultural soils can also be CH4 sources [12]. The amounts of CH4 lost directly from manure application processes are generally quite low compared to soil methanogenesis [8]. Fields in arid climatic regions tend to have lower CH4 emissions compared to humid areas [27,28]. Tillage intensity also affects CH4 emissions [24,29]. Omonode et al. [16] showed that chisel or moldboard plowed fields functioned as CH4 sinks, whereas no-till fields generated an average of 7.7 kg CH4-C ha−1 yr−1 from lack of tillage.
With respect to farm sustainability, animal manure is an important nutrient source for cropland; however, there is an urgent need to better quantify manure application impacts on GHG emissions and field nutrient use efficiency. Previous research in Wisconsin indicated that GHG emissions for conventionally tilled fields were greater in a high N growing environment; however, emissions were unaffected by tillage at a site with poor drainage and lower N availability [30]. We hypothesized that a large, one-time application of solid manure (bedded heifer pack manure, BP, or separated solids from liquid dairy manure, SDS) would increase CO2 and N2O emissions compared to a fertilizer N only control. Here, we quantified seasonal GHG emission differences for corn (Zea mays) plots receiving a large one-time fall application of BP or SDS compared to a fertilizer N only control.

2. Materials and Methods

The experiment was performed at the Marshfield Agricultural Research Station (MARS) in Stratford, Wisconsin. The station manages 350 ha of mixed forage crop and pastureland for research and is owned by the University of Wisconsin and the USDA-ARS Dairy Forage Research Center, Environmentally Integrated Dairy Management Research Unit in Marshfield, Wisconsin. The 30-year average (1986–2015) annual temperature and precipitation are 6.9 °C and 875 mm, respectively. Soils at the site and in the region are largely derived from loess and silty alluvium mapped as Alfisols [31]. Our experiment was conducted on a Withee silt loam (fine-loamy, mixed, superactive, frigid Aquic Glossudalfs) with a dense B horizon restricting internal drainage at approximately 30 cm.
Gleization is typical in the top 25 cm, with glossic horizons and stark redoximorphic features/mottling indicating a shallow, seasonally high water table [31]. Twelve plots (9.2 × 4.6 m) arranged in four blocks were established in spring 2020 when the whole field (10 ha) was managed in ryegrass (Lolium multiflorum). Treatments (control, BP, and SS) were randomly assigned to plots, and a 1.5 m buffer that received no manure or fertilizer separated blocks and plots within blocks.

2.1. Manure Treatments and Agronomic Considerations

The MARS facility includes a 150-cow dairy with heifer raising facilities. Lactating cow manure is pumped through a screw-press separation system (Fan/Bauer, Upper Bavaria, Germany), and liquid manure is stored in a clay-lined earthen lagoon. Separated dairy solids (SDS) are used for bedding or land applied. Manure from the heifer facility (BP) was a mix of manure and sawdust bedding, scraped daily from pens and pushed out of the barn. Samples of each manure type were collected in 2020 and analyzed for dry matter/solids content (dried for 48 h at 55 °C) and total N and total carbon (C) via high-temperature combustion using a carbon/nitrogen analyzer (Elementar, Ronkonkoma, NY, USA) to determine field application rates based on providing a total N application rate of 300 kg N ha−1. Manure samples were also sent to the University of Wisconsin’s Soil and Forage Analysis Laboratory for determination of potassium (K), total P, and sulfur (S) analysis [32]. The application rates for BP and SDS, respectively, were 18.4 and 19.4 Mg ha−1 of dry manure solids.
University of Wisconsin’s soil fertility system [33] was used to estimate manure N availability, where 25% of total manure N mass applied (75 kg N ha−1) is assumed to mineralize to plant-available N (i.e., nitrate-N and ammonium-N) during the growing season. Residual manure N credits for second (10% of manure total N applied) and third year (5% of manure total N applied) contributions (2022 and 2023). Since manure was applied during fall, when temperatures were cooling down, the 25% manure N availability was assumed for the next spring’s rotation to corn in 2021. Manure was hand-applied on 14 September 2020.
Manure was transferred from two premixed piles to experimental plots using 18.9 L buckets. After all manure was applied, garden rakes were used to evenly distribute manure across plots. Plots remained undisturbed until the following spring when corn was no-till planted, except for GHG sampling. It is important to note that manure was applied in the fall because it is a common practice for dairy farms in the region, as fields are generally too wet in the spring to apply manure without compaction damage.
In spring 2021, plots were sprayed with 0.39 L ha−1 of glyphosate, 0.91 kg ha−1 of ammonium sulfate, and 1.2 L ha−1 of haloxyfop on 13 May 2021. The same herbicide mixture and application rates were used in 2022 and 2023, applied about one week before planting. Corn was planted (for silage harvest) with a six-row no-till corn planter (John Deere, Moline, IL, USA) at a 5 cm planting depth. In 2021, corn (Prairie Estates, G2922) was planted on 13 May 2021 at a seeding rate of 80,275 seeds ha−1. Corn (Pioneer 9188) was planted on 6 June 2022 at 71,000 seeds ha−1 (5 cm depth). In 2021 and 2022, 190 kg ha−1 of 15-8-21 (N-P2O5-K2O) dry granular fertilizer was applied via the corn planter as a starter fertilizer. In 2023, corn (Dairyland 3022AM) was planted on 2 May 2023 at 80,275 seeds ha−1 (5 cm depth), and 202 kg ha−1 of 18-10-21-6 (N-P2O5-K2O-S) granular fertilizer was applied as a starter through the planter. Control plots received the same starter fertilizer and 80 kg N ha−1 of surface-applied urea (46-0-0) each season when corn was between 60 and 80 cm in height (typically mid-July). No additional N was applied to BP or SDS plots, except the small amount of starter fertilizer at planting.
Corn yield was estimated by hand-harvesting the middle two corn rows each fall when test samples taken from the outside rows were approaching 35% moisture content. Corn plants were cut to leave 30 cm of stalk above the ground. Corn samples were run through a chopper, collected in tubs, and weighed using a portable scale. Freshly chopped subsamples at each harvest (2021–2023) were taken back to the laboratory and dried at 55 °C to determine moisture content.

2.2. Greenhouse Gas Emission Measurements

Nitrous oxide, CO2, and CH4 were measured using the static vented chamber technique following the GRACEnet protocol [34,35]. One stainless-steel chamber base was installed per plot (61 × 38.1 × 10.2 cm). Details on the chambers and the method have been reported previously [36,37,38,39]. Briefly, the chamber bases were inserted in the ground, so that approximately 3 cm remained above the soil surface. Insulated stainless-steel lids were sealed with weather stripping on top of the bases during measurement by clipping the steel lids to bases with binder clips. Frames were connected to a portable closed-path Fourier transform infrared spectrophotometer (FTIR, Gasmet DX4040, Vantaa, Finland) with 0.64 cm quick-connect fittings for FTIR tubing to measure GHG concentrations. Gas samples were pumped through 4 m long 4 mm ID PTFE tubing to the FTIR and back into the chamber as part of the closed loop. For each event, GHG concentrations were determined over a 7 min period and with field measurements approximately once every 10–14 days (between 0800 h and 1300 h).
Gas fluxes were computed from the rate of change in concentration over the sampling period using linear regression with R2 values typically >0.99. Annual cumulative flux was estimated using linear interpolation between events [35]. It is important to note that the method permits estimates of both GHG production and consumption (sometimes referred to as negative fluxes), which is important for CH4 and N2O fluxes [34,35]. Precipitation and air temperature were measured by a weather station at the field edge (Spectrum Technologies, Aurora, IL, USA). Plot-level soil volumetric moisture content and temperature were measured (Delta-T Devices, Cambridge, Cambridgeshire, UK) at a 5 cm depth. In 2021, day 167 was the last measurement before a 100-day gap when the FTIR had a technical issue; measurements resumed on day 267 after FTIR was repaired.

2.3. Agronomic Soil Testing

Soil samples were taken at multiple depth intervals from each plot in September 2020 while plots were still in grass to determine background differences in soil fertility prior to manure addition. Soil samples were taken from each plot (2 cm diameter) at depths of 0–5, 5–15, and 15–30 cm. Samples were sent to the University of Wisconsin for standard soil test analysis (organic matter content, 1:1 pH, and Bray-1 extractable P and K) following standard procedures [32,33]. In addition, samples were also analyzed at the ARS laboratory for total carbon and N by dry combustion (Elementar, Ronkonkoma, NY, USA). During the corn phase (2021–2023), 30 cm long × 2 cm wide soil sample cores were taken from control plots to determine extractable (2 M KCl) soil nitrate-N (NO3-N) and ammonium-N (NH4+-N) concentrations via automated flow injection (Lachat 8500 series II, Hach, Loveland, CO) using standard techniques [40,41]. This was performed to determine fertilizer N requirements. Since no further N additions were planned for BP and SDS plots, NH4+-N and NO3-N were only measured in the control plots.

2.4. Statistical Analysis

Plots were arranged in a randomized complete block design with 4 replications/treatment. All statistical analyses were conducted using the Statistical Analysis System [42]. The dependent variables included pre-manure soil fertility, event-based GHG emissions (2020–2023), and seasonal GHG emissions. The main effect of manure type on GHG emission was assessed using the generalized linear mixed modeling procedure (proc glimmix) in SAS. Manure type was treated as a fixed effect and block as a random effect. Proc glimmix accommodates normally (i.e., Gaussian) and non-normally distributed variables. The log-link function and dual quasi-Newton optimization were used with the proc glimmix procedure. When glimmix models failed to converge, proc mixed was used with restricted maximum likelihood estimation. To simplify event-based GHG emission analyses, proc glimmix was also applied on an event basis in addition to repeated measures. Least square means were separated using the smm statement. Statistical significance was declared at p ≤ 0.05. Pearson correlation coefficients and simple linear regression were also performed on select variables.

3. Results and Discussion

3.1. Weather Conditions

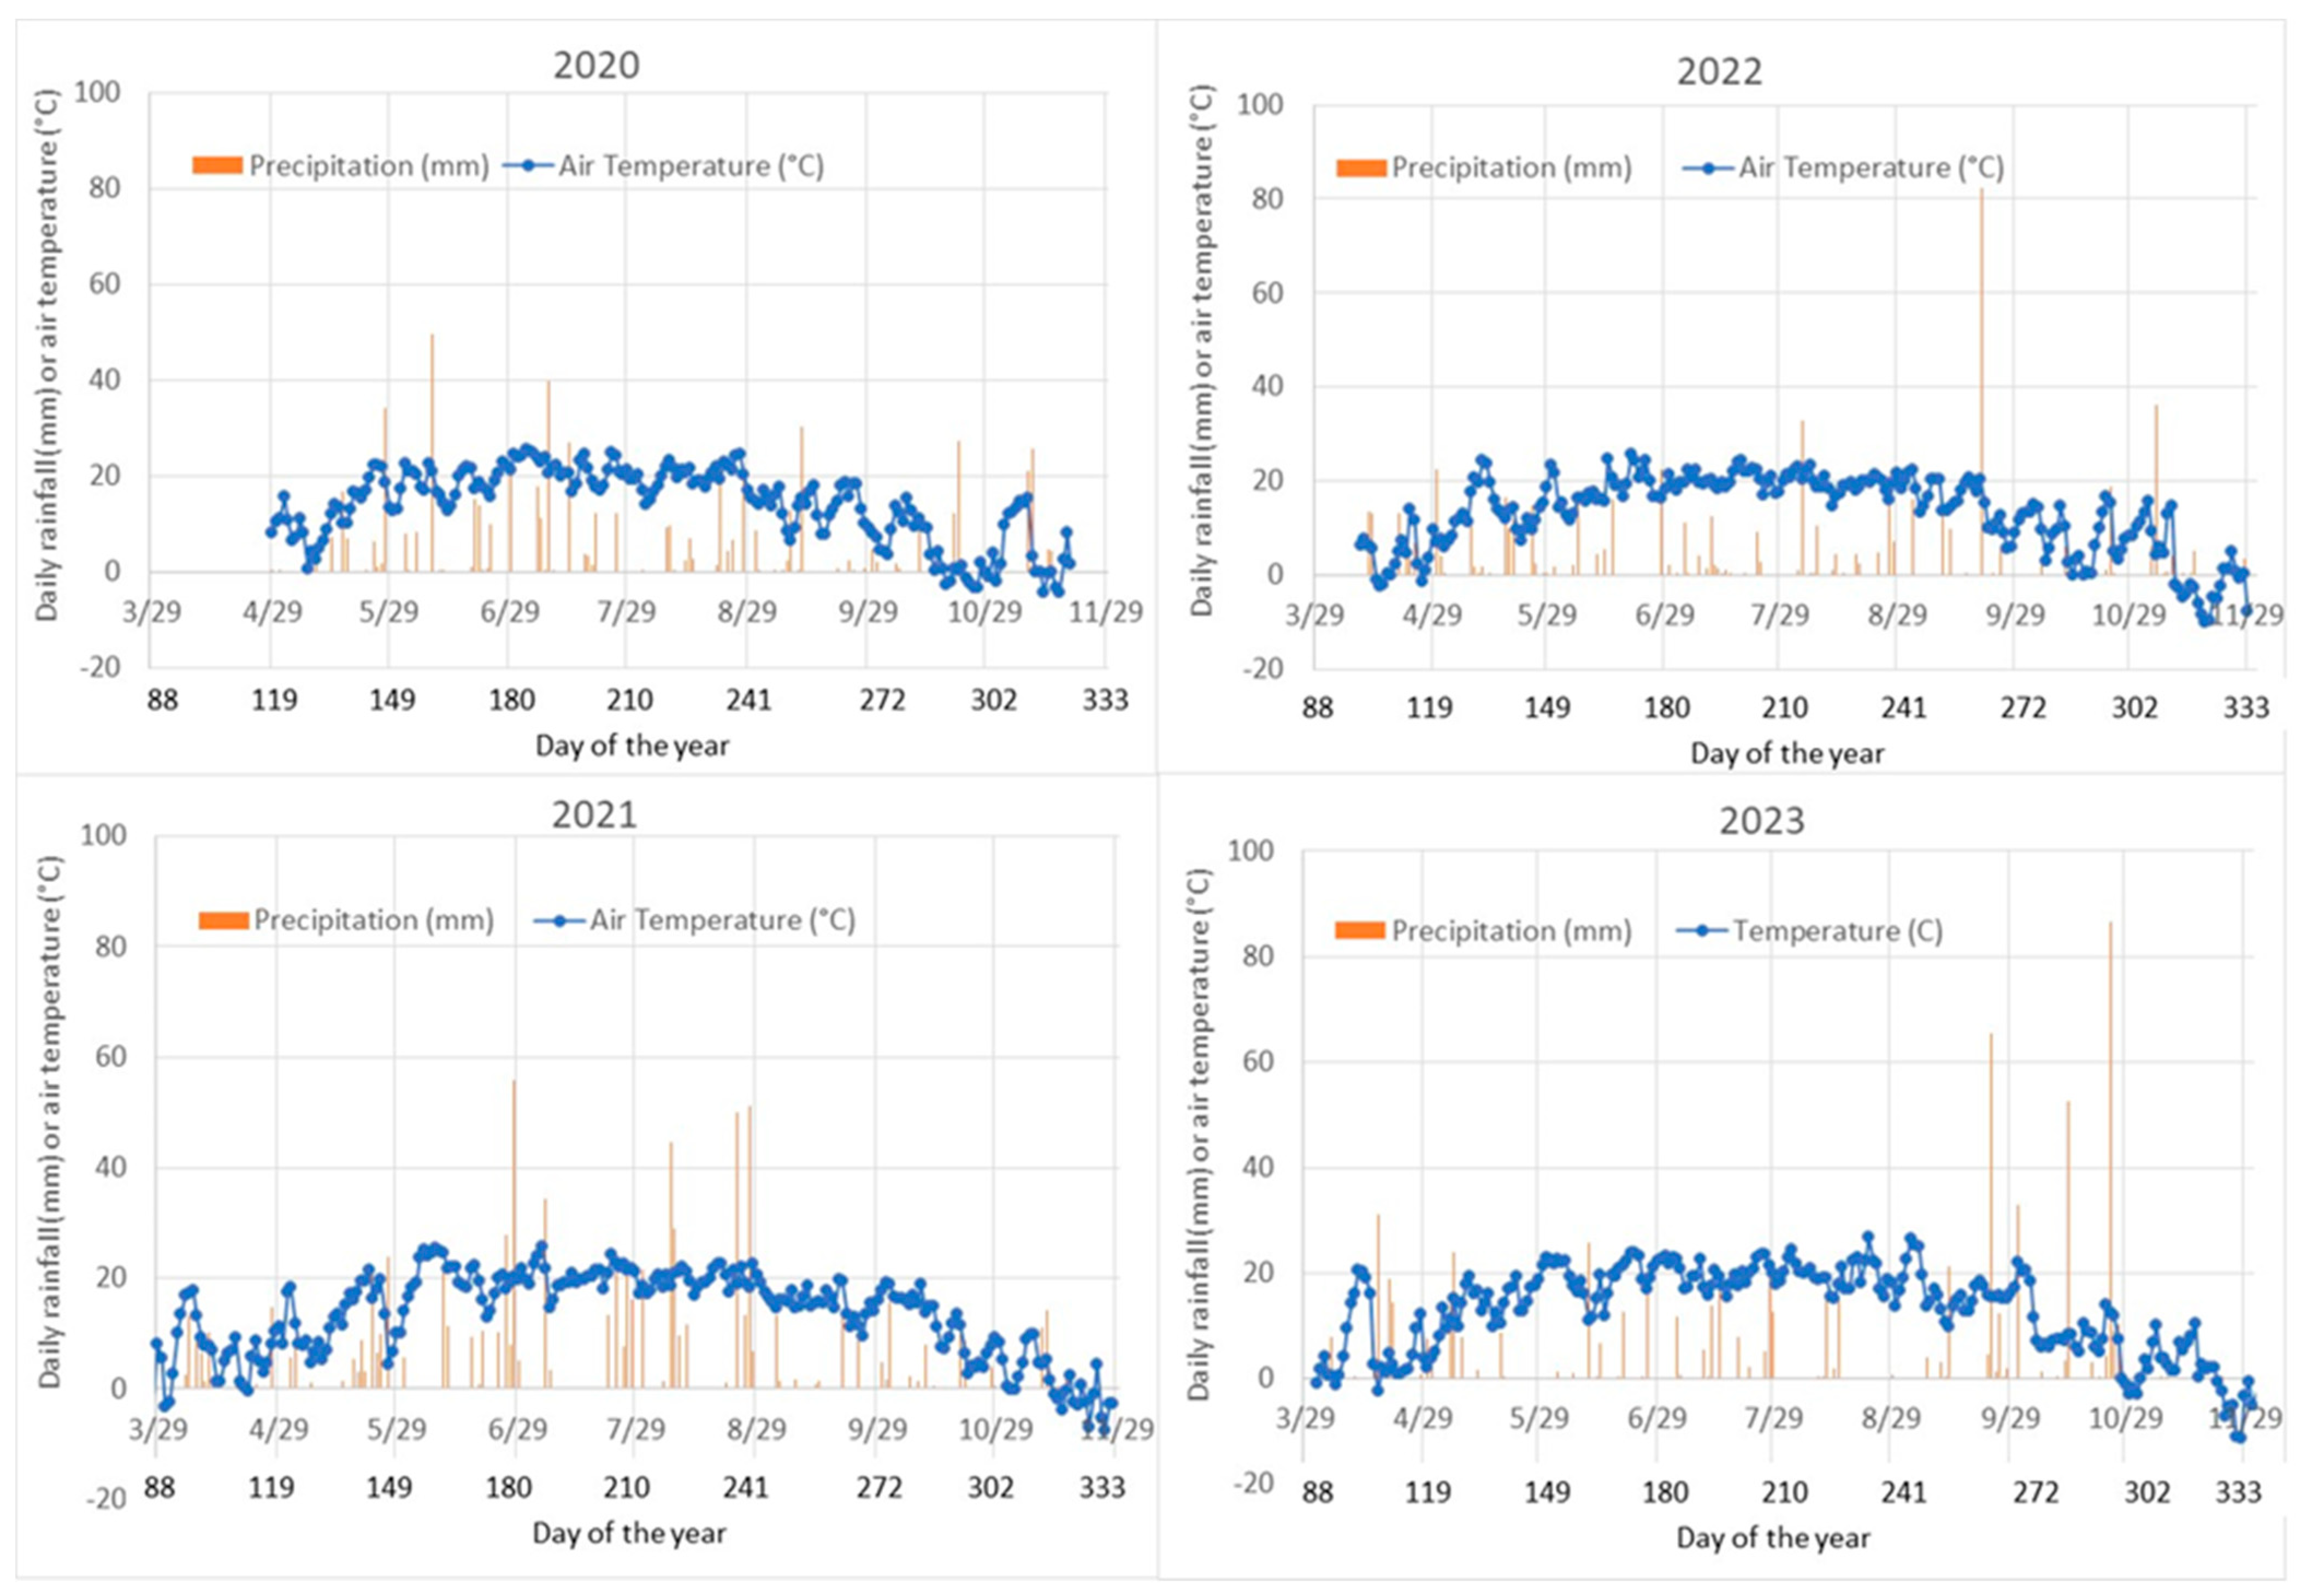
Weather conditions were characterized by substantially cooler temperatures compared to 30-year means (averaged over 1981–2010; Table 1). June and October 2021 were the exceptions and were 1.5 and 2.5 °C warmer than the long-term average. In addition, 2021 was wetter than normal from May to August. In contrast, much of the spring and summer of 2022 and 2023 were drier than normal. September and October 2023 had above-normal precipitation. The daily temperature and rainfall are presented in Appendix A.

3.2. Soil Properties

Soil organic matter content, pH, Bray-1 extractable P and K, total C, and total N did not differ statistically before manure application (Figure 1). Soil pH was slightly lower at the 0–5 cm depth compared to the two deeper depths (Figure 1). Organic matter content, total C and N, Bray-1 P, and Bray-1 K were greater at 0–5 cm, showing marked nutrient stratification, which is typical of hay production/no-till fields from the lack of tillage and mixing of soil layers [24].

3.3. Applied Manure Nutrients

Application of BP and SDS resulted in substantial inputs of dry matter solids, C, N, P, K, and S to manure-treated plots (Figure 2). The total N applied was close to the target rate of 300 kg ha−1. Since manure application rates were based on total N application, slightly more total C, dry matter solids, and S were applied in the SDS treatment. The greatest difference in nutrient application was K, where BP application resulted in 142 kg ha−1 more total K added than SDS (Figure 2).

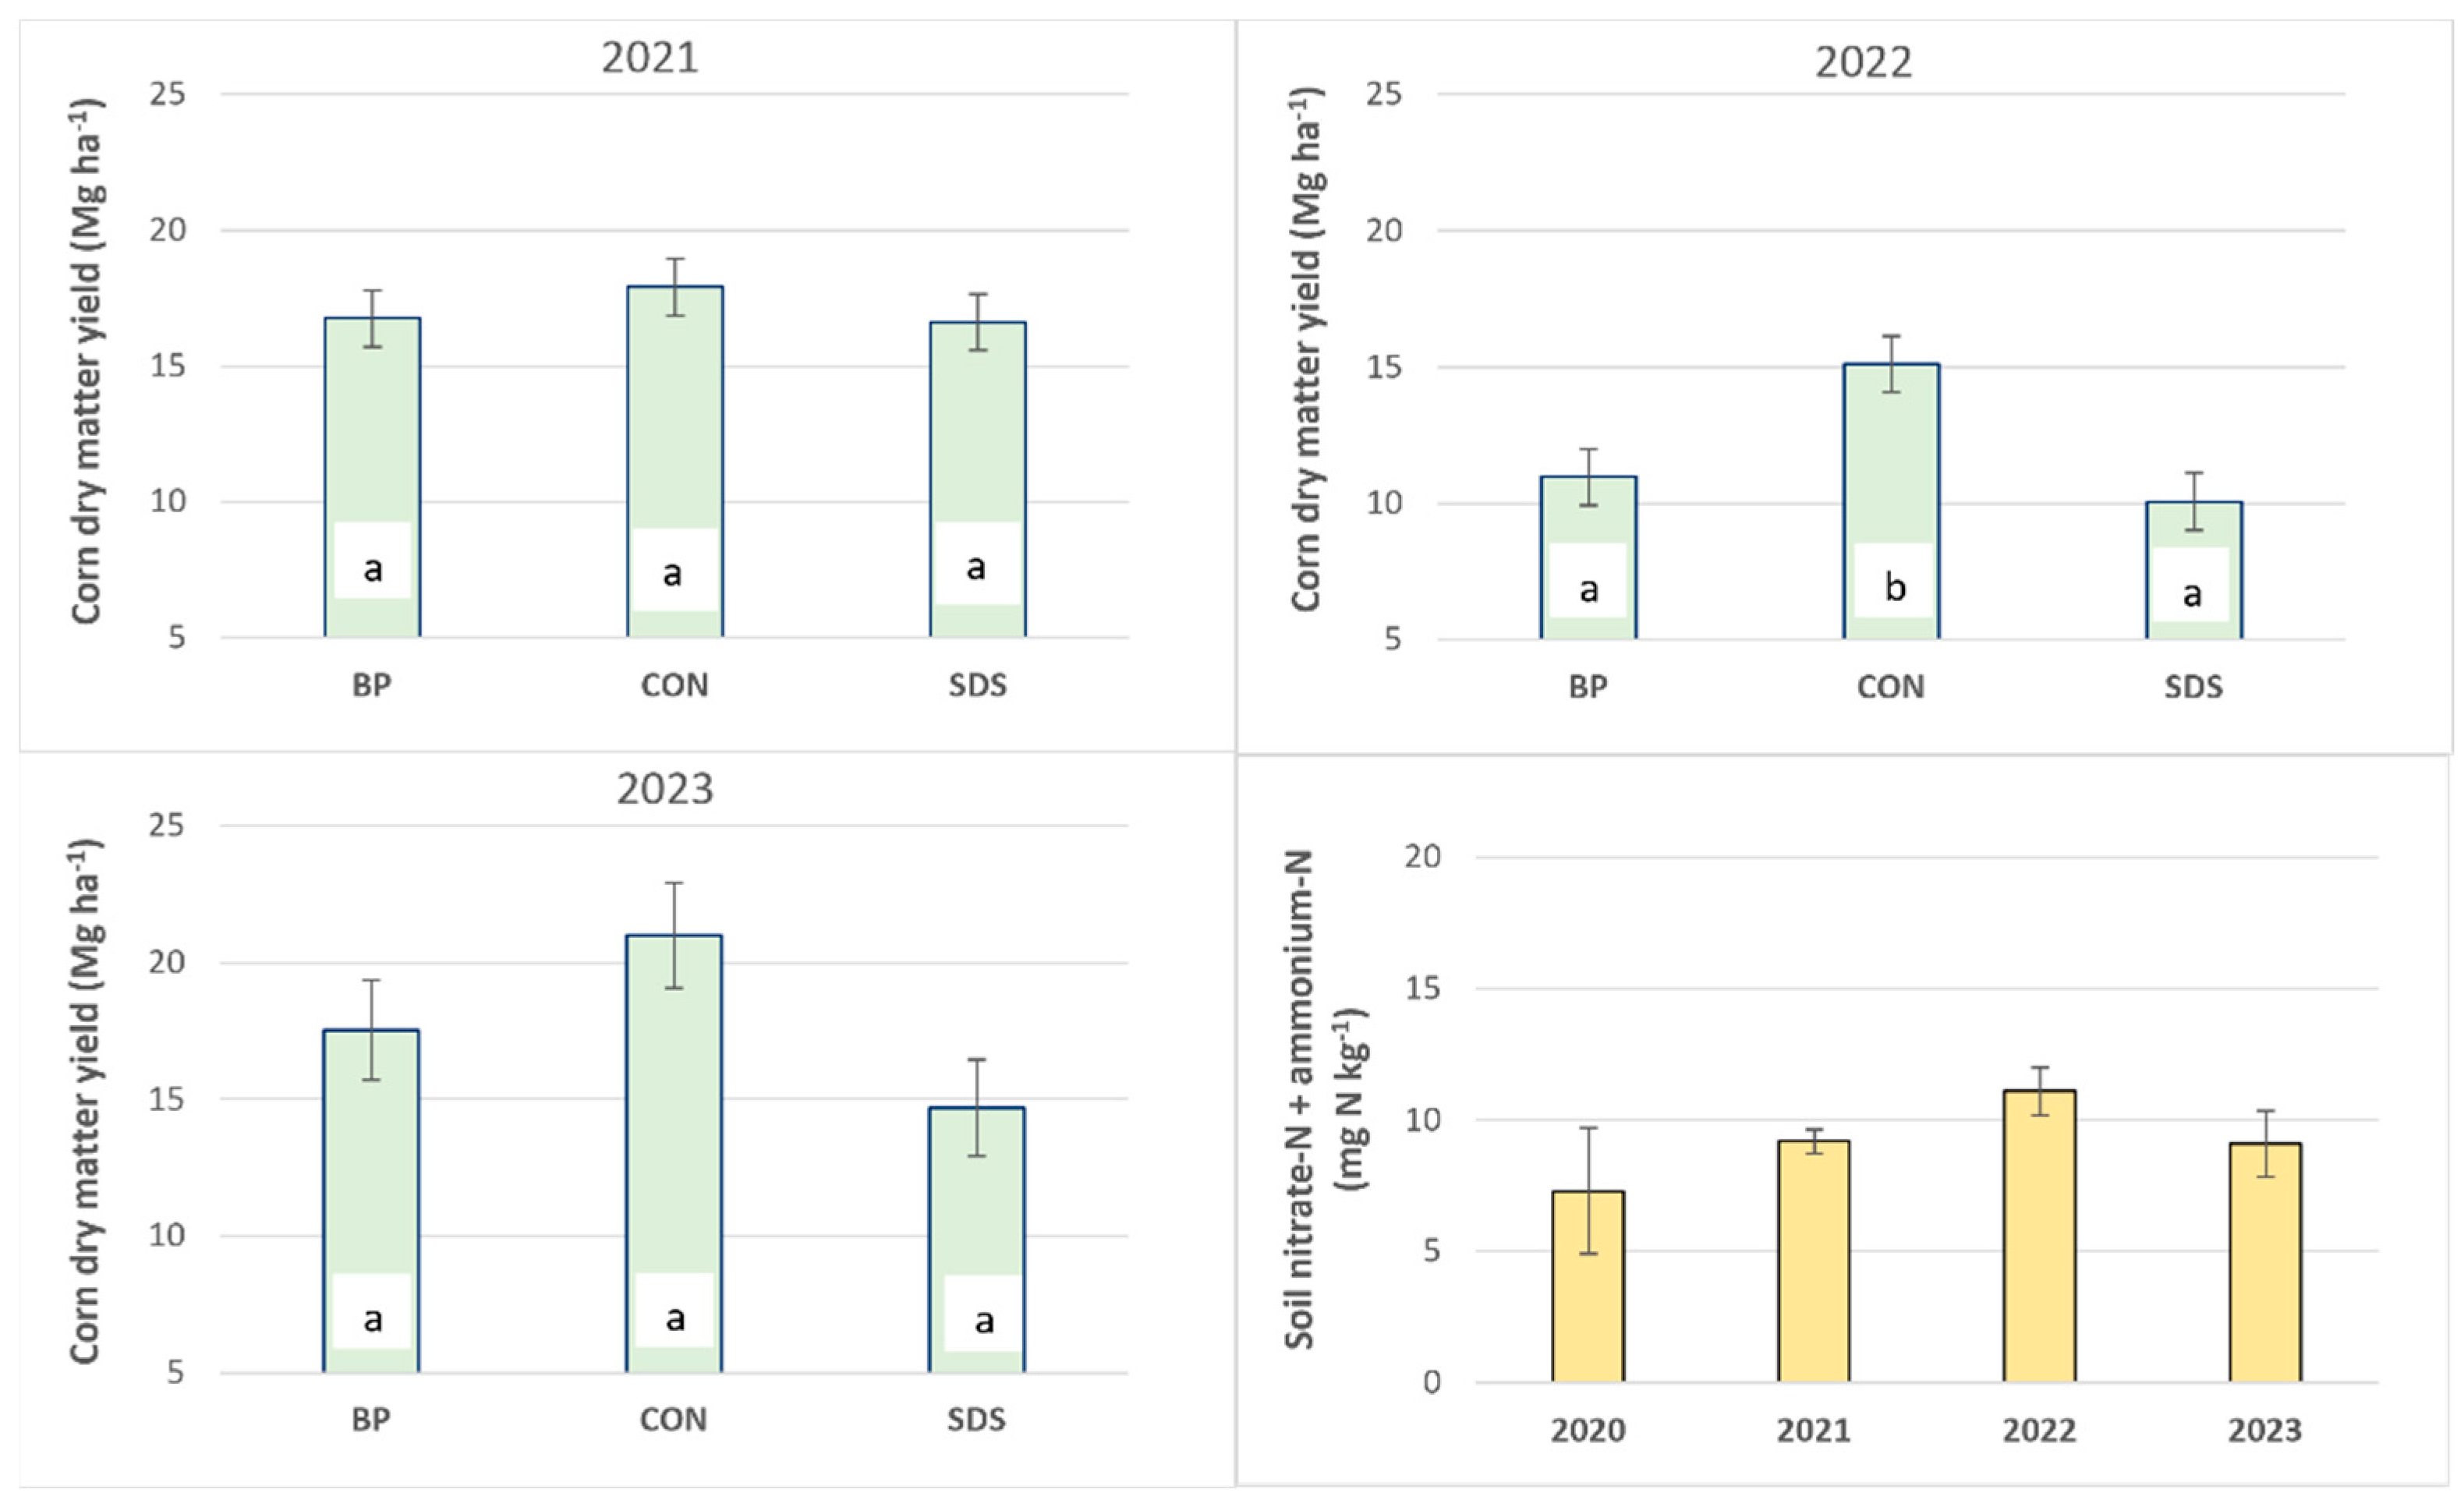
3.4. Corn Silage Yield

Corn silage yield ranged from 10 to >20 Mg ha−1 (dry yield) across the years (Figure 3). BP and SDS yields did not differ from the control yield in the first year after application in 2021. In 2022, the corn yields were lower and likely related to below-average precipitation for June and July (Table 1). The control plot corn silage yield was significantly greater than BP and SDS in 2022, indicating a lack of available N in manured plots compared to control, which received 80 kg N ha−1 yr−1 broadcast as urea. The lack of moisture in June and July 2022 probably reduced yields that season. Thus, it is clear that manure application contributed the available N to the corn crop but was insufficient to maximize yield under our study conditions.
Yields were greater in 2023 compared to 2021 or 2022, likely related to weather conditions; however, there were no significant differences among corn yields (Figure 3).
Soil NO3 and NH4+ concentrations in the control plots showed low available N status each year (Figure 3). Since 30 cm soil cores were taken for these samples when corn was between V3 and V6, and both NO3 and NH4+ were measured, these concentrations reflect the pre-sidedress soil N test (PSNT) for assessing additional corn N need [43]. The PSNT critical level is between 20 and 25 mg N kg−1 or approximately 2.5-fold greater than the average concentrations in our study, confirming the low soil-available N status of these soils (Figure 3).

3.5. Greenhouse Gas Emissions: Carbon Dioxide

In 2020, when plots were in ryegrass, the control tended to have numerically larger CO2-C emissions than BP or SDS between day 150 and manure application on day 265 (Figure 4).
There were no differences among treatments from day 269 to day 317 (November 19) in 2020. The larger CO2-C emission from day 265 to day 269 was likely driven by the 2.7 °C increase in soil temperature from the previous event.
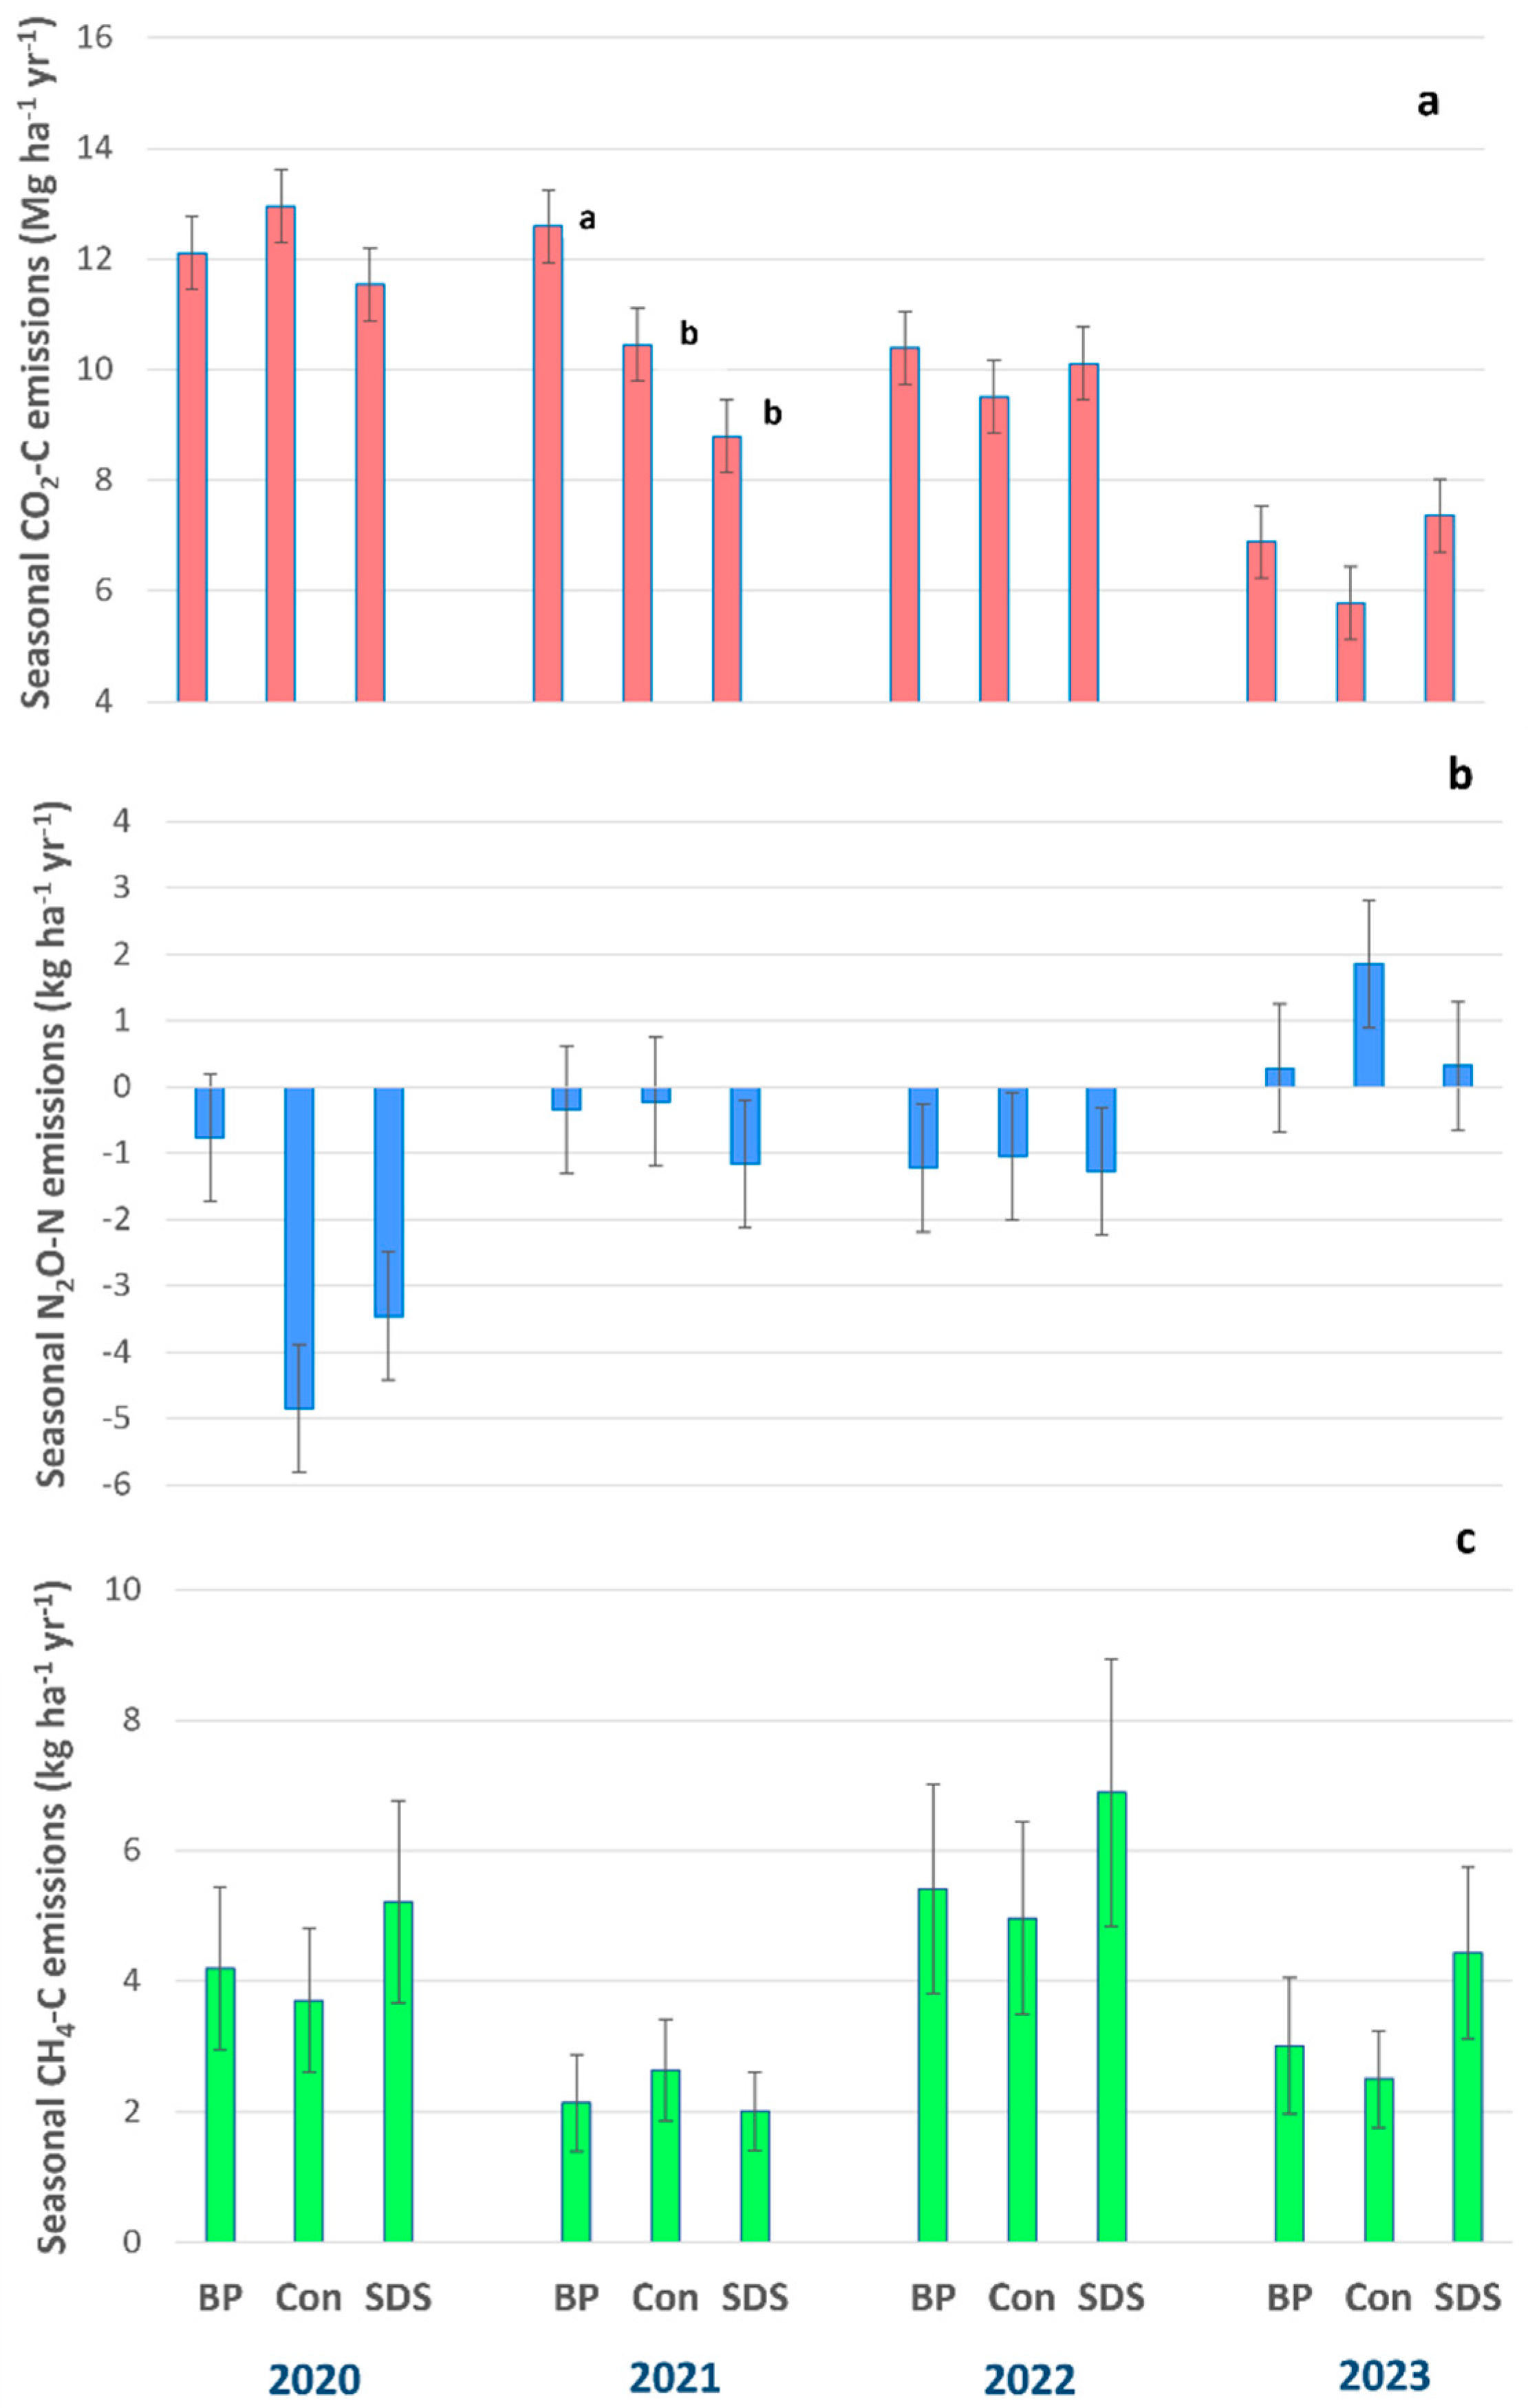
The mean CO2-C emissions for BP from day 119 to day 264 in 2021 were numerically larger (Figure 4). The mean CO2-C emission was numerically larger for BP on days 153, 159, and 167 in 2021 and on days 158, 273, and 286 in 2022 (Figure 4). In 2023, CO2-C emissions for BP and SDS were consistently larger than control plots between days 150 and 272. Overall, the results indicate that CO2-C emission increased with BP and SDS addition compared to urea only. With respect to seasonal totals, BP had significantly greater CO2-C emission than the control or SDS in 2021, but it displayed no differences in other years, and cumulative emissions did not differ in the study (Figure 5). Greater manure C inputs likely contributed to larger CO2-C emission for BP and SDS, whereas the control plots received no exogenous organic C, only fertilizer.
The correlations between soil temperature and CO2 emissions are well documented [8,9,14,15,26]. Combining the treatments for the study duration showed that changes in CO2 emissions were linearly related to soil temperatures (R2 = 0.33, p ≤ 0.001). Omonode et al. [16] also reported significant correlations between CO2-C fluxes and soil temperature and moisture, although the variation accounted for by either variable was ≤27%. There was no correlation between soil moisture and CO2-C emission in our study, which could be related to the poor drainage and relative abundance of soil water that could facilitate respiration.
Emissions of CO2-C decreased linearly (R2 = 0.79, p < 0.0001) from 2020 to 2023 across treatments at an average rate of −0.43 Mg CO2-C ha−1 yr−1, indicating that respiration decreased with the number of years in corn silage production. Other studies have also reported larger CO2 emissions for perennial crops compared to corn, and they support our findings [14,27,44]. Dungan et al. [28] reported nearly 2-fold greater CO2 emissions from alfalfa compared to corn for an irrigated semi-arid climate in Idaho. Ryegrass termination in our experiment likely contributed to elevated CO2 emissions in 2020 and 2021 and may have confounded our ability to clearly detect additional CO2 fluxes from BP and SDS decomposition/mineralization.
The effects of manure application on CO2 emission are variable and depend on site-specific factors, including the hydroclimatic region, weather, soil type/properties, and crop management. For example, Omonode et al. [16] showed little impact of tillage type (chisel, moldboard, and no-till) on the annual GHG emissions from corn plots in Indiana. Hernandez-Ramirez et al. [8] evaluated GHG emissions in continuous corn and corn rotated with soybeans and either fertilized during the season with urea-ammonium nitrate or liquid swine manure and reported no treatment differences. In a semi-arid cropping system in southern Idaho, Dungan et al. [27] showed that CO2-C emissions were greater in fields receiving fall and spring dairy manure compared to applications of urea only, and their results support our findings here.

3.6. Nitrous Oxide Emissions

The average N2O-N fluxes before manure application in 2020 were low or negative, with plots following similar emission patterns until manure was applied on day 265 (Figure 6). There was a clear effect of BP application on N2O-N emission, with the largest individual N2O-N flux (0.61 kg N2O-N ha−1 for BP) measured for the study occurring 4 days after application (day 269) (Figure 6). While BP induced a few positive N2O-N fluxes in the fall after application, the mean N2O-N emission remained close to zero.
Interestingly, both the control and SDS had their largest N2O consumption rates (negative fluxes) in the fall after application. Several authors have stressed the importance of quantifying N2O-N consumption and including it when estimating seasonal N2O-N emissions [13,17,18,21].
The greatest N2O consumption for the control and SDS was measured in the fall after application. It is possible that this was related to a lack of mineralization/nitrification with decreasing fall temperatures or that denitrification was able to effectively reduce NO3 efficiently to N2 without N2O emission. Poorly drained soils transform NO3 to N2 more efficiently than well-drained, aerated soils [16,17,18,45]. It is important to note that saturated soils are not necessary for denitrification and reduction of NO3 to N2. Studies suggest that a water-filled pore space between 70 and 80% is ideal for N2O emission; however, this depends on other soil properties, including the pH, gas diffusion rates, and labile carbon [17,18].
In 2021, N2O-N emission remained consistently low to negative, ranging from −0.05 to < 0.10 kg N2O-N ha−1. The patterns of N2O-N emission in 2022 and 2023 were similar, with no significant differences between treatments on any sampling date and similar N2O-N emission ranges over the season (Figure 7). When summed over seasons, the mean N2O-N emissions were negative, except for 2023, when they were close to zero (Figure 5).
Across seasons, N2O consumption decreased significantly (R2 = 0.53, p = 0.007), indicating that N2O consumption rates decreased with time. We also found a moderate but significant positive relationship between corn silage yield and N2O-N emissions (R2 = 0.24, p = 0.006) across all study years. In a two-year study, Sadeghpour et al. [23] evaluated N2O and mean corn grain yields in New York for separated manure solids, liquid dairy manure, and a fertilizer N only treatment and reported highly significant relationships between corn grain yield and N2O emissions (R2 = 0.89–0.94). While the relationship in our study was weaker, it nonetheless suggests that soil moisture variance influenced both corn yields and N2O dynamics, as the Sadeghpour et al. [23] study demonstrated, with higher corn yields and N2O emissions for the better drained plots on average.
There was no significant correlation between soil moisture and N2O-N emission in our study. As discussed, poorly drained soils in general have a higher propensity to convert NO3 to N2 relative to better aerated soils [17,18,20]. It is possible that the poorly drained conditions in our experiment promoted more denitrification than expected based on soil moisture alone, since denitrification can occur readily across a range of soil moisture contents, including field capacity [18,20]. Moreover, in our experiment, no tillage in combination with poor drainage and relatively high surface-soil organic matter content presumably provided ample labile C for denitrifying bacteria to convert NO3 to N2, hence limiting N2O emissions in general and possible correlations with changes in water content.
The broadcast application of solid manure may have further reduced N2O-N emissions. Liquid dairy manure has a higher inorganic N/organic N ratio and greater N2O-N emission potential in general than solid dairy manure, particularly when injected into the soil [22,23,36,37,38,39]. Whereas we found net N2O consumption, Kazula and Lauer [30] reported N2O-N emissions ranging from 1.2 to 1.7 kg N2O-N ha−1 for tilled corn with fertilizer N applied, with no emission differences among three rotations (continuous corn, corn–soybean, or corn–soybean–wheat).
These differences point to the importance of GHG models accounting for soil type to improve N2O emission predictions, especially in large, variably drained fields. Better quantification of N2O and other tradeoffs from manure application, such as runoff water quality and soil health, are critical to foster higher adoption of sustainable farming practices. Saha et al. [46] showed that manure application and termination of a legume-rich cover crop caused a microbial “priming effect” that increased respiration and oxygen consumption, inducing large N2O-N emission spikes in a Pennsylvania organic cropping systems trial. When the cover crop was harvested before corn planting to prevent co-location of manure and biomass, N2O-N emissions decreased by 60%. Therefore, managing manure and organic inputs for well-drained soils is more critical for N2O-N emission mitigation compared to poorly drained conditions.

3.7. Methane Emissions

Unlike N2O, CH4-C emissions were consistently positive (i.e., more emission than consumption), with no differences among treatments prior to manure application in 2020 (Figure 6). There was also considerable CH4-C emission in 2021, 2022, and 2023 (Figure 6 and Figure 7). A large spike between days 175 and 200 for all treatments occurred in 2022, likely related to rainfall during this period; 13 out of 26 days had rainfall, with a total of 59.9 mm of precipitation (Figure 8, Figure 9 and Figure A1). The increase in rainfall/soil moisture under warm soil conditions likely drove higher CH4-C emission due to a decrease in redox potential [25].
Interestingly, CH4-C emission occurred across a range of soil moisture contents, indicating active methanogenesis even though soils were often in the range of field capacity with respect to soil moisture status. This background methanogenesis resulted in considerable seasonal fluxes (2–7 kg CH4-C−1 yr−1) measured in our study (Figure 5). Drainage affects CH4 background emissions from agricultural fields and adjoining lands. Kandel et al. [47] reported high CH4-C emission (172 kg CH4-C ha−1 yr−1) from a natural undrained peatland in Denmark, whereas nearby crop fields with tile drainage had close to net zero emissions (−1.5 to 1.5 CH4-C ha−1 yr−1). Such difference stresses the critical importance of factoring in soil type and drainage conditions in agroecosystem CH4-C fluxes. Interactions between hydroclimatic and agronomic factors can confound independent assessments of manure and tillage effects. In more semi-arid regions, for example, a greater likelihood of CH4-C oxidation may prevail, regardless of manure addition [27,28], whereas manure addition in more humid climates may increase CH4-C emissions above background levels [24].
The consistent CH4-C emission measured in our experiment confirms limited aeration in these soils and suggests that the redox potentials were low enough to support active methanogenesis (≈−150 to −160 mV) in portions of the profile. In a laboratory study, Wang et al. [25] demonstrated a 475-fold increase in CH4-C emission with a change in redox potential from +10 to −230 mV. The lack of tillage in our study may have further enhanced CH4-C emission, since tilling imperfectly drained soils enhances aeration, at least in the short term [8,16,24,26]. Alluvione et al. [48] reported nearly 20-fold greater CH4-C emission from no-till treatments compared to conventionally tilled plots, with no effect of N fertilization or crop rotation. We hypothesize that poor drainage was the overriding factor affecting CH4-C emissions at this site. Moreover, no-till leaves more residue on the surface, conserving moisture and C in surface-soil layers compared to tilled fields, which may have further enhanced CH4 emission. The results stress the need for GHG models to capture changes in soil type and landscape heterogeneity to improve delineation among CH4 sources and sinks in agricultural fields [49].

3.8. Soil Moisture and Temperature

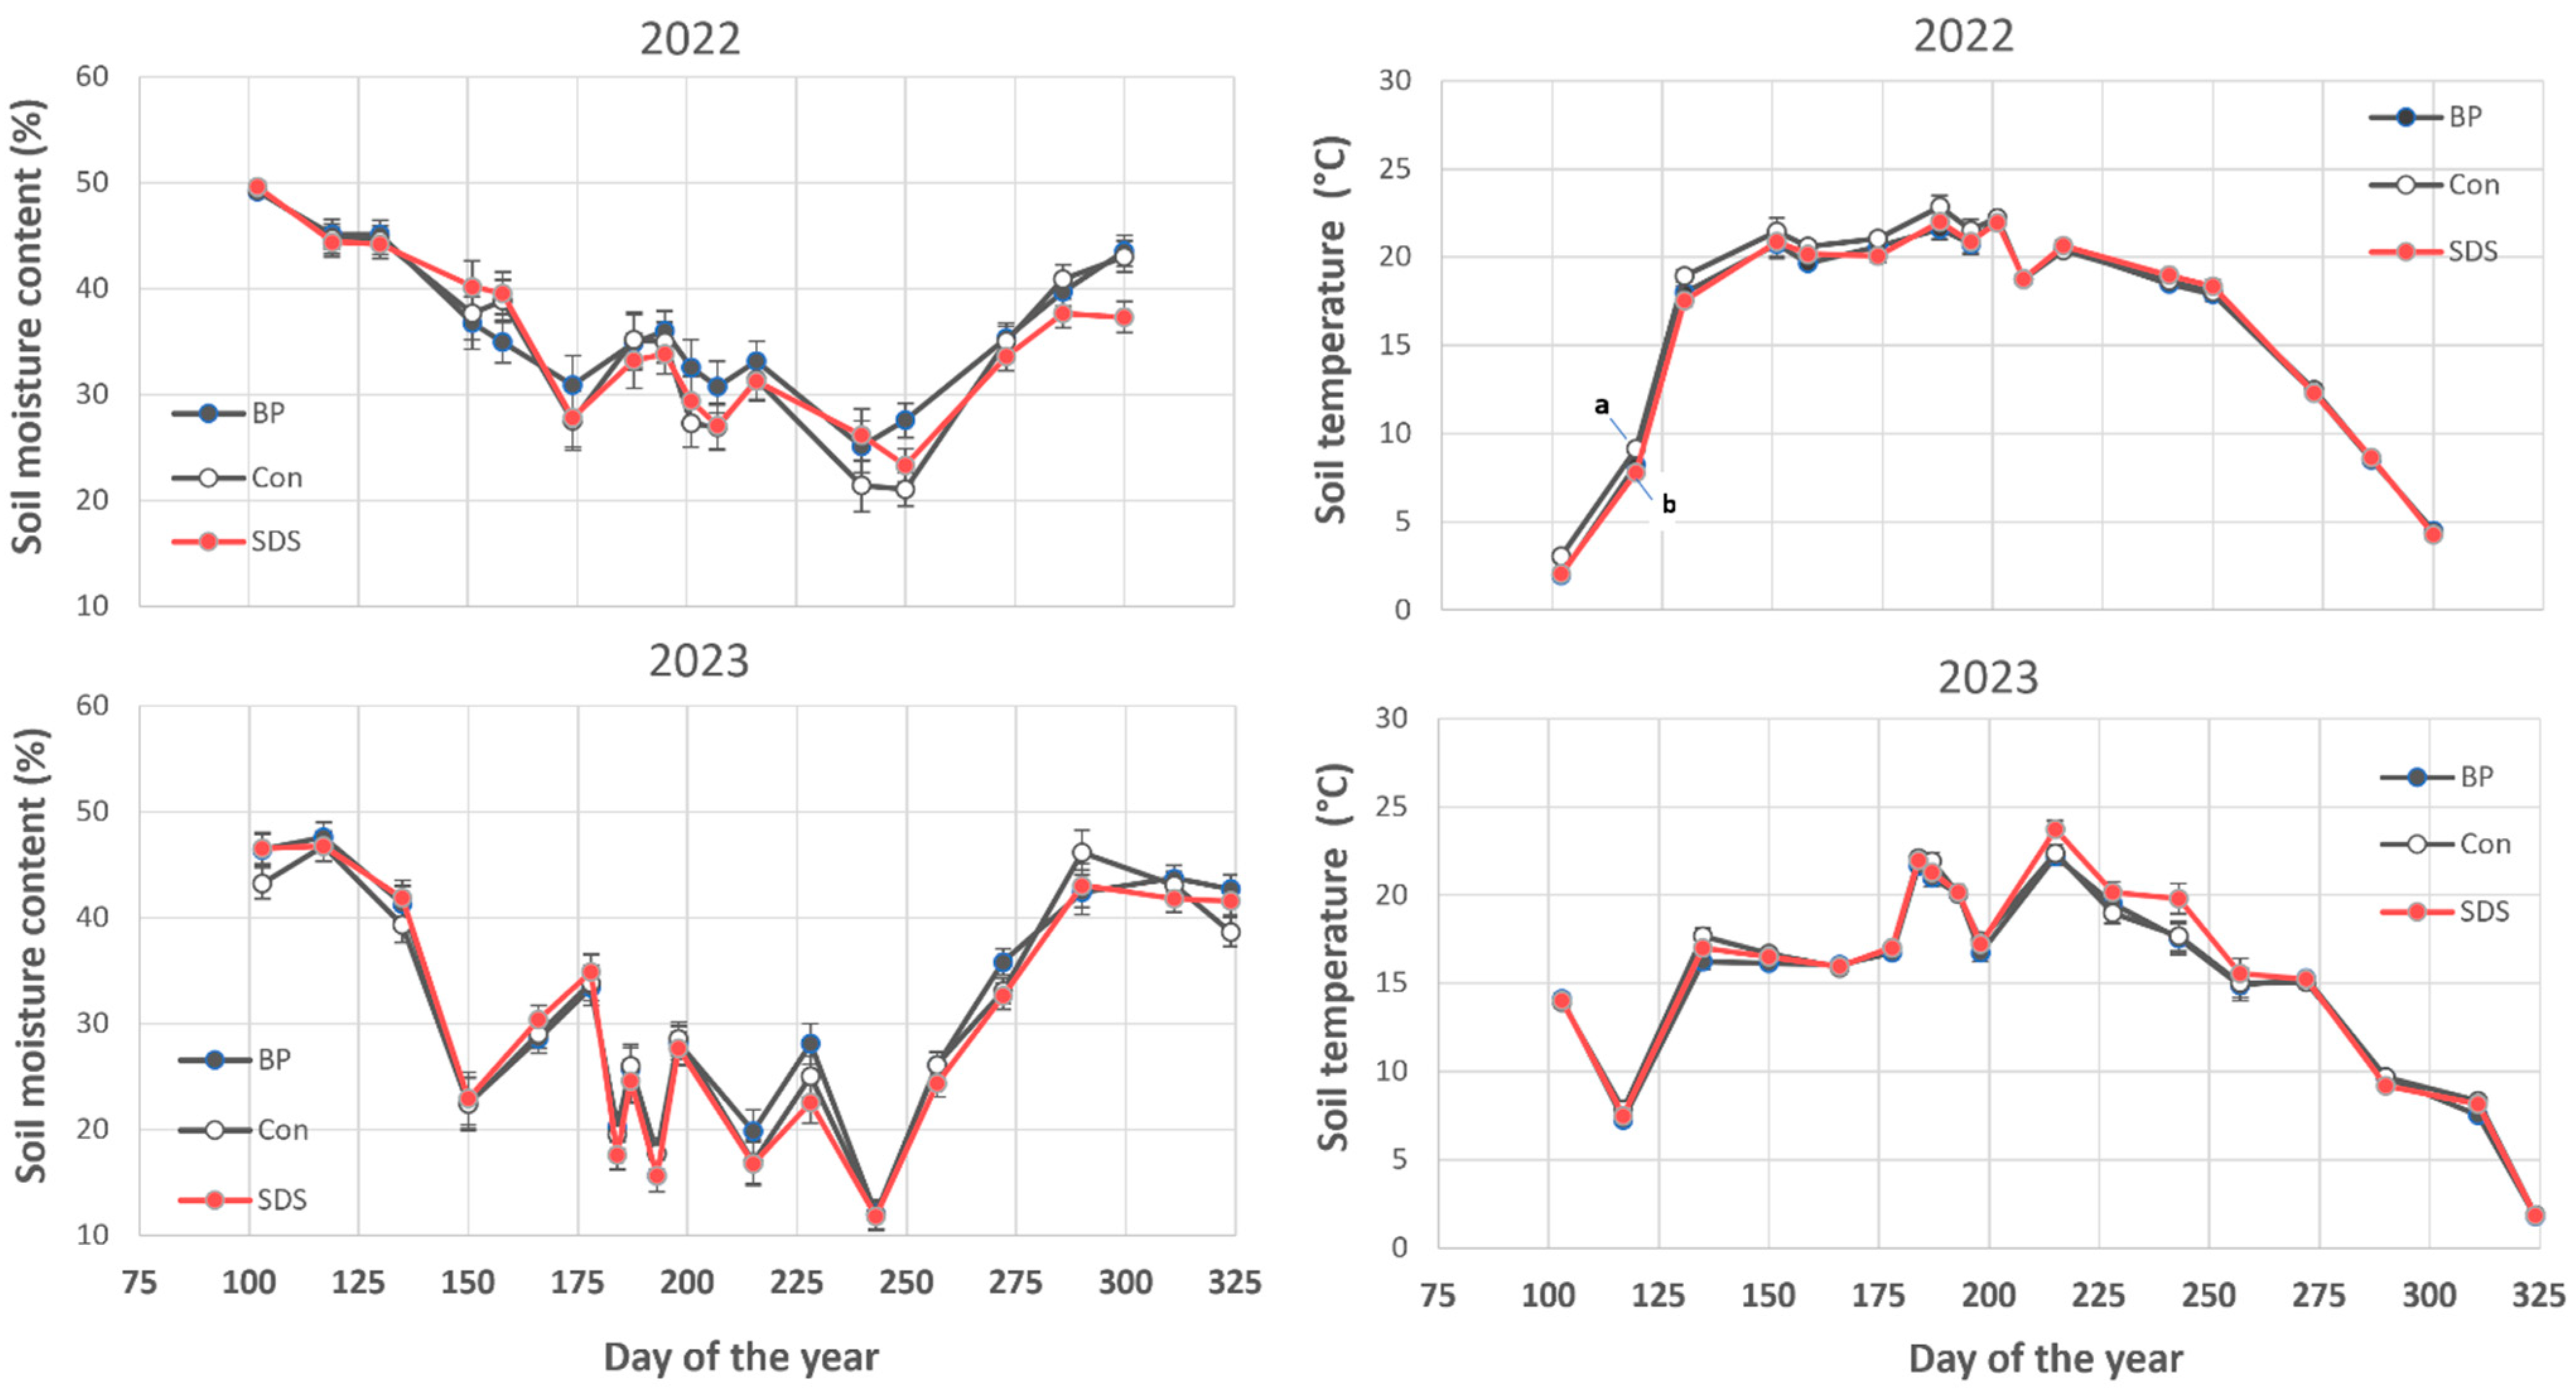
Plot-level soil volumetric moisture content and temperature were measured from 2020 to 2024 for each GHG measurement (Figure 8 and Figure 9). There were a few significant differences noted among treatments in 2020 after manure application and again in 2021. In 2020, SDS had significantly higher soil moisture content than BP on day 295. The SDS treatment had a higher temperature than BP on days 276, 287, and 295 (Figure 8).
Control soil temperatures were consistently greater than SDS and BP between days 84 and 159 and in spring 2021. The results suggest that manure solids may have altered soil thermal properties. Combining temperature and soil moisture data over the study period revealed a significant inverse curvilinear relationship (y = −0.0093x2 + 0.1733x + 19.408; R2 = 0.33, p < 0.001), indicating that wetter plots were also significantly cooler on average. While the temperature and moisture differences among treatments were relatively minor in our experiment, the results illustrate the importance of capturing changes in soil temperature and moisture when implementing site-specific GHG modeling approaches [49].

4. Conclusions

Field experiments are critical for calibrating and improving GHG models aimed at developing more sustainable farming practices. In our study, the lack of N2O emission and propensity for consumption were noteworthy and unlike the results observed in better drained soils, where N2O fluxes tended to be positive. In the poorly drained field conditions of our study, N2O emissions were negligible or negative, while CH4 fluxes were considerable. In contrast to N2O, CH4 emission was consistent, likely due to a combination of poor drainage, lack of tillage, and abundant labile C. No tillage may have acted synergistically by providing a layer of undisturbed residue and C, with no mechanical aeration to oxidize CH4. The results suggest that GHG models should account for both field nutrient management factors as well as soil aeration status.

Author Contributions

Conceptualization, E.Y. and J.S.; methodology, J.S. and E.Y.; software, E.Y.; validation, J.S. and E.Y.; formal analysis, E.Y.; investigation, E.Y.; resources, J.S. and E.Y.; data curation, J.S. and E.Y.; writing—original draft preparation, E.Y.; writing—review and editing, E.Y. and J.S.; visualization, E.Y. and J.S.; supervision, E.Y.; project administration, E.Y.; funding acquisition, E.Y. All authors have read and agreed to the published version of the manuscript.

Funding

This research received no external funding.

Institutional Review Board Statement

Not applicable.

Informed Consent Statement

Not applicable.

Data Availability Statement

Data are contained within the article.

Conflicts of Interest

The authors declare no conflict of interest.

Abbreviations

The following abbreviations are used in this manuscript:
NH4+Ammonia
BPBedded pack heifer manure
CCarbon
CO2 Carbon dioxide
N2Dinitrogen gas
MARS Marshfield Agricultural Research Station
CH4 Methane
GHGGreenhouse gas
GWPGlobal warming potential
NNitrogen
NO3Nitrate
N2ONitrous oxide
KPotassium
SDSSeparated dairy solids
SSulfur

Appendix A

Figure A1. Daily total precipitation and temperature at the study site for 2020–2023.
Sustainability 16 11171 g0a1

References

  1. IPCC. Intergovernmental Panel on Climate Change Special Report. Climate Change and Land. Available online: https://www.ipcc.ch/srccl/ (accessed on 20 March 2024).
  2. USEPA. United States Environmental Protection Agency. Inventory of U.S. Greenhouse Gas Emissions and Sinks. National Emissions and Removals. 2024. Available online: https://www.epa.gov/ghgemissions/inventory-us-greenhouse-gas-emissions-and-sinks (accessed on 20 March 2024).
  3. USEPA. United States Environmental Protection Agency. Sources of Greenhouse Gas Emissions. Available online: https://www.epa.gov/ghgemissions/sources-greenhouse-gas-emissions (accessed on 20 March 2024).
  4. USEPA. United States Environmental Protection Agency. Causes of Climate Change. 2024. Available online: https://www.epa.gov/climatechange-science/causes-climate-change (accessed on 20 March 2024).
  5. Del Grosso, S.J.; Ogle, S.M.; Nevison, C.; Gurung, R.; Parton, W.J.; Wagner-Riddle, C.; Smith, W.; Winiwarter, W.; Grant, B.; Tenuta, M.; et al. A gap nitrous oxide emission reporting complicates long- term climate mitigation. Proc. Natl. Acad. Sci. USA 2022, 119, e2200354119. [Google Scholar] [CrossRef] [PubMed]
  6. Jackson, R.B.; Saunois, M.; Bousquet, P.; Canadell, J.G.; Poulter, B.; Stavert, A.R.; Bergamaschi, P.; Niwa, Y.; Segers, A.; Tsuruta, A. Increasing anthropogenic methane emissions arise equally from agricultural and fossil fuel sources. Environ. Res. Lett. 2020, 15, 071002. [Google Scholar] [CrossRef]
  7. IPCC. Intergovernmental Panel on Climate Change (IPCC). Climate Change 2021–The Physical Science Basis: Working Group I Contribution to the Sixth Assessment Report of the Intergovernmental Panel on Climate Change; Cambridge University Press: Cambridge, UK, 2023. [Google Scholar] [CrossRef]
  8. Hernandez-Ramirez, G.; Brouder, S.M.; Smith, D.R.; Van Scoyoc, G.E. Greenhouse gas fluxes in an eastern Corn Belt soil: Weather, nitrogen source, and rotation. J. Environ. Qual. 2009, 38, 841–854. [Google Scholar] [CrossRef] [PubMed]
  9. Joshi, D.R.; Clay, D.E.; Clay, S.A.; Moriles-Miller, J.; Daigh, A.L.M.; Reicks, G.; Westhoff, S. Quantification and machine learning based N2O–N and CO2–C emissions predictions from a decomposing rye cover crop. Agron. J. 2022, 116, 1–15. [Google Scholar] [CrossRef]
  10. Joshi, D.R.; Sieverding, H.L.; Xu, H.; Kwon, H.; Wang, M.; Clay, S.A.; Johnson, J.M.; Thapa, R.; Westhoff, S.; Clay, D.E. A global meta-analysis of cover crop response on soil carbon storage within a corn production system. Agron. J. 2023, 115, 1543–1556. [Google Scholar] [CrossRef]
  11. Kwon, H.; Liu, X.; Xu, H.; Wang, M. Greenhouse gas mitigation strategies and opportunities for agriculture. Agron. J. 2021, 113, 4639–4647. [Google Scholar] [CrossRef]
  12. McDaniel, M.D.; Saha, D.; Dumont, M.G.; Hernandez, M.; Adams, M.A. The effect of land-use change on soil CH4 and N2O fluxes: A global meta-analysis. Ecosystems 2019, 22, 1424–1443. [Google Scholar] [CrossRef]
  13. Miller, L.T.; Griffis, T.J.; Erickson, M.D.; Turner, P.A.; Deventer, M.J.; Chen, Z.; Yu, Z.; Venterea, R.T.; Baker, J.M.; Frie, A.L. Response of nitrous oxide emissions to individual rain events and future changes in precipitation. J. Environ. Qual. 2022, 51, 312–324. [Google Scholar] [CrossRef]
  14. Abdalla, M.; Kumar, S.; Jones, M.; Burke, J.; Williams, M. Testing DNDC model for simulating soil respiration and assessing the effects of climate change on the CO2 gas flux from Irish agriculture. Glob. Planet. Chang. 2011, 78, 106–115. [Google Scholar] [CrossRef]
  15. Faimon, J.; Lang, M. What actually controls the minute to hour changes in soil carbon dioxide concentrations? Geoderma 2018, 323, 52–64. [Google Scholar] [CrossRef]
  16. Omonode, R.A.; Vyn, T.J.; Smith, D.R.; Hegymegi, P.; Gal, A. Soil carbon dioxide and methane fluxes from long-term tillage systems in continuous corn and corn-soybean rotations. Soil Tillage Res. 2007, 95, 182–195. [Google Scholar] [CrossRef]
  17. Chapuis-Lardy, L.; Wrage, N.; Metay, A.; Chotte, J.L.; Bernoux, M. Soils, a sink for N2O? A review. Glob. Chang. Biol. 2007, 13, 1–17. [Google Scholar] [CrossRef]
  18. Butterbach-Bahl, K.; Baggs, E.M.; Dannenmann, M.; Kiese, R.; Zechmeister-Boltenstern, S. Nitrous oxide emissions from soils: How well do we understand the processes and their controls? Phil. Trans. R. Soc. 2013, 368, 20130122. [Google Scholar] [CrossRef] [PubMed]
  19. Saha, D.; Basso, B.; Robertson, G.P. Machine learning improves predictions of agricultural nitrous oxide (N2O) emissions from intensively managed cropping systems. Environ. Res. Lett. 2021, 16, 024004. [Google Scholar] [CrossRef]
  20. Grosz, B.; Matson, A.; Butterbach-Bahl, K.; Clough, T.; Davidson, E.A.; Dechow, R.; DelGrosso, S.; Diamantopoulos, E.; Dörsch, P.; Haas, E.; et al. Modeling denitrification: Can we report what we won’t know? AGU Adv. 2023, 4, e2023AV000990. [Google Scholar] [CrossRef]
  21. Xia, Y.; Wander, M. Management zone-based estimation of positive and negative nitrous oxide flux in organic corn fields. Soil Sci. Amer. J. 2022, 86, 1043–1057. [Google Scholar] [CrossRef]
  22. Miller, D.J.; Chai, J.; Guo, F.; de León, M.A.P.; Ryals, R.; Dell, C.J.; Karsten, H.; Hastings, M.G. Cropland soil nitrogen oxide emissions vary with dairy manure incorporation methods. AGE 2024, 7, e20485. [Google Scholar] [CrossRef]
  23. Sadeghpour, A.; Ketterings, Q.M.; Godwin, G.; Czymmek, K.J. Vermeylen, Agro-environmental consequences of shifting from nitrogen-to phosphorus-Based manure management of corn. Soil Sci. Soc. Am. J. 2017, 81, 1127–11138. [Google Scholar] [CrossRef]
  24. Gregorich, P.; Rochette, A.J.; VandenBygaart, A.J.; Angers, D. Greenhouse gas contributions of agricultural soils and potential mitigation practices in Eastern Canada. Soil Tillage Res. 2004, 83, 53–72. [Google Scholar] [CrossRef]
  25. Wang, Z.P.; DeLaune, D.; Masscheleyen, P.H.; Patrick, W.H. Soil redox and pH effects on methane production in a flooded rice soil. Soil Sci. Soc. Am. J. 1993, 57, 382–385. [Google Scholar] [CrossRef]
  26. Smith, K.A.; Ball, T.; Conen, F.; Dobbie, K.E.; Massheder, J.; Rey, A. Exchange of greenhouse gases between soil and atmosphere. Interactions of soil physical factors and biological processes. Eur. J. Soil Sci. 2003, 54, 779–791. [Google Scholar] [CrossRef]
  27. Dungan, R.S.; Leytem, A.B.; Tarkalson, D.D.; Ippolito, J.A.; Bjorneberg, D.L. Greenhouse gas emissions from an irrigated dairy forage rotation as influenced by fertilizer and manure applications. Soil Sci. Soc. Am. J. 2017, 8, 537–545. [Google Scholar] [CrossRef]
  28. Dungan, R.S.; Leytem, A.B.; Tarkalson, D.D. Greenhouse gas emissions from an irrigated cropping rotation with dairy manure utilization in a semiarid climate. Agron. J. 2021, 113, 1222–1237. [Google Scholar] [CrossRef]
  29. Soane, B.D.; Ball, B.C.; Arvidsson, J.; Basch, G.; Moreno, F.; Roger-Estrade, J. No-till in northern, western and south-western Europe: A review of problems and opportunities for crop production and the environment. Soil Tillage Res. 2012, 118, 66–87. [Google Scholar] [CrossRef]
  30. Kazula, M.J.; Lauer, J.G. Greenhouse gas emissions from soils in corn-based cropping systems. J. Environ. Qual. 2023, 52, 1080–1091. [Google Scholar] [CrossRef] [PubMed]
  31. Bockheim, J.G.; Hartemink, A.E. The Soils of Wisconsin; World Soils Book Series; International Union of Soil Scientists; Springer International Publishing: Cham, Switzerland, 2017. [Google Scholar]
  32. Peters, J. Lab procedures and methods. University of Wisconsin Soils and Forage Analysis Laboratory. University of Wisconsin Extension. 2013. Available online: http://uwlab.soils.wisc.edu/lab-procedures/ (accessed on 12 December 2023).
  33. Laboski, C.A.M.; Peters, J.B. Nutrient Application Guidelines for Field, Vegetable, and Fruit Crops in Wisconsin; University of Wisconsin–Extension, Ed.; Cooperative Extension: Madison, WI, USA, 2012. [Google Scholar]
  34. Parkin, T.B.; Venterea, R.T. Chamber-Based Trace Gas Flux Measurements. In Sampling Protocols; Follett, R.F., Ed.; USDA-ARS: Beltsville, MD, USA, 2010. Available online: https://www.ars.usda.gov/ARSUserFiles/31831/2011%20Parkin%20and%20Venterea%20Trace%20Gas%20Protocol%20Revision%20Final.pdf (accessed on 7 March 2018).
  35. Venterea, R.T. Simplified method for quantifying theoretical underestimation of chamber-based trace gas fluxes. J. Environ. Qual. 2010, 39, 126–135. [Google Scholar] [CrossRef] [PubMed]
  36. Sherman, J.F.; Young, E.O.; Jokela, W.E.; Cavadini, J. Impacts of low-disturbance dairy manure incorporation on ammonia and greenhouse gas fluxes in a corn silage–winter rye cover crop system. J. Environ. Qual. 2021, 50, 836–846. [Google Scholar] [CrossRef] [PubMed]
  37. Sherman, J.; Young, E.; Jokela, W.; Cavadini, J. Impacts of Low Disturbance Liquid Dairy Manure Incorporation on Alfalfa Yield and Fluxes of Ammonia, Nitrous Oxide, and Methane. Agriculture 2021, 11, 750. [Google Scholar] [CrossRef]
  38. Sherman, J.; Young, E.; Jokela, W.; Kieke, B. Manure Application Timing and Incorporation Effects on Ammonia and Greenhouse Gas Emissions in Corn. Agriculture 2022, 12, 1952. [Google Scholar] [CrossRef]
  39. Sherman, J.F.; Young, E.O. Greenhouse gas emissions with low disturbance liquid dairy manure incorporation into a live winter cereal cover crop-corn system. Agronomy 2022, 12, 2978. [Google Scholar] [CrossRef]
  40. Harbridge, J. Determination of Nitrate in 2M KCl Soil Extracts by Flow Injection Analysis. Quikchem Method 12-107-04-1-J.; Lachat Instruments: Loveland, CO, USA, 2007. [Google Scholar]
  41. Egan, L. Determination of Ammonia by Flow Injection Analysis. QuikChem Method 90-107-06-3-A; Lachat Instruments: Loveland, CO, USA, 2011. [Google Scholar]
  42. SAS Institute Inc. SAS 9.4 Guide to Software Updates; SAS Institute Inc.: Cary, NC, USA, 2013. [Google Scholar]
  43. Magdoff, F.R.; Ross, D.; Amadon, J. A soil test for nitrogen availability to corn. Soil Sci. Soc. Am. J. 1984, 48, 1301–1304. [Google Scholar] [CrossRef]
  44. Malek, I.; Bouteldja, M.; Posta, K.; Foti, S.; Pinter, K.; Nagy, Z.; Balogh, J. Response of soil respiration to biotic and abiotic drivers in a temperate cropland. Eurasian J. Soil Sci. 2021, 54, 1038–1048. [Google Scholar] [CrossRef]
  45. Fu, C.; Lee, X.; Griffis, T.J.; Baker, J.M.; Turner, P.A. A modeling study of direct and indirect N2O emissions from a representative catchment in the U.S. Corn Belt. Water Resour. Res. 2018, 54, 3632–3653. [Google Scholar] [CrossRef]
  46. Saha, D.; Kaye, J.P.; Bhowmik, A.; Bruns, M.A.; Wallace, J.M.; Kemanian, A.R. Organic fertility inputs synergistically increase denitrification-derived nitrous oxide emissions in agroecosystems. Ecol. Appl. 2021, 31, e02403. [Google Scholar] [CrossRef]
  47. Kandel, T.P.; Laerke, P.E.; Elsgaard, L. Annual emissions of CO2, CH4 and N2O from a temperate peat bog: Comparison of an undrained and four drained sites under permanent grass and arable crop rotations with cereals and potato. Agric. For. Meteorol. 2018, 256, 470–481. [Google Scholar] [CrossRef]
  48. Alluvione, F.; Halvorson, A.D.; Del Grosso, S.J. Nitrogen, tillage, and crop rotation effects on carbon dioxide and methane fluxes from irrigated cropping systems. J. Environ. Qual. 2009, 38, 2023–2033. [Google Scholar] [CrossRef]
  49. Oertel, C.; Matschullat, J.; Zurba, K.; Zimmermann, F.; Erasmi, S. Greenhouse gas emissions from soils—A review. Geochemistry 2016, 76, 327–352. [Google Scholar] [CrossRef]
Figure 1. Select soil properties from samples taken in fall 2020 before manure application. Average soil pH (a), Bray-1 extractable phosphorus (b), Bray 1 extractable potassium (c), soil organic matter content (d), total nitrogen (e), and total carbon (f) at three depth intervals (0–5 cm, 5–15 cm, and 15–30 cm). Error bars are one standard error of the mean of four replicated plots. Note: These were baseline soil analyses prior to manure application to assess consistency. Dairy heifer bedded pack manure designated plots = BP; separated dairy manure solids designated plots = SDS; control (fertilizer only) = CON.
Sustainability 16 11171 g001
Figure 2. Dry matter solids and nutrients applied from dairy heifer bedded pack manure (BP) and separated dairy manure solids (SDS). Solids = manure solids (Mg ha−1); N = total nitrogen (kg ha−1); P = total phosphorus (kg ha−1); K = potassium (kg ha−1); S = sulfur (kg ha−1); Amm-N = ammonium-nitrogen (kg ha−1).
Sustainability 16 11171 g002
Figure 3. Corn silage dry matter yield in 2021, 2022, and 2023 along with mean soil inorganic nitrogen concentration (ammonium-N + nitrate-N) taken from control plots when corn was approximately at the V5 growth stage. Means with different lowercase letters differ at p ≤ 0.05. Dairy heifer bedded pack manure = BP; separated dairy manure solids = SDS; control (fertilizer only) = CON.
Sustainability 16 11171 g003
Figure 4. Mean carbon dioxide–carbon (CO2-C) emissions for each study year. Means notated with different lowercase letters for an event differ (p ≤ 0.05). Means without letters do not differ (p > 0.05). Error bars are one standard error of the mean of four replicated plots. Dairy heifer bedded pack manure = BP; separated dairy manure solids = SDS; control (fertilizer only) = CON. FTIR breakdown denotes the time during which the FTIR instrument was under repair, and field measurements were not taken.
Sustainability 16 11171 g004
Figure 5. Cumulative carbon dioxide–carbon (CO2-C) (a), nitrous oxide–nitrogen (N2O-N) (b), and methane–carbon (CH4-C) (c) emissions in each study year. Means notated with different lowercase letters differ (p ≤ 0.05). Error bars are one standard error of the mean of four replicated plots. Dairy heifer bedded pack manure = BP; separated dairy manure solids = SDS; control (fertilizer only) = CON.
Sustainability 16 11171 g005
Figure 6. Mean nitrous oxide–nitrogen (N2O-N) and methane–carbon (CH4-C) emissions for 2020 and 2021. Means notated with different lowercase letters for an event differ (p ≤ 0.05). Means without letters do not differ (p > 0.05). Error bars are one standard error of the mean of four replicated plots. Dairy heifer bedded pack manure = BP; separated dairy manure solids = SDS; control (fertilizer only) = CON. FTIR breakdown denotes the time during which the FTIR instrument was under repair, and field measurements were not taken.
Sustainability 16 11171 g006
Figure 7. Mean nitrous oxide–nitrogen (N2O-N) and methane–carbon (CH4-C) emissions for 2022 and 2023. Means notated with different lowercase letters for an event differ (p ≤ 0.05). Means without letters do not differ (p > 0.05). Error bars are one standard error of the mean of four replicated plots. Dairy heifer bedded pack manure = BP; separated dairy manure solids = SDS; control (fertilizer only) = CON.
Sustainability 16 11171 g007
Figure 8. Changes in plot soil moisture content and temperature for 2020 and 2021. Means notated with different lowercase letters for an event differ (p ≤ 0.05). Means without letters do not differ (p > 0.05). Error bars are one standard error of the mean of four replicated plots. Dairy heifer bedded pack manure = BP; separated dairy manure solids = SDS; control (fertilizer only) = CON. FTIR breakdown denotes the time during which the FTIR instrument was under repair, and field measurements were not taken.
Sustainability 16 11171 g008
Figure 9. Changes in plot soil moisture content and temperature for 2020 and 2021. Means notated with different lowercase letters for an event differ (p ≤ 0.05). Means without letters do not differ (p > 0.05). Error bars are one standard error of the mean of four replicated plots. Dairy heifer bedded pack manure = BP; separated dairy manure solids = SDS; control (fertilizer only) = CON.
Sustainability 16 11171 g009
Table 1. Long-term average monthly temperature and precipitation totals (1981–2010) at the Marshfield Agricultural Research Station and numerical differences between measured and long-term average values for each study year.
Month1981–2010 20202021202220231981–20102020202120222023
Monthly Average Temperature (°C)Monthly Precipitation Totals (mm)
April7.2−2.90.0−3.8−1.571.1−34.3−6.823.921.8
May13.7−1.5−1.10.50.593.2−12.911.4−15.5−36.2
June18.90.11.5−0.70.4113.016.546.8−42.1−44.7
July21.20.3−0.8−0.9−1.4101.028.337.9−53.2−2.6
August20.1−0.5−0.3−0.5−0.6109.0−9.7109.9−18.3−75.8
September15.4−1.90.0−0.31.1100.0−44.0−54.828.347.3
October8.6−4.32.6−0.5−0.266.3−6.9−13.7−35.3104.7
November0.81.9−0.20.20.256.41.7−27.70.6−55.4
† Long-term mean computed from historical weather data.
Disclaimer/Publisher’s Note: The statements, opinions and data contained in all publications are solely those of the individual author(s) and contributor(s) and not of MDPI and/or the editor(s). MDPI and/or the editor(s) disclaim responsibility for any injury to people or property resulting from any ideas, methods, instructions or products referred to in the content.