Abstract
This work evaluates the renewable energy development potential of Polish voivodeships based on the TOPSIS method and spatial autocorrelation analysis. Data were obtained from the Polish Local Data Bank, covering 22 indicators in the field of economic, social, environmental, and energy related to renewable energy initiatives. The TOPSIS method was applied to construct a synthetic indicator for each voivodeship, facilitating a hierarchical ranking based on their proximity to an ideal solution representing optimal conditions. The results indicate that the Mazowiecki voivodeship leads the list in terms of renewable energy development potential, followed by Małopolskie i Pomorskie, and that this is mainly due to good economic conditions and large investments in renewable energy projects. Spatial autocorrelation analysis yielded a Moran’s I value of –0.1137 with a Z score of 0.303 and a p value of 0.752, suggesting a weak negative spatial autocorrelation that is not statistically significant. This implies that the distribution of renewable energy potential across voivodeships is largely random and is not influenced by spatial proximity. The study concludes that non-spatial factors play a more significant role in renewable energy development potential, offering valuable insights for policymakers and stakeholders to allow them to focus on economic and social variables when promoting renewable energy initiatives in Poland.
1. Introduction
The transition to renewable energy sources is essential for sustainable economic development and addressing global environmental issues such as climate change. In Poland, significant regional disparities among its voivodeships constrain efforts to increase renewable energy adoption. Uneven socio-economic development limits certain regions’ capacity to invest in and benefit from renewable energy initiatives. Despite the importance of regional dynamics, there is a gap in empirical research on renewable energy potential at the voivodeship level in Poland, particularly studies that incorporate comprehensive multidimensional factors and spatial analysis. This gap necessitates detailed investigations into the dynamics of renewable energy adoption in various voivodeships to fully understand both opportunities and challenges [1,2,3].
While renewable energy development is a crucial subject of socio-economic research—as countries strive to achieve economic growth without compromising ecological sustainability—there remains limited empirical work on the spatial associations between economic, social, energy-related, and environmental indicators and the regional outcomes of renewable energy initiatives. This research gap underscores the need for more nuanced spatial mapping of how these factors interact to drive renewable energy outcomes across regions. Specifically, understanding regional successes and obstacles in renewable energy development can reveal whether spatial autocorrelation influences the growth of renewable energy in one area compared with others. This justifies conducting a focused study on the spatial autocorrelation of relevant factors affecting renewable energy development in Poland’s voivodeships [4].
Previous studies have been confined to national-level assessments or have not sufficiently examined how economic, social, environmental, and energy-related indicators interact spatially to affect renewable energy development. This lack of detailed regional analyses leads to a poor understanding of localized opportunities and challenges and can result in inadequately designed regional policies.
The present study analyzes the potential for renewable energy development across Polish voivodeships to address this research gap. The following questions guide the research:
- Which voivodeships in Poland show the greatest potential for renewable energy development?
- Does spatial autocorrelation influence the clustering of renewable energy development potential among Polish voivodeships?
Exploring these questions enables the study to identify regions with the highest potential for renewable energy initiatives and to determine whether spatial relationships contribute to the distribution of this potential. Understanding these dynamics will help policymakers and stakeholders design targeted interventions for equitable and efficient renewable energy development. The study integrates a multidimensional assessment with spatial analysis to address this research gap, offering insights into renewable energy potential across Polish voivodeships [5,6].
1.1. Concept of Renewable Energy Development
Renewable energy development involves the expansion and implementation of energy sources that can be replenished within a human lifespan. Unlike fossil fuels, which are limited and cause environmental degradation, renewable sources of energy have a considerably lower environmental impact [7]. The development of renewable energy is therefore critical to both climate change and energy security because it reduces greenhouse gases and diversifies energy supplies [8,9,10,11]. Simply by replacing carbon-intensive forms of energy, renewable energy helps decarbonize the power system—a crucial step in attaining the Paris Agreement’s worldwide climate goals.
From an economic standpoint, moving to renewable energy presents several opportunities. It creates jobs, particularly in outlying areas with high levels of wind and solar farms, and contributes to local economies by creating new jobs and developing infrastructure [12]. Renewable energy contributes to rural development by providing stable energy access and strengthening the economic resilience of communities often neglected by traditional energy networks. In addition, renewable energy diversification removes the dependence on imported fossil fuels, thereby increasing energy sovereignty and reducing economic vulnerability to volatile world oil and gas prices. However, the transition also involves challenges such as high initial investment costs for renewable energy infrastructure and the intermittent nature of renewable energy sources. Such instability problems require energy storage solutions as well as grid integration to ensure consistent energy demand [13,14].
Some of the factors driving sustainable economic development in renewable energy include policy support frameworks that encourage renewable energy adoption. Governments also shape market conditions through instruments such as feed-in tariffs, which guarantee fixed prices for producers of renewable energy and renewable portfolio standards which require certain levels of renewable energy production. Additionally, tax incentives and subsidies may make renewable energy projects cheaper for investors. Technological advances like more efficient solar panels or wind turbines also reduce costs and make renewable energy projects more economically viable. These market mechanisms and technological breakthroughs are essential to overcome financial barriers and move towards clean energy.
In terms of carbon footprint, renewable energy development reduces greenhouse gases. Studies indicate that renewable sources of energy could lessen dangerous gases, such as carbon dioxide, methane, and particulate matter, which cause climate change and air pollution. The reduction of such pollutants is directly related to improved air quality and public health, as evidenced by lower respiratory and cardiovascular diseases related to fossil fuel burning [15,16,17]. Renewable energy development also preserves natural ecosystems by reducing water use and environmental degradation due to coal mining, oil drilling, and hydraulic fracturing processes.
One decision-making tool in the evaluation of renewable energy development ranking is TOPSIS—The Technique for Order of Preference by Similarity to the Ideal Solution, which ranks different options by calculating the closeness of each alternative to the ideal. If the alternative is closest to a positive ideal solution and, at the same time, farthest from a negative ideal solution, it is the optimal option, otherwise, it is not optimal [18]. In the area of renewable energy development, this particular approach could be utilized to assess the merits of different energy projects based on cost-effectiveness, environmental impact, technological feasibility, or social acceptance. This approach allows a systematic comparison of competing projects, so as to ensure that limited resources are allocated appropriately [19].
Regardless of the benefits of renewable energy, there are still several challenges to overcome in order for the sector to survive and flourish. Technological obstacles like the efficiency limitations of some renewable technologies and also the absence of large-scale energy storage systems could prevent large-scale deployment. The variability of renewable sources of energy, like solar and wind, requires investments in grid infrastructure to handle fluctuating inputs of electricity and maintain the stability of the electricity supply. This is especially important as renewable energy development demands more sophisticated grid management systems as well as energy storage technologies such as batteries or hydrogen fuel cells [20]. On top of this, social acceptance of renewable energy projects—particularly large ones like wind farms—can be a barrier. Opposition may be due to noise, visual impact, or land use conflicts, especially in densely settled or ecologically sensitive areas. Engaging local communities in project planning may alleviate these concerns and increase public support.
Future developments of energy from renewable sources also depend on finding new solutions to the issue of the intermittency of sources. Energy storage technologies are needed to manage supply and demand fluctuations. These storage systems store renewable energy during excess production periods and deploy it during low-generation periods to provide a stable and consistent power supply. In addition, renewable energy combined with smart grid technologies could optimize energy distribution and overall energy systems efficiency.
Worldwide efforts toward the mitigation and sustainability of global warming will determine the future of renewable energy. Global cooperation in terms of technology transfer and financial assistance is vital to the adoption of renewable energy solutions. Knowledge transfer between countries accelerates the adoption of best practices and new technologies to overcome barriers and scale up renewable energy projects [21]. As countries work together to achieve global climate goals, renewable energy sources will always be the foundation of the global transition to low-emission, renewable energy.
1.2. Literature Review
1.2.1. Multicriteria Decision-Making in Renewable Energy Development
Assessing renewable energy development opportunities across regions is a complex decision process involving economic, social, environmental, technical, and policy criteria. These complexities have been addressed through multicriteria decision-making methods applied to renewable energy to assist policymakers in making informed decisions. Several studies have used MCDM techniques to rank regions or projects according to their renewable energy potential. Shao et al. [22] reviewed MCDM applications for renewable energy site selection, covering 85 papers published between 2001 and 2018. Their analysis revealed that different renewable energy sources emphasize different criteria, but that some similarities exist. The study also identified common methodologies used in the MCDM process, such as literature surveys and expert opinions for criteria selection, reclassification for data normalization, and the analytic hierarchy process (AHP) for weighting criteria. Geographic information systems (GIS) and weighted linear combinations were highlighted as popular tools for alternative evaluation, with sensitivity analysis commonly used for result validation.
After conducting a life cycle sustainability assessment, Ren [23] proposed a multicriteria decision-making framework for prioritizing energy systems under uncertainties. By employing a fuzzy two-stage logarithmic goal programming method to determine criteria weights and using interval grey relational analysis for evaluating alternatives, the study provided a systematic approach to rank energy systems based on sustainability criteria. The methodology was applied to electricity generation options in the UK, demonstrating its practical applicability and highlighting nuclear energy as the most sustainable option among the alternatives considered.
Using Istanbul as a case study, Kaya and Kahraman [24] developed an integrated fuzzy VIKOR and AHP methodology for multicriteria renewable energy planning. Their approach combined the strengths of both methods to handle uncertainty in decision-making and allowed for the incorporation of expert judgments expressed in linguistic terms.
San Cristóbal [25] applied the VIKOR method, combined with AHP for criteria weighting, to select a renewable energy project in Spain. The study considered multiple conflicting objectives and involved different groups of decision-makers in the process. Their results were found to show that a biomass plant utilizing co-combustion in a conventional power plant was the best choice among the alternatives, followed by wind power and solar thermo-electric options. This highlights the effectiveness of MCDM methods in identifying optimal solutions for renewable energy investments.
Kowalski et al. [26] analyzed the combined use of scenario building and participatory multicriteria analysis (PMCA) in the context of renewable energy. Focusing on renewable energy scenarios for Austria, they assessed the scenarios against sustainability criteria, incorporating stakeholder preferences through participatory processes. The study emphasized the importance of capturing the complexity of long-term energy decision-making by addressing uncertainties, acknowledging multiple perspectives, and encouraging social learning in the assessment of a sustainable energy future.
Burton and Hubacek [27] applied multicriteria decision analysis to compare small-scale and large-scale renewable energy schemes in the metropolitan borough of Kirklees, UK. Their findings indicate that small-scale schemes were the most socially, economically, and environmentally effective, despite large-scale schemes being more financially viable. The study underscored the significance of including relevant stakeholders to elicit information on criteria selection and weighting, as these factors are crucial in the assessment process.
Piwowarski et al. [28] addressed the problem of non-typical objects in the multidimensional comparative analysis of the level of renewable energy development. They proposed a methodology integrating statistical methods with MCDM techniques to improve the reliability of regional assessments. By applying the TOPSIS method to Polish regions, the study revealed the presence of outlier voivodeships that can distort comparative analyses if not properly accounted for, emphasizing the importance of considering atypical regions to enhance the accuracy of renewable energy development indicators.
These studies demonstrate the critical role of MCDM methods in analyzing renewable energy development potential and informing policy decisions. They highlight the need for multidimensional approaches that consider the diverse factors influencing renewable energy adoption and which address regional disparities.
1.2.2. Renewable Energy Development Indicators
Comprehensive renewable energy development indicators are needed to capture sustainability and regional development complexity. These indicators cover resource availability/technological infrastructure/economic viability/environmental impact/social acceptance/etc.
Gunnarsdottir et al. [29] reviewed established indicator sets for sustainable energy development, assessing their transparency, conceptual frameworks, representativeness, linkage considerations, and stakeholder engagement. They found that most indicator sets lack in some aspects, such as transparency and consideration of linkages between indicators, and often present an imbalanced picture. The study emphasized the necessity for a robust and comprehensive set of indicators to effectively monitor progress toward sustainable energy development. The authors suggest that, while existing indicator sets, like the Energy Indicators for Sustainable Development, could serve as a starting point, refinement, and stakeholder input are crucial to ensure their relevance and usefulness in specific contexts.
Kourkoumpas et al. [30] focused on key environmental and energy performance indicators for renewable energy systems integrated with storage solutions. They proposed a limited number of adaptable indicators distributed according to the life-cycle phases of energy systems—manufacturing, operational, and end-of-life. Their approach aims to provide a holistic assessment of environmental impacts, enabling fair comparisons between fossil-fuel-based and renewable-based energy systems. The study highlights the importance of considering the entire life cycle and the potential competing interests of stakeholders in the evaluation of renewable energy technologies.
Papież et al. [31] examined the determinants of renewable energy development in EU countries over a 20-year perspective. Using statistical methods, including least angle regression (LARS) and principal component analysis (PCA), they found that the distribution of energy sources in 1995 had become a crucial determinant of renewable energy development by 2014. Countries lacking their fossil fuel resources developed renewable energy to a greater extent, highlighting the influence of initial energy mixes on subsequent renewable energy adoption. Other important factors identified were GDP per capita, the concentration of energy supply, and the costs associated with fossil fuel consumption relative to GDP.
Chaabouni and Saidi [32] investigated the causal relationships between CO2 emissions, health spending, and GDP growth in 51 countries. Their findings indicate a bidirectional causality between CO2 emissions and GDP per capita, and between health spending and economic growth. The study underscored the importance of health in economic growth and its role in mitigating environmental degradation, suggesting that investments in health can have positive effects on environmental sustainability and energy development policies.
Sojczyński [33] discussed attractiveness indicators for countries in terms of renewable energy sources development. The work addresses factors influencing a country’s attractiveness for renewable energy investments. These indicators are pertinent for policymakers to identify strengths and weaknesses in their renewable energy strategies and to create favorable conditions for sustainable energy development.
Shao et al. [22] also contributed to the understanding of renewable energy development indicators through their systematic literature review. By summarizing the exclusion and evaluation criteria used in site selection for various energy sources, they provided insights into the key factors considered critical in different contexts. This information is valuable for constructing and refining development indicators that accurately reflect the priorities and challenges associated with renewable energy projects.
These studies suggest that robust, global, and context-specific indicators are needed for renewable energy development. Such indicators allow policymakers, researchers, and others to assess progress/areas for improvement and make informed decisions in line with sustainability goals. They also point out that environmental, economic, and social considerations are connected in deciding renewable energy policy and must be embraced holistically.
2. Materials and Methods
The ranking method for renewable energy development is crucial in empirical research, especially when analyzing the multifaceted economic, social, environmental, and energy-related indicators that influence renewable energy initiatives. Historically, the development path of renewable energy projects has been shaped by various factors, necessitating an organized evaluation method. This study employs a multicriteria evaluation procedure tailored to the complexity of renewable energy development.
The first step involved compiling a comprehensive suite of variables that cover the multiple factors driving renewable energy development. These variables were further analyzed to extract a subset of the most pertinent diagnostic variables fundamental to the viability and potential success of renewable energy development across the voivodeships of Poland. This transformation begins with standardizing selected variables to remove differences in units and scales, making each variable dimensionless and allowing comparability across indicators. The values are normalized to a standard scale, forming a standardized decision matrix for multicriteria analysis.
The next step involves calculating synthetic variables and merging all criteria into a single coherent metric. These synthetic measures serve as the basis for rankings, focusing on the relative proximity to an idealized model of renewable energy development rather than directly evaluating the current support for renewable development in their present economic environment. This methodology considers that regions with a weak renewable energy sector might have economic circumstances conducive to renewable power growth. This ensures that the analysis is confined to development potential and conformity with ideal benchmarks.
For the selection of the appropriate multicriteria decision-making (MCDM) method in this study, several techniques were considered, including the analytic hierarchy process (AHP), VIKOR, PROMETHEE, and ELECTRE among others. The TOPSIS method—Technique for Order of Preference by Similarity to Ideal Solution—was ultimately chosen due to its suitability for the nature of this research:
- TOPSIS is particularly effective for ranking problems where a finite number of decision alternatives in terms of multiple, usually conflicting, criteria are evaluated against multiple criteria, which aligns with our objective of ranking the Polish voivodeships based on renewable energy development potential [18]. It provides a clear and interpretable ranking based on the concept of an ideal and an anti-ideal solution, facilitating straightforward comparisons among alternatives.
- TOPSIS is straightforward to implement, especially when handling large datasets with numerous criteria and alternatives. In contrast, methods like AHP rely on pairwise comparisons among criteria and alternatives, making them less practical for problems with a large number of variables due to the exponential increase in the number of comparisons needed [34]. This efficiency makes TOPSIS more suitable for our study, which involves 22 indicators across multiple regions.
- TOPSIS can effectively handle both stimulants and destimulants, which is essential in our study as the dataset includes variables that have both positive and negative impacts on renewable energy development.
- TOPSIS provides a cardinal ranking of alternatives based on their relative closeness to the ideal solution, offering clear insights into how close each region is to the optimal state. This is valuable for policymakers seeking to assess not only the ranking but also the degree of improvement required. Methods like VIKOR focus on identifying a compromise solution and may not provide the same level of detail in the ranking [35].
Given these considerations, TOPSIS was deemed the most appropriate method for constructing the synthetic indicator of renewable energy development potential in this context. This technique is ideal for multidimensional analysis, dealing with vital economic, social, environmental, and energy-related indicators influencing renewable energy sector development. It consists of 22 indicators, previously reduced from 34. The major reason for rejecting such a large number of diagnostic variables was their high mutual linear correlation, covering the following different indicators across four groups: economic, social, environmental, and energy. The construction phases of the synthetic indicator, as defined by Hwang and Yoon [18], are as follows:
- The creation of a normalized decision matrix, standardizing variables to eliminate unit discrepancies and bring them onto a comparable scale.
- The construction of a weight matrix, followed by the generation of a weighted normalized decision matrix, should variable weighting be required; this reflects the relative importance of each criterion in the evaluation process.
- The determination of the coordinates for the ‘ideal’ (A+) and ‘anti-ideal’ (A−) solutions, based on the following normalized characteristics:
- 4.
- The calculation of the Euclidean distance for each entity from both the ideal and anti-ideal as follows solutions:
- 5.
- The calculation of the synthetic value, which encapsulates the multidimensional assessment into a singular score, facilitating a straightforward ranking of countries based on their renewable energy development prospects, as follows:
The use of the synthetic indicator of renewable energy sources status (SIRESS) is justified by replacing the multiple characteristics of renewable energy development with a single aggregated value. This approach allows for the analysis of similarities between regions with a point of reference instead of a ranking based on non-pattern measures. The SIRESS simplifies the comparative analyses of regions concerning renewable energy development by aggregating diverse indicators into one composite index. This method provides a standardized benchmark versus non-pattern measures that lack a point for comparison, enabling a straightforward ranking of the entities under review.
In choosing variables for our analysis, we considered the degree of variability and degree of correlation, employing the inverse of a correlation matrix method. This approach captures the extensive dimensions applicable to renewable energy development while maintaining interdependencies among variables. Importantly, we retained all variables to keep a holistic view of the renewable energy arena, enabling a nuanced evaluation of the elements affecting renewable power development. With all variables retained, our synthetic indicator reflects a comprehensive assessment of renewable energy status across regions. This approach bolsters the reliability and validity of our findings, providing stakeholders with a detailed picture of the renewable energy landscape.
2.1. Characteristics of the Accepted Factors
The dataset comprises variables provided by the Local Data Bank of Poland, encompassing economic, environmental, social, and energy indicators pertinent to renewable energy development. These data are organized to distinguish between stimulants, which promote renewable energy development, and destimulants, which could impede it. To thoroughly evaluate the diverse economic and environmental landscape for renewable energy development, the analysis incorporates multiple variables that embody four critical areas: economic factors, social factors, environmental impact, and energy usage.
Economic factors are essential in understanding the financial dynamics that drive renewable energy development. These factors include the profitability of enterprise sales, enterprise investment expenditures, average monthly gross wages, and the cost–income ratio, which together illustrate the economic health and investment potential of enterprises, as well as the financial burden on individuals. High profitability and investment expenditures, along with higher wages, support renewable energy initiatives, while a high cost–income ratio could hinder investment capabilities.
Social factors provide insights into the workforce and societal readiness for renewable energy projects. Population density, economically active population, employment rates, and education levels are critical in determining the availability of a skilled workforce and the general educational and economic status of the population. Higher education levels and employment rates indicate a ready and capable workforce, while high unemployment rates and low participation in education and training can pose challenges.
Environmental impact variables are indicators of the ecological footprint of current and past energy policies. These include the presence of air pollution reduction devices, the capacity of these devices, and the emissions of gaseous and dust pollutants. High capacity and widespread use of pollution reduction devices reflect a commitment to mitigating environmental impact, whereas high emissions indicate reliance on non-renewable energy sources.
Energy indicators are crucial for understanding the existing energy landscape and the potential for integrating renewable sources. These include the energy performance of buildings, the share of renewable energy in total electricity production, the ratio of electricity production to consumption, and per capita electricity and gas consumption. Higher shares of renewable energy and efficient energy performance in buildings highlight a shift towards sustainable practices, while high per capita consumption indicates inefficiency and a potential area for improvement.
Each of these variables (Table 1) provides a comprehensive picture necessary to assess and prioritize renewable energy development within the intricate mix of national economic and environmental strategies. This structured analysis offers valuable insights into the multifaceted landscape of renewable energy, highlighting areas of strength and potential challenges.

Table 1.
The list of factors that describe the desired area accepted for testing.
2.2. Unweighted Variables
Researchers often debate whether weights should be assigned to variables in spatial data analysis, especially within multicriteria decision-making (MCDM) methods like TOPSIS. Assigning weights can reflect the relative importance of each criterion but can also introduce subjectivity and bias if not grounded in objective evidence [36,37,38]. In this study, we have not assigned fractional weight coefficients to the variables, instead treating all variables as equally important in the initial analysis. This methodological choice is justified for several reasons.
In multicriteria decision-making methods, such as TOPSIS, the assignment of weights to criteria is a critical step, as it reflects the relative importance of each criterion in the evaluation process. However, the process of assigning weights can introduce subjectivity, particularly when weights are based on expert judgments or arbitrary decisions without a robust methodological foundation. In this study, we have opted for an unweighted approach, treating all variables as equally important in the analysis. This methodological choice is justified for several reasons.
The selection of variables was meticulously conducted based on an extensive literature review and analysis of factors influencing renewable energy development. The indicators encompass economic, social, environmental, and energy dimensions, which are widely recognized in the literature as critical determinants of renewable energy adoption. Each variable included in the study has been identified as relevant and significant in previous research, ensuring that the analysis captures the multifaceted nature of renewable energy development.
Assigning weights without a clear, objective basis can introduce subjective bias into the analysis. In the absence of definitive information on the relative importance of each criterion, equal weighting is a neutral and transparent approach that avoids embedding personal or group biases. When no preference information is available or when all criteria are considered equally important, equal weighting is a reasonable and justified method.
Involving a panel of experts for weight assignment, while valuable, was beyond the scope and resources of this study. Furthermore, expert elicitation can introduce subjectivity, as different experts may have varying opinions on the importance of each criterion. By applying equal weights, we aim to provide an objective assessment that is free from individual biases and is replicable by other researchers.
Additionally, statistical methods for deriving weights, such as the entropy method or criteria based on data dispersion, were considered. However, these methods can sometimes give disproportionate influence to criteria with higher variability or outliers, potentially skewing the results. Equal weighting ensures that each criterion contributes proportionally to the overall assessment, aligning with the principle of fairness in multicriteria analysis.
Empirical studies in the field support the use of equal weights when appropriate weighting information is lacking. For example, many research articles encompass equal weighting [38,39,40,41,42,43,44], noticing that, when the relative importance of criteria cannot be established, equal weighting is a valid approach.
Moreover, in spatial data analysis, treating all variables equally helps to avoid the implicit assumption that any unconsidered variable is unimportant or should be assigned a zero weight. This is particularly pertinent when the analysis aims to be comprehensive and inclusive of all relevant factors. By not assigning fractional weight coefficients, we mitigate the risk of inadvertently overlooking significant variables and ensure that the analysis remains holistic.
Finally, the unweighted approach aligns with the goal of this study to provide an objective and equitable assessment of renewable energy development potential across the voivodeships. It facilitates a transparent comparison and avoids the complexities and potential biases associated with weight assignment, especially when such weights cannot be justified with empirical data or consensus.
While acknowledging the importance of weights in multicriteria decision-making, the decision to apply equal weights in this study is methodologically sound and supported by the literature. It ensures objectivity, transparency, and replicability, which are essential qualities in empirical research.
2.3. Stimulants vs. Destimulants
The initial analysis provides an overview of each variable, categorizing them based on their roles within the context of this research. In particular, variables were defined as stimulants or destimulants based on their expected effect on renewable energy development. With this analytical framework, fifteen variables were classified as drivers and catalysts for developing renewable energy and seven were classified as destimulants—variables that could be detrimental to the sector. The selection of variables as destimulants or stimulants of renewable energy development is based on the intrinsic qualities of each variable and the perceived effect on the renewable energy industry. The group indicators were selected based on their relevance to renewable energy development, data availability, and their use in previous studies on renewable energy assessment and sustainable development [45,46,47,48,49,50].
Each variable is categorized as a stimulant or a destimulant based on its conceptual relevance and empirical information showing its impact on the evolution of the energy sector, particularly in renewable energy sources. This approach provides a comprehensive understanding of how each variable can drive or hinder the development of renewable energy, highlighting the multi-faceted nature of the energy sector and the complex interaction of various factors that influence its direction. By identifying the variables in this way, the study provides the basis for a more focused and insightful analysis to clarify how renewable energy can be most effectively developed and the barriers that need to be overcome or mitigated.
Economic factors significantly impact the capacity for investing in renewable energy projects and the overall economic feasibility of such initiatives [49,50,51]. The selected economic indicators are as follows:
- X1: Profitability of enterprise sales (gross)—stimulant: higher profitability indicates that enterprises have more financial resources to invest in renewable energy projects. This aligns with the importance of financial performance in supporting renewable energy investments.
- X2: Enterprise investment expenditures—stimulant: increased investment expenditures suggest a proactive economic environment conducive to infrastructure development, including renewable energy.
- X3: Average monthly gross wages—stimulant: higher wages reflect greater purchasing power and can attract the skilled labor necessary for renewable energy sectors. Batra [52] highlighted the role of economic well-being in facilitating renewable energy adoption.
- X4: Cost–income ratio—destimulant: a higher cost–income ratio indicates a larger financial burden on individuals, potentially limiting available funds for renewable energy investments.
Social factors determine the readiness and capacity of a region’s workforce and society to engage with renewable energy projects [50,51]. The selected social indicators include the following:
- X5: Population density (people per 1 km2)—stimulant: higher population density can lead to increased energy demand and opportunities for economies of scale in renewable energy deployment.
- X6: Economically active population aged 15–89 years—stimulant: a larger active workforce provides the human resources necessary for developing and maintaining renewable energy infrastructure.
- X7: Percentage of long-term unemployed (13 months and longer)—destimulant: high long-term unemployment may reflect economic challenges and hinder the availability of skilled labor for renewable energy projects.
- X8: Percentage of population aged 15–64 with higher education—stimulant: a higher education level facilitates innovation and the adoption of advanced renewable energy technologies.
- X9: Adults aged 25–64 participating in education or training—stimulant: continuous education contributes to a skilled workforce capable of supporting renewable energy initiatives.
- X10: Employment rate—stimulant: high employment rates indicate economic stability, which can foster investment in renewable energy.
- X11: High school graduation exam pass rate—stimulant: educational attainment at the secondary level is essential for a knowledgeable society that can support and understand renewable energy advancements.
Environmental conditions and policies influence renewable energy development by shaping regulations and public perceptions [53,54]. The environmental indicators selected are as follows:
- X12: Devices for air pollution reduction in highly polluting plants—stimulant: the presence of pollution control devices indicates environmental commitment and may encourage shifts towards renewable energy.
- X13: Percentage of highly polluting plants equipped with dust and gas pollution reduction devices—stimulant: a higher percentage reflects stricter environmental standards and efforts to reduce emissions.
- X14: Capacity of installed devices for reducing gas and dust pollution (t/year)—stimulant: greater capacity for pollution reduction supports environmental sustainability and can complement renewable energy adoption.
- X15: Emission of gaseous pollutants (t/year)—destimulant: high emissions indicate reliance on fossil fuels and environmental degradation, posing challenges to renewable energy development. While they may incentivize shifts to renewables, their immediate effect is negative in terms of environmental quality.
- X16: Emission of dust pollutants (t/year)—destimulant: similar to gaseous emissions, high dust emissions reflect environmental harm and reliance on polluting energy sources.
- X17: Fees and revenues toward environmental protection and water management funds (per capita)—stimulant: higher revenues indicate increased funding for environmental projects, potentially supporting renewable energy initiatives.
Energy-specific factors directly affect the potential for integrating renewable sources and reflect the current energy landscape [55,56,57]. The energy indicators are as follows:
- X18: Energy performance of buildings (primary energy indicator (EP))—destimulant: a higher EP value indicates lower energy efficiency in buildings. Energy-efficient buildings are essential for maximizing the benefits of renewable energy and reducing overall energy demand.
- X19: Share of renewable energy in total electricity production (%)—stimulant: a higher share signifies existing infrastructure and experience with renewables, facilitating further development. While regions with low renewable shares have growth potential, a higher existing share indicates readiness and supportive policies, which are critical for expansion.
- X20: Ratio of electricity production to electricity consumption—stimulant: a ratio greater than one indicates that a region produces more electricity than it consumes, suggesting energy self-sufficiency and the capacity to export energy, potentially from renewable sources.
- X21: Electricity consumption (per capita in kWh)—destimulant: high per capita consumption may reflect energy inefficiency, increasing the difficulty of meeting energy demands sustainably. Lower consumption facilitates the integration of renewable energy by reducing the scale required to meet demand.
- X22: Gas consumption from the network in households (per capita in kWh)—destimulant: high gas consumption denotes reliance on fossil fuels for heating and cooking, which can impede the transition to renewable energy sources.
2.4. Moran’s I Spatial Autocorrelation
Moran’s I was calculated using the adjacency matrix and SM values to evaluate the spatial autocorrelation of synthetic meter (SM) values obtained from the TOPSIS analysis. Initially suggested by Patrick Moran [58], Moran’s I is a cross-product statistic between a variable and its spatial lag, with the variable expressed in deviations from its mean. For an observation at location i, this is described as , where is the mean of variable x. Subsequently, Moran’s I statistic is as follows:
with as the elements of the spatial weights matrix, as the sum of all the weights, and as the number of observations.
Moran’s I is a widely used measure of spatial autocorrelation, with a value of +1 indicating perfect positive spatial autocorrelation, 0 indicating no spatial autocorrelation, and −1 indicating perfect negative spatial autocorrelation.
3. Results
The analysis revealed regional disparities in renewable energy development, as shown by the TOPSIS rankings (Table 2). These indicators comprise a hierarchy in which higher synthetic measures suggest better engagement in and advancement of renewable energy initiatives. This assessment is not one-dimensional but captures the economic landscape, regulatory frameworks, technological advances, social policy, and environmental commitments involved in renewable energy development. The final rankings thus provide an understanding of the country’s position in renewable energy development, offering a clearer insight into global trends, policy, and strategic decision-making in pursuing a sustainable energy future.
Table 2.
Synthetic measure of the development of renewable energy sources in 2023 by country.
The TOPSIS analysis of renewable energy development across Polish voivodeships for 2023 provides a detailed perspective on each region’s relative performance and potential. The synthetic measure (SM) scores reflect the multifaceted economic, social, environmental, and energy-related factors influencing renewable energy growth.
Moran’s I Spatial Autocorrelation Analysis
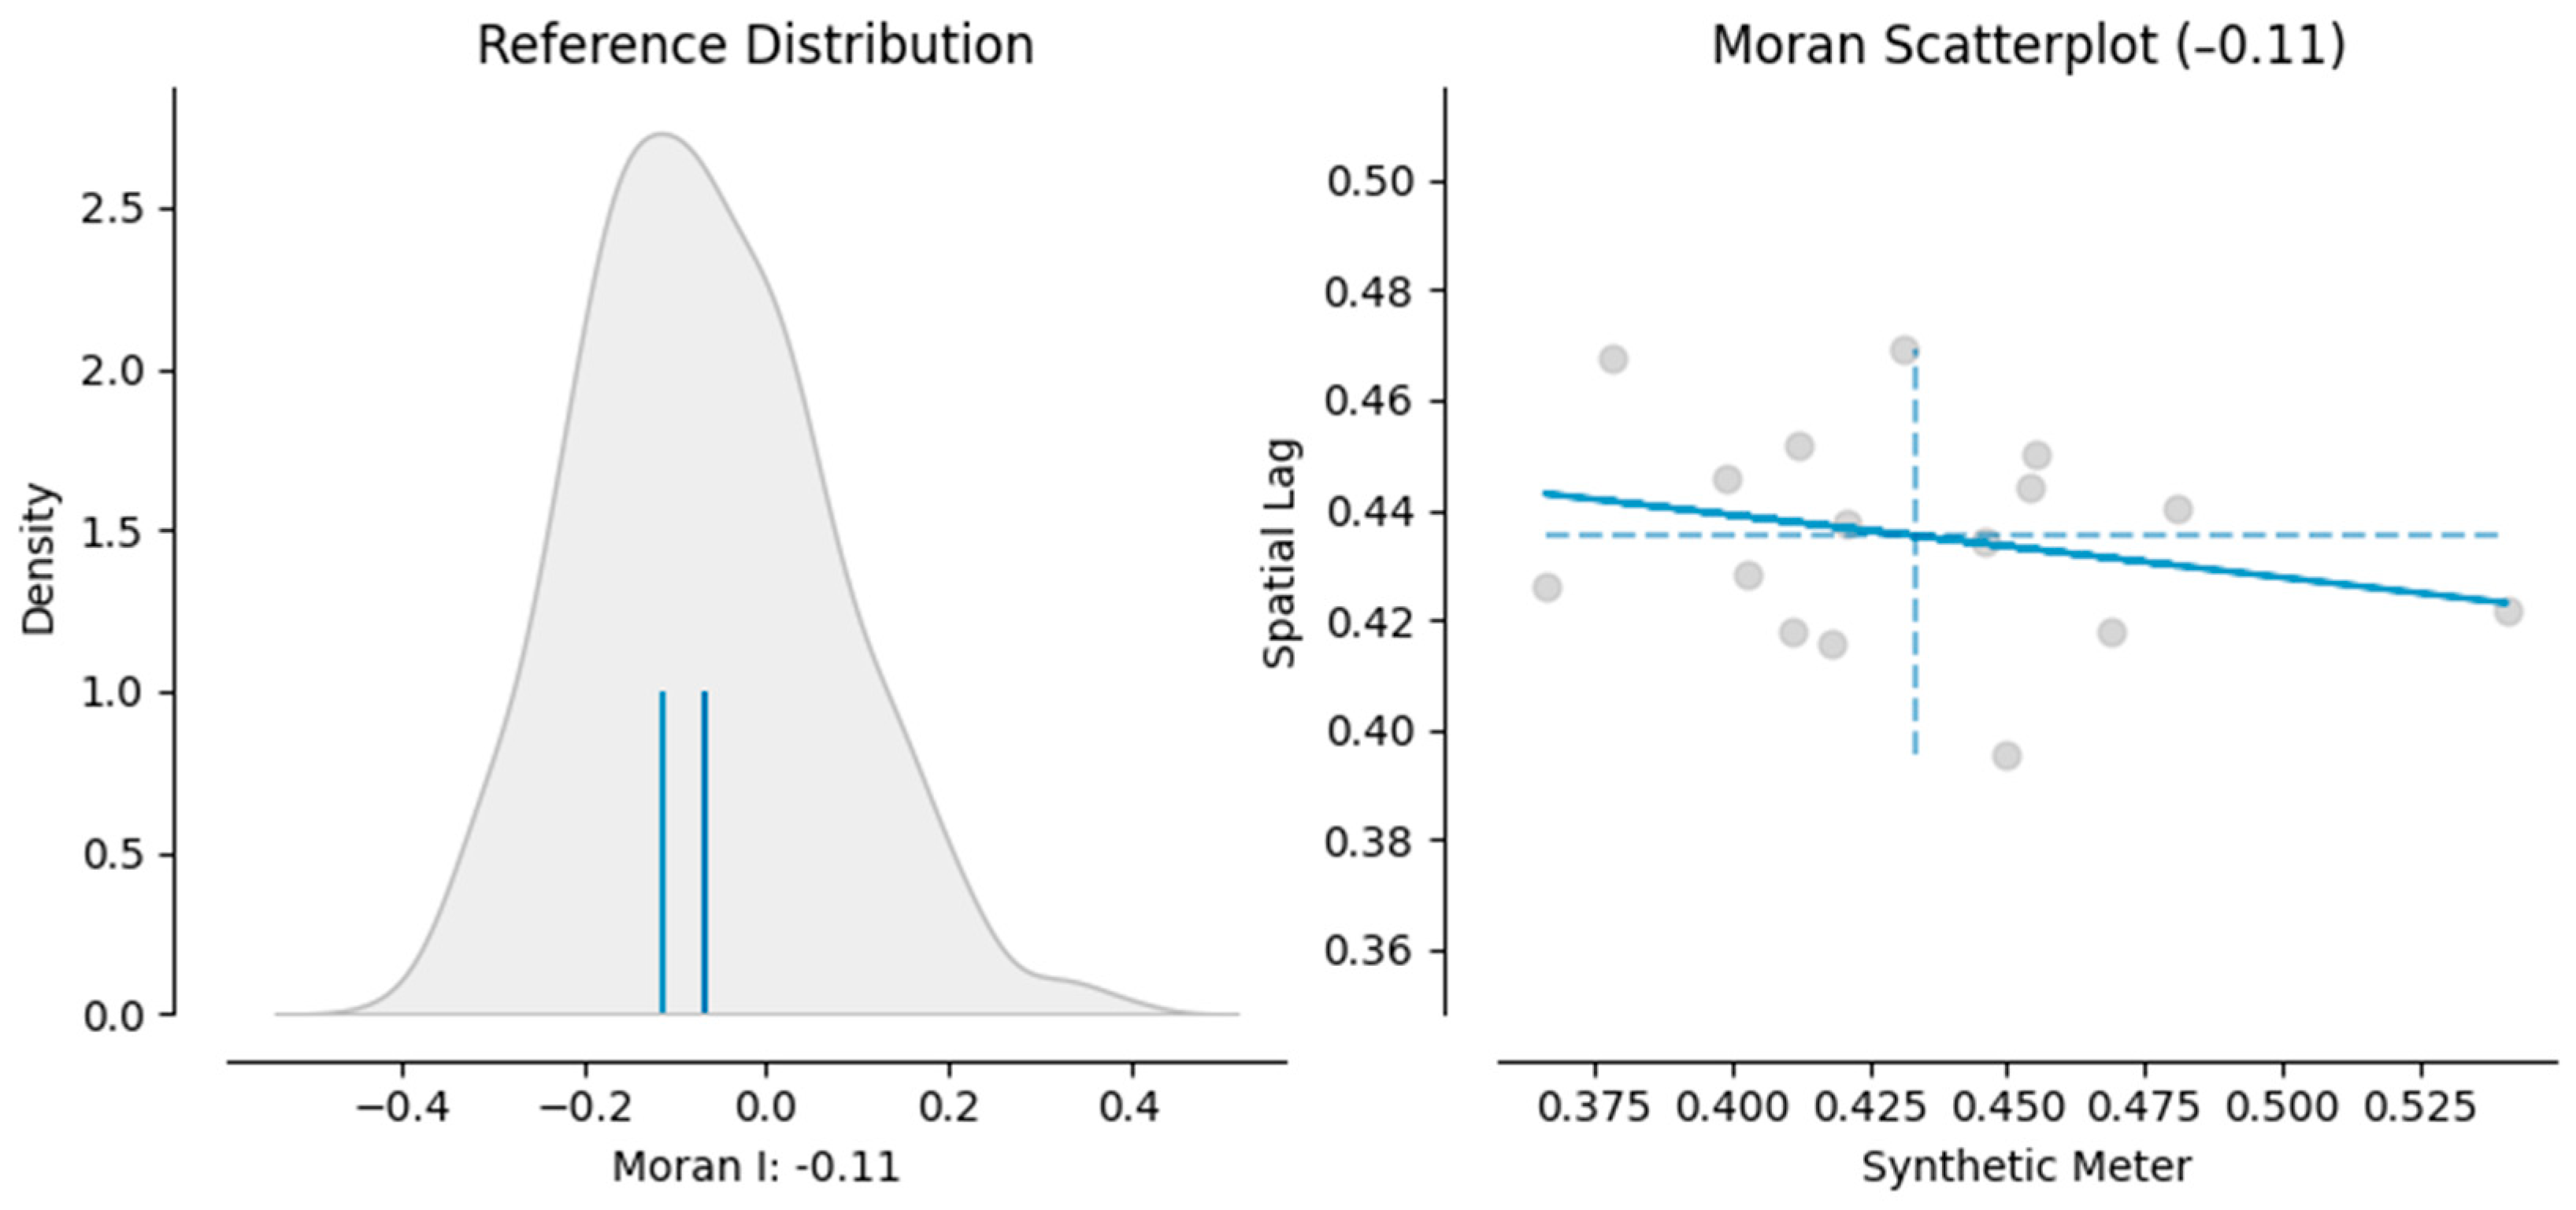
For this dataset, the computed Moran’s I value is −0.1137, suggesting a slight negative spatial autocorrelation. This indicates that neighboring regions tend to have dissimilar SM values, though the strength of this relationship is relatively weak. In this case, regions with higher SM values are somewhat surrounded by regions with lower SM values, and vice versa. However, this is not a strong pattern, as indicated by the relatively small Moran’s I value.
The Z score for the Moran’s I statistic is 0.303, and the associated p value is 0.752. The Z score measures how far Moran’s I value is from the expected value under the null hypothesis of spatial randomness, and the p value tests the significance of this result. Because the p value is much higher than the common alpha level of 0.05, the observed spatial pattern is not statistically significant at the conventional alpha level. This implies that the observed spatial pattern of SM values is not significantly different from a random spatial distribution.
The output generated by Python provides Moran’s I statistic along with Moran scatter plot, which is designed to visualize the nature and strength of spatial autocorrelation. The slope of the regression line in the scatter plot corresponds to the value of Moran’s I. The x axis displays the standardized values of the variables being analyzed, while the y axis shows the standardized spatial lag of the same variable.
The scatter plot is divided into four quadrants, each representing different types of spatial associations [59]:
- Quadrant I: High values of the variable surrounded by high values (high-high).
- Quadrant II: Low values surrounded by high values (low-high).
- Quadrant III: Low values surrounded by low values (low-low).
- Quadrant IV: High values surrounded by low values (high-low).
The scatter plot provides valuable insights into spatial patterns. For instance, Quadrant I can highlight areas where high values cluster together, potentially indicating favorable economic conditions for renewable energy development. The values in Quadrants I and III (high-high and low-low) are often key drivers of spatial dependence in the data. By focusing on these quadrants, further comparisons can be made to examine patterns, such as shifts in economic conditions or the coexistence of different local policies supporting renewable energy development in the same areas.
This method allows for a clearer understanding of how spatial relationships and dependencies manifest within the dataset, facilitating cross-variable comparisons.
The Moran scatter plot (Figure 1) illustrates the relationship between the synthetic measure (SM) values and their spatial lag, showing a negative Moran’s I value (−0.114). This weak negative spatial autocorrelation suggests that regions with high SM values are slightly more likely to be surrounded by regions with low SM values, and vice versa. The data points are relatively dispersed around the origin, indicating no strong clustering pattern of similar values across the dataset. However, the result is not statistically significant, meaning that the observed spatial pattern could be due to random chance rather than a true underlying spatial relationship.
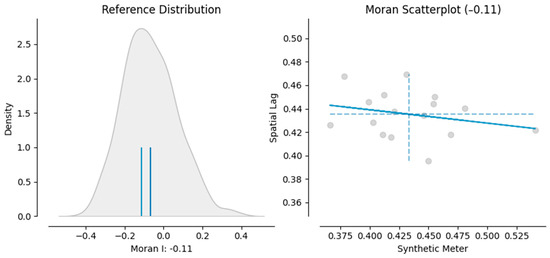
Figure 1.
Moran scatterplot. Source: authors’ research.
Regions falling into the high-low and low-high quadrants reflect areas where the SM values and their neighbors are inversely related. These quadrants are key to understanding the negative spatial autocorrelation, which hints at contrasting conditions between neighboring regions. For example, economically stronger voivodeships (with higher SM values) might be adjacent to economically weaker regions, potentially reflecting uneven regional development or divergent policy impacts on renewable energy initiatives.
The concentration of points around the axes suggests minimal spatial clustering, indicating that spatial dependence is not a dominant feature in the distribution of SM values across the analyzed regions. This lack of strong spatial autocorrelation may reflect heterogeneity in local factors, such as policy variations, geographic constraints, or socioeconomic conditions.
Figure 2 visualizes the local indicators of spatial association (LISA) map analysis, categorizing regions into high-high, low-low, high-low, and low-high clusters. These clusters identify local spatial associations and spatial outliers:
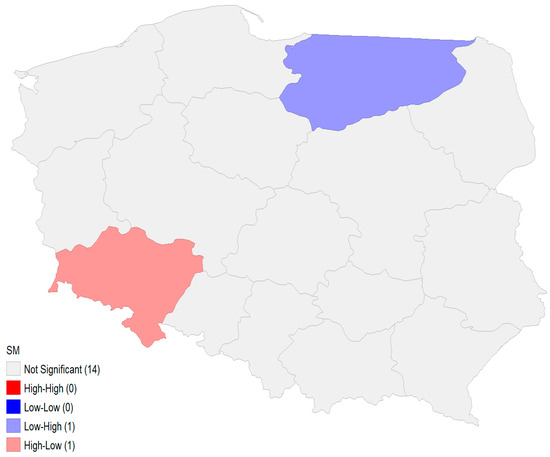
Figure 2.
Local indicators of spatial association map. Source: authors’ research.
- Low-high cluster (in light blue) is observed in the Warmińsko-Mazurskie voivodeship, which has low SM values but is surrounded by regions with higher SM values.
- High-low cluster (in light red) is identified in the Dolnośląskie voivodeship, indicating it has high SM values but is neighboring regions with lower SM values.
Significant areas are limited to these clusters, while most regions fall into areas that are not significant, meaning local spatial autocorrelation is not present in these regions. These results reflect the overall weak negative global spatial autocorrelation detected by Moran’s I, as only a few localized clusters demonstrate certain spatial relationships.
4. Discussion
This work presents an overview of renewable energy development potentials in Polish voivodeships by employing the TOPSIS method and spatial autocorrelation analysis based on this study. The findings offer valuable insights into the regional disparities and underlying factors driving renewable energy initiatives, allowing a broader understanding of the regional picture of renewable energy development.
Our results show that the synthetic indicator score demonstrates the highest potential for the development of renewable energy in the Mazowiecki voivodeship. This can be attributed to its robust economic conditions, significant investments in renewable technologies, and favorable socio-economic factors such as high enterprise investment expenditures and a well-educated workforce. Similar observations have been reported in previous studies. For instance, Igliński et al. [60] have highlighted that regions with stronger economic bases and higher levels of human capital tend to have greater capacities for renewable energy investments, emphasizing the role of economic prosperity in facilitating renewable energy projects.
Małopolskie and Pomorskie voivodeships also demonstrate strong potential, ranking second and third in our analysis, respectively. These regions benefit from strategic investments in wind and solar energy sectors and possess socio-economic characteristics conducive to renewable energy development. This aligns with findings by Brelik et al. [61], who noted that coastal regions like Pomorskie leverage their geographical advantages to develop offshore wind energy projects, capitalizing on natural resources to boost renewable energy capacities.
The middle-tier performers, including Podlaskie, Świętokrzyskie, Dolnośląskie, and Śląskie, exhibit moderate potential for renewable energy growth. Our analysis suggests that, while these regions have strengths in certain indicators, they may face challenges such as transitioning from traditional fossil fuel industries to renewable energy sectors. This observation is consistent with Newman et al. and Holechek et al. [62,63], who discussed the difficulties industrial regions encounter when shifting to sustainable energy practices due to infrastructural and economic dependencies on conventional energy sources.
Lower-ranking regions like Lubelskie and Lubuskie face significant challenges, as indicated by their lower synthetic indicator scores. Economic constraints, policy inefficiencies, and limited infrastructure may hinder their renewable energy progress. These findings correspond with [64,65,66], who identified similar barriers in underperforming regions and emphasized the need for targeted policy interventions to address specific regional hurdles.
Regarding our second research question, the spatial autocorrelation analysis yielded a Moran’s I value of –0.1137 with a Z score of 0.303 and a p value of 0.752, indicating a weak negative spatial autocorrelation that is not statistically significant. This suggests that the distribution of renewable energy potential across voivodeships is largely random and not influenced by spatial proximity. This finding contrasts with studies in other countries where spatial clustering of renewable energy development has been observed. For example, Refs. [67,68,69] found significant positive spatial autocorrelation in renewable energy adoption among neighboring regions, attributed to policy diffusion and regional collaborations.
The lack of significant spatial autocorrelation in our study implies that factors influencing renewable energy development in Polish voivodeships are more localized and not necessarily affected by neighboring regions’ performance. This could be due to the centralized nature of policy implementation in Poland or diverse regional characteristics that overshadow potential spatial spillover effects. Previous research by Śleszyński [70] supports this interpretation, suggesting that the role of local government units is negligible.
When combining the insights from both TOPSIS and Moran’s I analyses, it becomes evident that renewable energy development in Poland is influenced by a complex relationship of region-specific factors rather than spatial proximity. The leading regions demonstrate that strong economic performance, effective policies, significant investments, and higher education levels contribute substantially to advancing renewable energy initiatives.
For regions lagging in renewable energy development, the following recommendations could be considered:
- Policy enhancement: developing and implementing policies that encourage investment in renewable energy infrastructure and technologies.
- Economic support: providing financial incentives or support to overcome economic constraints that hinder renewable energy projects.
- Education and training: investing in education and training programs to build a skilled workforce capable of supporting renewable energy initiatives.
- Technological advancement: facilitating access to advanced renewable energy technologies and promoting innovation.
- Resource utilization: leveraging unique regional resources, such as natural environments suitable for specific types of renewable energy (e.g., biomass in forested areas or wind energy in coastal regions).
Understanding that spatial factors have a minimal influence on renewable energy development, policymakers should focus on these non-spatial determinants in order to design effective strategies tailored to each region’s unique characteristics and needs. Sharing best practices and success stories from leading voivodeships can provide valuable models for other voivodships aiming to enhance their renewable energy capabilities.
These findings have important implications for policymakers and stakeholders aiming to promote renewable energy in Poland. Because spatial proximity does not play a substantial role in renewable energy potential, efforts should focus on enhancing region-specific factors such as economic incentives, policy frameworks, education, and technological support. Tailored strategies that address the unique barriers and leverage the strengths of each voivodeship are essential. Moreover, the findings contribute to the understanding of renewable energy development in the context of regional disparities. The disparities observed among Polish voivodeships highlight the need for equitable resource allocation and capacity-building initiatives. By learning from the leading regions, lower-performing voivodeships can adopt best practices and adapt them to their specific contexts.
While this study provides valuable insights, it has certain limitations. The analysis relies on indicators available from the Local Data Bank of Poland, which may not capture all relevant factors influencing renewable energy development, such as political stability, public acceptance, or technological innovation capacity. Furthermore, the study employs a cross-sectional approach, providing a snapshot in time without capturing temporal dynamics or trends. Longitudinal studies could offer deeper insights into how renewable energy potential evolves in response to policy changes or technological advancements.
Future research could explore alternative methods or sensitivity analyses to assess the robustness of the findings.
5. Conclusions
This study investigated the potential for renewable energy development across Polish voivodeships and examined whether spatial autocorrelation influences the clustering of this potential. By analyzing 22 economic, social, environmental, and energy-related indicators using the TOPSIS method and performing spatial analysis with Moran’s I statistic, the following conclusions were drawn:
- Mazowieckie, Małopolskie, and Pomorskie voivodeships have the greatest potential for renewable energy development in Poland:
- These regions benefit from robust economic conditions, significant investments in renewable energy technologies, and favorable socio-economic factors.
- Their leading positions highlight the crucial role of strong economic bases and human capital in facilitating renewable energy initiatives.
- Spatial autocorrelation does not significantly influence the clustering of renewable energy development potential among Polish voivodeships:
- The Moran’s I statistic indicated a weak negative spatial autocorrelation that was not statistically significant.
- This suggests that the distribution of renewable energy potential is largely random and not driven by spatial proximity or neighboring effects.
- Non-spatial, localized factors predominantly influence renewable energy development potential in Poland:
- Factors such as economic prosperity, policy frameworks, investment levels, education, and technological support within individual voivodeships play a more critical role than spatial relationships.
- Tailored regional strategies are essential for addressing the unique opportunities and challenges in each voivodeship.
- Policy implications point to the need for region-specific interventions to promote renewable energy adoption:
- Policymakers should focus on enhancing economic conditions, providing financial incentives, investing in education and training, and improving access to advanced renewable energy technologies.
- Sharing best practices from leading regions can help lower-performing voivodeships enhance their renewable energy capabilities.
- Future research should explore additional non-spatial factors and consider longitudinal studies that achieve the following:
- The incorporation of variables such as political stability, public acceptance, and innovation capacity could provide deeper insights.
- The analysis of temporal trends may reveal how renewable energy potential evolves in response to policy changes and technological advancements.
By directly addressing the research questions, this study contributes to a better understanding of renewable energy development potential at the regional level in Poland. The findings highlight that, while some regions lead in renewable energy initiatives due to favorable local factors, spatial proximity does not significantly impact the distribution of renewable energy potential. This underscores the importance of localized approaches and region-specific policies to advance renewable energy adoption, supporting Poland’s commitment to sustainable development and environmental stewardship.
Funding
The publication was financed by the Polish Minister of Science and Higher Education as part of the Strategy of the Poznan University of Life Sciences for 2024–2026 in the field of improving scientific research and development work in priority research areas.
Institutional Review Board Statement
Not applicable.
Informed Consent Statement
Not applicable.
Data Availability Statement
The raw data supporting the conclusions of this article will be made available by the authors on request.
Conflicts of Interest
The author declares no conflicts of interest.
References
- Zhang, W.; Wang, X.; Zhai, T.Y. Assessment of environmental and sustainability challenges in renewable energy. IOP Conf. Ser. Earth Environ. Sci. 2019, 344, 012171. [Google Scholar] [CrossRef]
- Su, H.; Ali, F.; Lyulyov, O.; Pimonenko, T.; Chen, Y. Renewable energy development efficiency: Spatial dynamic evolution and influencing factors. Nat. Resour. Forum 2023, 47, 1392–1416. [Google Scholar] [CrossRef]
- Kosfeld, R.; Gückelhorn, F. Regional value added through local production of renewable energy. Raumforsch. Raumordn. 2012, 70, 437–449. [Google Scholar] [CrossRef]
- Szaruga, E.; Frankowska, M.; Drela, K. Spatial autocorrelation of power grid instability in the context of electricity production from renewable energy sources in polish regions. Energy Rep. 2022, 8 (Suppl. 15), 276–284. [Google Scholar] [CrossRef]
- Peng, X.; Gao, G.; Hu, G.; Guo, Y.; Cao, J.; Zhao, J. Research on inter-regional renewable energy accommodation assessment method based on time series production simulation. In Proceedings of the 2019 IEEE Sustainable Power and Energy Conference (iSPEC), Beijing, China, 21–23 November 2019; pp. 2031–2036. [Google Scholar] [CrossRef]
- Youssoufi, E.L.; Bousfoul, H. Impact of renewable energies on the economic development of North African countries: Regression analysis of cointegrated panels. Afr. Sci. J. 2021, 3, 338. [Google Scholar] [CrossRef]
- International Renewable Energy Agency (IRENA). Renewable Energy Statistics; IRENA: Abu Dhabi, United Arab Emirates, 2020; ISBN 978-92-9260-246-8. [Google Scholar]
- Damu, D.N.A.; Wong, B.S.C.; Chai, J.Y.; Wong, C.Y.K.; Afrouzi, H.N.; Hassan, A.A. A review of renewable energy development in Asean, policies, environmental and economic impact. Future Sustain. Open Access J. 2023, 1, 13–22. [Google Scholar] [CrossRef]
- Sharma, K.; Sharma, D.; Kumar, C. Sustainable development through renewable energy: A comprehensive approach. Int. J. Multidiscip. Res. 2023, 5, 1–9. [Google Scholar] [CrossRef]
- Demessinova, A.; Saparbayev, A.; Seidakhmetov, M.; Kydyrova, Z.; Onlasynov, E.; Shadiyeva, A.; Demeubayeva, A.; Daurbayeva, M. Renewable energy sector of Kazakhstan: Factors of its sustainable development. Int. J. Manag. Bus. Res. 2018, 8, 34–51. [Google Scholar]
- Jacobson, M.Z.; Delucchi, M.A.; Cameron, M.A.; Mathiesen, B.V. Matching demand with supply at low cost among 139 countries within 20 world regions with 100% intermittent wind, water, and sunlight (WWS) for all purposes. Renew. Energy 2018, 123, 236–248. [Google Scholar] [CrossRef]
- Wei, M.; Patadia, S.; Kammen, D.M. Putting renewables and energy efficiency to work: How many jobs can the clean energy industry generate in the US? Energy Policy 2010, 38, 919–931. [Google Scholar] [CrossRef]
- Tóth, A.; Bencs, P. Regulations governing the transformation of renewable energy. Jelenkori Társadalmi Gazdasági Folyamatok 2023, 18, 503–513. [Google Scholar] [CrossRef]
- Johnstone, N.; Haščič, I.; Popp, D. Renewable energy policies and technological innovation: Evidence based on patent counts. Environ. Resour. Econ. 2010, 45, 133–155. [Google Scholar] [CrossRef]
- Markandya, A.; Armstrong, B.G.; Hales, S.; Chiabai, A.; Criqui, P.; Mima, S.; Tonne, C.; Wilkinson, P. Public health benefits of strategies to reduce greenhouse-gas emissions: Low-carbon electricity generation. Lancet 2009, 374, 2006–2015. [Google Scholar] [CrossRef] [PubMed]
- Medvedkina, Y.; Khodochenko, A.V. Renewable energy and their impact on environmental pollution in the context of globalization. In Proceedings of the 2020 International Multi-Conference on Industrial Engineering and Modern Technologies (FarEastCon), Vladivostok, Russia, 6–9 October 2020. [Google Scholar] [CrossRef]
- Omer, A. Environmental and socio-economic aspects of possible development in renewable energy use. In Proceedings of the World Renewable Energy Congress 2011, Linköping, Sweden, 8–13 May 2011; Available online: http://www.ep.liu.se/ecp/057/vol1/047/ecp57vol1_047.pdf (accessed on 10 October 2024).
- Hwang, C.L.; Yoon, K. Multiple Attribute Decision Making: Methods and Applications; Springer: New York, NY, USA, 1981. [Google Scholar]
- Algarni, S.; Tirth, V.; Alqahtani, T.; Alshehery, S.; Kshirsagar, P. Contribution of renewable energy sources to the environmental impacts and economic benefits for sustainable development. Sustain. Energy Technol. Assess. 2023, 56, 103098. [Google Scholar] [CrossRef]
- Ackermann, T.; Andersson, G.; Söder, L. Distributed generation: A definition. Electr. Power Syst. Res. 2001, 57, 195–204. [Google Scholar] [CrossRef]
- International Energy Agency. Sustainable Recovery: World Energy Outlook Special Report; OECD Publishing: Paris, France, 2020. [Google Scholar]
- Shao, M.; Han, Z.; Sun, J.; Xiao, C.; Zhang, S.; Zhao, Y. A review of multi-criteria decision making applications for renewable energy site selection. Renew. Energy 2020, 157, 377–403. [Google Scholar] [CrossRef]
- Ren, J. Multi-criteria decision making for the prioritization of energy systems under uncertainties after life cycle sustainability assessment. Sustain. Prod. Consum. 2018, 16, 45–57. [Google Scholar] [CrossRef]
- Kaya, T.; Kahraman, C. Multicriteria renewable energy planning using an integrated fuzzy VIKOR & AHP methodology: The case of Istanbul. Energy 2010, 35, 2517–2527. [Google Scholar] [CrossRef]
- San Cristóbal, J.R. Multi-criteria decision-making in the selection of a renewable energy project in Spain: The VIKOR method. Renew. Energy 2011, 36, 498–502. [Google Scholar] [CrossRef]
- Kowalski, K.; Stagl, S.; Madlener, R.; Omann, I. Sustainable energy futures: Methodological challenges in combining scenarios and participatory multi-criteria analysis. Eur. J. Oper. Res. 2009, 197, 1063–1074. [Google Scholar] [CrossRef]
- Burton, J.; Hubacek, K. Is small beautiful? A multicriteria assessment of small-scale energy technology applications in local governments. Energy Policy 2007, 35, 6402–6412. [Google Scholar] [CrossRef]
- Piwowarski, M.; Borawski, M.; Nermend, K. The problem of non-typical objects in the multidimensional comparative analysis of the level of renewable energy development. Energies 2021, 14, 5803. [Google Scholar] [CrossRef]
- Gunnarsdottir, I.; Davidsdottir, B.; Worrell, E.; Sigurgeirsdottir, S. Review of indicators for sustainable energy development. Renew. Sustain. Energy Rev. 2020, 133, 110294. [Google Scholar] [CrossRef]
- Kourkoumpas, D.-S.; Benekos, G.; Nikolopoulos, N.; Karellas, S.; Grammelis, P.; Kakaras, E. A review of key environmental and energy performance indicators for the case of renewable energy systems when integrated with storage solutions. Appl. Energy 2018, 231, 380–398. [Google Scholar] [CrossRef]
- Papież, M.; Śmiech, S.; Frodyma, K. Determinants of renewable energy development in the EU countries: A 20-year perspective. Renew. Sustain. Energy Rev. 2018, 91, 918–934. [Google Scholar] [CrossRef]
- Chaabouni, S.; Saidi, K. The dynamic links between carbon dioxide (CO2) emissions, health spending and GDP growth: A case study for 51 countries. Environ. Res. 2017, 158, 137–144. [Google Scholar] [CrossRef] [PubMed]
- Sojczyński, L. Wskaźniki Atrakcyjności Kraju pod Względem OZE. GLOBEnergia Odnawialne Źródła Energii. 2012. Available online: https://globenergia.pl/kotly-na-biomase-sredniej-i-duzej-mocy/ (accessed on 8 October 2024).
- Saaty, T.L. The Analytic Hierarchy Process: Planning, Priority Setting, Resource Allocation; McGraw-Hill: New York, NY, USA, 1980. [Google Scholar]
- Opricovic, S.; Tzeng, G.-H. Compromise solution by MCDM methods: A comparative analysis of VIKOR and TOPSIS. Eur. J. Oper. Res. 2004, 156, 445–455. [Google Scholar] [CrossRef]
- Młodak, A. Analiza Taksonomiczna w Statystyce Regionalnej; Difin: Warsaw, Poland, 2006. [Google Scholar]
- Balicki, A. Statystyczna Analiza Wielowymiarowa i jej Zastosowanie Społeczno-Ekonomiczne; Wydawnictwo Uniwersytetu Gdańskiego: Gdańsk, Poland, 2009. [Google Scholar]
- Liern, V.; Pérez-Gladish, B. Building composite indicators with unweighted-TOPSIS. IEEE Trans. Eng. Manag. 2023, 70, 1871–1880. [Google Scholar] [CrossRef]
- Genc, T. Sensitivity analysis on PROMETHEE and TOPSIS weights. Int. J. Manag. Decis. Mak. 2014, 13, 403–421. [Google Scholar] [CrossRef]
- Vavrek, R.; Kotulic, R.; Adamisin, P. Evaluation of municipalities management with the Topsis technique emphasizing the impact of weights of established criteria. J. Local Self Gov. 2015, 13, 249–264. [Google Scholar] [CrossRef]
- Roszkowska, E. Rank ordering criteria weighting methods–A comparative overview. Optimum. Stud. Ekon. 2013, 5, 14–33. [Google Scholar] [CrossRef]
- Vicens-Colom, J.; Holles, J.; Liern, V. Measuring sustainability with unweighted TOPSIS: An application to sustainable tourism in Spain. Sustainability 2021, 13, 5283. [Google Scholar] [CrossRef]
- Ferdous, J.; Bensebaa, F.; Milani, A.S.; Hewage, K.; Bhowmik, P.; Pelletier, N. Development of a generic decision tree for the integration of Multi-Criteria Decision-Making (MCDM) and Multi-Objective Optimization (MOO) Methods under uncertainty to facilitate sustainability assessment: A methodical review. Sustainability 2024, 16, 2684. [Google Scholar] [CrossRef]
- Madanchian, M.; Taherdoost, H. A comprehensive guide to the TOPSIS method for multi-criteria decision making. Sustain. Soc. Dev. 2023, 1, 2220. [Google Scholar] [CrossRef]
- Kumar, M. Social, economic, and environmental impacts of renewable energy resources. In Wind Solar Hybrid Renewable Energy System; IntechOpen: London, UK, 2020; Volume 1. [Google Scholar]
- Santoyo-Castelazo, E.; Azapagic, A. Sustainability assessment of energy systems: Integrating environmental, economic, and social aspects. J. Clean. Prod. 2014, 80, 119–138. [Google Scholar] [CrossRef]
- Jaiswal, K.K.; Chowdhury, C.R.; Yadav, D.; Verma, R.; Dutta, S.; Jaiswal, K.S.; Sangmesh, B.; Karuppasamy, K.S.K. Renewable and sustainable clean energy development and impact on social, economic, and environmental health. Energy Nexus 2022, 7, 100118. [Google Scholar] [CrossRef]
- Hassan, R.; Das, B.K.; Hasan, M. Integrated off-grid hybrid renewable energy system optimization based on economic, environmental, and social indicators for sustainable development. Energy 2022, 250, 123823. [Google Scholar] [CrossRef]
- Manara, P.; Zabaniotou, A. Indicator-based economic, environmental, and social sustainability assessment of a small gasification bioenergy system fueled with food processing residues from the mediterranean agro-industrial sector. Sustain. Energy Technol. Assess. 2014, 8, 159–171. [Google Scholar]
- Gallego, I. The use of economic, social and environmental indicators as a measure of sustainable development in Spain. Corp. Soc. Responsib. Environ. Manag. 2006, 13, 78–97. [Google Scholar] [CrossRef]
- Farghali, M.; Osman, A.I.; Chen, Z.; Abdelhaleem, A.; Ihara, I.; Mohamed, I.M.A.; Yap, P.-S.; Rooney, D.W. Social, environmental, and economic consequences of integrating renewable energies in the electricity sector: A review. Environ. Chem. Lett. 2023, 21, 1381–1418. [Google Scholar] [CrossRef]
- Batra, G. Renewable energy economics: Achieving harmony between environmental protection and economic goals. Soc. Sci. Chron. 2023, 2, 1–32. [Google Scholar] [CrossRef]
- Omer, A.M. Energy, environment and sustainable development. Renew. Sustain. Energy Rev. 2008, 12, 2265–2300. [Google Scholar] [CrossRef]
- Østergaard, P.A.; Duic, N.; Noorollahi, Y.; Mikulcic, H.; Kalogirou, S. Sustainable development using renewable energy technology. Renew. Energy 2020, 146, 2430–2437. [Google Scholar] [CrossRef]
- Vera, I.; Langlois, L. Energy indicators for sustainable development. Energy 2007, 32, 875–882. [Google Scholar] [CrossRef]
- Neves, A.R.; Leal, V. Energy sustainability indicators for local energy planning: Review of current practices and derivation of a new framework. Renew. Sustain. Energy Rev. 2010, 14, 2723–2735. [Google Scholar] [CrossRef]
- Liu, G.; Li, G.; Li, M.; Zhou, B.; Chen, Y.; Liao, S. General indicator for techno-economic assessment of renewable energy resources. Energy Convers. Manag. 2018, 156, 416–426. [Google Scholar] [CrossRef]
- Moran, P. The interpretation of statistical maps. J. R. Stat. Soc. Ser. B Methodol. 1948, 10, 243–251. [Google Scholar] [CrossRef]
- Guțoiu, G. Spatial polarization in Bucharest at the 2014 presidential election. South East Eur. J. Polit. Sci. 2015, 12, 1–18. [Google Scholar]
- Igliński, B.; Skrzatek, M.; Kujawski, W.; Cichosz, M.; Buczkowski, R. SWOT analysis of renewable energy sector in Mazowieckie Voivodeship (Poland): Current progress, prospects, and policy implications. Environ. Dev. Sustain. 2022, 24, 77–111. [Google Scholar] [CrossRef]
- Brelik, A.; Nowaczyk, P.; Cheba, K. The economic importance of offshore wind energy development in Poland. Energies 2023, 16, 7766. [Google Scholar] [CrossRef]
- Newman, P.; Beatley, T.; Boyer, H. Resilient Cities: Overcoming Fossil Fuel Dependence; Island Press: Washington, DC, USA, 2017. [Google Scholar]
- Holechek, J.L.; Geli, H.M.E.; Sawalhah, M.N.; Valdez, R. A global assessment: Can renewable energy replace fossil fuels by 2050? Sustainability 2022, 14, 4792. [Google Scholar] [CrossRef]
- Rodríguez-Pose, A.; Bartalucci, F.; Lozano-Gracia, N.; Dávalos, M.; Rodríguez-Pose, A.; Bartalucci, F.; Lozano-Gracia, N.; Dávalos, M.; Rodríguez-Pose, A.; Bartalucci, F.; et al. Overcoming left-behindedness: Moving beyond the efficiency versus equity debate in territorial development. Reg. Sci. Policy Pract. 2024, 16, 100144. [Google Scholar] [CrossRef]
- Burzyńska, D. Rola Inwestycji Ekologicznych w Zrównoważonym Rozwoju Gmin w Polsce; Wydawnictwo Uniwersytetu Łódzkiego: Łódź, Poland, 2012. [Google Scholar]
- Śniegocki, A.; Wetmańska, Z. Nowe Fundamenty; WiseEuropa: Warszawa, Poland, 2017; ISBN 978-83-64813-33-7. [Google Scholar]
- Fadly, D.; Fontes, F. Geographical Proximity and Renewable Energy Diffusion: An Empirical Approach. Energy Policy 2019, 129, 422–435. [Google Scholar] [CrossRef]
- Huang, P.; Liu, Y. Renewable energy development in China: Spatial clustering and socio-spatial embeddedness. Curr. Sustain. Renew. Energy Rep. 2017, 4, 38–43. [Google Scholar] [CrossRef]
- Scaramuzzino, C.; Garegnani, G.; Zambelli, P. Integrated approach for the identification of spatial patterns related to renewable energy potential in European territories. Renew. Sustain. Energy Rev. 2019, 101, 1–13. [Google Scholar] [CrossRef]
- Śleszyński, P.; Nowak, M.; Brelik, A.; Mickiewicz, B.; Oleszczyk, N. Planning and settlement conditions for the development of renewable energy sources in Poland: Conclusions for local and regional policy. Energies 2021, 14, 1935. [Google Scholar] [CrossRef]

Disclaimer/Publisher’s Note: The statements, opinions and data contained in all publications are solely those of the individual author(s) and contributor(s) and not of MDPI and/or the editor(s). MDPI and/or the editor(s) disclaim responsibility for any injury to people or property resulting from any ideas, methods, instructions or products referred to in the content. |
© 2024 by the author. Licensee MDPI, Basel, Switzerland. This article is an open access article distributed under the terms and conditions of the Creative Commons Attribution (CC BY) license (https://creativecommons.org/licenses/by/4.0/).