Article

Using the Degree-Day Method to Analyze Central Heating Energy Consumption in Cities of Northern China

1
Center of Architecture Research and Design, University of Chinese Academy of Sciences, Beijing 100190, China
2
State Key Laboratory of Urban and Regional Ecology, Research Center for Eco-Environmental Sciences, Chinese Academy of Sciences, Beijing 100085, China
*
Authors to whom correspondence should be addressed.
Sustainability 2024, 16(3), 1008; https://doi.org/10.3390/su16031008
Submission received: 12 December 2023 / Revised: 17 January 2024 / Accepted: 21 January 2024 / Published: 24 January 2024

Abstract

:
In the context of global population growth and energy scarcity, building energy consumption has become a critical issue with implications for the sustainable development of human society. Winter heating consumption constitutes a large portion of total energy used in buildings, especially in regions with cold climates. This paper employs the degree-day method to analyze the energy consumption of central heating in northern Chinese cities. The study sample consists of 60 target cities, including 30 located in severe cold regions and the remaining 30 in cold regions. By utilizing heating energy consumption and climate data from 2019, the relationships between heating intensity (kWh/m2) and heating degree days (HDDs) are established for the selected cities. Additionally, statistical analysis and model comparisons are conducted. The results show strong positive correlations between heating intensity and HDDs in both severe cold regions and cold regions, with the actual heating base temperatures for the two regions being 21 °C and 22.3 °C, respectively. Moreover, the deviation index of heating intensity is introduced to analyze the energy consumption characteristics of central heating in northern cities from three perspectives: city size, level of heating development, and geographical regions. The analysis suggests that cities with large population, strong economies, and high levels of development exhibit better energy-saving performance. Lastly, several improvement suggestions are proposed to address the potential problems related to energy conservation of central heating systems in cities of northern China.

1. Introduction

Currently, China is the largest energy consumer in the world [1]. Among all energy consuming departments, the building industry accounts for the highest energy consumption, exceeding 30% [2]. Thus, the subject of building energy conservation has become extremely topical. The majority of building energy consumption occurs during its operational phase, which includes heating, cooling, ventilation, lighting, appliance usage, domestic hot water, and cooking. Collectively, these activities contribute to approximately 80% to 85% of the building’s life cycle energy consumption [3]. Based on statistical data, the operational energy consumption of buildings accounts for approximately 25% of China’s national total energy consumption [4]. A substantial portion of it is utilized for heating and cooling purposes, closely tied to climatic factors [5].
As more than half of China’s territory is situated in the northern areas [6], there exists a notable demand for heating in buildings. To ensure indoor thermal comfort during winter, cities in northern China commonly adopt the central heating mode, with a coverage rate surpassing 85% [7]. Unlike other countries, central heating in China is centrally controlled by state-owned thermal companies. Thermal energy originates from a heat source, passes through heat-exchange stations, and ultimately reaches building terminals via the pipe network. The heating supplied is controlled by heat-exchange stations at different levels [8], and residents are typically unable to adjust it individually on the user end [9]. Central heating coverage is roughly north of the Qinling Mountains–Huaihe River line [10], which is the north–south boundary line of China. By the end of 2019, central heating has covered a building area of 9.251 billion m2 in northern cities, providing a total heating supplied of 3.926 billion GJ, which constituted approximately 21% of the overall operational energy consumption of buildings across the country [7]. This means that China’s energy consumption for heating significantly surpasses that of other countries worldwide [11]. Since 2010, the total energy consumption of central heating has steadily increased despite a decline in heating energy consumption per unit area [12,13], primarily due to the rapid growth of building areas (Figure 1).
At present, several studies have analyzed the energy consumption system of central heating in China. For example, Yuan et al. [14] established modified models for the heating parameters based on a series of climate factors to correct the supply heating temperature of urban heat-exchange stations, aiming to achieve energy-saving objectives. Liu and Cao [15] constructed a heating consumption regression model for Beijing based on the real data from 170 heat-exchanging stations. Lin and Lin [16] used the co-integration method to investigate the long-term relationship between energy consumption of the heating industry and the factors including urban GDP, population density, central heating areas, and fuel price. Liu et al. [17] developed econometric models at the provincial level by multiple linear regression, which linked the energy consumption of central heating with outdoor temperature, the heat generation method, energy structure, and heating areas. Wang et al. [18] made predictions on the total energy consumption of central heating in five typical northwest cities of China for the upcoming five years, which were derived from empirical values of building heating energy consumption indicators of these cities, as well as statistical data on heat sources and the total building areas. Overall, existing research predominantly concentrates on the city and regional levels, with data primarily sourced from local heat-exchanging stations or local energy balance sheets. However, there is a scarcity of studies that comprehensively cover the entire northern central heating areas from a macro perspective. Therefore, it is imperative to examine the pivotal factors that influence central heating in Chinese cities and establish a correlation based on climate variables to describe the energy consumption characteristics of central heating. This can serve as a reference at the national level.
To assess the impact of climate factors on building heating energy consumption, energy simulation or simplified calculations are commonly adopted [19]. Simulation methods rely on sophisticated computational software (such as DOE-2.2, Energy Plus 22.2, etc.), which require considerable time to establish an energy consumption model. By comparison, a suitable simplified calculation method can also efficiently yield reasonable results. The degree-day method, a simplified calculation approach based on the theory of steady-state heat transfer, has been widely used in various fields such as industry, agriculture, and construction. In the degree-day method, the independent variable is “Degree Day” (HDD or CDD), which is defined as the cumulative sum of the positive differences between the daily average temperature and the base temperature for each day of a year. “Degree Day” serves as a climate indicator that can be used to relate building heating energy consumption [20]. The fundamental theory of this method posits that, in long-term calculations, a building’s energy consumption is nearly proportional to the temperature difference between its external and internal environments [19,20]. Thus, the degree-day method is one of the simplest approaches for estimating a building’s energy consumption [21]. Some previous studies have established relational models linking heating demand to HDD [22,23,24], encompassing estimates of building space heating energy demand at the city or regional scale [23,24]. The heating demand “ Q ” (kWh) in the degree-day method can be calculated using Equations (1) and (2):
Q = P · H D D
H D D = i = 1 365 ( T b T i ) +
where P (kWh/°C), is the constant of proportionality, which stands the building’s overall rate of heat loss; T b represents the base temperature, determined by the setpoint of heating temperature; T i is the daily average temperature on day i . The plus sign (+) indicates that only positive values are calculated.
This study intends to analyze central heating of cities by the degree-day method based on national statistical data. The advantage of this approach is its ability to effectively depict the energy consumption status of central heating in northern Chinese cities exclusively through the most critical climate parameter (HDDs) in a clear and straightforward manner. The scope of this study encompasses the entire central heating regions in China, and the objectives are fourfold: (1) to construct predictive models of the heating energy consumption for the target cities and evaluate the accuracy of the models; (2) to determine heating base temperatures close to reality; (3) to investigate the discrepancy of the deviation index of heating intensity among the target cities and the factors that determine it, including city size, level of heating development, and geographical regions; (4) to provide scientific advice for effective planning and rational utilization of energy on central heating, with the goal of energy conservation.

2. Materials and Methods

2.1. Target Cities and Data Collection

In northern China, there are 14 provinces connected to central heating systems, involving a total of more than 300 cities and autonomous regions. For this study, 60 typical cities were selected as research samples. The total heating areas of these target cities are 5.16 billion square meters, covering a population of approximately 150 million. Based on climate classification, there are 30 cities in severe cold regions and another 30 cities in cold regions (Table 1). To guarantee the precision and persuasiveness of the research findings, the selection principles for the target cities are as follows: (1) The research samples has broad coverage, including three to five typical cities from each province; (2) The selected cities span all climate types in northern China, with a balanced distribution in various HDD intervals; (3) The number of cities in each category, divided by population and GDP scale, is close as far as possible; (4) Excluding cities with a tiny scale, the target cities have a minimum building area larger than 1 million square meters and a total population of at least 100,000. Details of selected cities are shown in Figure 2. It should be noted that due to the limited number of super- and mega-sized cities in northern China, this study includes all provincial capital cities and central cities within the central heating regions. However, their total number is slightly lower than cities of other types.
The statistical data for each city are obtained from the “China Urban Construction Statistical Yearbook (2019)” [25], including urban district population, total heating supplied, heating area, and fixed asset investment of central heating. Historical weather data are sourced from the daily temperature records of national meteorological stations in 2019, accessible through the China Meteorological Data Website [26]. “GB 50176-2016 (Thermal Design Code for Civil Building)” [27] is a national standard that provides comprehensive guidelines for the thermal design of civil buildings in China. This code presents specific building design principles for the performance of insulation, heat transfer, ventilation, air conditioning, and heating in various regions, with the overarching goal of ensuring indoor comfort while concurrently addressing energy efficiency in buildings. In accordance with the relevant provisions in “GB 50176-2016”, the base temperature should be set at 18 °C [27]. Thus, “HDD18” is taken as the independent variable analyzed at the beginning.
According to the academic definition, the calculation of HDD should include each day throughout a year. However, in China, the timing and length of central heating are concentrated on specific timeframes, which vary based on the local policies of different cities [28]. Consequently, conventional methods of calculating HDD for all 365 days inevitably result in inaccuracies. In this regard, the study has adjusted the calculation of HDD by only considering the days within the heating period of a year. Table S1 presents the geographical information, heating data, and adjusted HDD18 values for the target cities.
Table 1. Regional distribution of target cities.
Climate RegionsName of Target Cities
Severe cold regionsAltay, Baotou, Benxi, Changchun, Dunhua, Golmud, Hailin, Hami, Harbin, Heihe, Hezuo, Hohhot, Holingol, Huadian, Hulunbuir, Hunchun, Jayuguan, Qitaihe, Shenyang, Shuozhou, Songyuan, Urumqi, Xilinhot, Xining, Yichun, Yining, Yulin, Yushu, Zhangjiakou, Zhangye
Cold regionsAnyang, Baoji, Beijing, Cangzhou, Changyi, Changzhi, Dalian, Gaizhou, Guyuan, Jiaozuo, Jinan, Jinzhou, Kashi, Lanzhou, Liaocheng, Linfen, Linyi, Lvliang, Qingdao, Sanmenxia, Shijiazhuang, Taiyuan, Tangshan, Tianjin, Wuan, Wuwei, Xian, Yinchuan, Zhengzhou, Zhongwei
(Source: Drawn by authors. Climate regions of cities refer to GB 50176-2016 [27].)

2.2. Establishment and Evaluation of Predictive Model

Under ideal conditions, the variables in Equation (1) exhibit a direct proportionality, and some studies have verified the relationship between heating energy consumption and HDD by linear regression models [29,30]. However, the heating supplied data collected in this study come from heat sources counted by the official department, which may experience heating losses during pipeline transportation and which may not accurately reflect the energy consumption at the building terminals under ideal conditions. So, the independent variable here does not equal the heating demand in Equation (1). Given the disparities in heating transfer efficiency among pipelines across different regions, it is challenging to consider it as a standalone variable in macro-level analysis. Therefore, only HDD, the most critical factor affecting heating energy consumption, is considered during the modeling process. According to “GB 50176-2016” [27], the requirements for thermal performance of the building envelope are different in severe cold regions and cold regions. Therefore, we need to establish predictive models separately for the severe cold regions and the cold regions to improve accuracy. The models show as follows:
y = k i · x + b i
where y (kWh/m2) is heating intensity; x (°C) is adjusted HDD.
The value of i can be either 1 or 2; k 1 (kWh/m2·°C) and b 1 (kWh/m2) are regression coefficients in severe cold regions, while k 2 and b 2 are regression coefficients in cold regions.
It should be noted that although variances in pipeline thermal losses and building terminal energy efficiency bring some uncertainties, HDD remains a decisive factor affecting heating demand. While the regression coefficient b i provides a certain degree of correction for these factors, it remains essential to verify the applicability of the models through accuracy analysis and validity testing.
To evaluate the precision of the predicted models, two statistical indices are used to describe the fitting characteristics of the models, including coefficient of determination (R2) and coefficient of variation of root mean square error (CV-RMSE) [31]. The larger the R2 value and the smaller the CV-RMSE value, the closer the predicted values are to the actual values. Their values can be calculated using Equations (4)–(6). Moreover, the significance of the models is detected through the F test here.
R 2 = 1 y i y ^ i 2 y i y ¯ 2
R M S E = y i y ^ i 2 n
C V R M S E = R M S E / y ¯ × 100
where y i represents the actual heating intensity value (kWh/m2) for the i th city, and y ^ i is the corresponding predicted value (kWh/m2); n is the number of target cities; y ¯ is the average heating intensity value (kWh/m2) of all selected cities.

2.3. Calculation of Base Temperatures

The principle of central heating is to supply heat to spaces when the outdoor temperature is below a specific balance point temperature, maintaining it until the indoor temperature reaches equilibrium. This temperature, known as the base temperature, represents the balance point [32]. Determining the base temperature is crucial for utilizing HDD as a variable to estimate building heating energy consumption [33], as HDD represents the cumulative difference between the outdoor temperature and the base temperature over the heating period. The base temperature setpoint in Chinese regulations is the same as the ASHRAE standard at 18 °C [27]. However, in practice, the base temperature specified in regulations is merely an ideal value. Obtaining the actual base temperature is a complex process influenced by factors such as heating control, envelope thermal performance, and building operational and management conditions [32,33,34,35]. Several decades ago, it was commonplace for indoor temperatures in northern cities to fall below 18 °C during the heating period [36]. However, much recent survey data have revealed a substantial shift in this trend. In particular, a significant majority of indoor temperatures during the central heating period now surpass 18 °C [11,36]. Consequently, the excessive supply of heating has become an important issue in the current context [37].
Thus, this study aims to investigate the actual HDD base temperature for northern cities of China. The specific methods are as follows: First, taking 1 °C as the temperature gradient, sets 10 different base temperatures ranging from 16 °C to 25 °C. Subsequently, the base temperature is adjusted, and statistical indices are calculated for each temperature gradient. Lastly, the actual HDD base temperature is determined through the analysis of these statistical indices.

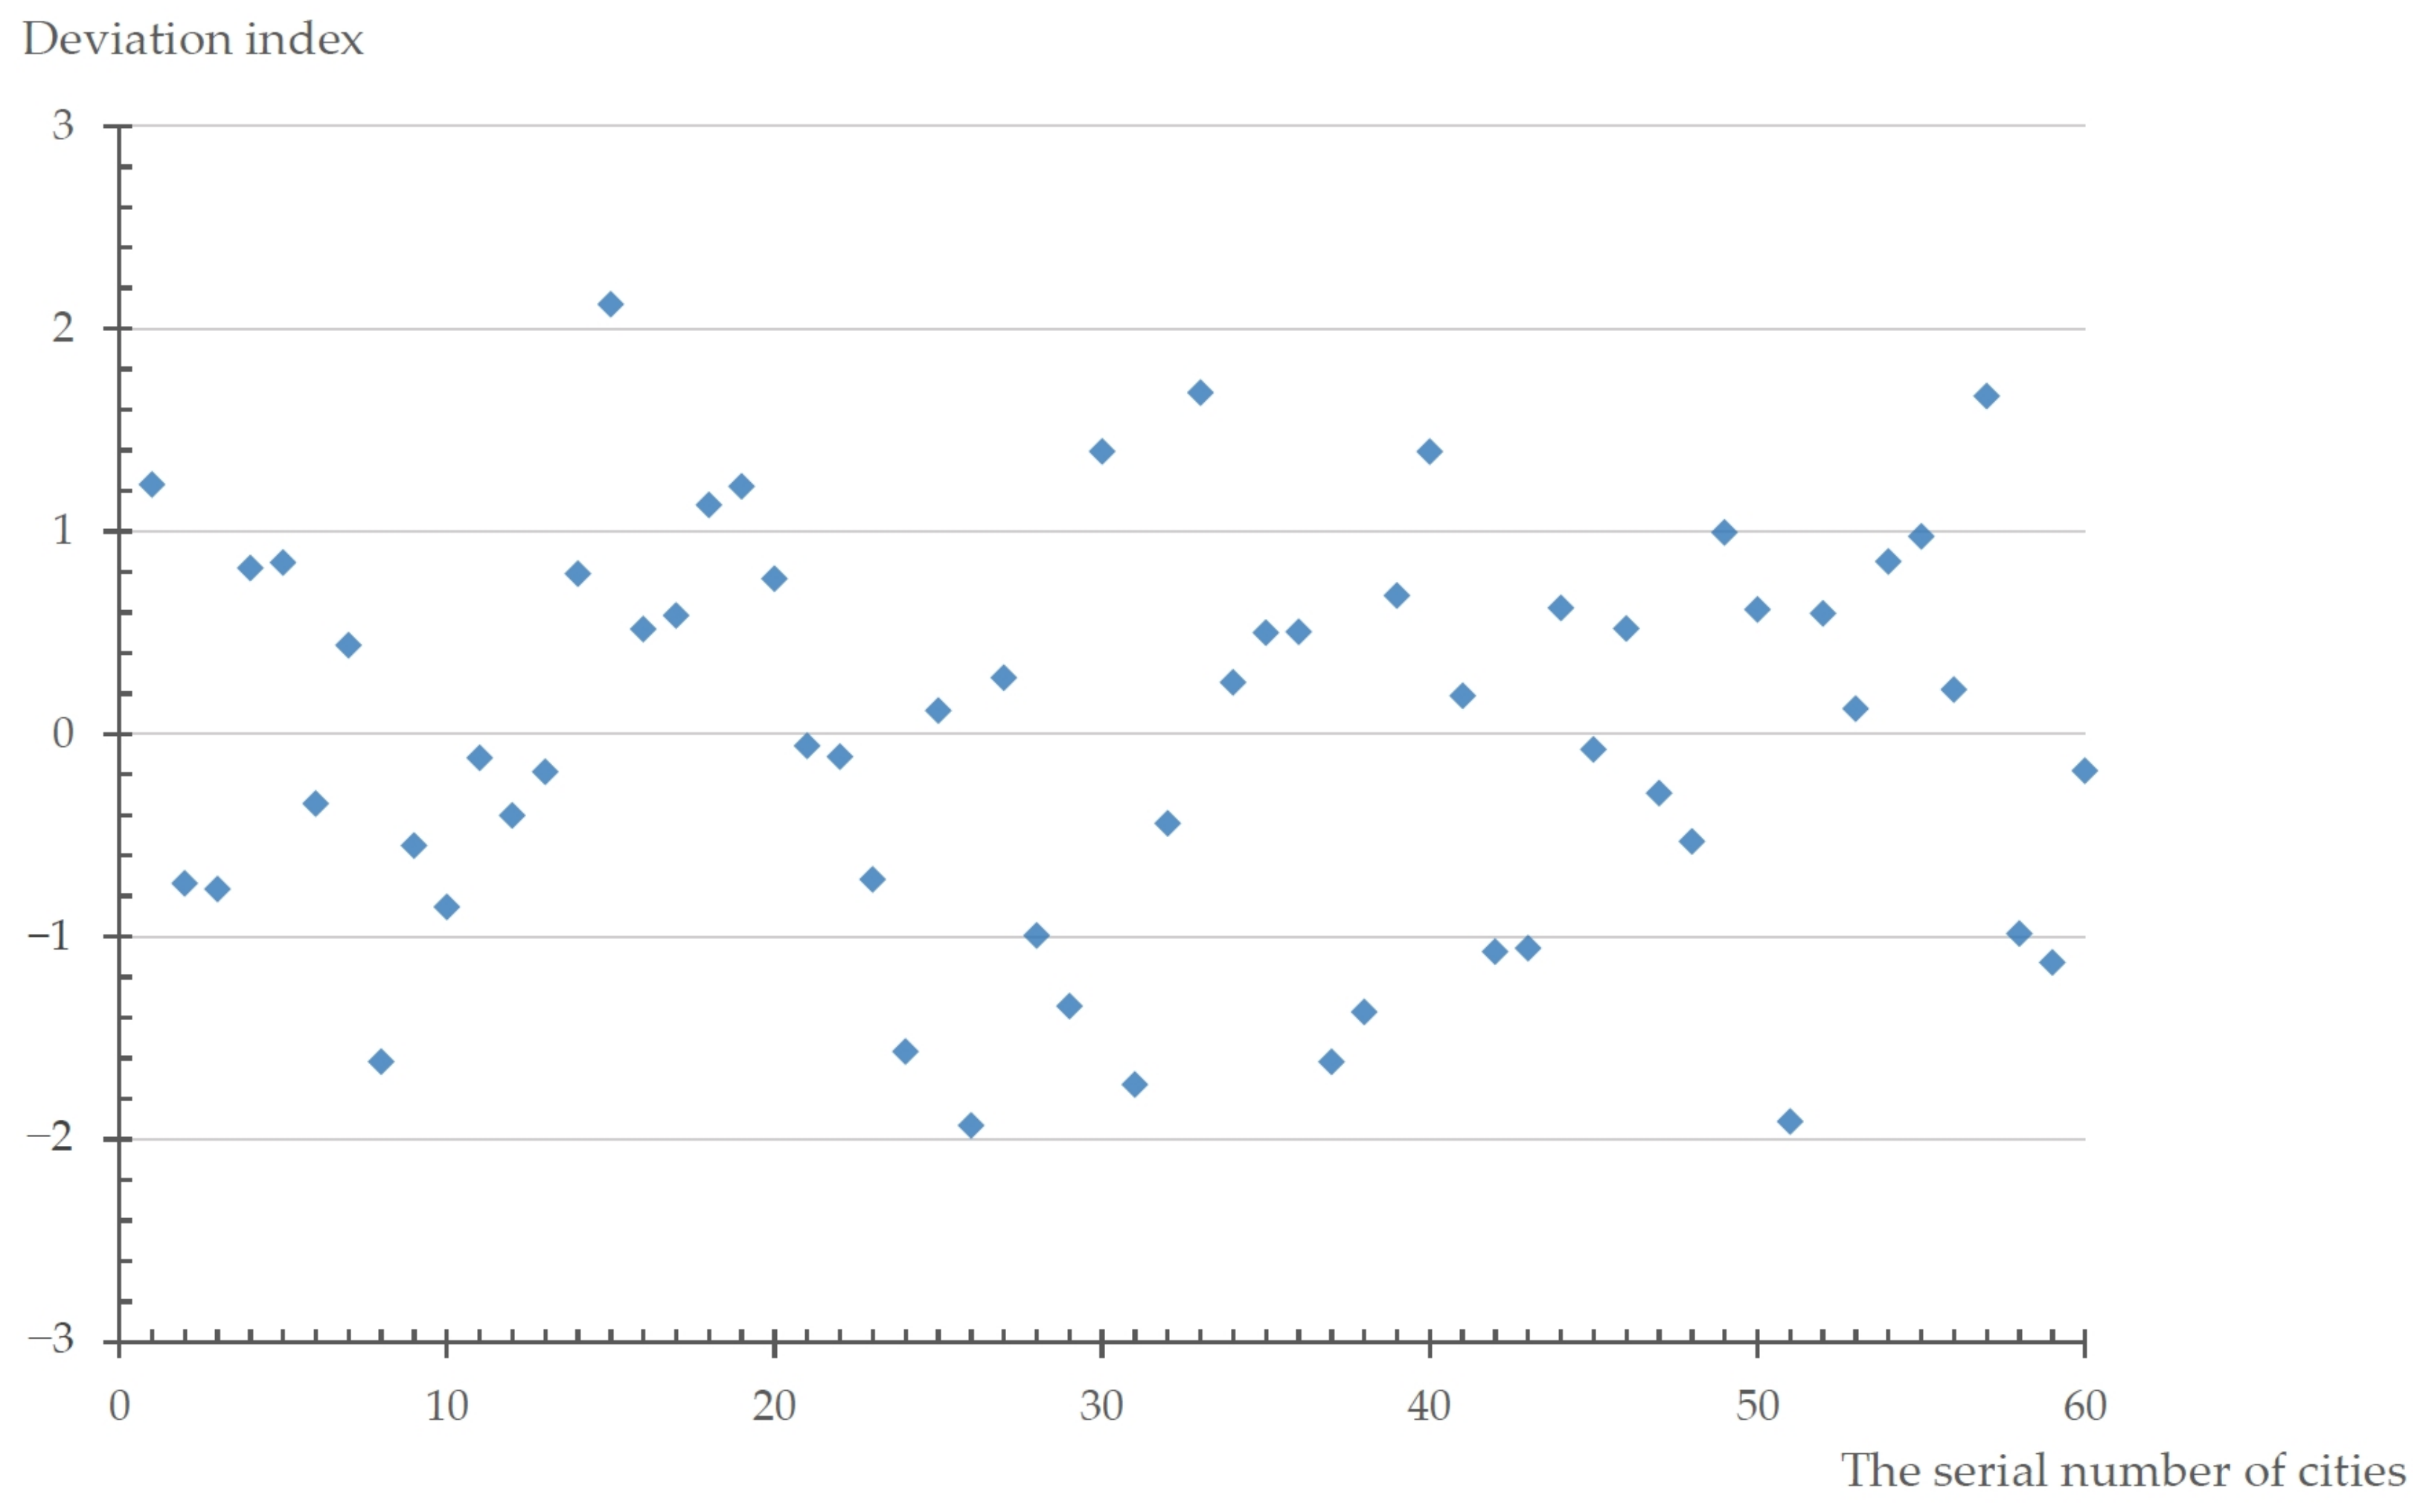
2.4. Deviation Index and City Classification

In the context of an ideal model with constant heat transfer performance, and near-zero thermal losses throughout the entire process, the predicted values can accurately represent the heating supplied [19]. However, in reality, thermal losses occur at various stages of the heating process, and these losses are variations across different cities. Therefore, the outcomes obtained from the predictive model are inevitably subject to some degree of deviation.
In the field of mathematical statistics, the term “residual” denotes the disparity between the actual value and the predicted value. By standardizing the value of residual, we define it as the deviation index (i.e., the standard residual), which can be used to assess the extent of deviation between the actual heating intensity and the predicted values across different cities. Statistically, the deviation indices generally fall within the range of (−2, 2) under normal conditions (95% confidence envelope) [38]. Positive values indicate that the actual energy consumption exceeds the predicted value, while negative values indicate that the actual energy consumption falls below the predicted value. When meeting the prerequisite of ensuring indoor temperature requirements, the smaller of the deviation index indicates greater energy efficiency. The calculation method for the deviation index is as follows:
D i = y i y ^ i S
where D i represents the deviation index for the ith city; S is the standard deviation.
In order to analyze the energy consumption characteristics of central heating of different cities, this study categorizes target cities from three perspectives: city size, level of heating development, and geographical regions. The objective is to explore the correlation between various corresponding indicators and the deviation index, conducting correlation and significance analysis [15]. City size is classified based on the urban district population into four classes, including small cities, medium cities, big cities, and super-/mega-sized cities [39]. The level of heating development is categorized into A, B, C, and D cities according to the fixed asset investment in central heating over the past decade. Geographical regions are divided into Northeast China, Northwest China, North China, and Central China based on ecological geography. The classification criteria and number of cities are shown in Table 2. All statistics for each city are sourced from the “China Urban Construction Statistical Yearbook” (2010–2019). Related raw data can be obtained in Table S2. (Note: Due to the lack of reliable heating asset investment data for the cities of Hezuo and Dunhua in the past 10 years, they were excluded from the research sample during statistical analysis.)

3. Results

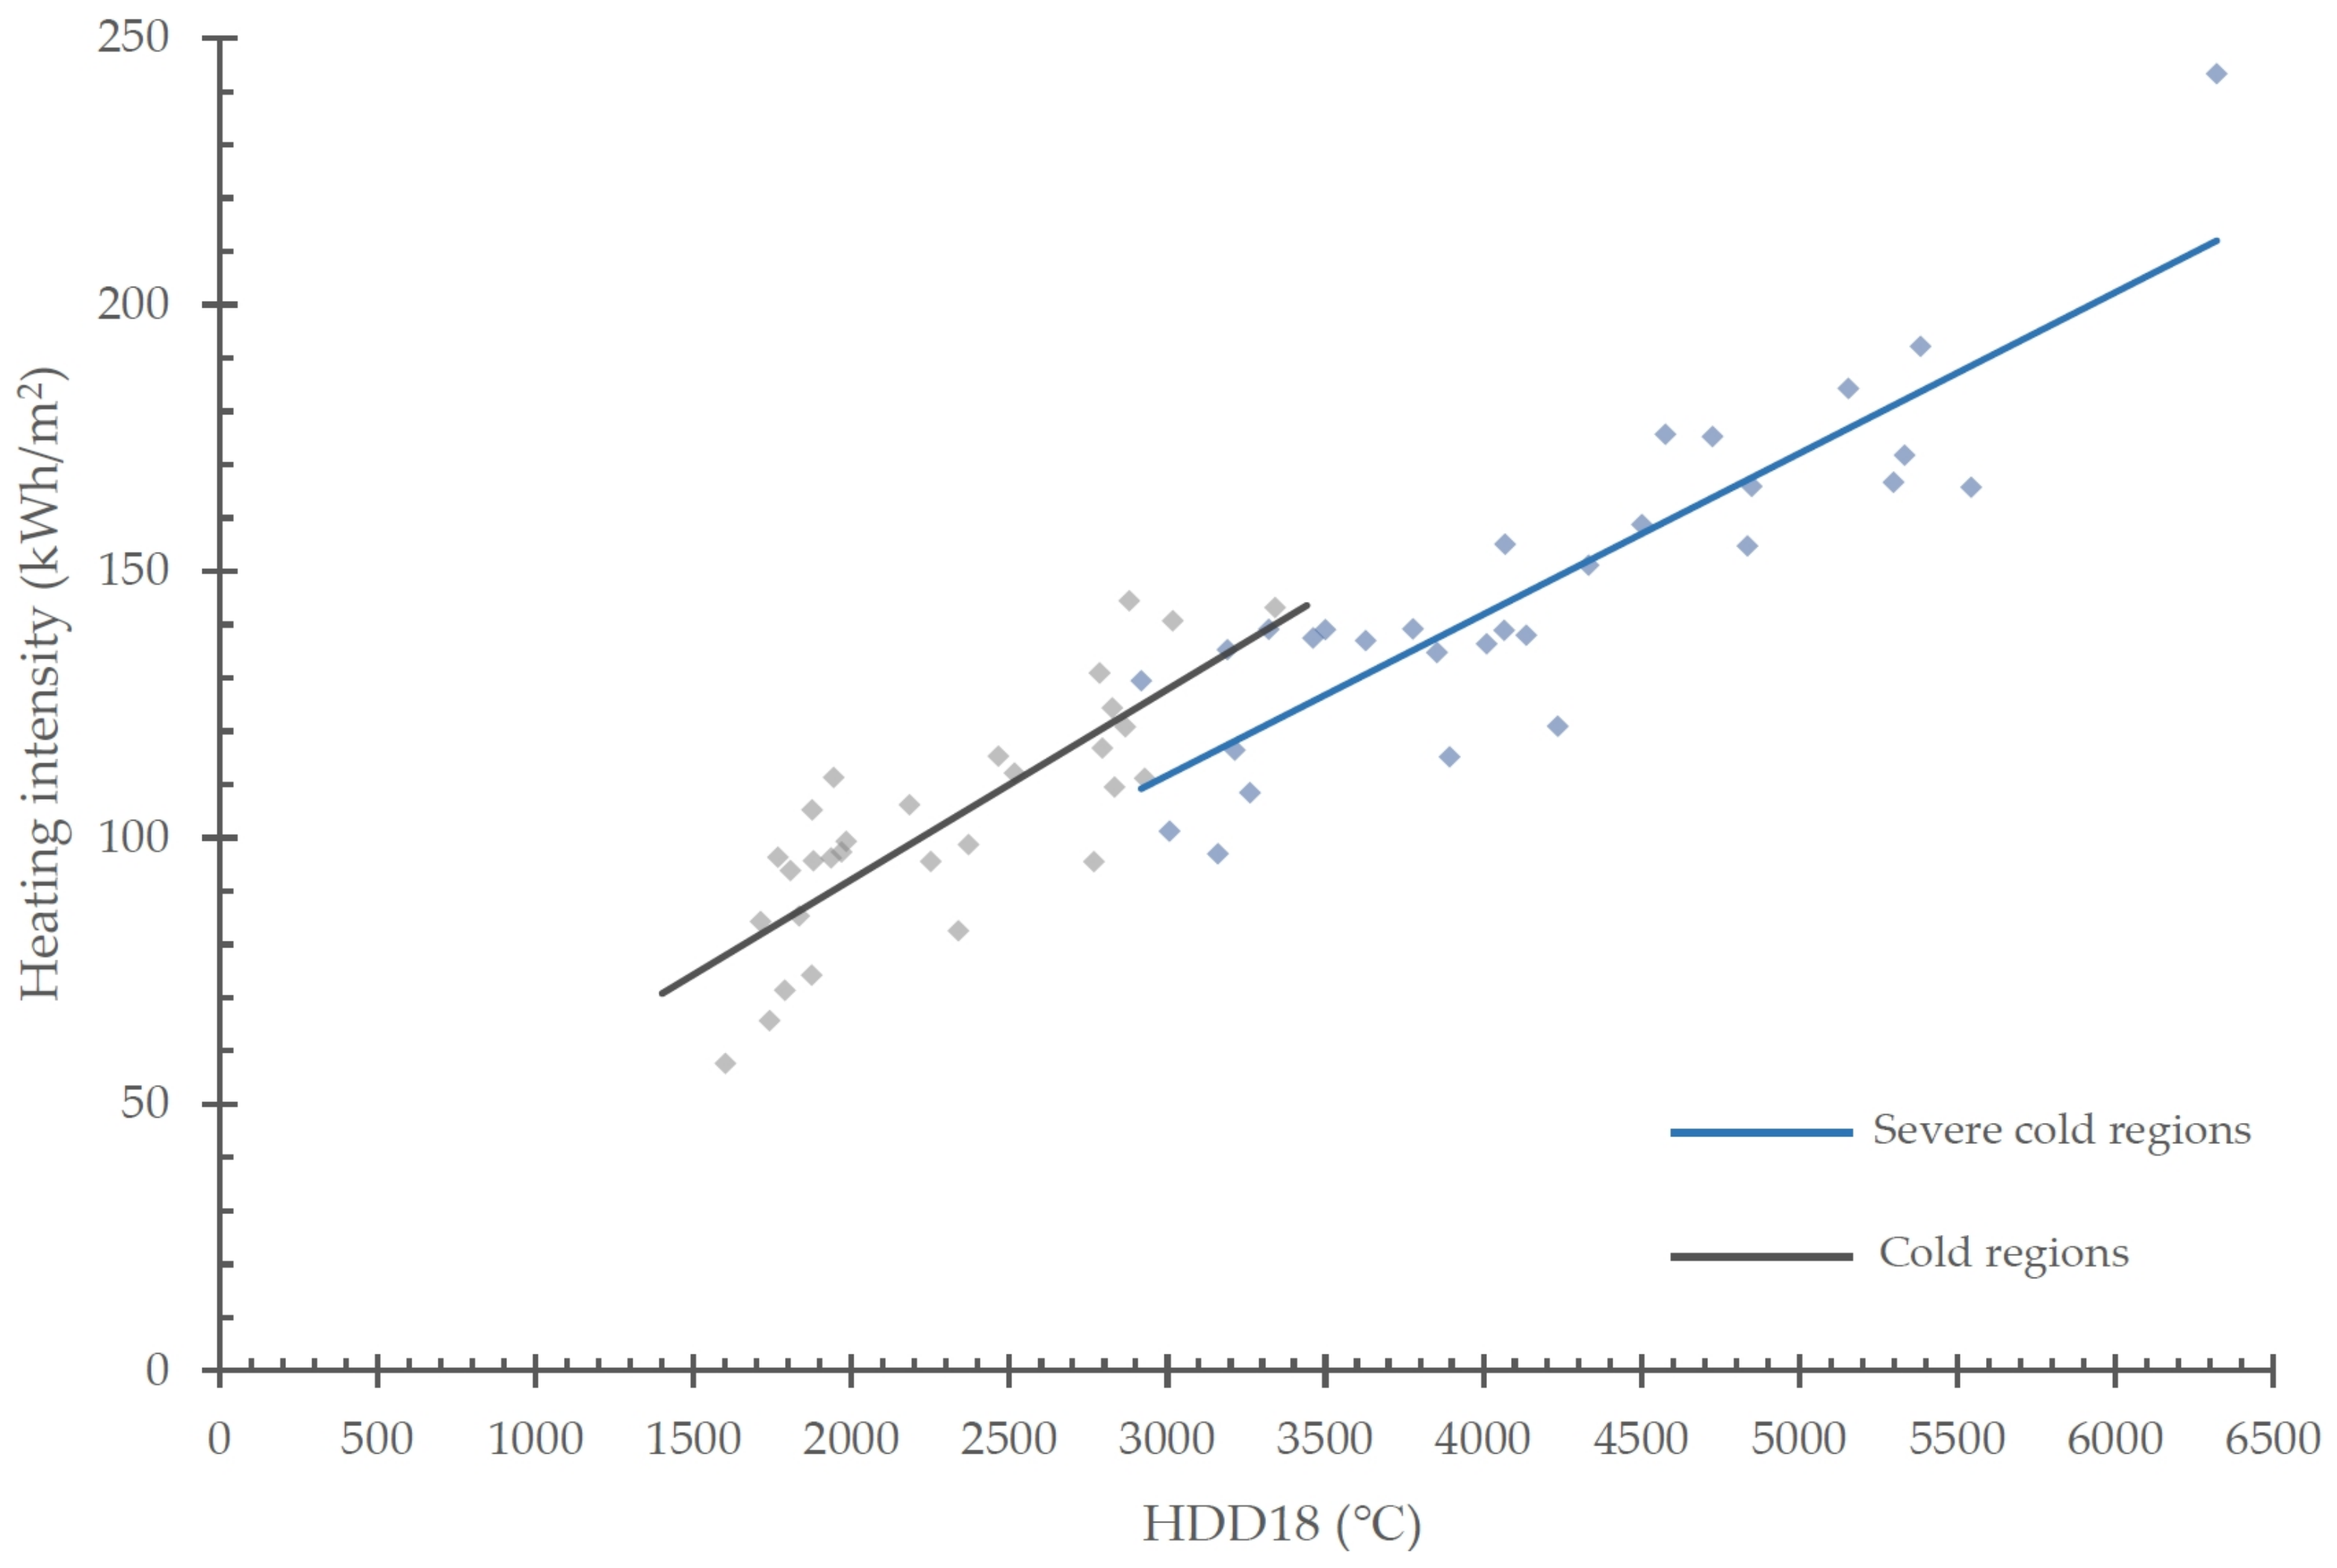
3.1. Model Equations and Accuracy

Figure 3 depicts the relationship between central heating intensity and HDD18 in severe cold and cold regions. The calculation results of relevant statistical indices can be observed in Table 3. The R2 values for the predictive model in severe cold and cold regions are 0.767 and 0.666, respectively, indicating a strong correlation between the variables. The CV-RMSE values of the two regions are 9.684% and 12.020%, both below 15%, indicating high model accuracy [31]. In the piece-wise predictive model of central heating, the slope is smaller in the severe cold regions, reflecting a higher thermal efficiency than cold regions. In general, utilizing a simple linear predictive model to describe the relationship between heating intensity and HDD18 meets the engineering requirements, holding a practical reference value.

3.2. Result of Actual Base Temperatures

By sequentially adjusting the values of the base temperature, we can obtain 10 sets of predictive models corresponding to different HDDs. The calculation results of statistical indices for these HDD models can be found in Table S3. We have utilized the statistical indices of these predictive models as dependent variables and plotted trend graphs to illustrate their variations in response to changes in the base temperature (Figure 4). The highest accuracy of the fitted model is achieved when R2 is maximized and CV-RMSE is minimized, suggesting that the value of the independent variable corresponds to the actual base temperature. Figure 4 reveals that the base temperature is approximately 21 °C in severe cold regions and approximately 22.3 °C in cold regions. This implies that regardless of being in severe cold regions or cold regions, the actual base temperature for central heating in northern cities is higher than the 18 °C specified in the code provisions.

3.3. Analysis of Heating Characteristics in Different Categories of Cities

Distribution of deviation index for the 60 target cities in this study is presented in Figure 5. The heating deviation index ranges from −1.932 to 2.161 within the research sample (details in Table S4). Only one city shows a deviation index slightly higher than 2, suggesting that the impact of anomalous data on the study can be disregarded.
The average deviation index of different types of cities, classified by urban district population size, is as follows: small cities (0.226) > medium cities (0.0626) > big cities (−0.273) > super-/mega-sized cities (−0.401). The overall level of the deviation index decreases with an increase in the population size of cities, indicating that larger cities have a higher downward degree of deviation in actual heating intensity compared with the predicted values. Pearson’s product–moment correlation analysis shows a negative correlation between population size and the deviation index (r = −0.28, p < 0.05).
When classified by fixed asset investment of central heating, the average deviation index of different categories of cities is as follows: class D (0.359) > class C (0.0544) > class B (−0.150) > class A (−0.210). The overall level of the deviation index decreases with an increase in heating investment, indicating that cities with higher heating investment in the past decade have a higher downward degree of deviation in actual heating intensity compared with predicted values. Pearson’s product–moment correlation analysis shows a negative correlation between fixed asset investment and the deviation index (r = −0.38, p < 0.01).
Based on the natural geographical regions, the average deviation index of different categories of cities is as follows: Northwest China (0.212) > North China (0.0817) > Northeast China (−0.173) > Central China (−0.256). The actual heating intensity in the Central and the Northeast is lower than the predicted values, indicating better energy-saving performance in these two categories of cities. This could be attributed to the imbalance in regional development: the economically developed (Central China) and industrially advanced (Northeast China) areas have more advantages.
Table 4 lists the five cities with the lowest deviation index in this study, which is the highest proportion of negative deviation between actual and predicted values. These cities include Urumqi, Taiyuan, Beijing, Zhengzhou, and Changchun. It can be observed that, except for Urumqi (which has a population of 4.7 million, just slightly below 5 million), the remaining four cities are all super-/mega-sized cities. Moreover, Zhengzhou, the only non-class A city in heating development level, has the highest total investment among class B cities (4606.8 million yuan). These five cities are all provincial capitals or central cities with the largest scale, the strongest economies, and the highest level of development in their respective associated regions.

4. Discussion

The energy consumption for winter heating in northern cities of China is enormous, and the central heating system, which entails unified generation and distribution of thermal energy, holds significant importance. Analyzing and summarizing past heating experiences through scientific methods can directly reveal the heating energy consumption status of different cities. This is crucial for optimizing heating schemes and suggesting improvement strategies. The predictive models and statistical analysis results from this study can provide valuable references for these purposes.
From the results of the accuracy analysis of the base temperatures in this study, it can be seen that the base temperature for central heating in severe cold regions was approximately 21 °C, and even exceeded 22 °C in cold regions during 2019. Meanwhile, Zhou et al. [11] and Chang et al. [40] conducted investigations to examine the indoor temperature of some buildings during the heating period in Tianjin and Inner Mongolia, respectively. They found that all surveyed cases exhibited indoor temperatures above 18 °C, with a common phenomenon of overheating. These findings are consistent with Jiang’s [36] comprehensive statistical results after a large-scale investigation on northern cities. All of these research results indicate that, with the rapid economic development and improved living standards in China, the problem of insufficient heating and low indoor temperatures (below the standard 18 °C) in central heating areas no longer exists. The focus of current work should be on dealing with energy waste. Thus, after excluding the factor of insufficient heating, the deviation index used in this study can reflect the energy consumption conditions in urban central heating systems, where a smaller value corresponds to better energy-saving performance.
The correlation analysis results of the deviation index for heating energy intensity across various types of cities reveal that larger cities possess better performance compared with smaller cities, those with higher fixed asset investment surpass those with lower investment, and developed regions also outperform underdeveloped regions. This is similar to the research findings conducted by Jiang et al. [24], which demonstrated a strong negative correlation between building heating energy intensity and per capita GDP in underdeveloped regions. The survey results of Xia and Zhang [41] illustrated that central heating systems in small towns often suffer from low efficiency and serious energy waste. It can be deduced that the fundamental reasons for differences in energy-saving performance among cities are discrepancy of urban scale, development level, and economic gap between regions. For cities with large deviation indices and high energy consumption levels, specific factors could be sought from the following aspects: (1) Overall thermal performance of building envelope structures, including the thermal insulation properties of external walls, roofs, glass parts, and the air tightness of joints such as doors and windows. Obviously, good envelope structures correspond to the application of advanced materials and technologies, while underdeveloped areas lack the necessary economic strength and industrialization level to support the construction of high-standard new buildings and the renovation of existing ones, resulting in generally outdated building envelope performance; (2) Thermal conversion efficiency of heating equipment, including heat source boilers, thermal transfer pipelines, and terminal control systems. Cities with insufficient investment of heating fixed assets often face challenges in updating and maintaining relevant facilities, and there may be problems such as inefficient heat sources, aging pumps, and outdated pipe networks, which result in low efficiency in energy generation and transmission processes and excessive thermal losses; (3) Urban energy regulation policies and management systems. Because of their large scale and significant impact, super- and mega-sized cities attract substantial attention to their total energy consumption. Consequently, managers have to intensify their control over the whole process of central heating.
In low-efficiency cities characterized by a high number of old buildings and outdated equipment, the primary focus should be on improving the performance of building envelope structures and enhancing the efficiency of corresponding equipment to minimize heating loss in central heating systems. Increasing investment in foundational heating equipment and actively promoting projects such as updating pipeline networks and renovating building performance are necessary to address this issue. For instance, Beijing, being a highly developed city, has allocated substantial funding towards energy-saving transformation measures for existing buildings and heating systems [42], emphasizing efficiency improvement throughout the entire heating process, encompassing the heat source, transfer systems, and building terminals. The findings of this study show that Beijing’s heating deviation index is only −1.729, ranking the third lowest among all the sample cities, indicating a remarkably effect.
The problem of excessively high indoor temperatures in some areas due to overheating can be attributed to the current extensive operational management mode of heating. At present, the main regulation point for central heating is at the heat source, and the management personnel make rough adjustments based on past experience. Due to the diversity of building terminals, it is difficult to achieve a balance between heating supply and demand. Especially when the weather changes dramatically, in order to reduce the possibility of individual users complaining about thermal comfort issues, heating staff members often increase the overall heating supply, causing systemic waste [36,37]. Investigations conducted by Chang et al. in multiple locations in Inner Mongolia have shown that there is widespread overheating in residential buildings, with the indoor temperatures of most surveyed subjects exceeding 23 °C, and some even reaching 28 °C, forcing residents to open windows for ventilation and cooling [40]. It is evident that we currently lack a scientific and systematic heating management framework to guide heating energy allocation, which will be one of the key research points in the future.
At the same time, strengthening control at the building terminals is another focal point of the work. The differences at the building terminals prevent accurate maintenance of all rooms near the specified temperature throughout the heating period solely by overall system adjustments [7]. The fundamental solution to solve the problem of uneven heating is to achieve individual regulation of each heating unit based on real-time temperature. Therefore, implementing some measures at the user end (such as installing automatic control valves for each building or arranging staff for real-time monitoring and manual adjustment in residential quarters) is necessary to reduce energy consumption and prevent indoor overheating. Additionally, building operation conditions and user behavior also have an impact on heating energy consumption. For residential buildings, raising energy-saving awareness among users through education and promotion can help avoid wasteful behaviors like opening doors and windows at will. For public buildings, the heating intensity and heating duration can be adjusted according to the spatial layout, function, and attributes of the building, such as maintaining lower temperatures during idle periods or in secondary spaces.

5. Conclusions

This paper has selected 60 representative cities located in central heating regions of northern China and analyzed their central heating energy consumption based on official statistical data by the degree-day method. The main conclusions can be drawn as follows.
Firstly, a strong positive correlation exists between central heating intensity and heating degree days (HDDs) in cities of northern China. The established predictive models have passed the significance testing, simultaneously with the values of R2 and CV-RMSE in reasonable ranges, which can provide a valuable reference for practical applications. Compared with cold regions, the predictive model in severe cold regions has a lower slope, smaller data dispersion, and higher accuracy.
Furthermore, from accuracy analysis based on statistical indices, the calculated results of central heating base temperatures in severe cold regions and cold regions are 21 °C and 22.3 °C respectively, both exceeding the 18 °C specified in GB 50176-2016. This suggests that excessively high indoor temperatures during the heating period is a prevailing occurrence across all regions. Several other studies have obtained similar findings [11,36,37,40].
Finally, the correlation analysis of energy consumption characteristics across different types of cities reveals that urban population size, fixed asset investment in heating, and regional development level are the important factors influencing the deviation index of heating intensity. Notably, larger cities and developed regions exhibit superior overall energy efficiency. For cities with large deviation index corresponding to poor energy-saving performance, we should actively find out the causes from aspects such as building envelope performance, heating equipment efficiency, and overall system control and management. It is crucial to implement effective measures and appropriate policies to solve these problems, especially in terms of the equipment efficiency of heating system and the comprehensive performance of building terminals.
However, there are some limitations in this study. Due to the unique central heating system in China, the analysis results based on official data can solely reflect the Chinese context. Additionally, this study provides macro-level analysis models where the analysis effects based on the main factor, HDD, are susceptible to interference from various uncontrollable factors such as differences in energy efficiency of heating equipment and building terminals. Consequently, the precision of the predictive models may be affected, and the effectiveness can only be verified through statistical evaluation. For individual buildings, “dynamic simulations” are more suitable for accurately analyzing building energy consumption.

Supplementary Materials

The following supporting information can be downloaded at: https://www.mdpi.com/article/10.3390/su16031008/s1, Table S1: Geographical information, heating data, and adjusted HDD18 of 60 target cities (Year 2019); Table S2: Urban district population, fixed asset investment of central heating, and geographical regions of target cities; Table S3: Statistical indices of series of HDDs models; Table S4: Deviation index of heating intensity.

Author Contributions

Conceptualization, Y.S. and A.D.; methodology, Y.S.; formal analysis, Y.S.; resources, Y.S. and A.D.; data curation, Y.S.; writing—original draft preparation, Y.S.; writing—review and editing, Y.S.; visualization, Y.S.; supervision, A.D. and T.C.; project administration, T.C.; funding acquisition, A.D. All authors have read and agreed to the published version of the manuscript.

Funding

This research was funded by the National Natural Science Foundation of China (No. 71533005).

Institutional Review Board Statement

Not applicable.

Informed Consent Statement

Not applicable.

Data Availability Statement

The data presented in Supplementary Materials are mainly from the China Urban Construction Statistical Yearbook (2010~2019) and the historical weather data from national meteorological stations.

Conflicts of Interest

The authors declare no conflict of interest.

References

  1. Cao, X.; Dai, X.; Liu, J. Building energy-consumption status worldwide and the state-of-the-art technologies for zero-energy buildings during the past decade. Energy Build. 2016, 128, 198–213. [Google Scholar] [CrossRef]
  2. Yuan, T.; Zhu, N.; Shi, Y.; Chang, C.; Yang, K.; Ding, Y. Sample data selection method for improving the prediction accuracy of the heating energy consumption. Energy Build. 2018, 158, 234–243. [Google Scholar] [CrossRef]
  3. Cabeza, L.F.; Rincon, L.; Vilarino, V.; Perez, G.; Castell, A. Life cycle assessment (LCA) and life cycle energy analysis (LCEA) of buildings and the building sector: A review. Renew. Sustain. Energy Rev. 2014, 29, 394–416. [Google Scholar] [CrossRef]
  4. Yu, Y.; Cheng, J.; You, S.; Ye, T.; Zhang, H.; Fan, M.; Wei, S.; Liu, S. Effect of implementing building energy efficiency labeling in China: A case study in Shanghai. Energy Policy 2019, 133, 110898. [Google Scholar] [CrossRef]
  5. Chen, Y.; Li, M.; Xiong, M.; Cao, J.; Li, J. Future Climate Change on Energy Consumption of Office Buildings in Different Climate Zones of China. Pol. J. Environ. Stud. 2018, 27, 45–53. [Google Scholar] [CrossRef]
  6. Liu, J.; He, Z.; Yang, L. Classification of China cold climate and the strategy in architectural thermal design. J. Xi’an Univ. Archit. Technol. 2020, 52, 309–314. [Google Scholar] [CrossRef]
  7. Tsinghua University. Annual Report on China Building Energy Efficiency; China Architecture & Building Press: Beijing, China, 2019. [Google Scholar]
  8. Jiang, Y. Research on energy efficient retrofit problems of existing buildings in northern heating area. Energy China 2011, 33, 6–13+35. [Google Scholar] [CrossRef]
  9. Zhang, Y.; Liu, X.; Qin, B. Energy saving operation optimization in urban district heating system: A case study. Heat. Vent. Air Cond. 2015, 45, 97–100. [Google Scholar]
  10. Wang, S.; Li, Y.; Hague, M. Evidence on the Impact of Winter Heating Policy on Air Pollution and Its Dynamic Changes in North China. Sustainability 2019, 11, 2728. [Google Scholar] [CrossRef]
  11. Zhou, Z.; Wang, C.; Sun, X.; Gao, F.; Feng, W.; Zillante, G. Heating energy saving potential from building envelope design and operation optimization in residential buildings: A case study in northern China. J. Clean. Prod. 2018, 174, 413–423. [Google Scholar] [CrossRef]
  12. Zhang, Y.; He, C.; Tang, B.; Wei, Y. China’s energy consumption in the building sector: A life cycle approach. Energy Build. 2015, 94, 240–251. [Google Scholar] [CrossRef]
  13. Zhang, L.; Li, Y.; Zhang, H.; Xu, X.; Yang, Z.; Xu, W. A review of the potential of district heating system in Northern China. Appl. Therm. Eng. 2021, 188, 116605. [Google Scholar] [CrossRef]
  14. Yuan, J.; Huang, K.; Han, Z.; Zhou, Z.; Lu, S. A new feedback predictive model for improving the operation efficiency of heating station based on indoor temperature. Energy 2021, 222, 119961. [Google Scholar] [CrossRef]
  15. Liu, Y.; Cao, Y. Development and research on energy performance assessment method of heat-exchanging stations based on real data. Sustain. Cities Soc. 2020, 59, 102188. [Google Scholar] [CrossRef]
  16. Lin, B.; Lin, J. Evaluating energy conservation in China’s heating industry. J. Clean. Prod. 2017, 142, 501–512. [Google Scholar] [CrossRef]
  17. Liu, G.; Kong, Z.; Dong, J.; Dong, X.; Jiang, Q.; Wang, K.; Li, J.; Li, C.; Wan, X. Influencing Factors, Energy Consumption, and Carbon Emission of Central Heating in China: A Supply Chain Perspective. Front. Energy Res. 2021, 9, 648857. [Google Scholar] [CrossRef]
  18. Wang, D.; Zhang, R.; Luo, X.; Men, R.; Liu, Y.; Liu, J. Energy consumption characteristics and carbon saving potential of central heating in typical cities in Northwest China. J. Xi’an Univ. Archit. Technol. 2022, 54, 819–826+837. [Google Scholar] [CrossRef]
  19. De Rosa, M.; Bianco, V.; Scarpa, F.; Tagliafico, L.A. Heating and cooling building energy demand evaluation; a simplified model and a modified degree days approach. Appl. Energy 2014, 128, 217–229. [Google Scholar] [CrossRef]
  20. De Rosa, M.; Bianco, V.; Scarpa, F.; Tagliafico, L.A. Historical trends and current state of heating and cooling degree days in Italy. Energy Convers. Manag. 2015, 90, 323–335. [Google Scholar] [CrossRef]
  21. Salem, H.; Khanafer, K.; Alshammari, M.; Sedaghat, A.; Mahdi, S. Cooling Degree Days for Quick Energy Consumption Estimation in the GCC Countries. Sustainability 2022, 14, 13885. [Google Scholar] [CrossRef]
  22. D’Amico, A.; Ciulla, G.; Panno, D.; Ferrari, S. Building energy demand assessment through heating degree days: The importance of a climatic dataset. Appl. Energy 2019, 242, 1285–1306. [Google Scholar] [CrossRef]
  23. Kohler, M.; Blond, N.; Clappier, A. A city scale degree-day method to assess building space heating energy demands in Strasbourg Eurometropolis (France). Appl. Energy 2016, 184, 40–54. [Google Scholar] [CrossRef]
  24. Jiang, D.; Xiao, W.; Wang, J.; Wang, H.; Zhao, Y.; Li, B.; Zhou, P. Evaluation of the effects of one cold wave on heating energy consumption in different regions of northern China. Energy 2018, 142, 331–338. [Google Scholar] [CrossRef]
  25. Ministry of Housing and Urban Rural Development. China Urban Construction Statistical YEARBOOK (2019); China Planning Press: Beijing, China, 2020. [Google Scholar]
  26. China Meteorological Administration. National Meteorological Science Data Center. Available online: http://data.cma.cn/site/index.html (accessed on 6 September 2022).
  27. GB 50176-2016; Thermal Design Code for Civil Building. China Architecture & Building Press: Beijing, China, 2016.
  28. Shen, X.; Liu, B. Changes in the timing, length and heating degree days of the heating season in central heating zone of China. Sci. Rep. 2016, 6, 33384. [Google Scholar] [CrossRef]
  29. Quayle, R.G.; Diaz, H.F. Heating degree-day data applied to residential heating energy-consumption. J. Appl. Meteorol. Climatol. 1980, 19, 241–246. [Google Scholar] [CrossRef]
  30. Fumo, N.; Biswas, M.A.R. Regression analysis for prediction of residential energy consumption. Renew. Sustain. Energy Rev. 2015, 47, 332–343. [Google Scholar] [CrossRef]
  31. Sha, H.; Xu, P.; Hu, C.; Li, Z.; Chen, Y.; Chen, Z. A simplified HVAC energy prediction method based on degree-day. Sustain. Cities Soc. 2019, 51, 101698. [Google Scholar] [CrossRef]
  32. Park, S.; Shim, J.; Song, D. Issues in calculation of balance-point temperatures for heating degree-days for the development of building-energy policy. Renew. Sustain. Energy Rev. 2021, 135, 110211. [Google Scholar] [CrossRef]
  33. Lee, K.; Baek, H.-J.; Cho, C. The Estimation of Base Temperature for Heating and Cooling Degree-Days for South Korea. J. Appl. Meteorol. Climatol. 2014, 53, 300–309. [Google Scholar] [CrossRef]
  34. Mourshed, M. Relationship between annual mean temperature and degree-days. Energy Build. 2012, 54, 418–425. [Google Scholar] [CrossRef]
  35. Buyukalaca, O.; Bulut, H.; Yilmaz, T. Analysis of variable-base heating and cooling degree-days for Turkey. Appl. Energy 2001, 69, 269–283. [Google Scholar] [CrossRef]
  36. Jiang, Y. Concept Debate for China’s Building Energy Conservation; China Architecture & Building Press: Beijing, China, 2016. [Google Scholar]
  37. Du, T.; Huang, K.; Zhou, Z.; Sun, X.; Feng, W.; Zuo, J. Analysis on present situation and energy saving potential of heating energy consumption of residential buildings in Chinese northern cities. Heat. Vent. Air Cond. 2016, 46, 75–81. [Google Scholar]
  38. Nobre, J.S.; Singer, J.d.M. Residual analysis for linear mixed models. Biom. J. 2007, 49, 863–875. [Google Scholar] [CrossRef]
  39. Zhao, R.; Fang, C.; Liu, J.; Zhang, L. The evaluation and obstacle analysis of urban resilience from the multidimensional perspective in Chinese cities. Sustain. Cities Soc. 2022, 86, 104160. [Google Scholar] [CrossRef]
  40. Chang, C.; Zhu, N.; Yang, K.; Yang, F. Data and analytics for heating energy consumption of residential buildings: The case of a severe cold climate region of China. Energy Build. 2018, 172, 104–115. [Google Scholar] [CrossRef]
  41. Xia, J.; Zhang, Y. Research on the current situation and typical issues of heating in small towns of northern China. Dist. Heat. 2018, 1, 39–43. [Google Scholar] [CrossRef]
  42. Tian, X.; Xu, J.; Li, N.; Qiu, Y. Current Status and Outlook of Building Energy Conservation Development in Beijing City. Constr. Sci. Technol. 2017, 8, 17–19+33. [Google Scholar] [CrossRef]
Figure 1. Progress of central heating in northern China (2010~2019). (Source: Obtained from reference [13]).
Sustainability 16 01008 g001
Figure 2. Selection details of target cities. (Source: Drawn by authors. The cities statistical data are obtained from the “China Urban Construction Statistical Yearbook” [25], which can be found in Supplementary Materials).
Sustainability 16 01008 g002
Figure 3. Piece-wise predictive model of HDD18. (Source: Drawn by authors based on the calculation results).
Sustainability 16 01008 g003
Figure 4. Results of actual heating base temperatures: (a) in severe cold regions; (b) in cold regions. (Source: Drawn by authors based on the calculation and analysis results).
Sustainability 16 01008 g004
Figure 5. Scatter plot of deviation index for the 60 target cities. (Source: Drawn by authors based on the calculation results).
Sustainability 16 01008 g005
Table 2. The classification criteria and number of cities.
Population SizeTen-Years InvestmentGeographical Regions
Scale (Thousand)NumberLevel (Million CNY)NumberRegionNumber
Small city
Population < 500
17Class D
Investment < 500
16Northeast China17
Medium city
500 ≤ Population < 1000
16Class C
500 ≤ Investment < 1500
13Northwest China19
Big city
1000 ≤ Population < 5000
16Class B
1500 ≤ Investment < 5000
14North China15
Super-/mega-sized city
Population ≥ 5000
11Class A
Investment ≥ 5000
15Central China9
(Source: Drawn by authors based on the classification results. The statistical data are obtained from the “China Urban Construction Statistical Yearbook” (2010~2019), which can be found in Supplementary Materials).
Table 3. Statistical indices of the HDD18 model.
Piece-Wise ModelEvaluation Indices
Climate ClassificationEquationsR2CV-RMSEp-Value
Severe cold regionsy = 0.0302x + 21.0270.7679.684%0.000
Cold regionsy = 0.0357x + 20.7690.66612.020%0.000
(Source: Drawn by authors based on the calculation results. The p-value is less than 0.001 by F test).
Table 4. Categories of top five cities with the lowest deviation index.
City Ranking
(from the Lowest)
Deviation Index City Scale Investment Level
1. Urumqi−1.932 Big city Class A
2. Taiyuan−1.913 Super/mega-sized city Class A
3. Beijing−1.729 Super/mega-sized city Class A
4. Zhengzhou−1.618 Super/mega-sized city Class B
5. Changchun−1.617 Super/mega-sized city Class A
(Source: Drawn by authors based on the calculation results).
Disclaimer/Publisher’s Note: The statements, opinions and data contained in all publications are solely those of the individual author(s) and contributor(s) and not of MDPI and/or the editor(s). MDPI and/or the editor(s) disclaim responsibility for any injury to people or property resulting from any ideas, methods, instructions or products referred to in the content.

