
The Socioeconomic Dimensions of Water Scarcity in Urban and Rural Mexico: A Comprehensive Assessment of Sustainable Development


Abstract
:1. Introduction
2. Materials and Methods
2.1. Study Area
2.2. WPI
2.3. Data Collection
2.3.1. Resource (R)
2.3.2. Access (A)
2.3.3. Capacity (C)
2.3.4. Use (U)
2.3.5. Environment (E)
2.4. Data Analysis
Statistical Tests of the Dataset
2.5. Construction of WPI
3. Results
4. Discussion and Conclusions
4.1. WPI Performance
4.2. Disparities in Water Scarcity
4.3. Sustainable Development
5. Conclusions
Author Contributions
Funding
Institutional Review Board Statement
Informed Consent Statement
Data Availability Statement
Acknowledgments
Conflicts of Interest
Appendix A. Data Collection and Statistical Tests
Appendix B. Data Calculations and WPI Construction
References
- Martinez-Austria, P.F. Climate Change and Water Resources in Mexico. In Water Resources of Mexico; Raynal-Villasenor, J.A., Ed.; Springer International Publishing: Berlin/Heidelberg, Germany, 2020; pp. 157–175. [Google Scholar]
- Raynal-Villasenor, J.A. Water Resources of Mexico, 1st ed.; World Water Resources; Springer: Cham, Switzerland, 2020. [Google Scholar] [CrossRef]
- United Nations-Water. Climate Change and Water: UN-Water Policy Brief; UN-Water: Geneva, Switzerland, 2019; Available online: https://www.unwater.org/publications/un-water-policy-brief-on-climate-change-and-water/ (accessed on 7 November 2023).
- Lara Cervantes, F.R. Economic development and water scarcity in Mexico. Actual Probl. Econ. 2016, 182, 216–223. [Google Scholar]
- Intergovernmental Panel on Climate Change(IPCC). Climate Change 2022—Impacts, Adaptation and Vulnerability: Working Group II Contribution to the Sixth Assessment Report of the Intergovernmental Panel on Climate Change; Cambridge University Press: Cambridge, UK, 2023. [Google Scholar]
- Arreguin-Cortes, F.I.; Saavedra-Horita, J.R.; Rodriguez-Varela, J.M.; Tzatchkov, V.G.; Cortez-Mejia, P.E.; Llaguno-Guilberto, O.J.; Sainos-Candelario, A.; Sandoval-Yoval, L.; Ortega-Gaucin, D.; Mendoza-Cazares, E.Y.; et al. Municipal Level Water Security Indices in Mexico. SN Appl. Sci. 2019, 1, 1194. [Google Scholar] [CrossRef]
- National Institute of Statistics and Geography (INEGI). Panorama Sociodemográfico. 2021. Available online: https://www.inegi.org.mx/contenidos/productos/prod_serv/contenidos/espanol/bvinegi/productos/nueva_estruc/702825197858.pdf (accessed on 28 February 2023).
- Aguilar Barajas, I.; Ramírez Orozco, A.I. Agua Para Monterrey Logros, Retos y Oportunidades Para Nuevo León y México, 2nd ed.; Instituto Tecnológico y de Estudios Superiores de Monterrey: Monterrey, Mexico, 2021; Available online: https://hdl.handle.net/11285/642843 (accessed on 7 November 2023).
- Breña Naranjo, A. Monterrey y su Día Cero. Perspect. IMTA 2022, 3, 1–6. [Google Scholar] [CrossRef]
- de Anda, J.; Shear, H. Sustainable Wastewater Management to Reduce Freshwater Contamination and Water Depletion in Mexico. Water 2021, 13, 2307. [Google Scholar] [CrossRef]
- Huerta, J.P.R. Water Management: A Comparative Analysis on Water Policies between Cape Town (2018) and Monterrey (2022). Albores 2023, 2, 117–130. Available online: https://revistas.uaq.mx/index.php/albores/article/view/1070 (accessed on 2 July 2023).
- National Institute of Statistics and Geography (INEGI). Censo de Población y Vivienda. 2020. Available online: https://www.inegi.org.mx/programas/ccpv/2020/ (accessed on 13 January 2023).
- Quinteiro, P.; Ridoutt, B.G.; Arroja, L.; Dias, A.C. Identification of methodological challenges remaining in the assessment of a water scarcity footprint: A review. Int. J. Life Cycle Assess. 2018, 23, 164–180. [Google Scholar] [CrossRef]
- United Nations. Sustainable Development Goal 6 Synthesis Report 2018 on Water and Sanitation; United Nations: New York, NY, USA, 2018.
- Godinez Madrigal, J.; Van Der Zaag, P.; Van Cauwenbergh, N. A half-baked solution: Drivers of water crises in Mexico. Proceedings of the International Association of Hydrological. Sciences 2018, 376, 57–62. [Google Scholar] [CrossRef]
- Rijsberman, F.R. Water scarcity: Fact or fiction? Agric. Water Manag. 2006, 80, 5–22. [Google Scholar] [CrossRef]
- Martínez Austria, P.F.; Díaz-Delgado, C.; Moeller-Chavez, G. Seguridad hídrica en México: Diagnóstico general y desafíos principales. Ing. Agua 2019, 23, 107–121. [Google Scholar] [CrossRef]
- Reis, N. Finance Capital and the Water Crisis: Insights from Mexico. Globalizations 2017, 14, 976–990. [Google Scholar] [CrossRef]
- Wilder, M.O.; Martinez Austria, P.F.; Hernandez Romero, P.; Cruz Ayala, M.B. The human right to water in Mexico: Challenges and opportunities. Water Altern. 2020, 13, 28–48. [Google Scholar]
- Cruz-Ayala, M.B.; Megdal, S.B. An Overview of Managed Aquifer Recharge in Mexico and Its Legal Framework. Water 2020, 12, 474. [Google Scholar] [CrossRef]
- Fielmua, N.; Mwingyine, D.T. Water at the Centre of Poverty Reduction: Targeting Women as a Stepping Stone in the Nadowli District, Ghana. Ghana J. Dev. Stud. 2018, 15, 46. [Google Scholar] [CrossRef]
- Mukherjee, A.; Babu, S.S.; Ghosh, S. Thinking About Water and Air to Attain Sustainable Development Goals During Times of COVID-19 Pandemic. J. Earth Syst. Sci. 2020, 129, 1–8. [Google Scholar] [CrossRef]
- Arreguin-Cortes, F.I.; Saavedra-Horita, J.R.; Rodriguez-Varela, J.M.; Tzatchkov, V.G.; Cortez-Mejia, P.E.; Llaguno-Guilberto, O.J.; Sainos-Candelario, A. State level water security indices in Mexico. Sustain. Earth 2020, 3, 9. [Google Scholar] [CrossRef]
- Cantú Ayala, C.; Uvalle Sauceda, J.; González Saldívar, F.; Herrera Fernández, B. Evaluación del grado de conservación de las cuencas hidrográficas de Nuevo León, México. Rev. Mex. Cienc. For. 2018, 9, 149–173. [Google Scholar] [CrossRef]
- Metropolitan Water Fund of Monterrey (FAMM) Plan Hídrico Nuevo León 2050. Available online: https://famm.mx/wp-content/uploads/2018/10/Plan-H%C3%ADdrico-NL-2050.pdf (accessed on 27 June 2023).
- Soraes, D.S. The Water in Mexico Rural Zones. Challenges of the 2030 Agenda. Rev. Cienc. Soc. Humanidades 2021, 8, 191–211. [Google Scholar] [CrossRef]
- Distefano, T.; Scott, K. Are we in deep water? Water scarcity and its limits to economic growth. Ecol. Econ. 2017, 142, 130–147. [Google Scholar] [CrossRef]
- Economic Commission for Latin America and the Caribbean, CEPAL. Perspectivas de La Agricultura y Del Desarrollo Rural En Las Américas: Una Mirada Hacia América Latina Y El Caribe 2021–2022. 2021. Available online: https://repositorio.cepal.org/bitstream/handle/11362/45111/CEPAL-FAO2019-2020_es.pdf?sequence=1&isAllowed=y (accessed on 10 May 2023).
- Martínez-Carrasco Pleite, F.; Colino Sueiras, J.B.; Gómez Cruz, M.Á. Pobreza y políticas de desarrollo rural en México. Estud. Soc. 2014, 22, 09–35. [Google Scholar]
- Stoler, J.; Jepson, W.E.; Wutich, A. Beyond handwashing: Water insecurity undermines COVID-19 response in developing areas. J. Glob. Health 2020, 10, 010355. [Google Scholar] [CrossRef]
- Arceo-Gómez, E.O.; Hernández-Cortés, D.; López-Feldman, A. Droughts and rural households’ wellbeing: Evidence from Mexico. Clim. Chang. 2020, 162, 1197–1212. [Google Scholar] [CrossRef]
- Boltvinik, J.; Damián, A. Pobreza creciente y estructuras sociales cada vez más desiguales en México. Una visión integrada y crítica. Acta Sociol. 2016, 70, 271–296. [Google Scholar] [CrossRef]
- Loera-Bermúdez, I.E. Alternativas Para el Desarrollo Rural Sostenible: Planteamiento de un Modelo de Transferencia Tecnológica. Master’s Thesis, Monterrey Institute of Technology and Higher Education, Monterrey, Mexico, 2012. [Google Scholar]
- Gomez, M.; Perdiguero, J.; Sanz, A. Socioeconomic factors affecting water access in rural areas of low and middle income countries. Water 2019, 11, 202. [Google Scholar] [CrossRef]
- Silva, J.A.; Monroy Becerril, D.M.; Martínez Díaz, E. Effects of climate change on water resources in Mexico. Manag. Environ. Qual. Int. J. 2023, 34, 408–427. [Google Scholar] [CrossRef]
- Ortega-Gaucin, D. Impacto de las Sequías en Nuevo León. Cienc. UANL 2013, 16, 8–14. [Google Scholar]
- Gain, A.K.; Giupponi, C.; Wada, Y. Measuring global water security towards sustainable development goals. Environ. Res. Lett. 2016, 11, 124015. [Google Scholar] [CrossRef]
- Greve, P.; Kahil, T.; Mochizuki, J.; Schinko, T.; Satoh, Y.; Burek, P.; Fischer, G.; Tramberend, S.; Burtscher, R.; Langan, S. Global assessment of water challenges under uncertainty in water scarcity projections. Nat. Sustain. 2018, 1, 486–494. [Google Scholar] [CrossRef]
- Burek, P.; Satoh, Y.; Fischer, G.; Kahil, M.; Scherzer, A.; Tramberend, S.; Luzma, F.; Nava; Wada, Y.; Eisner, S.; et al. Water Futures and Solution Fast Track Initiative -Final Report; International Institute for Applied Systems Analysis (IIASA): Laxenburg, Austria, 2016. [Google Scholar]
- Oxford Analytica. Northern Mexico’s Drought Challenges Will Persist. Available online: https://dailybrief.oxan.com/Analysis/DB272251/Northern-Mexicos-drought-challenges-will-persist (accessed on 1 June 2023).
- Magaña, V.; Herrera, E.; Ábrego-Góngora, C.J.; Ávalos, J.A. Socioeconomic drought in a Mexican semi-arid city: Monterrey Metropolitan Area, a case study. Front. Water 2021, 3, 579564. [Google Scholar] [CrossRef]
- Villarreal, F.G. Crisis hídrica y cambio climático. In Panorama y Perspectivas Del Agua En México, 2019–2024; Zamora Saenz, I.B., Sánchez Gálvez, D., Eds.; Senado de la República: Ciudad de Mexico, Mexico, 2020; Volume 62, pp. 119–126. [Google Scholar]
- Herrera, V. Reconciling global aspirations and local realities: Challenges facing the Sustainable Development Goals for water and sanitation. World Dev. 2019, 118, 106–117. [Google Scholar] [CrossRef]
- López-Álvarez, B.; Rizo-Fernández, Z.; Ramos-Leal, J.A.; Morán-Ramírez, J.; Almanza-Tovar, Ó.G. Wáter poverty index in arid zones: The barril aquifer, Santo Domingo, San Luis Potosí, México. Rev. Int. Contam. Ambient. 2019, 35, 35–46. [Google Scholar] [CrossRef]
- Olivas, M.; Camberos, M. El Índice de pobreza hídrica para México: Una comparación con países de la OECD. Entre Cienc. Ing. 2021, 15, 54–62. [Google Scholar] [CrossRef]
- Gleason, J.A.; Casiano Flores, C. Challenges of Water Sensitive Cities in Mexico: The Case of the Metropolitan Area of Guadalajara. Water 2021, 13, 601. [Google Scholar] [CrossRef]
- Wurtz, M.; Angeliaume, A.; Herrera, M.T.A.; Blot, F.; Paegelow, M.; Reyes, V.M. A spatial application of the water poverty index(WPI) in the State of Chihuahua, Mexico. Water Policy 2019, 21, 147–161. [Google Scholar] [CrossRef]
- de Jesus Correa-Islas, J.; Romero-Padilla, J.M.; Pérez-Rodríguez, P.; Vázquez-Alarcón, A. Application of geostatistical models for aridity scenarios in northern Mexico. Atmósfera 2023, 37, 233–244. [Google Scholar] [CrossRef]
- Garriga, R.G.; Foguet, A.P. Improved method to calculate a water poverty index at local scale. J. Environ. Eng. 2010, 136, 1287–1298. [Google Scholar] [CrossRef]
- Anju, A.; Vicky, S.; Kumar, P. Water poverty analysis using Water Poverty Index (WPI)—A critical review. Int. J. Environ. Sci. Nat. Resour. 2017, 1, 1–3. [Google Scholar] [CrossRef]
- Guo, H.; Liang, D.; Sun, Z.; Chen, F.; Wang, X.; Li, J.; Zhu, L.; Bian, J.; Wei, Y.; Huang, L. Measuring and evaluating SDG indicators with Big Earth Data. Sci. Bull. 2022, 67, 1792–1801. [Google Scholar] [CrossRef] [PubMed]
- Poverty Assessment by the National Council for the Evaluation of Social Development Policy CONAPO. Informe de Pobreza y Evaluación 2022. Nuevo León. Available online: https://www.coneval.org.mx/coordinacion/entidades/Documents/Informes_pobreza_evaluacion_2022/Nuevo_Leon.pdf (accessed on 27 June 2023).
- National Institute of Statistics and Geography(INEGI), Anuario Estadístico y Geográfico de Nuevo León 2017. Gobierno Del Estado de Nuevo León, 1. pp. 9–53. Available online: https://www.datatur.sectur.gob.mx/ITxEF_Docs/NL_ANUARIO_PDF.pdf (accessed on 27 March 2023).
- Sánchez De Llanos, J.Á.; Carbajal Tradacete, F.J.; González Burdiel, J.L.; Del Rio Benito, Ó.; Golzalvo Navarro, J.; García Moral, F.J.; Gutiérrez Iglesias, D. Uso del Agua en Nuevo León Oferta y Demanda: Perspectiva del Proyecto Monterrey VI; The Nature Conservancy: Monterrey, Mexico, 2015; pp. 16–54. Available online: https://agua.org.mx/wp-content/uploads/2019/10/Uso-del-agua-en-Nuevo-Le%C3%B3n.pdf (accessed on 7 November 2023).
- Sullivan, C. The potential for calculating a meaningful water poverty index. Water Int. 2001, 26, 471–480. [Google Scholar] [CrossRef]
- Sullivan, C.; Meigh, J.; Lawrence, P. Application of the Water Poverty Index at Different Scales: A Cautionary Tale. Water Int. 2006, 31, 412–426. [Google Scholar] [CrossRef]
- Sullivan, C.; Meigh, J. Considering the Water Poverty Index in the context of poverty alleviation. Water Policy 2003, 5, 513–528. [Google Scholar] [CrossRef]
- Feitelson, E.; Chenoweth, J. Water poverty: Towards a meaningful indicator. Water Policy 2002, 4, 263–281. [Google Scholar] [CrossRef]
- Lawrence, P.; Meigh, J.; Sullivan, C. The Water Poverty Index: An International Comparison. Keele Econ. Res. Pap. 2002, 19, 1–25. [Google Scholar]
- Programa de las Naciones Unidas para el Desarrollo [PNUD]. Informe de Desarrollo Humano Municipal 2010–2015. 2019. Available online: https://www.undp.org/es/mexico/publicaciones/idh-municipal-2010-2015 (accessed on 14 May 2023).
- Hu, Y.; Raza, A.; Syed, N.R.; Acharki, S.; Ray, R.L.; Hussain, S.; Dehghanisanij, H.; Zubair, M.; Elbeltagi, A. Land Use/Land Cover Change Detection and NDVI Estimation in Pakistan’s Southern Punjab Province. Sustainability 2023, 15, 3572. [Google Scholar] [CrossRef]
- Liu, W.; Zhao, M.; Xu, T. Water poverty in rural communities of arid areas in China. Water 2018, 10, 505. [Google Scholar] [CrossRef]
- López-García, T.G.; Manzano, M.G.; Ramírez, A.I. Water availability under climate change scenarios in the Valle de Galeana, Nuevo Leon, Mexico. Tecnol. Cienc. Agua 2017, 8, 105–114. [Google Scholar] [CrossRef]
- Damkjaer, S.; Taylor, R. The Measurement of Water Scarcity: Defining a Meaningful Indicator. Ambio 2017, 46, 513–531. [Google Scholar] [CrossRef] [PubMed]
- Gobierno del Estado de Nuevo Leon. Programa Especial de Fortalecimiento Municipal y Desarrollo Regional. Available online: https://www.nl.gob.mx/publicaciones/programa-especial-de-fortalecimiento-municipal-y-desarrollo-regional (accessed on 21 April 2023).
- Aguilar-Barajas, I.; Magaña-Rueda, V.; Ramírez-Orozco, A.; Sisto, N. Fortalecimiento de la Gobernanza Hídrica en Contextos de Cambio Climático: El caso de la zona Metropolitana de Monterrey; Unpublished technical report; UN-Habitat: Monterrey, Mexico, 2013. [Google Scholar]
- Scott, C.A.; Lutz-Ley, A.N. Enhancing water governance for climate resilience: Arizona, USA—Sonora, Mexico comparative assessment of the role of reservoirs in adaptive management for water security. In Increasing Resilience to Climate Variability and Change: The Roles of Infrastructure and Governance in the Context of Adaptation; Springer: Singapore, 2016; pp. 15–40. [Google Scholar]
- Rivera Vázquez, B.I.; Salcedo Sánchez, E.R.; Esquivel Martínez, J.M.; Gómez Albores, M.Á.; Gómez Noguez, F.; Gutiérrez Flores, C.; Talavera Mendoza, O. Use of Analytic Hierarchy Process Method to Identify Potential Rainwater Harvesting Sites: Design and Financial Strategies in Taxco de Alarcón, Southern Mexico. Sustainability 2023, 15, 8220. [Google Scholar] [CrossRef]
- González-Padrón, S.K.; Lerner, A.M.; Mazari-Hiriart, M. Improving Water Access and Health through Rainwater Harvesting: Perceptions of an Indigenous Community in Jalisco, Mexico. Sustainability 2019, 11, 4884. [Google Scholar] [CrossRef]
- Villada-Canela, M.; Martínez-Segura, N.; Daesslé, L.W.; Mendoza-Espinosa, L. Fundamentos, obstáculos y retos de la participación pública en la gestión del agua en México. Tecnol. Cienc. Agua 2019, 10, 12–46. [Google Scholar] [CrossRef]


| Component | Definition | Indicator | |
|---|---|---|---|
| Resource | Physical water availability for human consumption | R1 | Availability of water per inhabitant per day |
| Access | Capacity of the population to access water for human consumption | A1 | Percentage of the population with water public service |
| A2 | Percentage of the population with access to sanitary drainage | ||
| A3 | Percentage of people who live in houses with water infrastructure | ||
| Capacity | Effectiveness of people’s ability to manage water | C1 | Infant mortality rate |
| C2 | Percentage of employed population with an income of up to two minimum wages | ||
| C3 | Percentage of the population living in houses without piped water | ||
| C4 | Percentage of the population living in poverty | ||
| Use | Ways in which water is used for different purposes | U1 | Percentage of domestic water uses |
| U2 | Percentage of agricultural water uses | ||
| Environment | Relationship between water use and environmental conditions | E1 | Analysis of vegetation cover using NDVI |
| E2 | Surface affected by soil degradation |
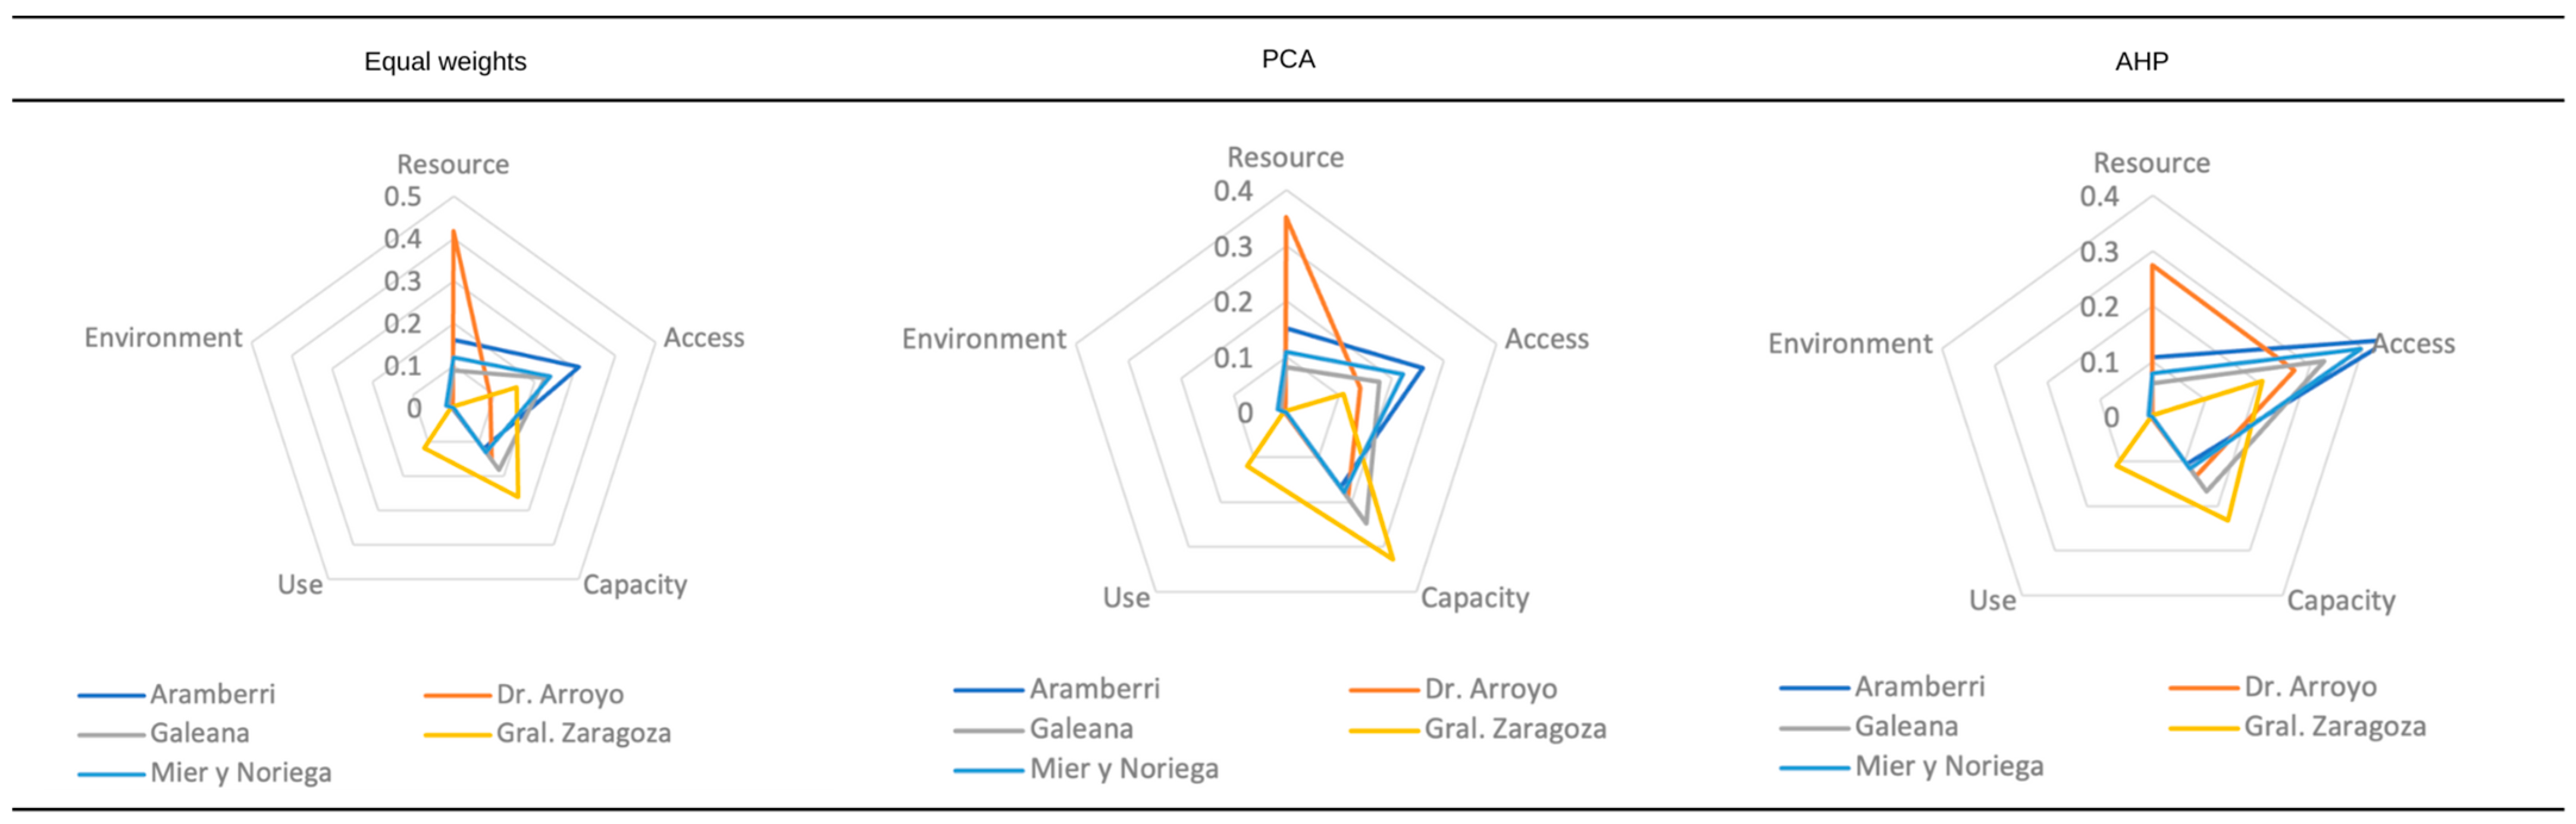
| Locality | Components | ||||
|---|---|---|---|---|---|
| Resource | Access | Capacity | Use | Environment | |
| Aramberri | 0.5698 | 0.7913 | 0.4908 | 0.0613 | 0.1068 |
| Dr. Arroyo | 0.9153 | 0.4251 | 0.5515 | 0.0572 | 0.0601 |
| Galeana | 0.4002 | 0.6393 | 0.5723 | 0.0404 | 0.1534 |
| Gral. Zaragoza | 0.0749 | 0.5396 | 0.6976 | 0.4697 | 0.0969 |
| Mier y Noriega | 0.4634 | 0.6593 | 0.4853 | 0.0222 | 0.1841 |
| South region | 0.2212 | 0.6320 | 0.5595 | 0.0392 | 0.1870 |
| MMA | 0.4183 | 0.1370 | 0.4960 | 0.7647 | 0.2113 |
| Component | Weights | ||
|---|---|---|---|
| Equal Weights | PCA Weights | AHP | |
| Resource | 0.2 | 0.185 | 0.158 |
| Access | 0.2 | 0.152 | 0.319 |
| Capacity | 0.2 | 0.275 | 0.212 |
| Use | 0.2 | 0.222 | 0.221 |
| Environment | 0.2 | 0.166 | 0.09 |
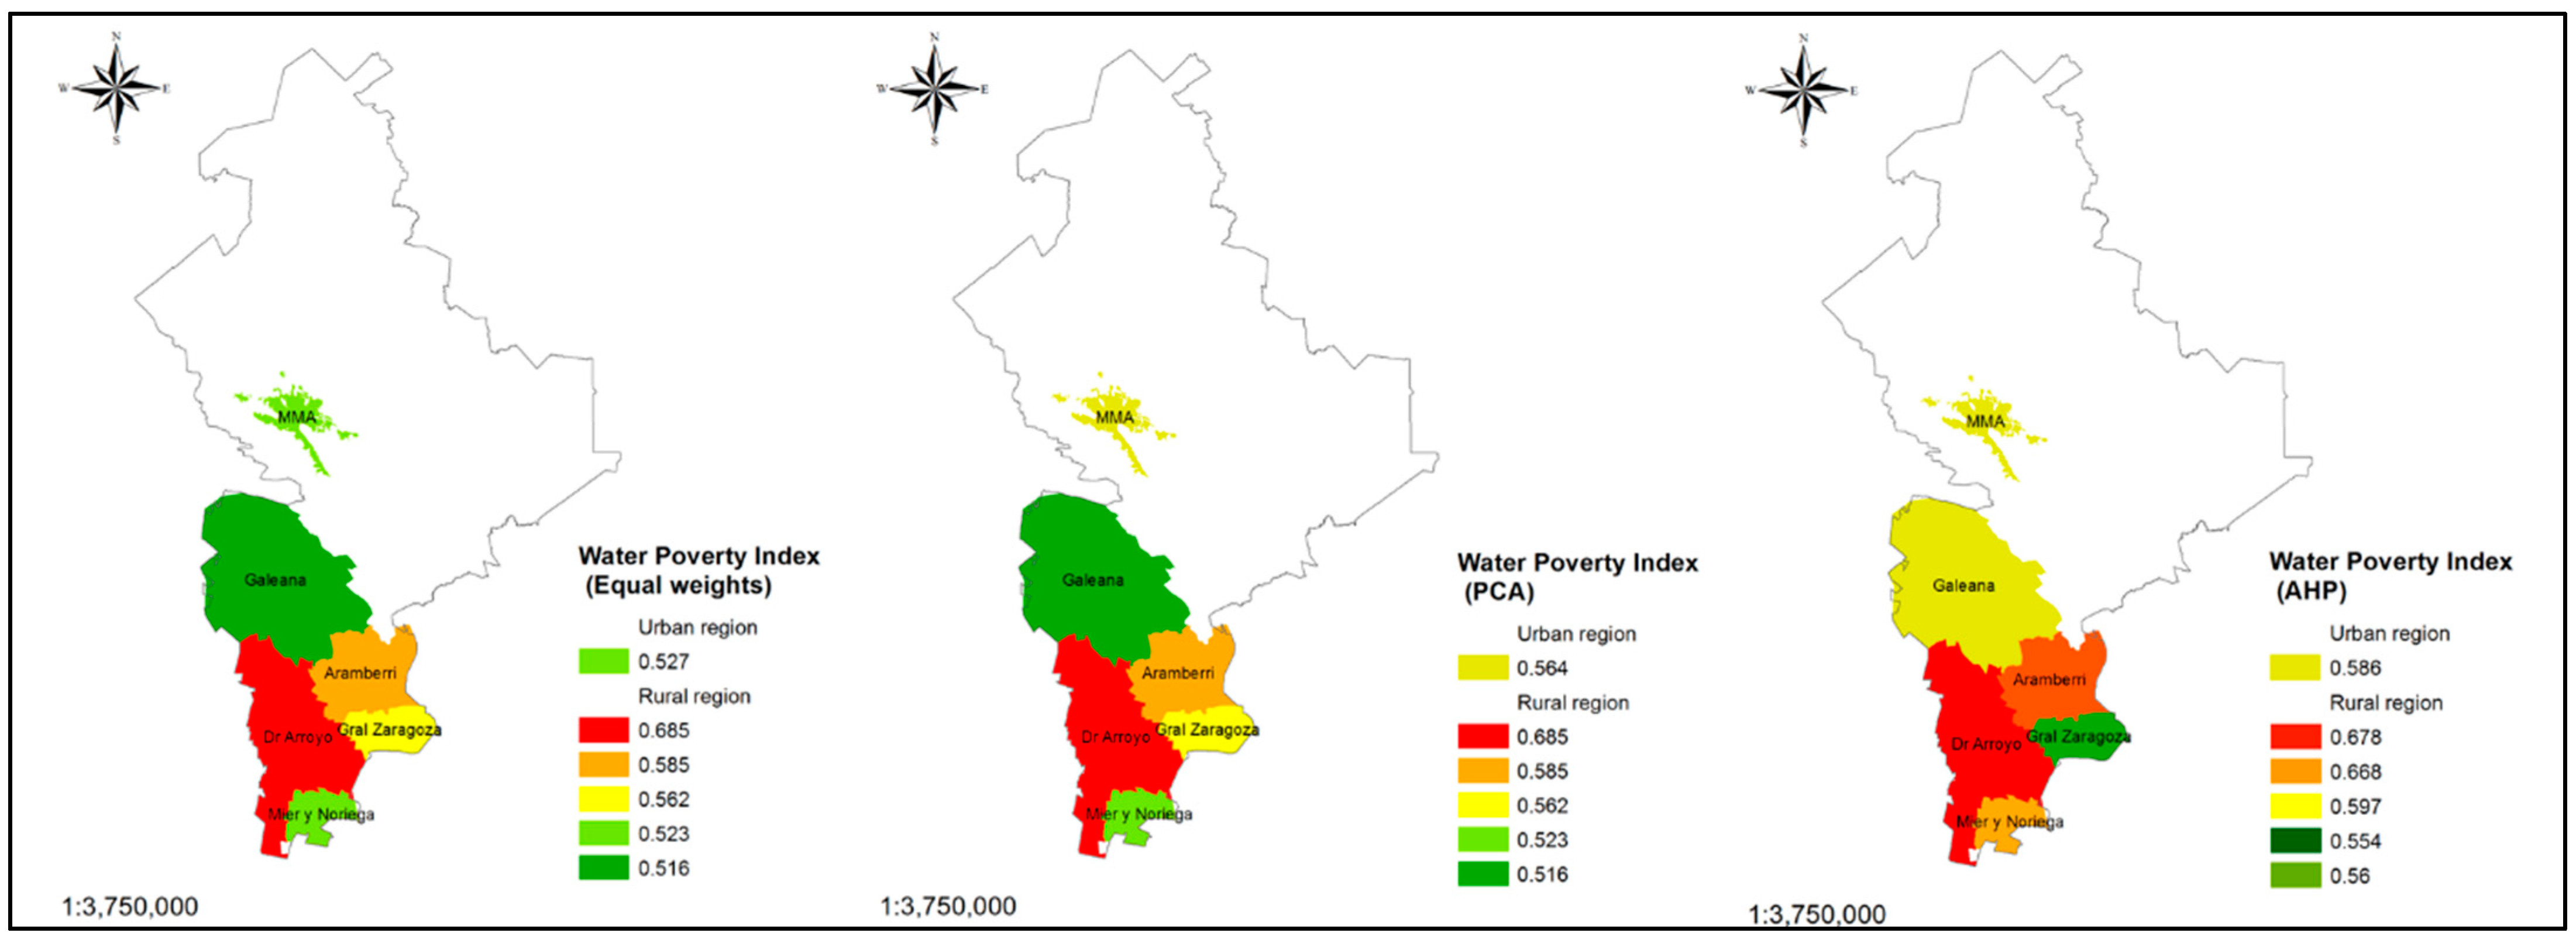
| WPI | |||
|---|---|---|---|
| Locality | Equal Weights | PCA | AHP |
| Aramberri | 0.597 | 0.585 | 0.668 |
| Dr. Arroyo | 0.661 | 0.685 | 0.678 |
| Galeana | 0.510 | 0.516 | 0.560 |
| Gral. Zaragoza | 0.539 | 0.562 | 0.554 |
| Mier y Noriega | 0.506 | 0.523 | 0.597 |
| South Nuevo Leon | 0.563 | 0.574 | 0.612 |
| MMA | 0.527 | 0.564 | 0.586 |
Disclaimer/Publisher’s Note: The statements, opinions and data contained in all publications are solely those of the individual author(s) and contributor(s) and not of MDPI and/or the editor(s). MDPI and/or the editor(s) disclaim responsibility for any injury to people or property resulting from any ideas, methods, instructions or products referred to in the content. |
© 2024 by the authors. Licensee MDPI, Basel, Switzerland. This article is an open access article distributed under the terms and conditions of the Creative Commons Attribution (CC BY) license (https://creativecommons.org/licenses/by/4.0/).
Share and Cite
Pacheco-Treviño, S.; Manzano-Camarillo, M.G. The Socioeconomic Dimensions of Water Scarcity in Urban and Rural Mexico: A Comprehensive Assessment of Sustainable Development. Sustainability 2024, 16, 1011. https://doi.org/10.3390/su16031011
Pacheco-Treviño S, Manzano-Camarillo MG. The Socioeconomic Dimensions of Water Scarcity in Urban and Rural Mexico: A Comprehensive Assessment of Sustainable Development. Sustainability. 2024; 16(3):1011. https://doi.org/10.3390/su16031011
Chicago/Turabian StylePacheco-Treviño, Silvana, and Mario G. Manzano-Camarillo. 2024. "The Socioeconomic Dimensions of Water Scarcity in Urban and Rural Mexico: A Comprehensive Assessment of Sustainable Development" Sustainability 16, no. 3: 1011. https://doi.org/10.3390/su16031011
APA StylePacheco-Treviño, S., & Manzano-Camarillo, M. G. (2024). The Socioeconomic Dimensions of Water Scarcity in Urban and Rural Mexico: A Comprehensive Assessment of Sustainable Development. Sustainability, 16(3), 1011. https://doi.org/10.3390/su16031011