Article

Factors Associated with the Profitability of Agritourism Operations in Maryland, USA †

UMES Extension, School of Agricultural and Natural Sciences, University of Maryland Eastern Shore, Princess Anne, MD 21853, USA
*
Author to whom correspondence should be addressed.
This paper was presented at the National Extension Tourism (NET) 2023 Conference, Milwaukee, WI, USA, 24–27 September 2023.
Sustainability 2024, 16(3), 1025; https://doi.org/10.3390/su16031025
Submission received: 14 December 2023 / Revised: 20 January 2024 / Accepted: 21 January 2024 / Published: 25 January 2024
(This article belongs to the Section Tourism, Culture, and Heritage)

Abstract

:
Small and medium farmers across the USA face multifarious challenges for survival. Agritourism has been an alternative to diversify their income streams. Researchers have examined various factors determining the profitability of agritourism operations that range from the operators’ socio-demographic and firmographic to geographic characteristics. However, the understanding of the extent to which the number of visitors and other factors influence the profitability of agritourism operators in Maryland, USA, is limited. This paper examines various factors associated with (a) the profitability of and (b) the number of visitors to agritourism operations. Using data collected from Maryland in 2022, the multivariate results reveal that the number of visitors to the farm increases the odds of profitability. However, the relationship was mediated by the number of employees, which influenced the number of attractions and visitors. Moreover, the number of employees independently and significantly affected the profitability. Further results reveal that the length of operation, the number of employees, and operating during the fall season significantly influence the number of visitors. These findings imply that policies should consider ways to facilitate labor hiring as well as other factors to attract farm visitors and increase farm profitability.

1. Introduction

This paper examines factors associated with (a) the profitability of and (b) the number of visitors reported by agritourism operators in Maryland. USA farmers face multifarious challenges that primarily include market access and competition, labor shortage, and price fluctuations. These farmers are increasingly exploring alternative strategies to remain competitive in farming, merging conventional agriculture with tourism, which is commonly referred to as “agritourism” [1,2,3,4]. Agritourism has been a critical enterprise that has helped to generate employment and income-earning opportunities, specifically for many small and medium farmers [5].
The agritourism business has recently been growing in the USA, including Maryland [6,7]. The 2017 Census of Agriculture reported that 28,575 farms offered agritourism and recreational services, contributing USD 949 million in sales [8]. Between 2002 and 2007, there was a significant growth of about 90% in the number of farms that made at least USD 25,000 annually from agritourism [9].
A farm owner’s/operator’s primary goal in establishing or switching to an agritourism venture is to increase incomes through enterprise diversification [5,7,10,11,12,13,14]. According to the Agritourism and On-Farm Direct Sales Survey, a national survey, 92% of female operators and 91% of male operators reported increasing farm/ranch revenue among the most critical goals [15]. Unless they reap the economic benefits of the new or alternative venture, it is difficult for them to become economically viable and sustainable in the long run [16]. However, establishing or switching to an agritourism enterprise per se does not necessarily result in profits. Thus, one of the concerning questions is—(a) What factors influence such a variation in the profitability of agritourism farms?
In order to generate more income, agritourism enterprises rely on the number of visitors visiting their farms for recreation, experiential learning (education), or for the direct selling of their produce. Otherwise, they will not generate the expected revenue through diversification alone. Thus, our following questions are: (b) Does the number of visitors translate into the profitability of agritourism farms? and (c) What factors influence the number of visitors?
Researchers have identified various factors and have examined their influences on the profitability of an agritourism operation. These factors range from an operator’s socio-demographic to firmographic (firm-related) and spatial characteristics [3,16,17]. Other researchers have investigated the influence of operators’ motivations on profitability [5]. Researchers have also investigated place-based factors (such as the distance to the nearest urban city, population density, mileage from the county highways, and natural amenities) and farm-based factors (such as the operator’s net worth, farm acreage, and hours spent on the farm) [3,16,18].
However, studies on the various factors that influence the number of visitors to an agritourism farm are scant or such information needs to be readily available in the literature. Nevertheless, using data from Texas, Abello and colleagues examined the various factors influencing the number of visits to farmers’ markets, an important aspect of agritourism [19]. These scholars revealed that several factors, such as travel distance, number of adults in the household, market promotional activities such as entertainment and education, food events, and factors such as the age and education of operators, significantly influenced the frequency of visits to farmers’ markets. In addition, it was revealed that adult household size was statistically significantly associated with the number of visits to farmers’ markets [20]. However, consumer socio-demographics, such as age, income, or education, were not statistically significantly related. These characteristics were of the consumers rather than of a farmers’ market operator. Moreover, surprisingly, food events organized by a farmers’ market were negatively associated with the number of visits, whereas educational activities and festivals significantly attracted more visitors. Other scholars reported that product quality and freshness may attract consumers [20,21]. Although these factors are not related to the number of visits to an agritourism farm, similar variables may have an essential influence on the number of visits to an agritourism farm.
Overall, the understanding of the various factors influencing the profitability or the number of visitors is limited. Thus, this study was designed to fill this research gap. In this study, we focused on operators’ characteristics rather than those of the visitors. Specifically, we empirically investigated the influence of operators’ demographic (such as age), firmographic (such as the length of operation, the number of employees, the season of operation, whether a farm raises or produces animals or crops for commercial sale, and the various types of farm offerings or attractions), and geographic (rural/urban location of a farm) characteristics on the accrued profitability as well as on the number of visitors to a farm. While agritourism has received much attention from academia and the policy sector more recently, studies that focus on the factors associated with profitability and the number of visitors are scarce [3]. From policy and planning perspectives, such an under-investigation of this issue has hindered decision-making processes for the effective policy development, planning, management, and implementation of agritourism programs and activities to support needy farmers, which is critical for the sustainability of small and medium farms. From a theoretical perspective, this study contributes to the existing literature by investigating the theoretical relationships among the interest variables.

2. Review of the Literature

2.1. Agritourism: The Concept and the Framework

It is believed that the modern concept of ‘agritourism’ may have originated in South Tyrol, Italy, during the second half of the 19th century [22]. In North America, ranches in the Rocky Mountain area became the major tourist attractions around the 1920s and 1930s [23]. Chase and Grubinger [23] further reported that rural recreation in the USA gained momentum during the 1930s and 1940s to escape from the stresses of the Great Depression and World War II. Recreations, such as horseback riding and farm petting zoos, increased during the 1960s and 1970s, and farm vacations, bed and breakfasts, and commercial farm tours were popularized in the 1980s and 1990s. More recently, farm stays (also known as the European agritourism business model), where visitors can stay on the farm, have gained popularity.
The concept of ‘agritourism’ has spread throughout the globe with the passing of the first national law in 1985 in Italy [22]. The law recognized agritourism and defined this concept to restore farm buildings and to diversify the incomes of working farms in rural areas by encouraging overnight stays on the farm. This is also known as agriturismo. Yet, there is no one unique and standard definition of agritourism worldwide [2,22,24,25,26]. The concept is known by various names: rural tourism, countryside tourism, village tourism, farm visits, agritourism, and agrotourism, to mention a few [22,24,27,28]. According to the National Law Center [28], agritourism is a “commercial enterprise that links agricultural production and processing with tourism to attract visitors onto a farm, ranch, or other agricultural business to entertain and educate the visitors while generating income for the farm, ranch, or business owner”.
It is widely recognized that a consistent global understanding of agritourism would be necessary for designing appropriate research and education, developing policies, and implementing programs to support working farms and rural communities [2,22,29].
In 2010, Philips and colleagues [25] offered a framework that outlined tourist activities in a working vs. non-working farm and the nature of visitors’ contact with agriculture. These scholars classified agritourism as (a) non-working farm agritourism; (b) working farm passive contact agritourism; (c) working farm indirect contact agritourism; (d) working farm direct contact, staged agritourism; and (e) working farm, direct contact, authentic agritourism. According to these scholars, a working farm with direct contact that seeks the participation of visitors in the farm tasks is the most authentic agritourism practice. Flanigan and colleagues [30] in 2014 revised this framework considering the nature of visitors–farm interactions, which were grouped as (a) non-working farm indirect interaction agritourism; (b) working farm indirect interaction agritourism; (c) non-working farm direct interaction agritourism; (d) working farm direct staged interaction agritourism; and (e) working farm, direct authentic interaction agritourism.
Streifeneder [27] further emphasized tourism in rural areas as authentic agritourism with a special focus on working farms, structures, activities, accommodation, and enabled interaction. In 2018, Chase and colleagues [2] developed a comprehensive conceptual framework that incorporated core and peripheral tiers. They identified five core activities—direct sales, education, hospitality, outdoor recreation, and entertainment—with their specific activities at the center, which are the essential components of an agritourism enterprise. The authors, however, asserted that peripheral activities, such as farmers’ markets, off-farm agri-museums, hiking, and photography, may or may not be considered as agritourism.

2.2. Theoretical and Empirical Reviews

Agritourism offers several socio-economic, non-economic, and environmental benefits to business owners (farmers), visitors, and local communities [5,7]. Among the socio-economic benefits are employment, education, income generation, and tax benefits. Recreation, leisure activities, and socio-psychological satisfaction are among the non-economic benefits and environmental benefits may include nature and land conservation and the preservation of agricultural heritage.
There is no doubt that diversifying income sources is one way of sustaining farmers’ livelihoods [7]. Agritourism, as a commercial venture, is an alternative to diversify farmers’ income sources, and a farm owner’s/operator’s primary goal in establishing or switching to agritourism is to increase income through enterprise diversification [18,28]. Farmers generate additional income by combining agriculture and tourism while entertaining and educating the visitors on the farm, ranch, or the business. Nickerson and Black [5] empirically found that one of the main motives of farmers to decide to start agritourism is to generate additional income or some other form of monetary incentive.
The diversification of a farm through agritourism means the inclusion of recreation, education, and leisure activities for visitors [7]. Farm operators aim to increase revenue from agritourism through the direct sales of their products and services by increasing the number of visitors as well as the length of their stay on the farm. However, it is well documented that obtaining economic benefits from agritourism is only sometimes universal. Various factors influence the profitability of a farm, which are discussed below.

2.2.1. Operators’ Socio-Demographic Characteristics

An operator’s demographic characteristics, such as gender, age, and race/ethnicity, may have an essential influence on profitability. In general, in the USA, White male operators traditionally dominate farming and ranching [31]. However, the evidence shows that both male and female farmers are equally efficient farm managers [32]. If we borrow this evidence, there is reason to believe that both the profitability of and the number of visitors to a farm are relatively similar between male- and female-operated farms. Evidence, however, suggests that gender is statistically significant but negatively associated with farm profitability, implying that female-operated farms are less likely to run in profits compared to male-operated farms [3]. Similarly, Barbieri and Mshenga [31] also revealed that male-operated farms had a significantly better performance (with a greater amount of annual gross sales) than female-operated farms.
As the profitability of an agritourism business depends on the number of visitors to the farm, and male-operated farms are likely to generate higher margins, male-operated farms will attract significantly more visitors than females. The lower performance of women-operated farms is likely to be related to factors that limit women’s access to resources, such as fewer linkages to networks that enable customer and partnership building and reduced access to financial resources [31].
Most farms in the USA are aging and are run by older operators. For example, Chase et al. [15] reported that the most significant proportion of farmers (27.3%) are between the age of 55 and 64 years, followed by 45–54 years (20.5%). Nearly a quarter of them (25.4%) are 65 years and over. On the one hand, it can be expected that older and experienced farmers are more likely to attract visitors, which results in more profits. Contrary to this, it can also be expected that older operators are less likely to accept change or adopt newer practices. However, Tauer [33] revealed that farmers with different age groups operate with slightly different technologies and use various inputs at different efficiencies. Tauer observed that middle-aged farmers were the most productive ones. In agritourism, Barbieri and Mshenga [31] revealed that an operator’s age was inversely associated with a farm’s performance, measured in terms of gross sales. This could be because younger farmers are more adaptable and willing to introduce new products and services and perhaps are relatively entrepreneurial and willing to take the risk associated with innovation. However, Hollas et al. [3] did not find a statistically significant association between the operator’s age and profitability. Using this mixed evidence, it may be inferred that the age of the operator may not significantly influence the number of visitors to the farm.
Education enhances knowledge and skills, increasing the operators’ managerial capacity. Moreover, education helps to increase access to information, enhancing an individual’s ability to process information and may provide them with a better chance of managing their farms. This will ultimately help to increase profit. Lucha et al. [17] found a statistically significant and positive association between an operator’s education and profitability in Virginia. However, Hollas et al. [3] did not find a significant association between an operator’s education and profitability in the USA.

2.2.2. Firmographic Characteristics

For any agricultural operation, including agritourism, farm acreage is one of the primary capital inputs. The land is important for producing crops, vegetables, fruits, raising animals, ranches, farm tours, and farm stays. Theoretically, it is expected that the profitability of an agritourism enterprise increases with the increase in the operational land size. Access to and ownership of farmland is crucial for sustaining livelihoods, which provides employment and income to farmers [34,35]. Land ownership increases control over other resources, such as income earned from land, political power, and access to other institutions, for example, banks. Scholars reported a positive association between farm acreage and the annual gross sales of agritourism farms [7,11,12,17,31]. Surprisingly, Hollas et al. [3], however, did not find a significant relationship between farm size and profitability.
The availability of staff on a farm is important for the proper management and for the effective delivery of various products and services to the visitors. The Agritourism and On-Farm Direct Sales Survey results reported that, in the USA, labor shortage was among the top two challenges for agritourism operations [15]. Of the total respondents, 89% of them reported that labor was somewhat or very challenging. The Maryland Agritourism Operator’s Survey also revealed a shortage of labor as a problem in running farms [18]. Thus, if a farm has enough staff to efficiently and effectively manage and deliver products and services on time, the farm is expected to attract more visitors, resulting in increased direct sales and service sales. Barbieri and Mshenga [31] provide strong evidence that the number of employees on a farm significantly and positively influences a farm’s performance, measured in gross annual sales.
Attracting visitors is one of the goals of agritourism, which is to increase revenue. More revenue will result from increased direct sales of products and services. Thus, the number of annual visits to the farm may influence the farm’s profitability. A farm with a large number of visitors can sell their products and services to the customers directly and will make more significant profits. However, Hollas et al. [3] surprisingly did not find a significant relationship between the annual number of visits and profitability. They suspected that many farms remain open longer and receive more visitors, but they do not charge the visitors for their experience.
The stage of the development of an agritourism farm, as well as the length of establishment, is equally important to increase the profitability of a farm [3,5]. A farm benefits from its length of operation through experience, reputation, and accumulation of more assets for investment [31]. Barbieri and her colleague [31] found that the length of operation significantly increased farm income.
Some agritourism farms offer seasonal services, and others are under operation for the entire year. Thus, the number of days during which the farm is open may influence the profitability of the farm. However, Hollas et al. [3] found no statistically significant evidence of a relationship between these two measures. In addition, the seasonality of operation may affect the number of visitors to the farm or the profitability of the farm.
Chase et al. [2] provided a detailed list of various core and peripheral activities in their conceptual framework, including educational, experiential, and recreational activities. In Maryland, the statutes include: (i) farm tours, (ii) hayrides, (iii) corn mazes, (iv) seasonal petting farms, (v) farm museums, (vi) guest farms, (vii) pumpkin patches, (viii) “pick your own” or “cut your own” produce, (ix) camping, (x) incidental outdoor stays, (xi) classes related to agricultural products or skills, and (xii) picnic and party facilities offered in conjunction with any agritourism activity, and farm stays considered as agritourism activities. The evidence shows that, of the various offerings examined, on-farm sales and entertainment significantly increased profitability, whereas off-farm sales significantly reduced it [3].

2.2.3. Geographic Characteristics

Access to an agritourism farm and its location are important for attracting visitors. Some scholars have assessed geographic variables, such as the distance from a city with at least 50,000 people. It is expected that, if a farm is able to attract visitors from farther distances, it will fetch more significant profits. Another factor assessed was the number of visitors from a radius of 50 miles or over [3]. These scholars found statistically significant and positive relationships between the percentages of visitors from 50+ miles and a farm’s profitability. Another measure is the rural–urban location of a farm. A farm located in rural areas may attract fewer visitors due to having less access to many visitors, unlike in urban areas, which will adversely affect their profits compared to those located in urban areas.

3. The Conceptual Framework, Study Context, and Methods

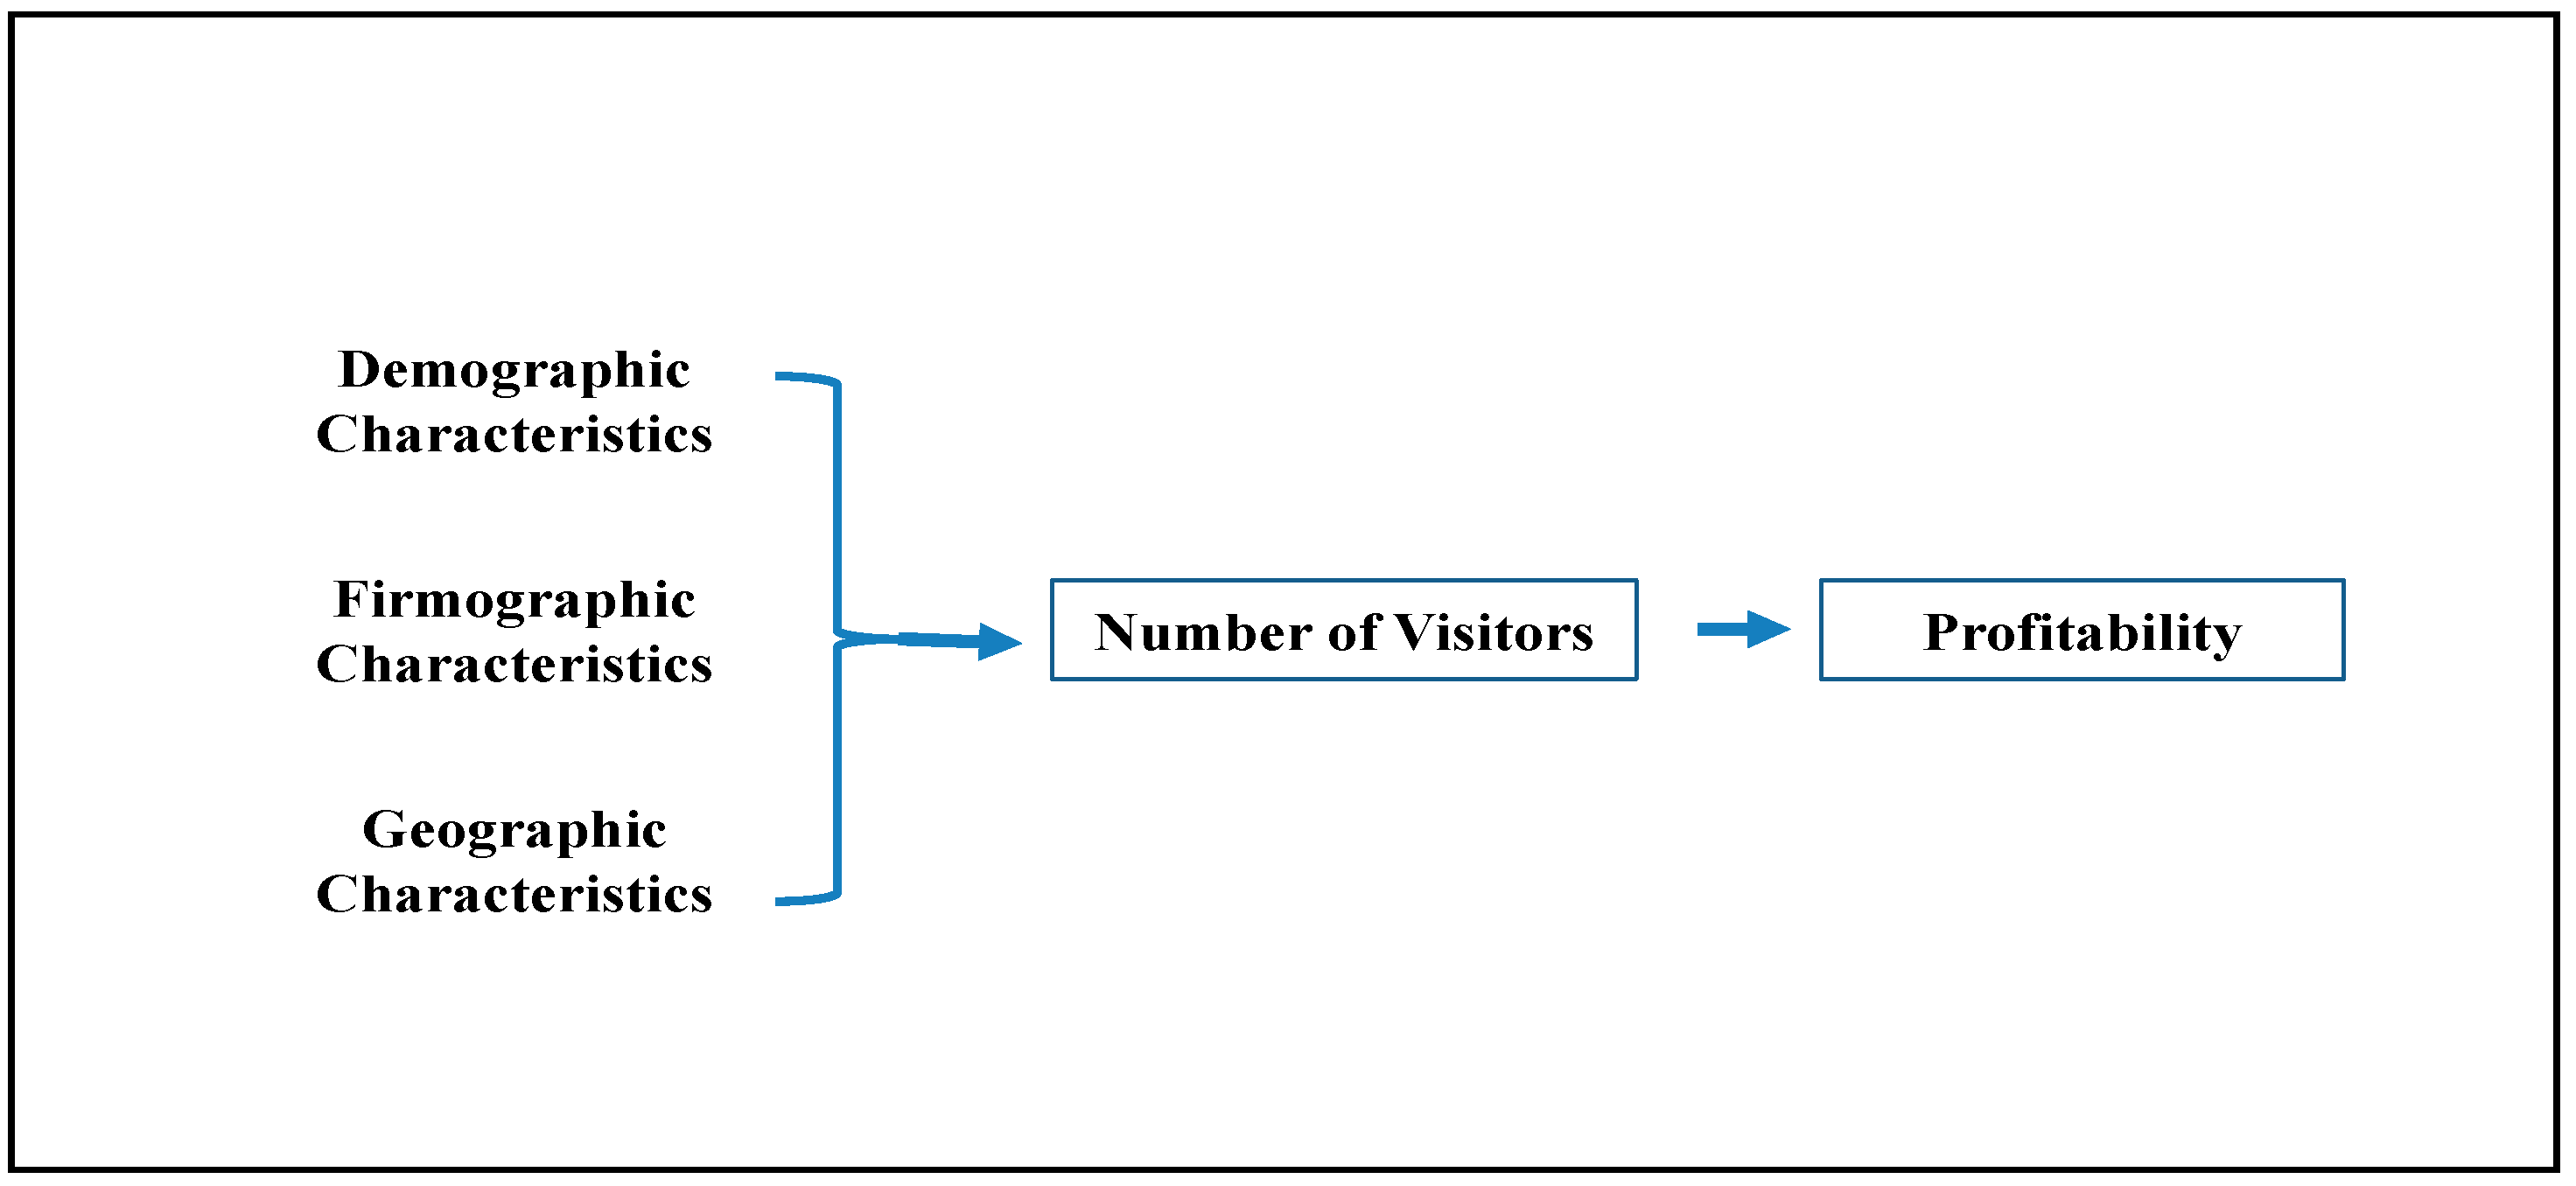
3.1. The Conceptual Framework

Below, we discuss the conceptual framework based on the theoretical reviews and empirical evidence discussed earlier in this paper on the likely influence of operators’ socio-demographic, firmographic, and geographic factors on profitability as well as the number of visitors attracted by a farm. The basic assumption of the conceptual framework is that agritourism is a diversification strategy adopted by farmers in order to generate additional income by attracting visitors. This strategy also provides education as well as recreation to the visitors (Figure 1).
It is theoretically expected that a farm, as a business entity, generates additional income by increasing the number of visitors to the farm and charging entrance fees, the direct selling of products and services, charging training and consultation fees for offering various educational packages such as guided farm tours, organizing events (such as u-pick, hayrides, and corn mazes), and offering farm stays and many other activities to the visitors. In addition, the firm may receive tax benefits from the state and federal governments for offering such services.
As discussed earlier in the paper, the number of visitors to a farm depends on various socio-demographic, firmographic, and geographic factors. The availability of offerings or attractions may be influenced by various firmographic characteristics, such as the size of the operation, the length of operation, business loyalty, marketing and advertisement, the number of supporting staff on the farm, and the season of operation. Other characteristics, such as an operator’s education and experience associated with age, gender, and race/ethnicity, may also influence the types of offerings, resulting in the attraction of visitors and the generation of income from the farm. Simultaneously, these factors may have a direct influence on increasing profitability through efficient business management. In addition, geographic location and convenient access to an agritourism firm may influence the attraction of visitors.

3.2. The Study Context: Agriculture and Agritourism in Maryland

Agritourism in Maryland has been growing recently [6]. In Maryland, agriculture is the largest commercial industry. According to the 2017 Agriculture Census, Maryland [8] hosted a total of 12,429 farms. Agriculture remains the most extensive single land use in the state, with 2 million acres, or roughly 32% of the total land area used for farming in 2022. It contributes to over USD 8.25 billion in revenue each year. On average, each farm sold USD 198,954 worth of market-value agricultural products in 2017. However, nearly 40% of the farms sold less than USD 2500, and nearly 20% sold agricultural produce worth in the range from USD 2500 to USD 9999. This sector alone provides jobs for 350,000 people, including nearly 6000 full-time farmers [36]. The average acreage of a farm is 160 acres (and a median farm size of 40 acres only). These data suggest that there are many small and medium farms in the state, half of them with a land size of 40 acres or lower. Specifically, 18% of the farms are below 9 acres of land, nearly 37% have between 10 and 49 acres, and about 27% have between 180 and 499 acres of land. Most of these farms (96%) are family-owned [8].
Regarding agritourism, House Bill 252, passed by the Maryland General Assembly on 19 March 2018, provides a model definition as “an activity conducted on a farm offered to the general public or guests for education, recreation, or active involvement in farm operations” (Md. Code, Land Use Section 4-212: Section 4-212—Agritourism). In its statutes, agritourism includes the following activities: (i) farm tours; (ii) hayrides; (iii) corn mazes; (iv) seasonal petting farms; (v) farm museums; (vi) guest farms; (vii) pumpkin patches; (viii) “pick your own” or “cut your own” produce; (ix) camping; (x) incidental outdoor stays; (xi) classes related to agricultural products or skills; and (xii) picnic and party facilities offered in conjunction with any agritourism activity. Recently, Maryland included farm stays, expanding the definition of agritourism (by approving the bill HB 558 on 16 May 2022) to add “camping” and “incidental outdoor stays”. According to the 2017 Census of Agriculture, some 295 farms in Maryland supplemented their income through agritourism, including farmers’ markets or farm stands, farm visits, and county fairs. Throughout Maryland, agritourism events generate over USD 162 million for the economy and help to support more than 1000 jobs [6].

3.3. Methods

3.3.1. Data

This paper used the agritourism operators’ data collected in 2022 by the University of Maryland Eastern Shore (UMES) Extension. UMES Extension first accomplished a research program in 2018, also known as the Maryland Agritourism Baseline Development Project (MABDP). This project prepared a database of 485 agritourism operators, including their physical addresses and contact information through internet research of the stakeholder websites, direct contact and investigations, UMES School of Agricultural and Natural Sciences (SANS) referrals, and USA agritourism services directories [37]. These data were corroborated by the databases of the United States Department of Agriculture (USDA), state government sources, and non-governmental organizations (NGOs).
Following the preparation of the database, in 2022, UMES Extension administered a survey to the operators of agritourism enterprises across the state. This survey included information on the operator’s demography, importance, profitability, employment prospects, operation status, businesses’ role, quality, effectiveness, perceived challenges, and the length of operation. Other information included were the seasons of operations, attractions or offerings, and the importance of agritourism. The survey was mailed to all the 485 operators in early March 2022. Of this number, 91 completed surveys were returned, providing a valid response rate of 18.7%, but 8.2% had invalid addresses. Of the total responses, only 68 of them were currently practicing agritourism. Excluding 1 case with missing data, we used data from 67 agritourism operators in this paper.

3.3.2. Measures

Outcome Measures

The two outcome measures assessed in this paper were (a) self-perceived profitability and (b) the number of visitors to the farm. The measurement of the variables is described below.
a. Self-perceived profitability. In the survey, profitability was measured by asking, “Which of the following best describes the economic situation of your farm/agritourism business?” The four response categories were (a) profitable, (b) makes some profit, (c) breaks even, and (d) operates at a loss. Of the total 67 responses, 35.3% reported that their farm was profitable, 32.4% reported that their farm made some profit, 14.7% reported that it broke even, and 17.6% indicated that they operated at a loss. Considering the distribution, initially, we grouped this variable as a dichotomy: (i) profitable or makes some profit (coded as 1) and (ii) breaks even or operates at a loss (coded as 0). However, during our extensive analysis, we found that the makes some profit group was similar to the breaks even or operates at a loss group. Thus, an outcome variable with only those that reported being profitable (coded as 1) vs. otherwise (coded as 0) was created.
b. Number of visitors to the farm. This variable was measured by asking, “Approximately how many visitors come to your agritourism business yearly?” The respondents provided the guesstimate of the number of visitors. As the range of the number of visitors varied greatly (from a minimum of 50 to a maximum of 300,000) with a highly skewed distribution, this outcome variable was logged for analysis.

Explanatory Measures and Hypotheses

Based on the above-mentioned theoretical and empirical reviews, the explanatory measures and their hypothesized relationships with the outcome variable, self-reported profitability, are described below.
(a) Number of visitors. As described earlier, a logged measure of the number of visitors was used in the analysis.
Hypothesis 1.
An increase in the number of visitors to a farm increases the odds of profitability, net of other factors.
(b) Types and number of attractions. The survey collected information on the types of attractions available at the agritourism farm. These attractions were (a) agricultural-related festivals; (b) farm animal display/petting zoo; (c) hayride/maze; (d) pick your own/pumpkin patch; (e) farm markets, stores, and stands; (f) hunting and fishing; (g) trails/hiking/biking/equestrian; (h) dairy/cheese processing; (i) brewery/tap house; (j) on-farm food processing/restaurants/accommodations; (k) vineyard/wine tastings; (l) greenhouse/orchard/Christmas trees; and (m) others. For the analysis, first, each item was dichotomized (yes = 1 and no = 0). Also, a count measure of these items was calculated as the number of attractions available to the enterprise. Both the dichotomized and the count number of attractions were examined separately.
Hypothesis 2.
Overall, the number of attractions increases the odds of farm profitability (through increasing the number of visitors to the farm), net of other factors.
(c) Length of operation. The length of operation was measured in the number of years and was collected by asking, “How long has your agritourism operation been in business?” The response, collected in months, was later converted to the number of years.
Hypothesis 3.
The length of operation increases the odds of profitability of a farm, net of other factors.
(d) Number of staff on the farm. This is the total number of staff (permanent and part-time) employed by a farm in 2020. It is theoretically expected that the number of working hands on the farm enhances the efficiency of delivering products and services to visitors. Due to a highly skewed number of staff (that ranged from 0 to 182), for the analysis, this variable was logged.
Hypothesis 4.
The number of working staff increases the odds of profitability of a farm, net of other factors.
(e) Geographic location of the operation. In the survey, the rural or urban location of the farm/enterprises was collected by asking, “Which would you classify the location of your farm/agritourism business as urban, suburban, or rural? The location was grouped into two categories: (a) rural (coded as 1) vs. (b) urban/suburban (coded as 0).
Hypothesis 5.
A rural location for an agritourism farm reduces the odds of profitability as compared to those in an urban/suburban location, net of other factors.
(f) Season of operation. The seasons of operation were categorized as spring, summer, fall (autumn), and winter. Each season was dummy-coded (1 = yes; 0 = no). Because over 80% of the farms reported that they opened during the spring, summer, and fall seasons, and about 54% of them operated during the winter season, we created a dummy variable measuring whether a farm was open for all the seasons (coded as 1) vs. otherwise (coded as 0). Both each particular and all seasons were separately examined.
Hypothesis 6.
Overall, farm profitability varies by season, net of other factors.
(g) Types of farm enterprises for sale. In the survey, one of the items was, “Do you raise or produce agricultural products (e.g., crops, livestock, and timber) for commercial sale?” A dichotomous measure of yes (coded 1) or no (coded 0) was used in the analysis.
Hypothesis 7.
Overall, a farm that produces crops or raises animals for commercial sale increases the odds of profitability compared to those that do not, net of other factors.
Second, we examined the associations between the second outcome measure—number of visitors to a farm—and the explanatory variables—number of attractions (increase), length of operation (increase), number of staff (increase), rural location (decrease), season of operation (more visitors during the fall season than other seasons), and enterprises for commercial sale (increase).

Analysis

Data exploration and preparation were the first step in the data analysis. We found missing data in a few variables, such as the length of operation (1 missing) and the number of visitors (16 missing), and there were 7 each missing in full-time and part-time employees. These missing numbers, particularly for the number of visitors, were replaced by using the regression-based estimation technique (coefficients estimated based on the number of visitors as the dependent variable and the number of staff, length of operation, and operation during the fall season, which were statistically significantly associated with the dependent variable, were obtained from the reduced model)). Second, descriptive statistics of the measures used in this study were calculated. Third, we explored the bivariate associations between the outcome and independent/explanatory variables. To examine whether these bivariate distributions held true or not, these results were adjusted for other confounders, such as the length of operation, number of staff, season of operation, and number of offerings (due to the small sample size, all the variables assessed in the bivariate models were not included in the multivariate models (e.g., instead of using each attraction, we used the total number of attractions in the full and reduced models)). Both the full and reduced models were estimated. In the full model, all the interest variables presented in this study were simultaneously added to the equation. In the reduced models, the associations were estimated step-wise, removing the least significant (based on the effect size and p-value) variables. Only the statistically significant effects are presented in the reduced model.
The first outcome measure, self-reported profitability (coded as profitable = 1 vs. otherwise = 0), was a dichotomous measure (First, we estimated the ordinal logistic regression. However, the proportional odds assumption was violated when the test of parallel lines was found to be statistically significant (p < 0.001). This suggests that the slope coefficients in the model are not the same across the response categories, which shows that the test for one-equation model was not valid [38]. In addition, we were not confident of the results due to the small sample size). Thus, a binary logistic regression technique was employed to examine the associations between the dependent and independent variables using the following equation.
L o g i t Y = I n P i / ( 1 P i ) = β 0 + β 1 X 1 + + β n X n + ε Or ,   L o g i t Y = I n O d d s = β 0 + β 1 X 1 + + β n X n n + ε
where Logit (Y) = predicted value of the dependent variable (perceived profitability); ln = natural log; Pi = probability of experiencing an event; (1 − Pi) = probability of not experiencing an event; Pi/(1 − Pi) = odds of experiencing an event; β0 = intercept; β1 + … + βn = regression coefficients (logit coefficient); X1 + …+ Xn = independent (or explanatory) variables; and ε = error term. For easy interpretation, the results are presented as odds ratios. For example, for a continuous independent variable, an odds ratio greater than 1 indicates that the odds of a self-reporting profitable enterprise increase when the independent variable increases, while an odds ratio of less than 1 indicates that the odds of self-reporting a profitable enterprise decreases when the independent variable increases [38].
For a categorical independent variable, an odds ratio greater than 1 indicates an increased chance of reporting a profitable enterprise versus not, while an odds ratio of less than 1 indicates a decreased chance of reporting a profitable enterprise [39]. In addition, these odds ratios can also be expressed as a percentage increase or decrease in the dependent variable due to a one-unit change in the independent variable [40], which can be mathematically expressed as:
Percentage change = (eb − 1) × 100; or (Odds ratio − 1) × 100
We further examined which factors are associated with the number of visits to a farm. This was the second dependent variable, which was measured on a ratio scale. Thus, several ordinary least square (OLS) regression models (bivariate, full, and reduced) were estimated to explain the variance in this outcome variable. The equation takes the following form:
Predicted Y′ = β0 + β1X1 + … + βnXn + ε
where Y′ = predicted value of the dependent variable (the number of visitors); β0 = intercept; β1 to βn = regression coefficients (beta coefficients); X1 + … + Xn independent (or explanatory) variables; and ε = error term. For a continuous independent variable, the results are interpreted as a one-year increase in the interest variable increases the response to the dependent variable by given years (β coefficient), net of all other factors. Similarly, for a categorical (dummy) variable, the dependent variable (which is coded as 1) is higher (increases) or lower (decreases) by the unit (β coefficient) compared to the reference category (which is coded as 0), net of other factors.

4. Results and Discussion

4.1. Descriptive Results

The descriptive results of the variables used in the analysis are provided in Table 1.

4.1.1. Outcome Variables

Of the total 67 farms that currently practice agritourism, 35.8% (n = 24) reported that their farm was ‘profitable’, 31.3% (n = 21) reported ‘some profit’, 10 (14.9%) reported ‘breaks even’, and 12 of them (17.9%) reported ‘operates at a loss’. For analytical purposes, this variable was dichotomized as profitable (coded as 1) and otherwise (coded as 0) (Initially, we grouped ‘profitable’ and ‘makes some profit’ into one category and ‘breaks even’ and ‘operates at a loss’ as otherwise, but the variables did not separate from the independent variable as per the theoretical expectation. Thus, we regrouped this variable as explained above). The distribution shows that 35.8% reported as being profitable and the rest, 64.2%, as otherwise (makes some profit, breaks even, and operates at a loss).
For the second dependent variable—the number of visitors to the agritourism farm annually—the farm operators reported that, on average, 27,726 visitors visited the farm annually (with a median of 6000, a minimum of 50, and a maximum of 300,000). Because there was a large variation with skewed distribution, this variable was log-transformed and used in the analysis. This outcome measure, the number of visitors to a farm, was also used as a major explanatory variable to explain profitability.

4.1.2. Explanatory Variables

a. Operator’s age. The survey collected demographic information on age only. The results show that nearly two-thirds (66%) of the agritourism proprietors were over 55 years of age (55–64 years, 30%; 65–74 years, 30%; and 75 years and over, 6%), and only 34.3% were below the age of 55 years (25–34 years, 7.5%; 35–44 years, 10.4%; and 45–54 years, 16.4%). These results are consistent with the state-level findings of the Agriculture Census of Maryland, which reported that most farmers were 55 years old and over. When disaggregated by the self-reported profitability, those who reported a profitable enterprise, slightly over 72%, were over 55 years of age compared to only 54.2% who reported otherwise.
b. Length of operation or establishment. On average, each farm was under operation for about 19 years. However, for those who reported being profitable, the average length of operation was slightly over 25 years compared to only 15 years for those who reported otherwise. This result suggests that farms with a longer establishment history were more profitable.
c. Total number of staff. Each farm had, on average, 25 staff (including both permanent and temporary staff, ranging from 0 to 182 staff). Each farm had, on average, 10 permanent (range of 0–140) and 16 part-time staff (range of 0–150). There were more seasonal (part-time) staff than the permanent staff. The average number of staff greatly varied between those farms that reported being profitable (45) compared to those that reported otherwise (only 15).
d. Seasons of operation. Most farms were operated during the fall (86.6%), summer (85%), and spring (80.6%) seasons. However, nearly 54% of them reported that they also operated during the winter season. Overall, slightly over 52% of the farmers reported that their operation was open throughout the year (all four seasons). Of those who reported profitable farms, nearly 63% of them operated full seasons compared to 47% of those who reported otherwise.
e. Attractions on the agritourism farm. Farmers reported the availability of various attractions or offerings to the visitors to their farms. On average, each farm had slightly over three attractions, with a minimum of zero (two farms reported zero attractions) and a maximum of eight attractions. Farms that reported being profitable had, on average, 3.25 attractions compared to only 2.97 among those that reported otherwise.
The most common attractions reported by 54% of the agritourism farms were a farm market, a store, or a stand. This was followed by a farm animal display or a petting zoo (43.3%), agriculture-related festivals (41.8%), and both hayride/maze and pick your own/pumpkin patch, each with 32.8%. Among the least reported was hunting (1.5%), on-farm food processing or restaurants or accommodations and trails, hiking or biking, or equestrian, with 9% each. Nearly two-thirds of the operators that reported their farm was profitable had a farm market or a stand or a store compared to 48.8% of those that reported otherwise. However, among those farmers that reported having farm animals, displays, or petting zoos, most of them reported otherwise (generates some profit, breaks even, or operates at a loss).
f. Production for commercial sale. Slightly over 76% of the operations reported that they raised or produced agricultural products, such as crops, animals, and timber, for commercial sale. Among the operations that reported their farm was profitable, 91.7% of them raised animals or produced agricultural products for commercial sale, compared to only 67.4% of them that reported otherwise.
g. Geographic location of a farm. Most agritourism operations were located in rural areas. Slightly over 70% of the farmers reported that they were located in rural areas, followed by 25.4% in suburban areas, and only 4.5% were located in urban areas. In rural areas, nearly 75% of the operators reported that their farm was profitable, compared to only 67.4% that reported otherwise. On the other hand, in suburban areas, only 20.8% of them reported being profitable compared to 27.9%, who reported otherwise.
The responding farm operations were scattered across 22 out of 24 counties and equivalents of Maryland. Most of these responding farms were located in Frederick County (17.9%), followed by the Carroll (13.4%), Cecil, and Howard Counties, each with 7.5%. None of the operators that were currently operating an agritourism farm reported being from the Baltimore and Dorchester Counties.

4.1.3. Factors Associated with Self-Reported Profitability

Table 2 provides the bivariate and multivariate associations between the explanatory variables and self-reported profitability. The results are provided as odds ratios (and 95% confidence intervals (CIs)) along with the respective p-values (level of significance). The results are provided as unadjusted results (bivariate results), adjusted results (full model), and adjusted results (reduced model). The adjusted models adjust for other confounders. In both the adjusted models, nearly 81% cases were correctly classified and nearly half (50% and 48%, respectively, for the full and reduced models) of the variation in the dependent variable profitability was explained by the independent variables in the equation. The omnibus tests of model coefficients (model chi-squared value) were statistically significant, implying that these models fit the data.
The odds ratios from the binary logistic regression (Table 2, under the column bivariate results) show that the odds of profitability of the farm increase with the increase in the number of visitors to a farm. For instance, a one unit increase in the number of visitors (logged) statistically significantly increased the likelihood of reporting a profitable farm by 3.43 times (odds ratio = 3.434; p < 0.01; model 0). This result is as expected. However, the statistical significance disappeared when the number of staff was controlled, suggesting a mediating role of the number of employees.
Similarly, as hypothesized, a one unit increase in the total number of staff significantly increased the odds of profitability by 1.047 (logged) points (odds ratio = 1.047, p < 0.05). The magnitude of the effect and the strength of the association further increased (odds ratio = 1.089, p < 0.01) when all other factors were adjusted for (full model). In the reduced model, the association was also statistically significant, suggesting that labor is an essential factor associated with the profitability of a farm.
Another factor that was statistically significantly associated with the reporting of profitability was whether a farm raised or produced agricultural products, such as crops, livestock, and timber, for commercial sale. The farmers that reported that they raised agricultural produce for commercial sale had increased odds of reporting profitability by over 5.3 times (odds ratio = 5.310, p < 0.05). When all other factors were controlled for (full model), the magnitude of the effect increased, but the strength of association disappeared. After removing a few statistically non-significant controls (reduced model), both the magnitude and the strength of association were slightly improved.
The rural location of a farm increased the odds of reporting a profitable farm (odds ratio = 1.448, p > 0.05). But this result is statistically not significant. Interestingly, the magnitude of the effect, as well as the strength of association, were slightly improved in the full and reduced models. Similarly, as expected, each year, an increase in the length of operation increased the profitability of a farm by 5.7% (odds ratio = 1.057, p > 0.05). This result is also statistically not significant. Other factors, such as the proprietor’s age, season of operation, and types and number of attractions, were statistically significantly not associated with the profitability of a farm (both in the bivariate and full models).

4.1.4. Factors Associated with the Number of Visitors to the Farm

The results of the associations between the interest explanatory variables and the number of visitors to the farm (logged) are provided as bivariate and multivariate ordinary least squares regression (OLS) unstandardized β-coefficients (and 95% CIs) along with the respective p-values (Table 3).
As hypothesized, the length of operation of a farm increased the number of visitors. For example, a one-year increase in the length of operation of a farm increased the number of visitors (logged) by 0.021 points (unstandardized β = 0.021, p < 0.01; bivariate model). This result still held true when the effects were adjusted for other controls (full model and reduced model).
Labor availability on a farm is crucial for offering various services and products to visitors. This is one of the significant challenges for many agritourism farms. Our results suggest that an increased amount of labor available to a farm statistically significantly increases the number of visitors to the farm. A one-unit increase in the total number of (permanent and part-time) staff significantly increased the number of visitors by 0.013 units (logged) (unstandardized β = 0.013, p < 0.001; bivariate model). The magnitude of the effect and the strength of association, although having declined, remained even after adjusting for the effects of other factors (unstandardized β = 0.009, p < 0.001, full model; unstandardized β = 0.009, p < 0.01, reduced model). These results suggest that labor is an important factor in attracting more visitors to a farm.
As hypothesized, the number of visitors varied according to the season of operation of the farm. However, the farms that operated during the fall (autumn) season attracted significantly more visitors than other seasons (unstandardized β = 0.759, p < 0.05, full model; unstandardized β = 0.870, p < 0.001, reduced model), adjusting for the effects of other factors. Other seasons were statistically significantly not associated with increasing the number of visitors.
At the bivariate level, agriculture-related festivals, hayride/maze, farm markets and stands, and pick your own/pumpkin patches were statistically significant and positively associated with the number of visitors. However, surprisingly, when the effects of other variables were controlled for, both the types and number of attractions were statistically significantly not associated (full model and reduced model) with the number of visitors. This result is surprising, however. It is interesting to note that hunting and fishing, trails/hiking/biking/equestrian, brewery/tap house, and vineyard/wine tasting were surprisingly negatively associated (although statistically not significant) with the number of visitors. Each offering was expected to increase the number of visitors.
The age of the farm operator was significantly not associated with the number of visitors, although older farmers attracted fewer visitors. Other factors, such as whether an agritourism farmer raised or produced agricultural products (such as crops, livestock, and timber) for commercial sale, were also statistically significantly not associated with the number of visitors.
As hypothesized, farms located in rural areas received significantly fewer visitors than those located in urban and suburban areas. For instance, an agritourism farm located in a rural area received only 0.388 visitors (logged) compared to farms located in urban and suburban areas (unstandardized β = −0.388, p < 0.10; bivariate model). The statistical significance was lost (unstandardized β = −0.218, p > 0.10; full model) when all other confounders, such as the length of operation, number of staff, season, raising or producing agricultural produce for commercial sale, and the number of attractions (full model), were adjusted. Both the magnitude and the strength of the association improved (only 0.288 logged visitors) (unstandardized β = −0.288, p < 0.10; reduced model) in the reduced model.

5. Discussion and Conclusions

Many small and medium farmers are facing challenges while striving to sustain their livelihoods from the farm [41]. These farms are increasingly exploring alternative strategies, including agritourism, to remain competitive in farming [3,42]. More recently, agritourism has been an important source of income for small and medium farmers and has been an important way to generate income and sustain farms.
Our conceptual framework theoretically expected that an agritourism operation generates additional income by attracting visitors through offerings various products and services, including education and recreation. Our findings reveal that the number of farm visitors significantly increases the odds of profitability (odds ratio = 3.434; p < 0.01; model 0) of an operation. Specifically, ref. [37] revealed that four of the three exiting agritourism farms reported that they exited as they could not attract enough customers or make enough sales to survive. However, the magnitude of the association was reduced when other factors, specifically the number of staff, were adjusted. This finding is plausible because the availability of working hands on a farm may increase the provision of quality products and services on the farm, such as direct sales or other educational and recreational services, which, of course, will attract more visitors if they have the capacity and efficiency to manage and attract visitors. Hollas et al. [3] also did not find an independent effect of the number of visits on farm profitability. They suspected that many farms remain open for longer and receive more visitors, but they do not charge the visitors for their experience.
The number of working staff was an essential factor that significantly and independently increased the odds of profitability of an agritourism farm. This measure not only reduced the contribution of the number of visitors to farm profitability but also significantly and positively increased the likelihood of a farm’s profitability (odds ratio = 1.096, p < 0.05, full model; 1.074, p < 0.01, reduced model). This evidence from our analysis reveals that the number of staff mediates the effect of the number of visitors on profitability. Because the availability of staff is crucial for providing quality services on a farm, this evidence is essential for small and medium farms in Maryland, for which it is difficult to find or hire labor to support their farms. Many small, minority, and underserved farmers have reported that finding labor is one of the major challenges that they face [43,44]. Moreover, using labor-saving technologies, such as a tractor, is not a feasible option for the reason of efficiency for the size of their farms.
Other factors, such as the age of the operator, length of operation, season of operation, raising or producing agricultural products for commercial sale, number of attractions, and rural or urban location, were statistically not significantly related to the self-reported profitability of the operation. These results are consistent with the findings of other scholars [16,17,31]. Moreover, the rural–urban location of a farm also did not produce a statistically significant coefficient regarding the reporting of profitability. This result is also consistent with the findings of other researchers [3,17,31]. Perhaps, the operations in rural areas in these study settings are easily accessible to the visitors.
More importantly, the number of visitors significantly increased with the increase in the length of operation and the number of staff, which is plausible. Moreover, opening an operation in the fall season (autumn) also significantly and positively increased the number of visitors. Although the number of attractions or offerings significantly increased the number of visitors, the statistical significance and the magnitude of the effect disappeared after adjusting for the number of employees. This result implies that the number of staff is important in significantly increasing the number of offerings (results not shown), which may increase the number of visitors, resulting in the increase in the profitability of a farm. This finding is important to support the Maryland Department of Agriculture’s (MDA) policy of encouraging Marylanders to support local farmers and rural communities through the visit of their farms that offer agritourism activities [6].
Surprisingly, while the urban location of a farm increased the odds of reporting a profitable farm, although statistically not significant, a farm located in rural areas attracted fewer visitors than those in urban or suburban areas; this could have resulted due to the size of the farm, which we could not control due to the absence of this variable in the data.
Overall, multiple factors directly and indirectly influence the profitability of and the number of visitors to an agritourism farm. However, the ability of a farm to hire employees is one of the important factors determining profitability. The number of staff has both direct and indirect influences, such as increasing the number of offerings or attractions or providing quality services and products to visitors. From a policy perspective, this evidence clearly suggests the need to address the challenge of labor shortage to support small- and medium-sized farms for their sustainability. Moreover, opening an operation during the autumn (fall) season attracts more visitors than opening in other seasons. This raises concerns, and an understanding of the factors contributing to attracting more visitors in the fall season but not in other seasons is necessary, which requires further research.
This study, however, is not free from limitations. First, the data were simply based on a small number of agritourism operators in Maryland. The small number of samples as well as non-response bias may pose a threat to external validity or generalization. Due to time limitations, this information could not be verified through a qualitative approach. Second, the measure of profitability per se is a crude measure of profitability; it is self-reported by operators and is not determined by cost–benefit calculations or another econometric tool. Third, the evidence provided in this paper was based on cross-sectional data. Fourth, the data did not contain other important factors, such as land/farm size, distance to the nearest urban center, gender, education of an operator, information on promotional activities, economic and financial information about the farm, and fee structure of the farm, to mention a few. As reported by other scholars, these measures could be important determinants of farm profitability as well as the number of farm visits. Thus, the conclusions drawn in this paper should be considered carefully. However, future studies considering these limitations and using data collected over a longer period of time (longitudinal, possibly panel data) may generate more conclusive evidence.

Author Contributions

Conceptualization, P.B.B. and L.B.K.; methodology, P.B.B. and K.E.; resources, E.N.E. and M.T.K.; data curation, K.E. and P.B.B.; writing—original draft preparation, P.B.B.; writing—review and editing, P.B.B., L.B.K. and N.N.A.; project administration and supervision, K.E., E.N.E. and M.T.K. All authors have read and agreed to the published version of the manuscript.

Funding

Renewable Resources Extension Act (RREA), National Institute of Food and Agriculture (NIFA), United States Department of Agriculture (USDA) (Fed FY 2022 Award Number: NI22RREAFXXXG015; Fed FY 2023: NI23RREAFXXXG031).

Institutional Review Board Statement

Not applicable.

Informed Consent Statement

Not applicable.

Data Availability Statement

The data presented in this study are available on request from the corresponding author.

Acknowledgments

We owe special gratitude to the participating agritourism operators who shared their invaluable experiences, opinions, and thoughts and devoted countless hours responding to our survey questions.

Conflicts of Interest

The authors declare no conflicts of interest.

References

  1. Bowen, R.L.; Cox, L.J.; Fox, M. The interface between tourism and agriculture. J. Tour. Stud. 1991, 2, 43–54. [Google Scholar]
  2. Chase, L.; Stewart, M.; Schilling, B.; Smith, B.; Walk, M. Agritourism: Toward a Conceptual Framework for Industry Analysis. J. Agric. Food Syst. Community Dev. 2018, 8, 13–19. [Google Scholar] [CrossRef]
  3. Hollas, C.R.; Chase, L.; Conner, D.; Dickes, L.; Lamie, R.D.; Schmidt, C.; Singh-Knights, D.; Quella, L. Factors Related to Profitability of Agritourism in the United States: Results from a National Survey of Operators. Sustainability 2021, 13, 13334. [Google Scholar] [CrossRef]
  4. McGehee, N.G.; Kim, K.; Jennings, G.R. Gender and motivation for agri-tourism entrepreneurship. Tour. Manag. 2007, 28, 280–289. [Google Scholar] [CrossRef]
  5. Nickerson, N.P.; Black, R.J.; McCool, S.F. Agritourism: Motivations behind Farm/Ranch Business Diversification. J. Travel Res. 2001, 40, 19–26. [Google Scholar] [CrossRef]
  6. Maryland Department of Agriculture. Fall Agritourism Activities Happening on Farms around the State. 2019. Available online: https://news.maryland.gov/mda/press-release/2019/10/11/fall-agritourism-activities-happening-on-farms-around-the-state/ (accessed on 9 June 2023).
  7. Tew, C.; Barbieri, C. The perceived benefits of agritourism: The provider’s perspective. Tour. Manag. 2012, 33, 215–224. [Google Scholar] [CrossRef]
  8. National Agricultural Statistics Service. Census of Agriculture; NASS, US Department of Agriculture: Washington, DC, USA, 2017.
  9. National Agricultural Statistics Service. Agricultural Statistics; United States Department of Agriculture: Washington, DC, USA, 2010.
  10. Barbieri, C. A comparison of agritourism and other farm entrepreneurs: Implications for future tourism and sociological research on agritourism. In Proceedings of the 2008 Northeastern Recreation Research Symposium; Klenosky, D.B., Fisher, C.L., Eds.; U.S. Department of Agriculture, Forest Service, Northern Research Station: Newtown Square, PA, USA, 2009. [Google Scholar]
  11. Barbieri, C.; Mahoney, E.; Butler, L. Understanding the Nature and Extent of Farm and Ranch Diversification in North America. Rural Sociol. 2008, 73, 205–229. [Google Scholar] [CrossRef]
  12. Brandth, B.; Haugen, M.S. Gendered Work in Family Farm Tourism. J. Comp. Fam. Stud. 2007, 38, 379–394. [Google Scholar] [CrossRef]
  13. Brandth, B.; Haugen, M.S. Farm diversification into tourism—Implications for social identity? J. Rural Stud. 2011, 27, 35–44. [Google Scholar] [CrossRef]
  14. Veeck, G.; Che, D.; Veeck, A. America’s Changing Farmscape: A Study of Agricultural Tourism in Michigan. Prof. Geogr. 2006, 58, 235–248. [Google Scholar] [CrossRef]
  15. Chase, L.; Wang, W.; Bartlett, R.; Conner, D.; Hollas, C.; Quella, L. Agritourism and On-Farm Direct Sales Survey: Results for the U.S.A Survey Report. 2021. Available online: https://www.uvm.edu/sites/default/files/Vermont-Agritourism-Collaborative/US_Survey_Report.pdf (accessed on 19 July 2023).
  16. Jin, X.; Wang, L.; Zhang, Z.; Yan, J. Factors Affecting the Income of Agritourism Operations: Evidence from an Eastern Chinese County. Sustainability 2022, 14, 8918. [Google Scholar] [CrossRef]
  17. Lucha, C.; Ferreira, G.; Walker, M.; Groover, G. Profitability of Virginia’s Agritourism Industry: A Regression Analysis. Agric. Resour. Econom. Rev. 2016, 45, 173–207. [Google Scholar] [CrossRef]
  18. Ejiogu, K.; Escobar, E.; Kairo, M.T. Maryland Agritourism Report; UMES Extension; School of Agricultural and Natural Sciences, University of Maryland Eastern Shore: Princess Anne, MD, USA, 2023. [Google Scholar]
  19. Abelló, F.J.; Palma, M.A.; Waller, M.L.; Anderson, D.P. Evaluating the Factors Influencing the Number of Visits to Farmers’ Markets. J. Food Prod. Mark. 2014, 20, 17–35. [Google Scholar] [CrossRef]
  20. Wolf, M.M.; Spittler, A.; Ahern, J.; Wolf, M.M.; Spittler, A.; Ahern, J. A Profile of Farmers’ Market Consumers and the Perceived Advantages of Produce Sold at Farmers’ Markets. J. Food Distrib. Res. 2005, 36, 192–201. [Google Scholar] [CrossRef]
  21. Brown, C. Consumers’ preferences for locally produced food: A study in southeast Missouri. Am. J. Altern. Agric. 2003, 18, 213–224. [Google Scholar] [CrossRef]
  22. Lamie, R.; Chase, L.; Chiodo, E.; Dickes, L.; Flanigan, S.; Schmidt, C.; Streifeneder, T. Agritourism around the globe: Definitions, authenticity, and potential controversy. J. Agric. Food Syst. Community Dev. 2021, 10, 573–577. [Google Scholar] [CrossRef]
  23. Chase, L.; Grubinger, V. Food, Farms, and Community: Exploring Food Systems. Lebanon, New Hampshire: University Press of New England; University Press of New England: Lebanon, NH, USA, 2014. [Google Scholar]
  24. Barbieri, C.; Xu, S.; Gil-Arroyo, C.; Rich, S.R. Agritourism, Farm Visit, or … ? A Branding Assessment for Recreation on Farms. J. Travel Res. 2016, 55, 1094–1108. [Google Scholar] [CrossRef]
  25. Phillip, S.; Hunter, C.; Blackstock, K. A typology for defining agritourism. Tour. Manag. 2010, 31, 754–758. [Google Scholar] [CrossRef]
  26. Schilling, B.; Sullivan, K.; Komar, S. Examining the Economic Benefits of Agritourism: The Case of New Jersey. J. Agric. Food Syst. Community Dev. 2021, 3, 199–214. [Google Scholar] [CrossRef]
  27. Streifeneder, T. Agriculture first: Assessing European policies and scientific typologies to define authentic agritourism and differentiate it from countryside tourism. Tour. Manag. Perspect. 2016, 20, 251–264. [Google Scholar] [CrossRef]
  28. The National Agricultural Law Center Agritourism—An Overview. n.d. Available online: https://nationalaglawcenter.org/overview/agritourism/#:~:text=Importance%20of%20Agritourism&text=Agritourism%20gives%20producers%20an%20opportunity,the%20length%20of%20their%20stay (accessed on 16 July 2023).
  29. Arroyo, C.; Barbieri, C.; Rozier Rich, S. Defining agritourism: A comparative study of stakeholders’ perceptions in Missouri and North Carolina. Tour. Manag. 2013, 37, 39–47. [Google Scholar] [CrossRef]
  30. Flanigan, S.; Blackstock, K.; Hunter, C. Generating public and private benefits through understanding what drives different types of agritourism. J. Rural Stud. 2015, 41, 129–141. [Google Scholar] [CrossRef]
  31. Barbieri, C.; Mshenga, P.M. The Role of the Firm and Owner Characteristics on the Performance of Agritourism Farms. Sociol. Rural. 2008, 48, 166–183. [Google Scholar] [CrossRef]
  32. Quisumbing, A.R. Male-female differences in agricultural productivity: Methodological issues and empirical evidence. World Dev. 1996, 24, 1579–1595. [Google Scholar] [CrossRef]
  33. Tauer, L.W. Productivity of Farmers at Various Ages. North Cent. J. Agric. Econ. 1984, 6, 81. [Google Scholar] [CrossRef]
  34. De Janvry, A. The Agrarian Question and Reformism in Latin America; Johns Hopkins University Press: Baltimore, MD, USA, 1981. [Google Scholar]
  35. Findley, S.E. Rural Development and Migration: A Study of Family Choices in the Philippines; West View Press: Boulder, CO, USA, 1987. [Google Scholar]
  36. Maryland State Archives. Maryland Manual on-line: A guide to Maryland & Its Government. Annapolis, MD. 8 May 2023. Available online: https://msa.maryland.gov/msa/mdmanual/01glance/html/agri.html (accessed on 31 May 2023).
  37. Ejiogu, K. Maryland Agritourism at a Glance: 2022 Update; UMES Extension; University of Maryland Eastern Shore: Princess Anne, MD, USA, 2022; Unpublished. [Google Scholar]
  38. Harrell, F.E. Ordinal Logistic Regression. In Regression Modeling Strategies; Springer Series in Statistics; Springer International Publishing: Cham, Switzerland, 2015; pp. 311–325. ISBN 978-3-319-19424-0. Available online: http://link.springer.com/10.1007/978-3-319-19425-7_13 (accessed on 1 August 2023).
  39. Menard, S. Applied Logistic Regression Analysis; Sage Publications, International Educational and Professional Publisher: Thousand Oaks, CA, USA, 1995. [Google Scholar]
  40. Pampel, F.C. Logistic Regression: A Primer; Sage Publications, International Educational and Professional Publisher: Thousand Oaks, CA, USA, 2000. [Google Scholar]
  41. Goodwin, J.; Gouldthorpe, J. Small Farmers, Big Challenges: A Needs Assessment of Florida Small-Scale Farmers’ Production Challenges and Training Needs. J. Rural. Soc. Sci. 2013, 28, 3. [Google Scholar]
  42. McGehee, N.G.; Kim, K. Motivation for Agri-Tourism Entrepreneurship. J. Travel Res. 2004, 43, 161–170. [Google Scholar] [CrossRef]
  43. Dill, S.; Shear, H.; Beale, B.; Hanson, H. Maryland Beginning Farmer Needs Assessment. In Beginning Farmer Success; University of Maryland Extension: College Park, MD, USA, 2012. [Google Scholar]
  44. Karki, L.B.; Escobar, E.N. Farmer’s Needs Assessment in Agriculture; A Case of Maryland. Study Report; UMES Extension; University of Maryland Eastern Shore: Princess Anne, MD, USA, 2022. [Google Scholar]
Figure 1. The conceptual framework.
Sustainability 16 01025 g001
Table 1. Descriptive statistics of the variables used.
VariablesTotal
(n = 67)
Profitability
Profitable
(n = 24)
Otherwise (n = 43)
Mean/%SDMean/%SDMean/%SD
A. Dependent Variables
i. Self-reported profitability100.0%-35.8%-64.2%-
ii. Number of visitors annually27,72650,69753,10170,73213,56226,940
iii. Number of visitors (logged)3.850.794.250.773.620.71
B. Independent Variables
Demographic Characteristics
a. Farm/agritourism proprietor’s age
    • Below 55 years of age
    • 55 years and over

34.3%
65.7%

45.8%
54.2%

27.9%
72.1%
Firmographic Characteristics
 b. Length of operation (years)

18.68

14.85

25.04

18.23

15.12

11.33
 c. Total number of staff (permanent plus temporary)25.4532.2445.0246.3614.5210.74
 d. Season of operation: Spring (yes = 1)
Otherwise = 0
80.6%
19.4%
-83.3%
16.7%
-79.1%
20.9%
-
  Summer (yes = 1)85.0%-91.7%-81.4%-
  Fall (Autumn) (yes = 1) 86.6%-91.7%-83.7%-
  Winter (yes = 1) 53.7%-62.5%-48.8%-
 e. All seasons (yes = 1)52.2%-62.5%-46.5%-
 f. Attractions or offerings
      • Farm markets, stores/stands
53.7%-62.5%-48.8%-
      • Farm animal display/petting zoo
43.3%-37.5%-46.5%-
      • Agricultural-related festivals
41.8%-45.8%-41.9%-
      • Hayride/maze
32.8%-37.5%-30.2%-
      • Pick your own/pumpkin patch.
32.8%-33.3%-34.9%-
      • Vineyard/wine tastings
32.8%-33.3%-32.6%-
      • Greenhouse/orchard/Christmas trees
16.4%-20.8%-16.3%-
      • Brewery/tap house
13.4%-16.7%-14.0%-
      • Dairy/cheese processing
10.4%-12.5%-9.3%-
      • Trails/hiking/biking/equestrian
9.0%-8.3%-9.3%-
      • On-farm food processing/restaurants/accommodations
9.0%-16.7%-11.6%-
      • Hunting/fishing
1.5%-0.0%-2.3%-
 g. Number of attractions3.071.713.251.782.971.68
 h. Raises or produces agricultural products (e.g., crops, livestock, and timber) for commercial sale (yes = 1)76.1%-91.7%-67.4%-
Geographic Characteristics
 i. Rural/urban location: Urban area4.5%-4.2%-4.7%-
    Suburban area25.4%-20.8%-27.9%-
    Rural area70.1%-75.0%-67.4%-
Data source: Field Survey, 2022.
Table 2. Odds ratio estimates to examine the associations between self-reported profitability and explanatory variables (n = 67).
VariablesModel 0: Bivariate Results
(Unadjusted Results)
Full Model (Fully Adjusted Results)Reduced Model (Adjusted Results)
Odds Ratios95% CIOdds Ratios95% CIOdds Ratios95% CI
Firmographic Characteristics
a. Number of visitors (logged)3.434 **1.522–7.7460.8910.246–3.224--
b. Length of operation (years)1.0571.010–1.0861.0230.972–1.077--
c. Number of staff (perm. and temporary)1.047 *1.010–1.0801.096 *1.017–1.1811.074 **1.025–1.125
d. Season of operation
    • Spring (yes = 1)
1.3240.360–4.861----
    • Summer (yes = 1)
2.5140.488–12.945----
    • Fall (Autumn) (yes = 1)
2.1390.407–11.233----
    • Winter (yes = 1)
1.7460.630–4.842----
    • All seasons (yes = 1)
1.9170.691–5.3202.8300.641–12.496--
e. Raises or produces agricultural products (e.g., crops, livestock, and timber) for commercial sale (yes = 1)5.310 *1.092–25.8295.7910.580–57.8667.403 +0.880–62.302
f. Attractions
    • Agricultural-related festivals
1.1750.430–3.213----
    • Farm animal display/petting zoo
0.6900.249–1.915----
    • Hayride/maze
1.3850.484–3.964----
    • Pick your own/pumpkin patch
0.9330.325–2.681----
    • Farm markets, stores/stand
1.7460.630–4.842----
    • Hunting/fishing
0.0000.000----
    • Trails/hiking/biking/equestrian
0.8860.150–5.235----
    • Dairy/cheese processing
1.3930.285–6.818----
    • Brewery/tap house
1.2330.311–4.888----
    • On-farm food processing/restaurants/accommodations
1.5200.367–6.300----
    • Vineyard/wine tastings
1.3530.378–4.844----
    • Greenhouse/orchard/Christmas trees
0.9940.291–3.398----
g. Number of attractions1.0770.816–1.4220.7910.503–1.244--
Demographic Characteristics
h. Farm/agritourism proprietor’s age
    • Below 55 years of age
    • 55 years and over

1.0
0.457

-
0.161–1.299

1.0
1.339

-
0.345–5.204


-


-
Geographic Characteristics
i. Rural or urban location of the farm
    • Suburban and urban area (Ref.)
    • Rural area

1.01.448

-
0.471–4.451

1.0
2.821

-
0.543–14.665

1.0
3.946 +


0.857–18.172
Intercept
Model chi-squared value
Degrees of freedom
p
−2 Log likelihood
Nagelkerke R-squared value
Classification (correctly classified)
0.009
30.532
8
<0.001
56.887
0.502
83.6%
0.008
26.416
3
<0.001
61.003
0.447
80.6%
Data source: Field Survey, 2022. + p < 0.10, * p < 0.05, ** p < 0.01; 95% confidence intervals (CIs) are also presented.
Table 3. Ordinary least squares regression estimate used to examine the associations between the number of farm visits and the explanatory variables (n = 67).
VariablesBivariate Results
(Unadjusted Results)
Full Model
(Adjusted Results)
Reduced Model
(Adjusted Results)
Unstandardized β95% CIUnstandardized β95% CIUnstandardized β95% CI
Firmographic Characteristics
a. Length of operation (years)0.021 ***0.009–0.0330.011 *0.004–0.0270.016 **0.006–0.027
b. Number of staff (perm. and temporary)0.013 ***0.008–0.0180.009 ***0.004–0.0140.009 ***0.006–0.027
c. Season of operation
    • Spring (yes = 1)
0.023−0.348 to 0.3930.007−0.295 to 0.309--
    • Summer (yes = 1)
0.575 *0.051 to 1.0990.132−0.487 to 0.751--
    • Fall (Autumn) (yes = 1)
0.800 **0.268 to 1.3320.759 *0.100 to 1.4170.870 ***0.452–1.287
    • Winter (yes = 1)
0.414 *0.039 to 0.7880.055−0.282 to 0.392--
    • All seasons (yes = 1)
0.385 *0.010 to 0.761----
d. Raises or produces agricultural products (e.g., crops, livestock, and timber) for commercial sale (yes = 1)0.410 +−0.033 to 0.8520.145−0.212 to 0.502--
e. Attractions
    • Agricultural-related festivals
0.537 **0.169–0.904----
    • Farm animal display/petting zoo
0.178−0.210 to 0.566----
    • Hayride/maze
0.362 +−0.041–0.764----
    • Pick your own/pumpkin patch
0.458 *0.066–0.849----
    • Farm markets, stores/stand
0.380 *0.003–0.757----
    • Hunting/fishing
−1.569 *−3.117 to −0.020----
    • Trails/hiking/biking/equestrian
−0.649 +−1.308 to 0.009----
    • Dairy/cheese processing
0.515−0.105 to 1.135----
    • Brewery/tap house
0.028−0.515 to 0.571----
    • On-farm food processing
      /restaurants/accommodations
0.442−0.115 to 0.999----
    • Vineyard/wine tastings
−0.205−0.614 to 0.204----
    • Greenhouse/orchard/Christmas trees
0.063−0.441 to 0.568----
f. Number of attractions0.143 **0.041–0.2460.012−0.088 to 0.111--
Demographic Characteristics
g. Farm/agritourism proprietor’s age
    • Below 55 years of age (Ref.)
    • 55 years and over

-
−0.115

-
−0.518 to 0.287

-
−0.159

-
−0.486 to 0.167


-


-
Geographic Characteristics
h. Rural or urban location of the farm
    • Suburban and urban areas (Ref.)
    • Rural area

-
−0.388 +

-
−0.800 to −0.024

-
−0.218

-
−0.575 to 0.139

-
−0.288 +

-
−0.600 to −0.024
Intercept
Regression sum of the square
The residual sum of the square
Residual degrees of freedom
p
Adjusted R-squared value
2.584 ***
21.287
19.632
56
<0.001
0.435
2.749 ***
20.583
20.336
62
<0.001
0.471
Data source: Field Survey, 2022. + p < 0.10, * p < 0.05, ** p < 0.01, and *** p < 0.001; 95% confidence intervals (CIs) are also presented.
Disclaimer/Publisher’s Note: The statements, opinions and data contained in all publications are solely those of the individual author(s) and contributor(s) and not of MDPI and/or the editor(s). MDPI and/or the editor(s) disclaim responsibility for any injury to people or property resulting from any ideas, methods, instructions or products referred to in the content.

