Article

Improving Mining Sustainability and Safety by Monitoring Precursors of Catastrophic Failures in Loaded Granite: An Experimental Study of Acoustic Emission and Electromagnetic Radiation

1
School of Safety Engineering, China University of Mining and Technology, Xuzhou 221116, China
2
Key Laboratory of Safety and High–Efficiency Coal Mining, Anhui University of Science and Technology, Huainan 232001, China
3
College of Energy and Mining Engineering, Shandong University of Science and Technology, Qingdao 266590, China
*
Authors to whom correspondence should be addressed.
Sustainability 2024, 16(3), 1045; https://doi.org/10.3390/su16031045
Submission received: 27 December 2023 / Revised: 11 January 2024 / Accepted: 18 January 2024 / Published: 25 January 2024
(This article belongs to the Section Hazards and Sustainability)

Abstract

:
Effective monitoring and early warning methods are crucial for enhancing safety and sustainability in deep coal resource extraction, particularly in mitigating rock burst disasters triggered by abrupt rock failure under high–ground–stress conditions. This paper presents the results of experimental investigations that involved conventional uniaxial direct and graded mechanical tests on granite that concurrently collected acoustic emission (AE) and electromagnetic radiation (EMR) signals. This study focused on the temporal evolution patterns of characteristic parameters in AE and EMR signals during granite deformation and fracture processes. To deconstruct and understand these temporal evolution characteristics, multifractal and critical slowing–down theories are introduced. The research findings reveal significant correlations between the evolution of AE and EMR characteristic parameters and the stages of rock deformation and fracture. Notably, dynamic changes in multifractal parameters (Δα and Δf) quantitatively reflected the deformation and fracture processes, with abrupt increases in Δα and sudden decreases in Δf closely associated with large–scale rock fractures. The temporal continuity of critical slowing–down parameters (variance and autocorrelation coefficient) demonstrated increased sensitivity as rock destruction approaches, with the variance emerging as a crucial indicator for large–scale fractures. This study observed a sudden increase in the variance of AE and EMR signals when the stress level reached 80–90% of the peak stress. Joint monitoring through diverse methods and multiple indicators enhanced the effectiveness of rock burst disaster warnings, contributing to the safety and sustainability of coal resource extraction. Further refinement and exploration of these indicators offer promising avenues for advancing rock failure monitoring and early warning capabilities in coal mines.

1. Introduction

As shallow coal resources continue to deplete, the inexorable trend in contemporary coal mining is the pursuit of resources at greater depths. Deep mines operate within a mechanical environment characterized by high ground stress, and under the influence of various stress pathways during activities, such as mining, excavation, and blasting, the abrupt failure of tunnel-surrounding rock is prone to induce rock burst disasters. Abundant research findings indicate that the genesis and development of rock burst disasters are often accompanied by the release of energy, encompassing forms such as elastic deformation energy, AE, and EMR [1,2,3,4,5,6,7]. Signals, including acoustic and electromagnetic radiation, contain rich information about rock fractures. Thoroughly interpreting AE and EMR signals is of paramount theoretical and practical significance to elucidate the mechanisms, evolution processes, and predictions of coal rock dynamic disasters.
AE is the phenomenon where materials release stored energy in the form of elastic waves when experiencing localized fractures. Since the discovery of the Kaiser effect by the German scientist Kaiser in the 1940s [8], AE technology has gradually found application in the laboratory study of deformation and fracture in coal–rock materials, as well as in monitoring rock burst disasters in engineering contexts. Previous research showed that parameters such as AE counts and energy can effectively reflect the gradual failure process of rocks [9,10,11], determine the evolution law of rock damage and fracture mechanism, and thus, achieve the identification of rock mass instability precursor information and disaster prediction and warning [12]. Liu et al. [13,14,15] performed continuous AE monitoring during the deformation and failure of coal and rock masses subjected to both uniaxial and triaxial compression conditions. They subsequently applied fractal theory to calculate the fractal dimension of the AE data collected concurrently. The calculation results indicate that the fractal dimension of the rock shows a significant decrease trend when it approaches failure, and the reduction of the fractal dimension value beyond a certain critical value can be used as precursor information for failure. Meng et al. [16] conducted granite shear failure tests using AE monitoring technology in an indoor laboratory and AE b–values to predict the stress drop and structural plane failure caused by the stress drop. When stick–slip motion occurs, the b–value will decrease, and a small b–value means an increase in large fractures, which is highly correlated with the probability of rock burst occurrence. Li et al. [17] studied the mechanical behavior, energy dissipation law, and AE signal characteristics, and conducted a multifractal analysis of AE signals.
Coal and rock EMR signals refer to the phenomenon of coal rock deformation and damage radiating electromagnetic waves outward. As early as 1953, Soviet scholars discovered through experimental research the phenomenon of radiating electrical signals outward from gneiss, granite, and quartzite samples under pressure. In the 1990s, Frid V et al. [18] of the former Soviet Union found that the deformation and failure of coal and rock materials can also radiate electromagnetic waves, and successively carried out research on EMR technology to predict coal mine dynamic disasters, such as rock burst. During the same period, Chinese scholar Wang et al. [19] took the lead in conducting research on the EMR effects of materials such as coal, rock, and concrete in China, and proposed the use of EMR to predict coal rock dynamic disasters [20]. Subsequently, numerous scholars conducted continuous research on the theory and on–site application of EMR from coal and rock. Li et al. [21] conducted uniaxial compression tests on three types of rock samples and found that EMR phenomena can be observed in both piezoelectric and non–piezoelectric materials. However, electromagnetic anomalies can only be observed when the stress suddenly drops, and the EMR energy rate increases with the increase in stress drop; Wei et al. [22] found that the EMR intensity is influenced by crack propagation during the loading process of rocks, and the main frequency of the signal undergoes high-frequency and low-frequency transitions; Yin et al. [23] investigated the time–frequency evolution and generation mechanisms of EMR within experimental coal friction conditions. The results show that the friction energy of coal generates electromagnetic signals, and as the friction side pressure increases, the electromagnetic signals gradually increase and have obvious phased characteristics; Li et al. [24] studied the EMR data before the occurrence of coal mine rock burst, indicating that the overall EMR intensity showed an initial increase followed by a subsequent decrease.
In AE–EMR experiments on rock loading, EMR and AE signals typically arise from the deformation and fracture processes of rocks, which manifest as pulsatile occurrences. AE is a direct result of stress adjustments inside the rock, leading to dislocations and microcracks. On the other hand, EMR involves various microscopic mechanisms, including piezoelectric effects, frictional electric effects, electrodynamic effects, and charge separation [21,22,23,24]. Therefore, researchers endeavor to explore the intrinsic relationship between EMR signals and rock deformation and fracture by analyzing the synchronicity of these two signal types [25,26,27]. As of now, there is no consensus on whether these two signals are synchronous. Furthermore, reliance on a single geophysical monitoring method for coal–rock often leads to false disaster alarms or omissions due to the influence of production environments and the monitoring accuracy of the instruments themselves. This limitation hinders the precise monitoring and early warning of premonitory signs of coal mine disasters. The imperative to address this challenge lies in seeking multiple monitoring methods and establishing integrated warning approaches to ensure the safety and efficiency of coal mining operations.
Granite, which is often present as a hard and thick layer in the roof of coal mines, experiences complex loading conditions during coal seam extraction. Beyond the straightforward deformation and failure caused by a singular load increase, the process of constant stress readjustment and incremental loading accompanies the mining of the coal seam, exerting a crucial influence on the occurrence of rock burst. Recognizing this, this study conducted mechanical experiments on granite under two stress pathways: uniaxial loading and graded axial loading. Simultaneously, AE and EMR signals were collected to investigate the response patterns and synchronicity characteristics of AE-EMR signals during the deformation and fracture processes of granite. Multifractal and critical slowing–down theories were introduced to further deconstruct the time–series characteristics of the AE and EMR signals to analyze the evolution patterns of multifractal and critical slowing–down parameters during the loading process of granite and to reveal the nonlinear response characteristics of acoustic–electromagnetic signals. The findings of this research can serve as a foundation and guidance for predicting and forecasting rock burst disasters in the process of deep coal mining.

2. Sample Preparation and Experimental Scheme

2.1. Sample Preparation

Utilizing granite sourced from the roof strata of a coal mine in Shaanxi Province, China, with a density of 2850 kg/m3 and a longitudinal wave velocity of 5.0 km/s, experimental specimens were fabricated in accordance with the standards set by the International Society for Rock Mechanics. The granite was processed into standardized specimens with a diameter of 50 mm and a height of 100 mm, ensuring that deviations in parallelism and perpendicularity were controlled to within ±0.2 mm. To mitigate the impact of natural variations in rock specimens on experimental outcomes, samples devoid of conspicuous surface defects were selected for testing. A total of 7 granite standard cylindrical specimens, which were numbered G1–G7, were prepared for the experiment. Before the start of the experiment, their wave velocities were tested. Among them, the wave velocities of specimen G6 were significantly lower than those of other specimens, and thus, G6 was not utilized further. The prepared granite specimens are shown in Figure 1.

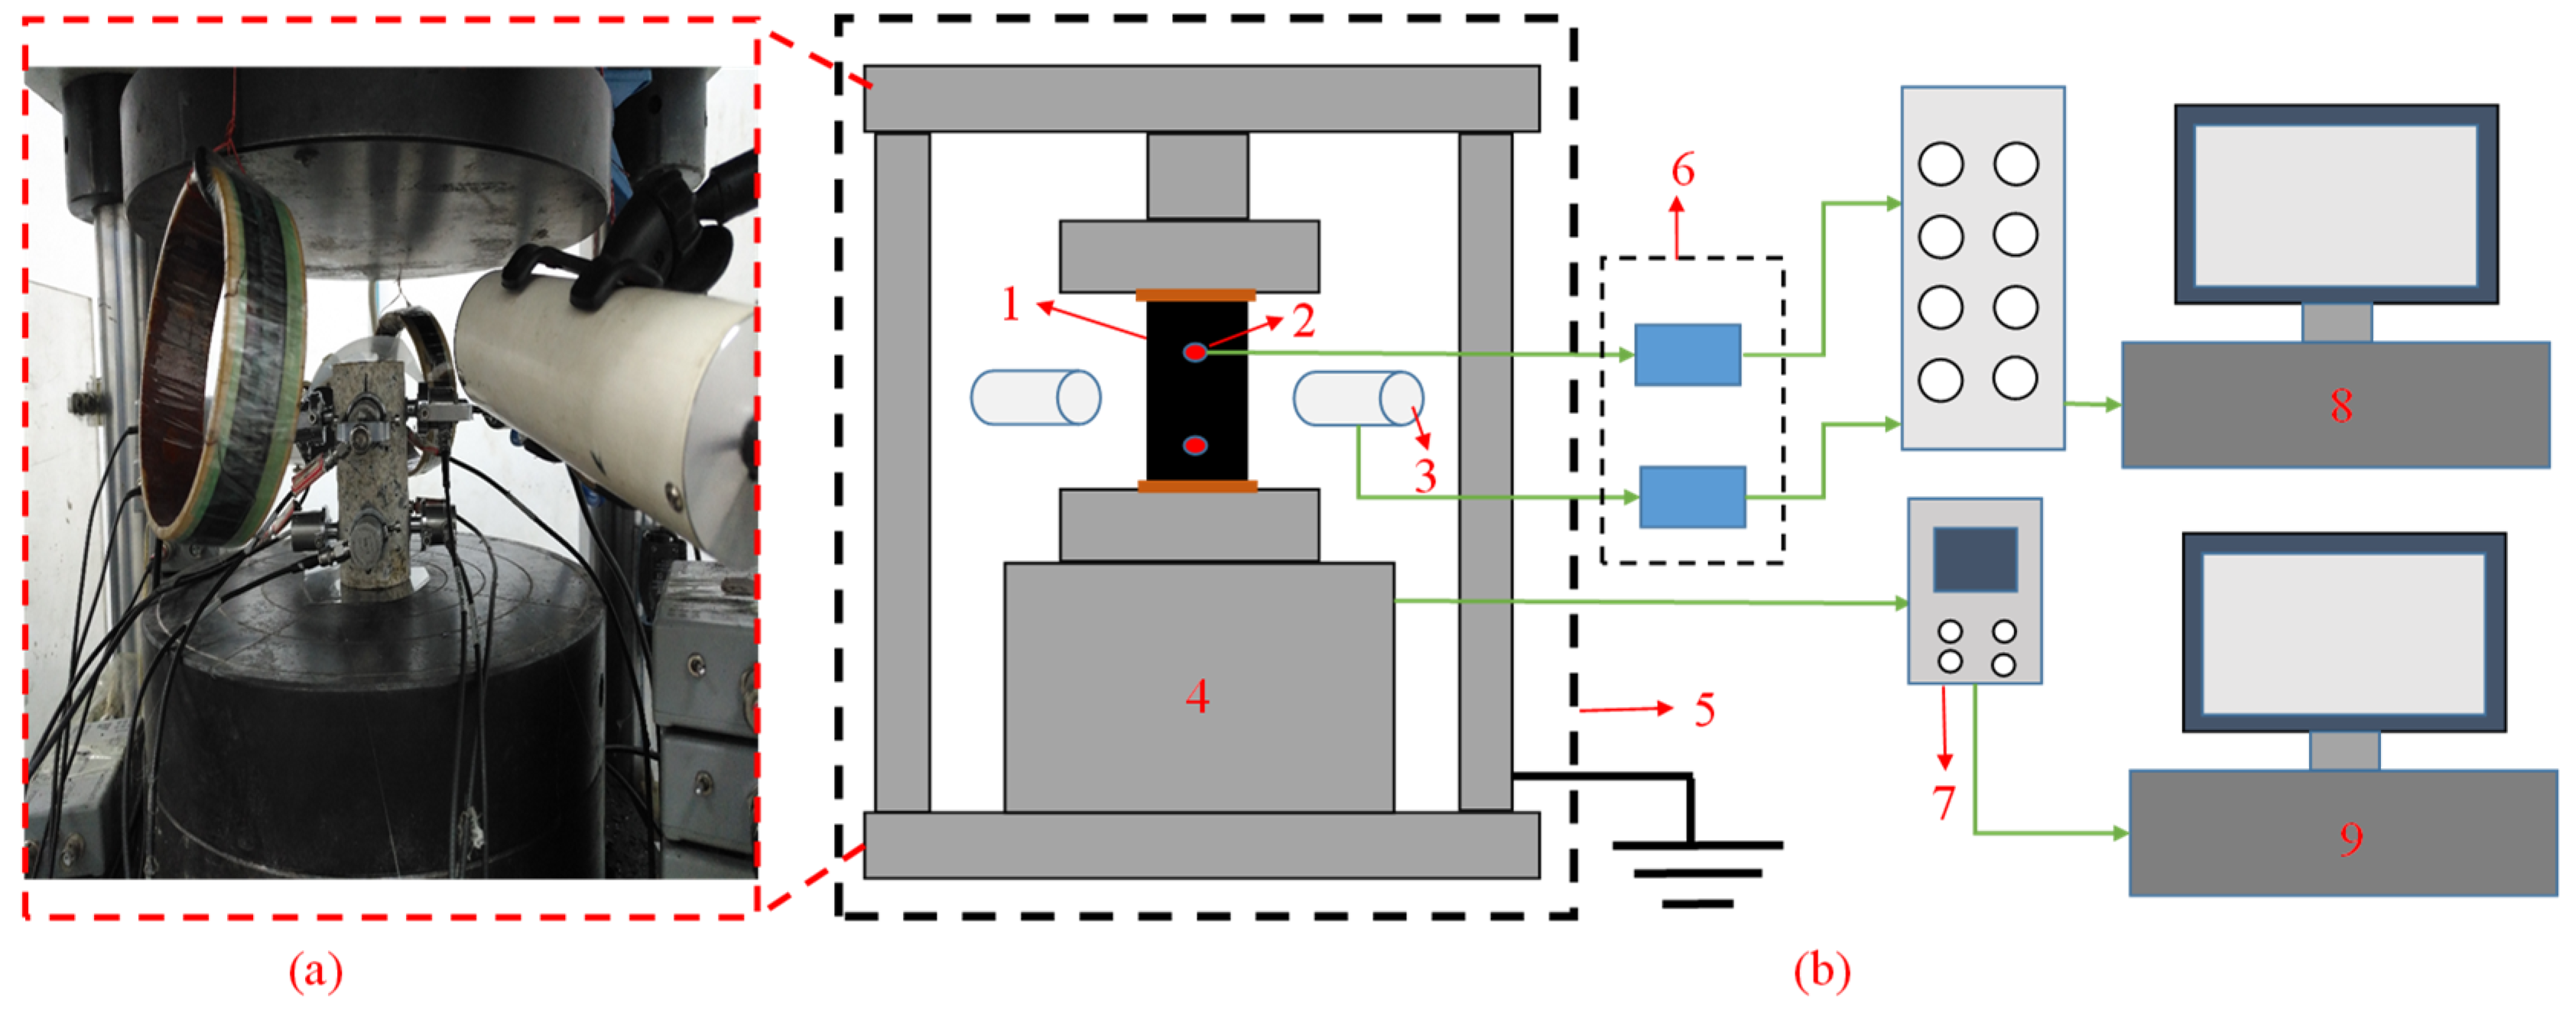
2.2. Experimental System and Scheme

The experimental system comprised a loading system, an AE signal acquisition system, and an EMR signal acquisition system. The loading system consisted of a YAW4306 servo–controlled compression testing machine, a DCS controller, and the PowerTest V3.3 control program. Figure 2 illustrates the schematic diagram of the experimental setup. The YAW4306 compression testing machine can conduct experiments using either stress control or displacement control. It has a maximum load capacity of 3000 kN, a loading speed ranging from 100 to 60,000 N/s, and an accuracy of 1%. This machine is suitable for uniaxial compression or tension, cyclic loading, and creep testing. The experiment employed two loading methods: uniaxial direct loading and uniaxial graded loading. In the first method, the specimens G1, G2, and G3 were directly loaded to failure at a rate of 200 N/s. In the second method, the specimens G4, G5, and G7 were also directly loaded at a loading rate of 200 N/s, where a force hold of 60 s occurred every 20 kN of loading, followed by additional loading until failure.
The AE signals were collected and stored using the Nona 30 AE probe in conjunction with the Express–8 24–channel AE monitoring system from the American Physical Acoustics Company. The AE acquisition parameters, including the threshold, sampling rate, and signal amplification factor, were set at 45 dB, 2 × 10⁶/s, and 40 dB, respectively. The EMR signals were captured using the EMR coils in coordination with the AE monitoring system, with the central frequency of the EMR antenna set at 100 kHz. The EMR acquisition parameters, including the threshold, sampling rate, and signal amplification component, were configured at 45 dB, 2 × 10⁶/s, and 60 dB, respectively. The experiments were conducted in an AFGP–II highly shielded chamber, where the indoor cables underwent shielding to minimize interference from other electromagnetic radiation in the natural environment. Insulating paper was placed between the sample and the press during testing. The EMR antenna was horizontally positioned at a distance of 15 cm from the sample, ensuring complete reception of the EMR signals generated during the deformation and fracture processes of the rock. The press and the acoustic–electromagnetic monitoring were initiated simultaneously and concluded upon the failure of the specimen.

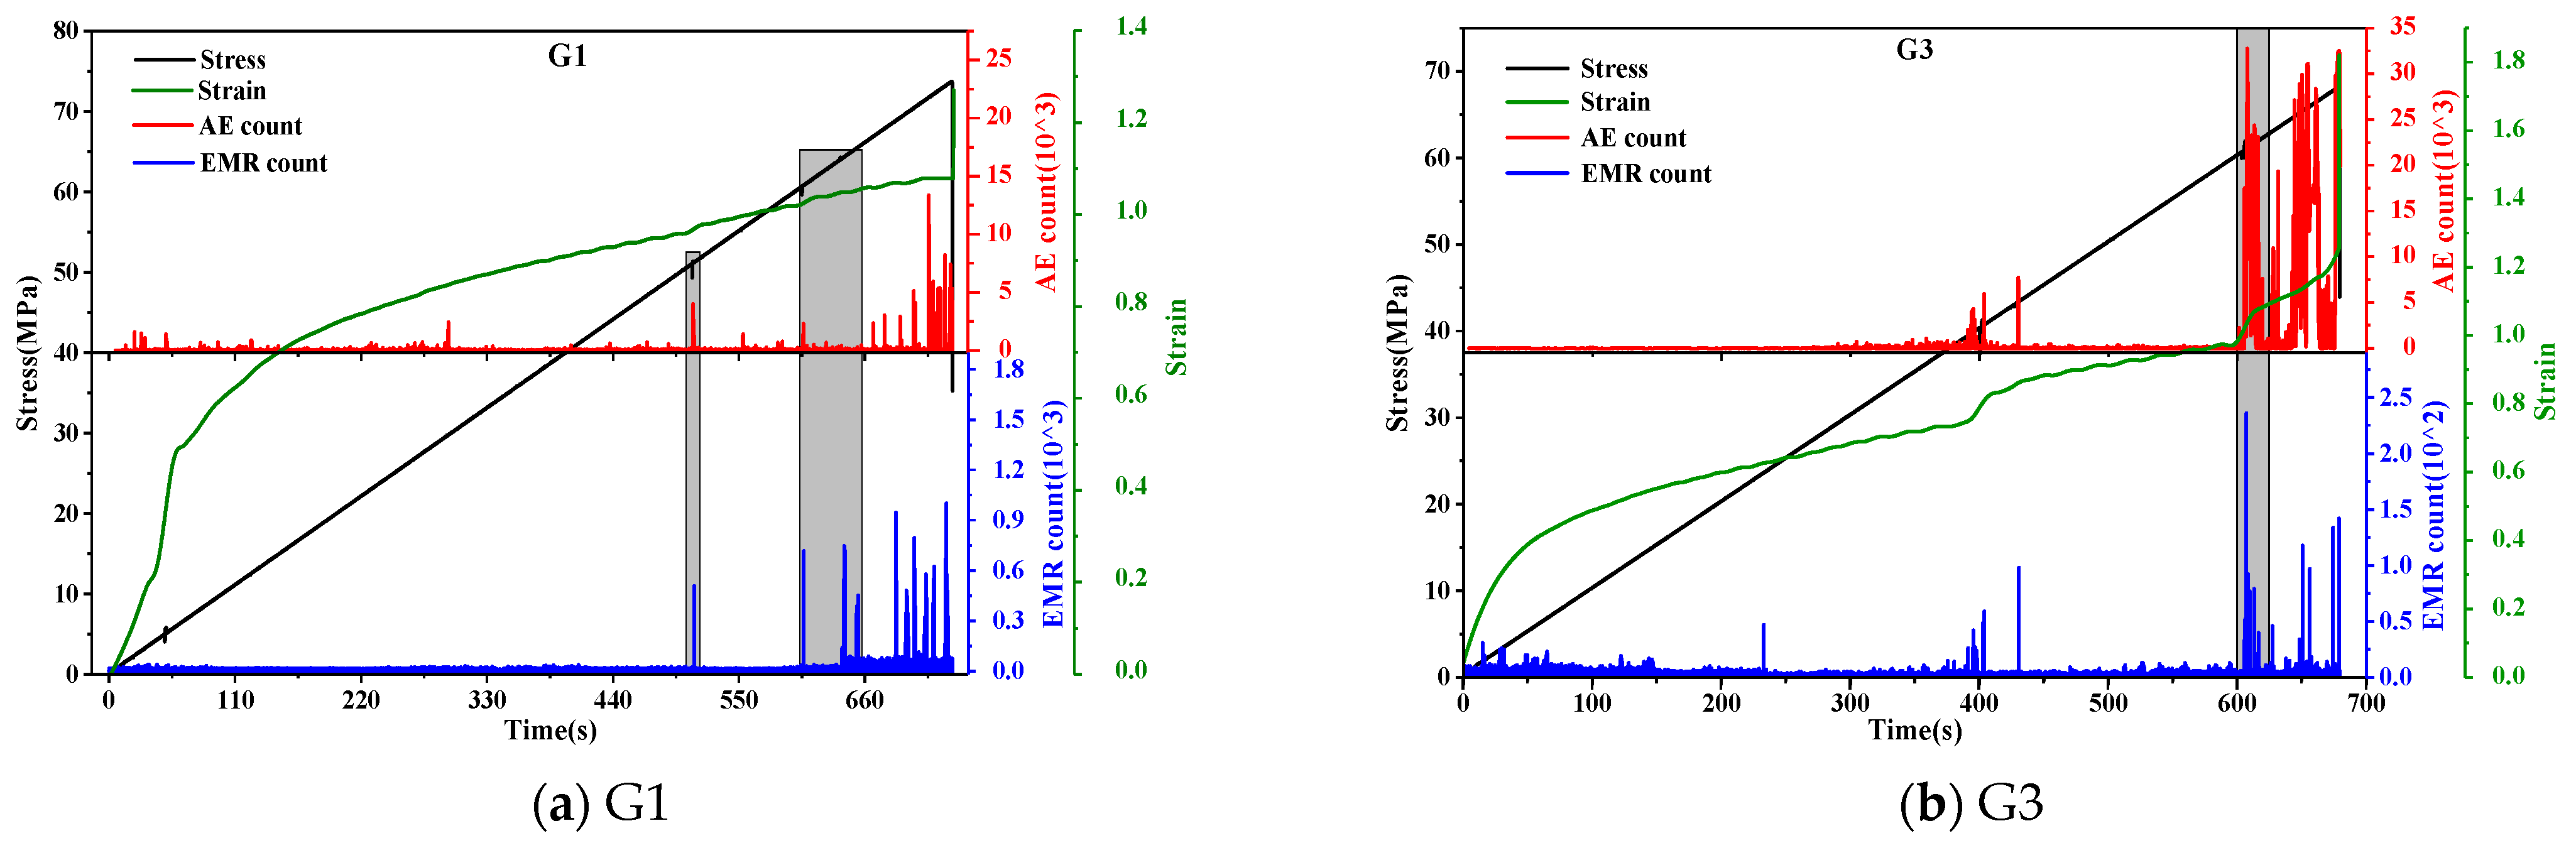
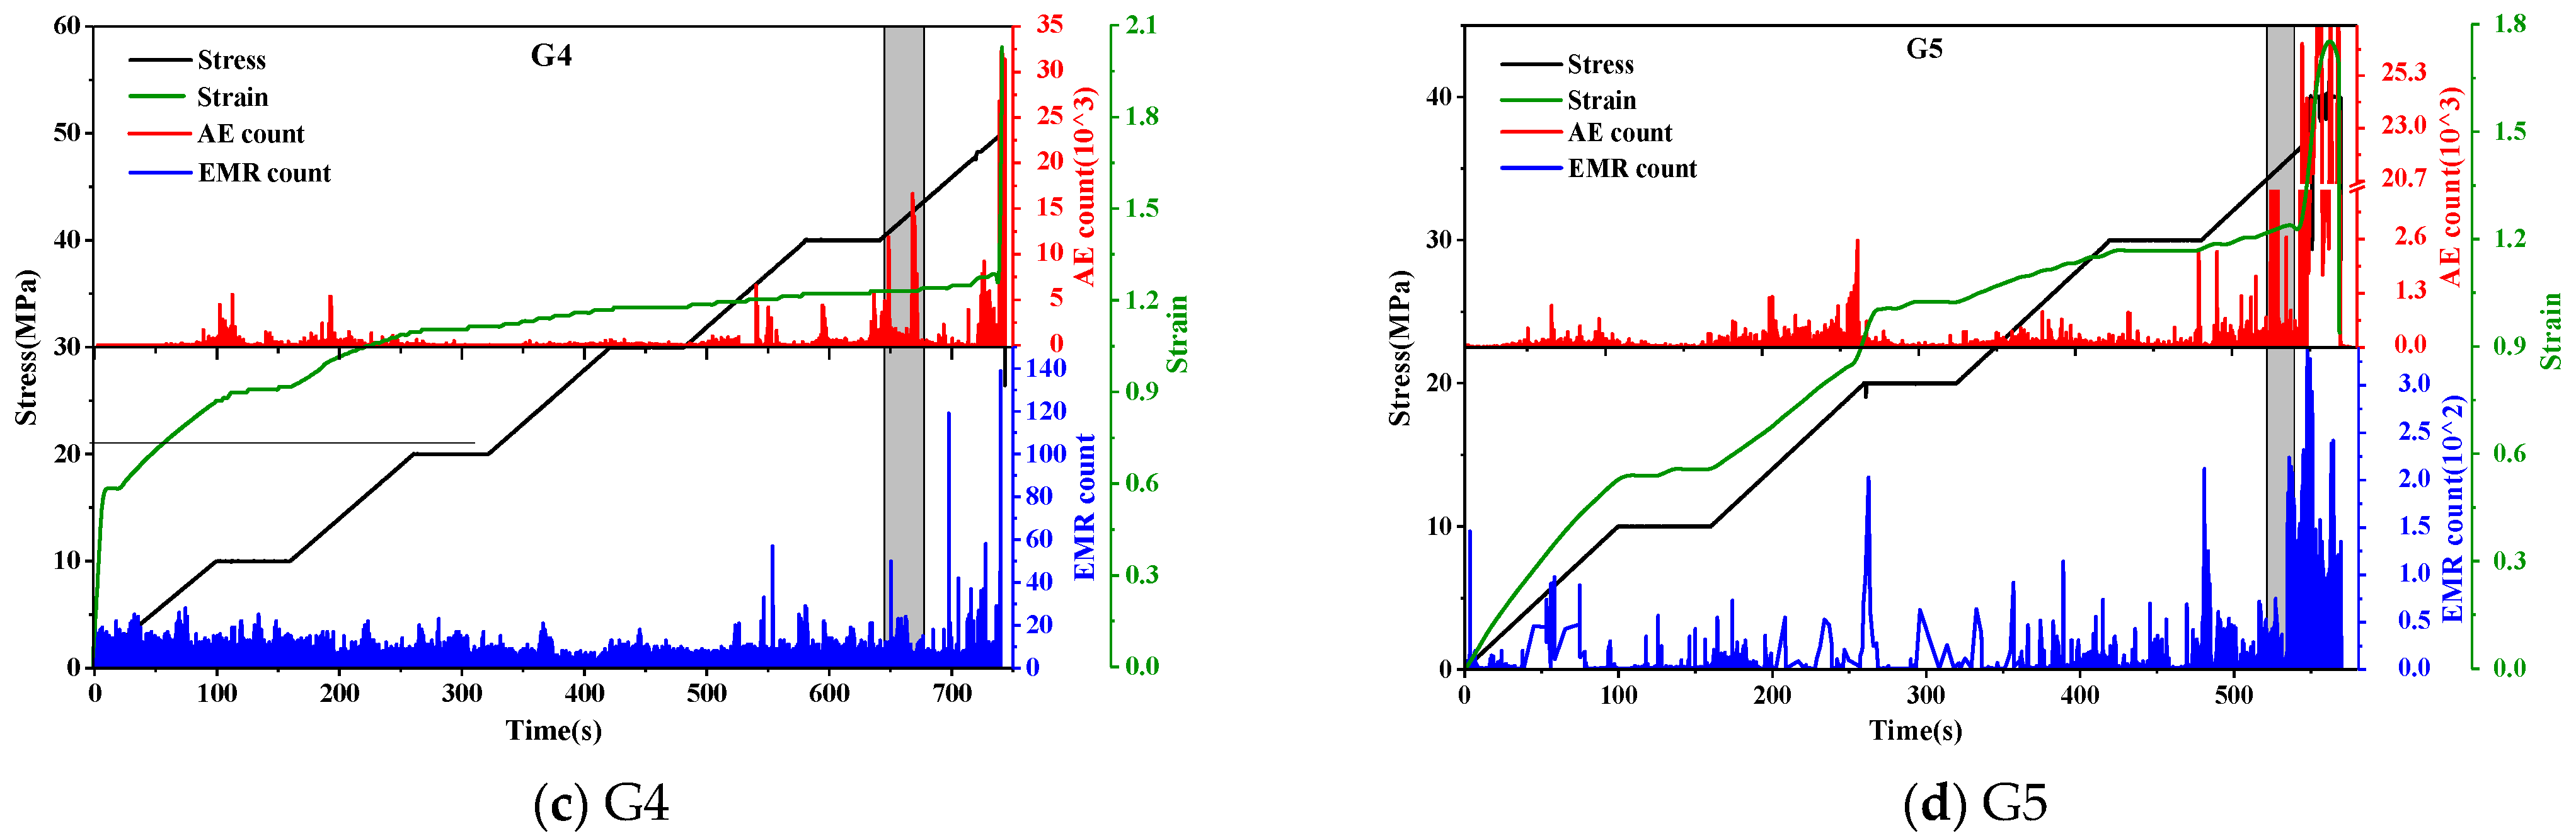
3. Temporal Joint Response Characteristics of AE–EMR Signals

Count values, as a crucial temporal parameter of AE–EMR signals, reflect the signal’s activity. Consequently, for the subsequent analysis and research, we selected the count as an illustrative parameter. Figure 3 illustrates the temporal evolution of the stress, strain, AE counts, and EMR counts during the loading processes of four representative specimens labeled G1, G3, G4, and G5. The deformation and fracture of rocks during the loading process often involve four stages: compaction, elastic deformation, plastic deformation, and unstable failure. In terms of the overall trend, the variation patterns of the AE and EMR counts tended to synchronize during the deformation and fracture processes of granite under load. Specifically, with increasing load, both the AE and EMR signals gradually intensified, reaching their peak near the peak stress. The AE–EMR signals exhibited distinct stage–wise characteristics throughout the deformation and fracture process.
During the compaction stage, the original pores and cracks within the specimen closed, resulting in noticeable deformation with a gradually decreasing deformation rate. The stress level was relatively low, and internal fractures were minimal, leading to weaker AE and EMR signals and lower count values. In the elastic deformation stage, the specimen deformation increased linearly with the growing stress, and the AE and EMR signals maintained a relatively low level. However, occasional localized fracture events occurred due to the presence of random cracks and defects within the rock, causing sudden increases in stress and strain. AE and EMR signals accompanied these abrupt changes in stress and strain, generating bursts of signals. Taking the example of the AE and EMR count variation curve for specimen G1 in Figure 3, small stress drops occurred at 507 s and 603 s, leading to a significant momentary increase in the AE and EMR counts (as shown by the grey bar in the figure). In comparison with conventional uniaxial loading, the response patterns of the AE and EMR signals during the compaction and elastic deformation stages showed no significant differences in graded loading. The count values remained at lower levels, with occasional minor enhancements in the acoustic–electric signals occurring immediately after force holding, which was possibly related to the Kaiser effect. During force holding, the strain gradually increased at a uniform pace, and the corresponding counts for AE and EMR also remained at low levels, with few or even no events. Entering the plastic deformation stage, internal cracks proliferated and extended significantly, causing notable stress fluctuations and intensified deformation, making the AE and EMR signals highly active. As the load approached the peak stress, both the acoustic emissions and electromagnetic radiation counts significantly increased. Upon reaching peak stress, the specimen underwent complete unstable failure, the stress instantaneously dropped, and the AE and EMR counts sharply decreased after reaching their peak values.
The analysis of the abovementioned experimental results indicates a strong correspondence between the characteristics of the AE and EMR signal variations and the deformation and fracture processes of rock samples. However, due to the differing mechanisms underlying their generation, the features of the AE and EMR signals were not entirely consistent. The count variation curves clearly illustrate that during the loading process, the EMR signals exhibited greater richness, although the differences between their high and low values were smaller than those of the AE signals. In practical engineering scenarios, strong signals are generally attributed to large-scale rock fractures. A more comprehensive understanding of the AE and EMR signals during rock deformation and fracture processes and their organic integration, as well as an in–depth exploration of the complex data features of both signals with quantitative descriptions, are essential tasks. This approach aimed to mitigate the impact of outliers in AE and EMR signals on prediction and forecasting, representing a meaningful avenue of research.

4. Multifractal Characteristics of AE–EMR

4.1. Multifractal Theory

Fractal theory is frequently employed to depict the complexities inherent in the natural world. The process of deformation and fracture in loaded rocks is inherently nonlinear and marked by discontinuous events, such as the closure, initiation, propagation, and coalescence of internal cracks. Consequently, the generated AE and EMR signals exhibit discrete and nonlinear characteristics, showcasing fractal features. In this study, the application of multifractal theory to the time series of the AE and EMR counts from the specimens aided in unraveling the intricacies of the rock deformation and fracture processes [13,14,15,28,29].
Let the AE and EMR time series be {t(i)}, and divide them into n subsets of length m, with the probability distribution function {Fi(m)} for each subset. Assuming that the target sequence satisfies multifractal features, then {Fi(m)} and the subset partition length m satisfy
F i ( m ) lim m 0   m α
where α is the subset roughness.
The α reflects the roughness of subsets with varying probability distributions at different scales m within the AE and EMR time series {t(i)}. The number of subset units with the same roughness within the same time series is nα(m). The change follows the equation
n α ( m ) m f ( α )
where f(α) reflects the frequency of the subset sequence corresponding to α appearing in all subsets. f(α) can be calculated from the following equation:
f ( α ) = lim m 0 ln n α ( m ) ln m
Introducing partition functions (statistical moments) to solve multifractal spectra:
T q ( m ) F i ( m ) q m τ ( q )
Taking the logarithm of both sides of the above equation:
τ ( q ) = lim m 0 ln T q ( m ) ln m
If the time series {t(i)} conforms to multifractal characteristics, then the lnTq (n) − lnm curve satisfies a good linear relationship. Defining the generalized fractal dimension:
τ ( q ) = lim m 0 ln T q ( m ) ln m
After a Legendre transformation, it is obtained that
α = d τ q d q = d d q lim m 0 ln T q m ln m
f α = α q τ q

4.2. Multifractal Features of AE–EMR Signals

According to multifractal theory, the multifractal spectrum characteristic parameters can reflect the unevenness of the distribution of the AE (EMR) data. α represents subsets of the AE (EMR) signal data with different intensities. αmin denotes the subset of data with strong signals, while αmax represents the subset with weak signals. Δα = αmax − αmin reflects the diversity in the distribution of signal intensities, with a larger Δα indicating more pronounced fractal features. f(α) represents the frequency at which the AE (EMR) signal subsets with a roughness of α appear in the entire sequence, where f(αmin) represents the frequency of occurrence of strong signals, and f(αmax) represents the frequency of occurrence of weak signals. Δf = f(αmax) − f(αmin) reflects the proportion of strong and weak signals, with Δf > 0 indicating a prevalence of weak signals and Δf < 0 indicating a prevalence of strong signals. Figure 4 illustrates the multifractal spectra of the AE and EMR counts for a typical granite specimen throughout the entire loading period. Both spectra exhibited a right–hook shape, with Δf consistently greater than 0, suggesting that the performance of the AE-EMR signals, which were induced by small fracture events throughout the loading process, was superior. The width of the multifractal spectrum Δα for the AE was notably larger than that for EMR, indicating greater variability in the distribution of the AE signals. While multifractal spectra reveal the singularity of the AE/EMR signals, they do not account for the temporal factor. Therefore, dividing the time series into multiple subsets and statistically analyzing the dynamic changes in the multifractal parameters Δα and Δf for each subset was essential. The temporal evolutions of the multifractal parameters for the AE and EMR are presented in Figure 5 and Figure 6, respectively.
From Figure 5, it is evident that the overall trend of Δα for the AE during the loading process exhibited an initial decrease followed by an increase, while Δf showed a trend of a slight increase followed by a decrease, displaying a generally inversely synchronous pattern. Therefore, this paper focuses solely on elucidating the characteristics of Δα. In the early stages of loading, Δα experienced a minor fluctuation and decline. This phenomenon occurred because, during this loading phase, the specimen primarily underwent the internal deformation and closure of pre–existing cracks due to compression. Nearly all intrinsic cracks within the specimen participated in this process, resulting in the abundant generation of small AE signals. As the internal pre–existing cracks completely closed without initiating expansion, the production of AE signals diminished, and Δα was maintained at a lower level. Subsequently, with the continuous increase in the load level, the specimen entered a phase of uniform deformation. During this stage, the specimen predominantly accumulated elastic energy, and internal microcracks underwent stable expansion. In the later stages of the elastic phase, localized microcracks penetrated, leading to significant fractures and causing pulsed changes in the acoustic emission signals. Consequently, within this stress range, Δα exhibited a gradual upward trend. As the applied load approached the peak load, Δα experienced a substantial increase. This phase was characterized by the accumulation of sufficient energy within the specimen, accelerating the deformation. Numerous cracks in the coal body gradually converged and coalesced, triggering large–scale fractures and generating substantial AE signals. Upon reaching the peak stress, Δα rapidly rose because the AE signals reached their maximum values, significantly exceeding the earlier levels of signal intensity. The changing trends in Δα and Δf throughout the loading process effectively reflected the fracture conditions within the specimen. Particularly noteworthy is the acceleration of internal fractures, where Δα and Δf experienced a rapid increase in absolute values as the peak stress was approached. Therefore, the pronounced upward trend in the absolute values of Δα and Δf, following a prolonged period of steady fluctuations, can serve as a reliable indicator for predicting critical peak stress and imminent failure, offering an early warning for specimen damage.
The temporal variations in the EMR multifractal parameters for granite specimens under different loading conditions are depicted in Figure 6. The figure reveals a notable similarity between the multifractal characteristics of EMR and AE. Throughout the loading process, Δα exhibited an initial decrease followed by an increase, indicating an increasing disparity in the distribution of the EMR signals. Meanwhile, Δf demonstrated an initial increase followed by a decrease, signifying a gradual rise in the proportion of large signals. These trends are attributed to the occurrence of extensive fracture events gradually unfolding with the applied load. This section, similarly, focuses solely on elucidating the changing trends of Δα. In the early stages of the compaction phase, Δα underwent an initial decrease from high to low, suggesting the closure of compacted cracks during this phase, resulting in a relatively abundant production of EMR signals and significant disparities. However, due to the absence of substantial fractures, the EMR signals remained relatively weak. As the load increased, Δα exhibited a relatively stable oscillatory pattern. During this phase, granite underwent uniform loading and deformation with the accumulation of elastic energy. However, significant crack expansion was rare, leading to the infrequent occurrence of large EMR signals. As the applied load approached the peak strength of the specimen, Δα suddenly increased, indicating a heightened disparity in the EMR signals, with a significant enhancement in the large AE signals. Large fractures became concentrated during this stage.
Based on the comprehensive analysis, the dynamic variations in the multifractal parameters Δα and Δf for the AE and EMR could unveil the deformation and fracture processes of rocks. Their sudden changes aligned closely with the extensive fracturing of rocks. Thus, the dynamic changes in Δα and Δf could provide a more intuitive reflection for monitoring rock instability. The dynamic changes in the multifractal parameters of the EMR exhibited a smoother pattern and a more evenly distributed variation over time. The abrupt characteristics near the plastic deformation zone were more easily identifiable. On the other hand, the multifractal parameters of the AE, while following a similar trend to the EMR, exhibited larger fluctuations over time. This may be associated with the richer content and smaller distribution disparity of the EMR signals. The substantial fluctuations could potentially lead to misjudgments of precursors to failure. Therefore, to enhance the reliability of predictive results, it is imperative not only to employ multi–method joint monitoring but also to utilize various signal analysis approaches in order to augment the capability of monitoring and early warning for rock mass instability and failure.

5. Critical Slowing Characteristics of Acoustic and Electrical Signals

5.1. Critical Moderation Theory

The critical slowing–down phenomenon refers to the distinct characteristics of dispersed fluctuations in data that occur in complex systems approaching the critical point before a state transition. This indicates a diminishing capability of the system to revert to the old phase, as manifested through an increase in critical slowing–down parameters, such as variance and autocorrelation coefficient [30,31]. Therefore, analyzing the variations over time in the variance and autocorrelation coefficient of the AE and EMR feature parameters can offer a reliable method for identifying precursors in the analysis of AE–EMR signals during the destabilization and failure processes of roof rocks.
In statistics, the variance (sample variance) is a measure of the extent to which individual sample values deviate from the mean of the entire sample. It quantifies the degree of dispersion in sample data. The formula for calculating the variance is as follows:
var ( x ) = 1 / n i = 1 n ( x i x ¯ ) 2
The autocorrelation coefficient is a statistical feature that describes the correlation between variables at different times and can be used to analyze the connection between information changes at different times, thereby determining the possibility of predicting future states at the current time. The calculation method for the autocorrelation coefficient is
AR ( x , lag ) = 1 / ( n lag ) i = 1 n lag ( ( x i x ¯ ) / var ( x ( i + lag ) x ¯ ) / var )
where var represents variance, lag corresponds to the time delay in the characteristic time series, n denotes the sequence length used for computing autocorrelation coefficients, x ¯ represents the mean of the time series variable x, and AR(x, lag) denotes the autocorrelation coefficient.
As the system approaches the critical point, the rate of recovery from small disturbances diminishes progressively, tending toward zero, with the autocorrelation coefficient approaching 1 and the variance approaching infinity. Hence, an increase in both variance and autocorrelation coefficient serves as a precursor signal indicating the system’s proximity to the critical point. In this study, a sliding time window was employed to calculate the time series of variance and autocorrelation coefficient for both the AE and EMR counts throughout the entire loading process. The analysis focused on examining the variations in these critical slowing–down parameters, with a particular emphasis on their abrupt changes in proximity to failure.

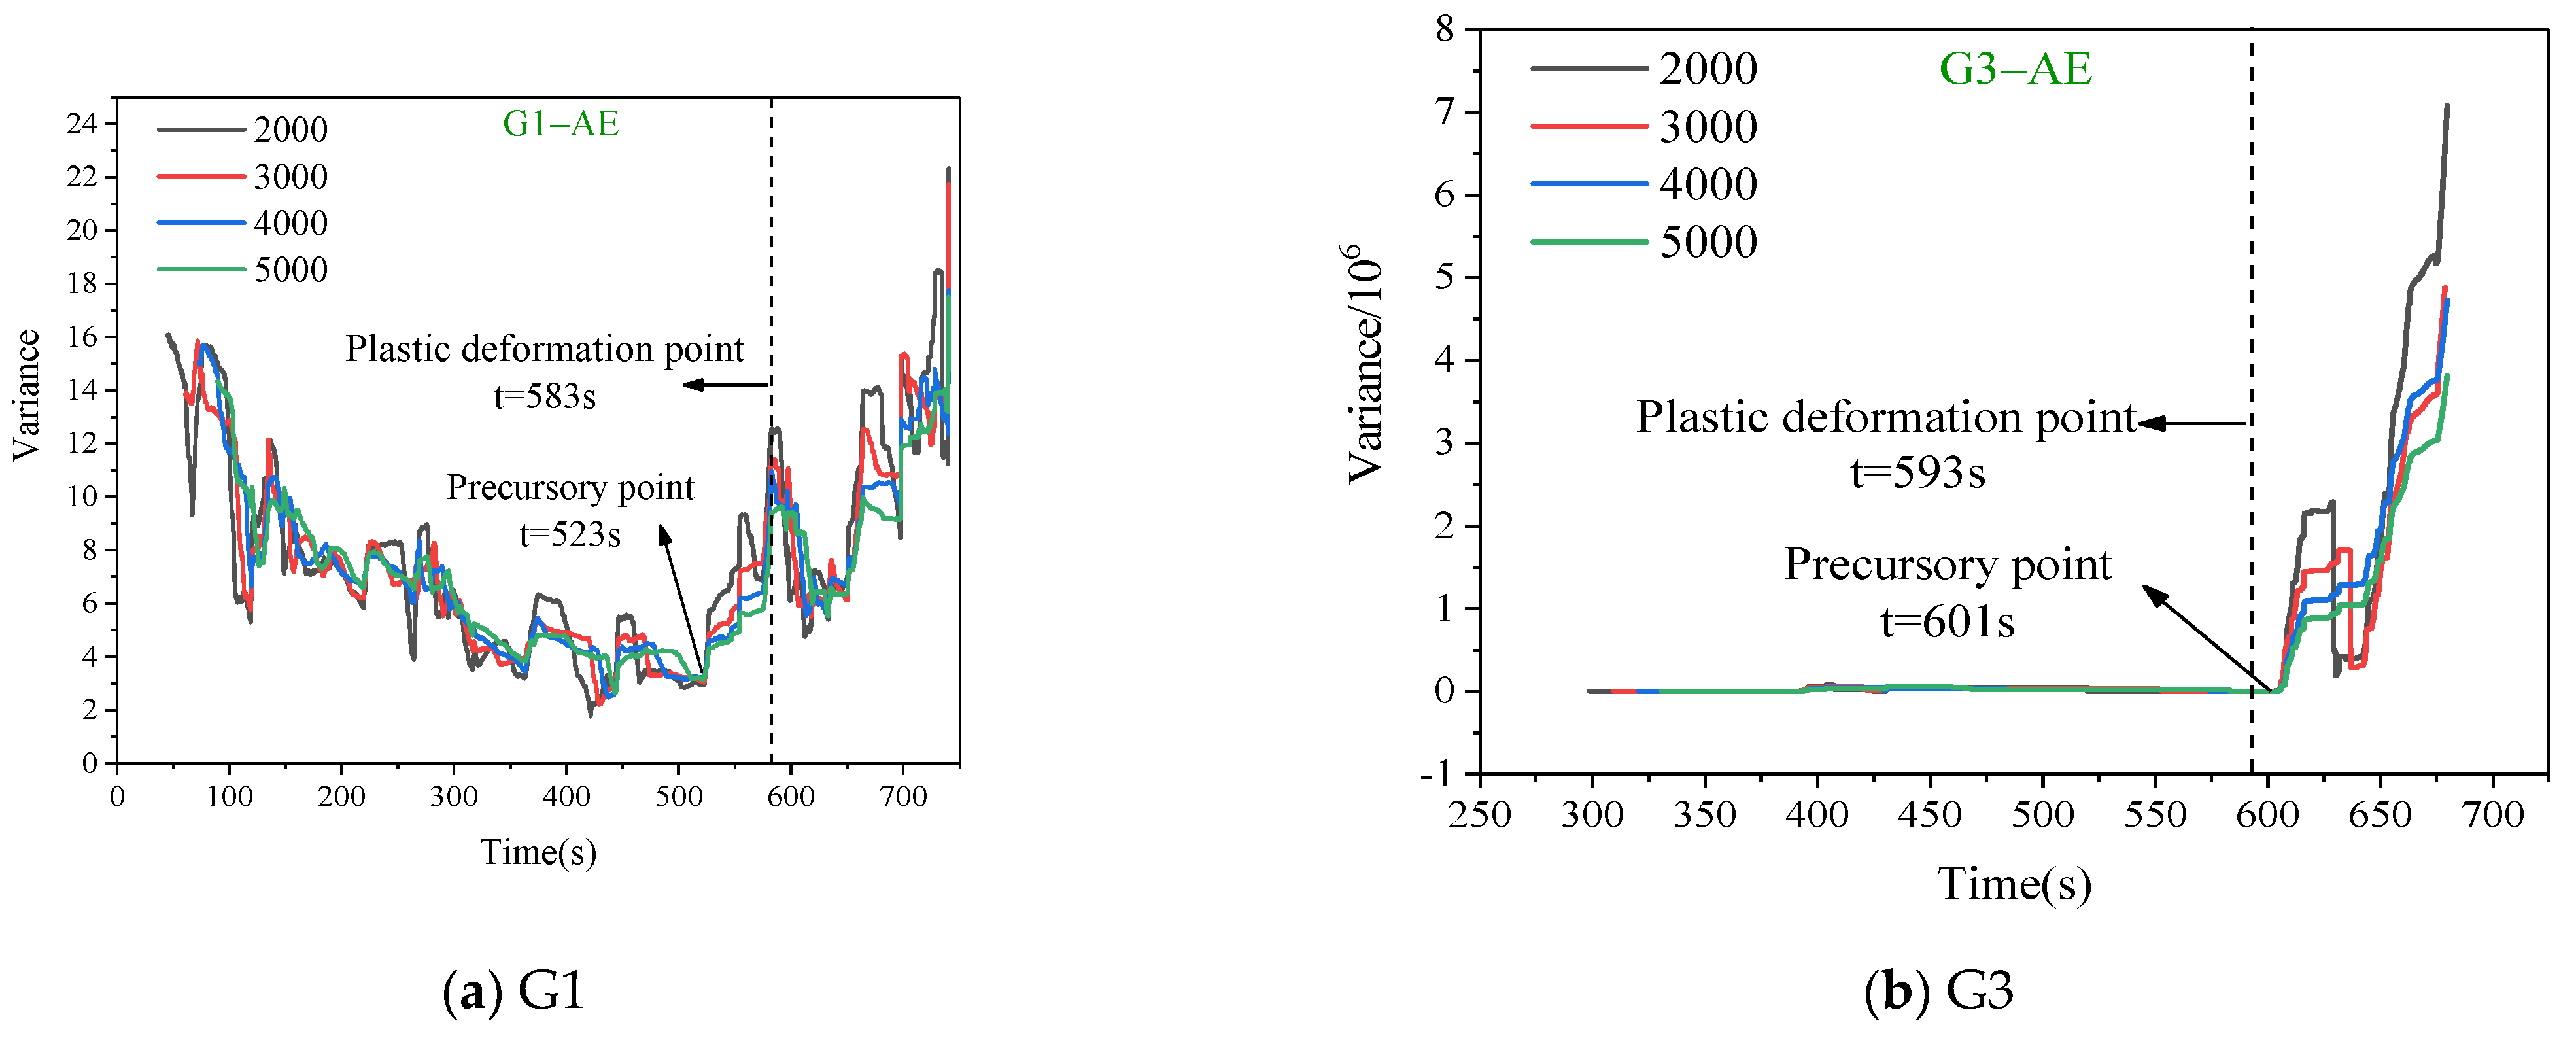
5.2. Analysis of Critical Slowing Phenomenon of Acoustic and Electrical Signals

When applying the critical slowing–down principle to analyze a complex dynamic system, the selection of an appropriate window length and lag step is crucial. In this study, a lag step of 1000 and window lengths of 2000, 3000, 4000, and 5000 were chosen for comparison. The AE and EMR data from the granite samples were processed. Figure 7 and Figure 8 depict the variance and autocorrelation coefficient trends for the AE, while Figure 9 and Figure 10 illustrate the variance and autocorrelation coefficient trends for the EMR.
The variance and autocorrelation coefficient trend curves of the AE and EMR signals revealed that with the same lag step, the trends of autocorrelation coefficient and variance curves for different window lengths were consistent. The fluctuation decreased gradually with an increase in the window length. Hence, the choice of window length had minimal impact on the analysis of precursor characteristics. A comparative analysis of the variance and autocorrelation coefficient revealed a significantly weaker fluctuation in variance, with a more pronounced turning point during the sample’s abrupt failure.
As depicted in Figure 7 and Figure 8, apart from the less pronounced fluctuations in autocorrelation and variance during the deformation process of sample G1, samples G3, G4, and G5 exhibited significant abrupt changes in the autocorrelation and variance. Taking sample G4 as an example, before entering the plastic deformation phase, the autocorrelation of the AE counts fluctuated within the range of (−0.025, 0.10). Apart from two distinct peaks near t = 400 s and 500 s, the autocorrelation remained relatively stable at other times. When loaded to t = 607 s, the autocorrelation coefficient increased from 0 to 0.20, displaying a noticeable inflection point. This shift occurred 21 s before the sample entered the plastic deformation phase at t = 628 s. In comparison with the autocorrelation, the variance exhibited significantly smaller fluctuations, making the inflection points easier to identify. Before the onset of plastic deformation, the variance was nearly zero. At t = 634 s, the variance underwent a substantial fluctuation, followed by a sudden jump. The inflection point of the variance, compared with the initiation of plastic deformation, lagged by only 6 s.
Figure 9 and Figure 10 show the temporal evolution of critical slowing–down feature parameters, namely, autocorrelation and variance, in the EMR counts. It is evident from the figure that the change trends in the autocorrelation for different specimens lacked a clear pattern, exhibiting relatively chaotic behavior with multiple instances of abrupt peaks and valleys. Notably, specimen G1 demonstrated a conspicuous anomalous spike at t = 642 s, though discerning its association with prelude to instability remained inconclusive. Conversely, distinct turning points and sudden changes characterized the variance of electromagnetic radiation signals under different window lengths. Prior to reaching the plastic deformation phase, specimens G1, G3, and G5 exhibited minimal variance in the EMR counts, almost consistently at zero, with only slight fluctuations at certain moments. However, as the plastic deformation stage was approached, a significant fluctuation in the variance of the EMR counts occurred, followed by abrupt increases. Post–increase, shorter window lengths corresponded to greater magnitudes of variance growth. Thus, the variation in window length primarily affected the amplitude of variance but had minimal impact on the critical slowing–down precursor features. In comparison with the onset of plastic deformation, the times of variance spikes in electromagnetic radiation were delayed by 58 s, 12 s, and 62 s for specimens G1, G3, and G5, respectively. However, the time of the sudden increase was ahead of the time when the rock underwent instability and failure.
Analyzing from the perspective of autocorrelation, the coefficients of autocorrelation for the AE and EMR signals exhibited an increasing trend near the vicinity of the plastic deformation zone. However, overall, the autocorrelation coefficients displayed significant fluctuations, hindering the effective identification of prelude to failure. In the case of variance, precursors of the EMR and AE were notably distinct. The variance remained relatively unchanged during the initial loading phase but experienced a sudden increase upon entering the plastic deformation stage. The variance demonstrated high sensitivity to the large–scale fracture of rocks, with minimal occurrence of false signals. In comparison with the dynamic changes in multifractal parameters, the temporal continuity of the critical slowing–down indicators was superior. Thus, the variance served as a crucial reference indicator for identifying the prelude to failure. Statistical analysis was conducted on the moments of variance spikes for the four sets of specimens to find correlations with their corresponding stress levels. Normalization was performed based on the time of failure and compressive strength, resulting in the data presented in Table 1. Most variance spike points for both AE and EMR counts across all specimens fell within the 80–90% range in both the time domain and stress levels, indicating good timeliness for early warning.

6. Conclusions

This study conducted uniaxial direct and incremental loading tests on granite by concurrently monitoring AE and EMR signals. The temporal variations in the counts of the AE and EMR were analyzed. The research applied multifractal analysis and critical slowing–down theory to further deconstruct and analyze the complex data structures and dynamic evolution of the AE and EMR signals. The key findings are as follows:
(1)
The deformation and fracture process of loaded granite exhibited a well–correlated and phased response in both the AE and EMR signals. In the initial stages of loading, both the AE and EMR signals were relatively weak. As loading continued, both the AE and EMR signals gradually intensified, reaching their maximum strength in the proximity of the peak stress.
(2)
The multifractal parameters ∆α and ∆f of the AE and EMR offered a quantitative reflection of the deformation and fracture processes in granite. The overall trend of ∆α exhibited an initial decrease followed by an increase, while ∆f showed the opposite pattern. The abrupt increase in ∆α corresponded to a simultaneous abrupt decrease in ∆f, marking significant large–scale fracture events in the rock. This observation provided a valuable reference for the identification of precursors to the unstable failure of the rock.
(3)
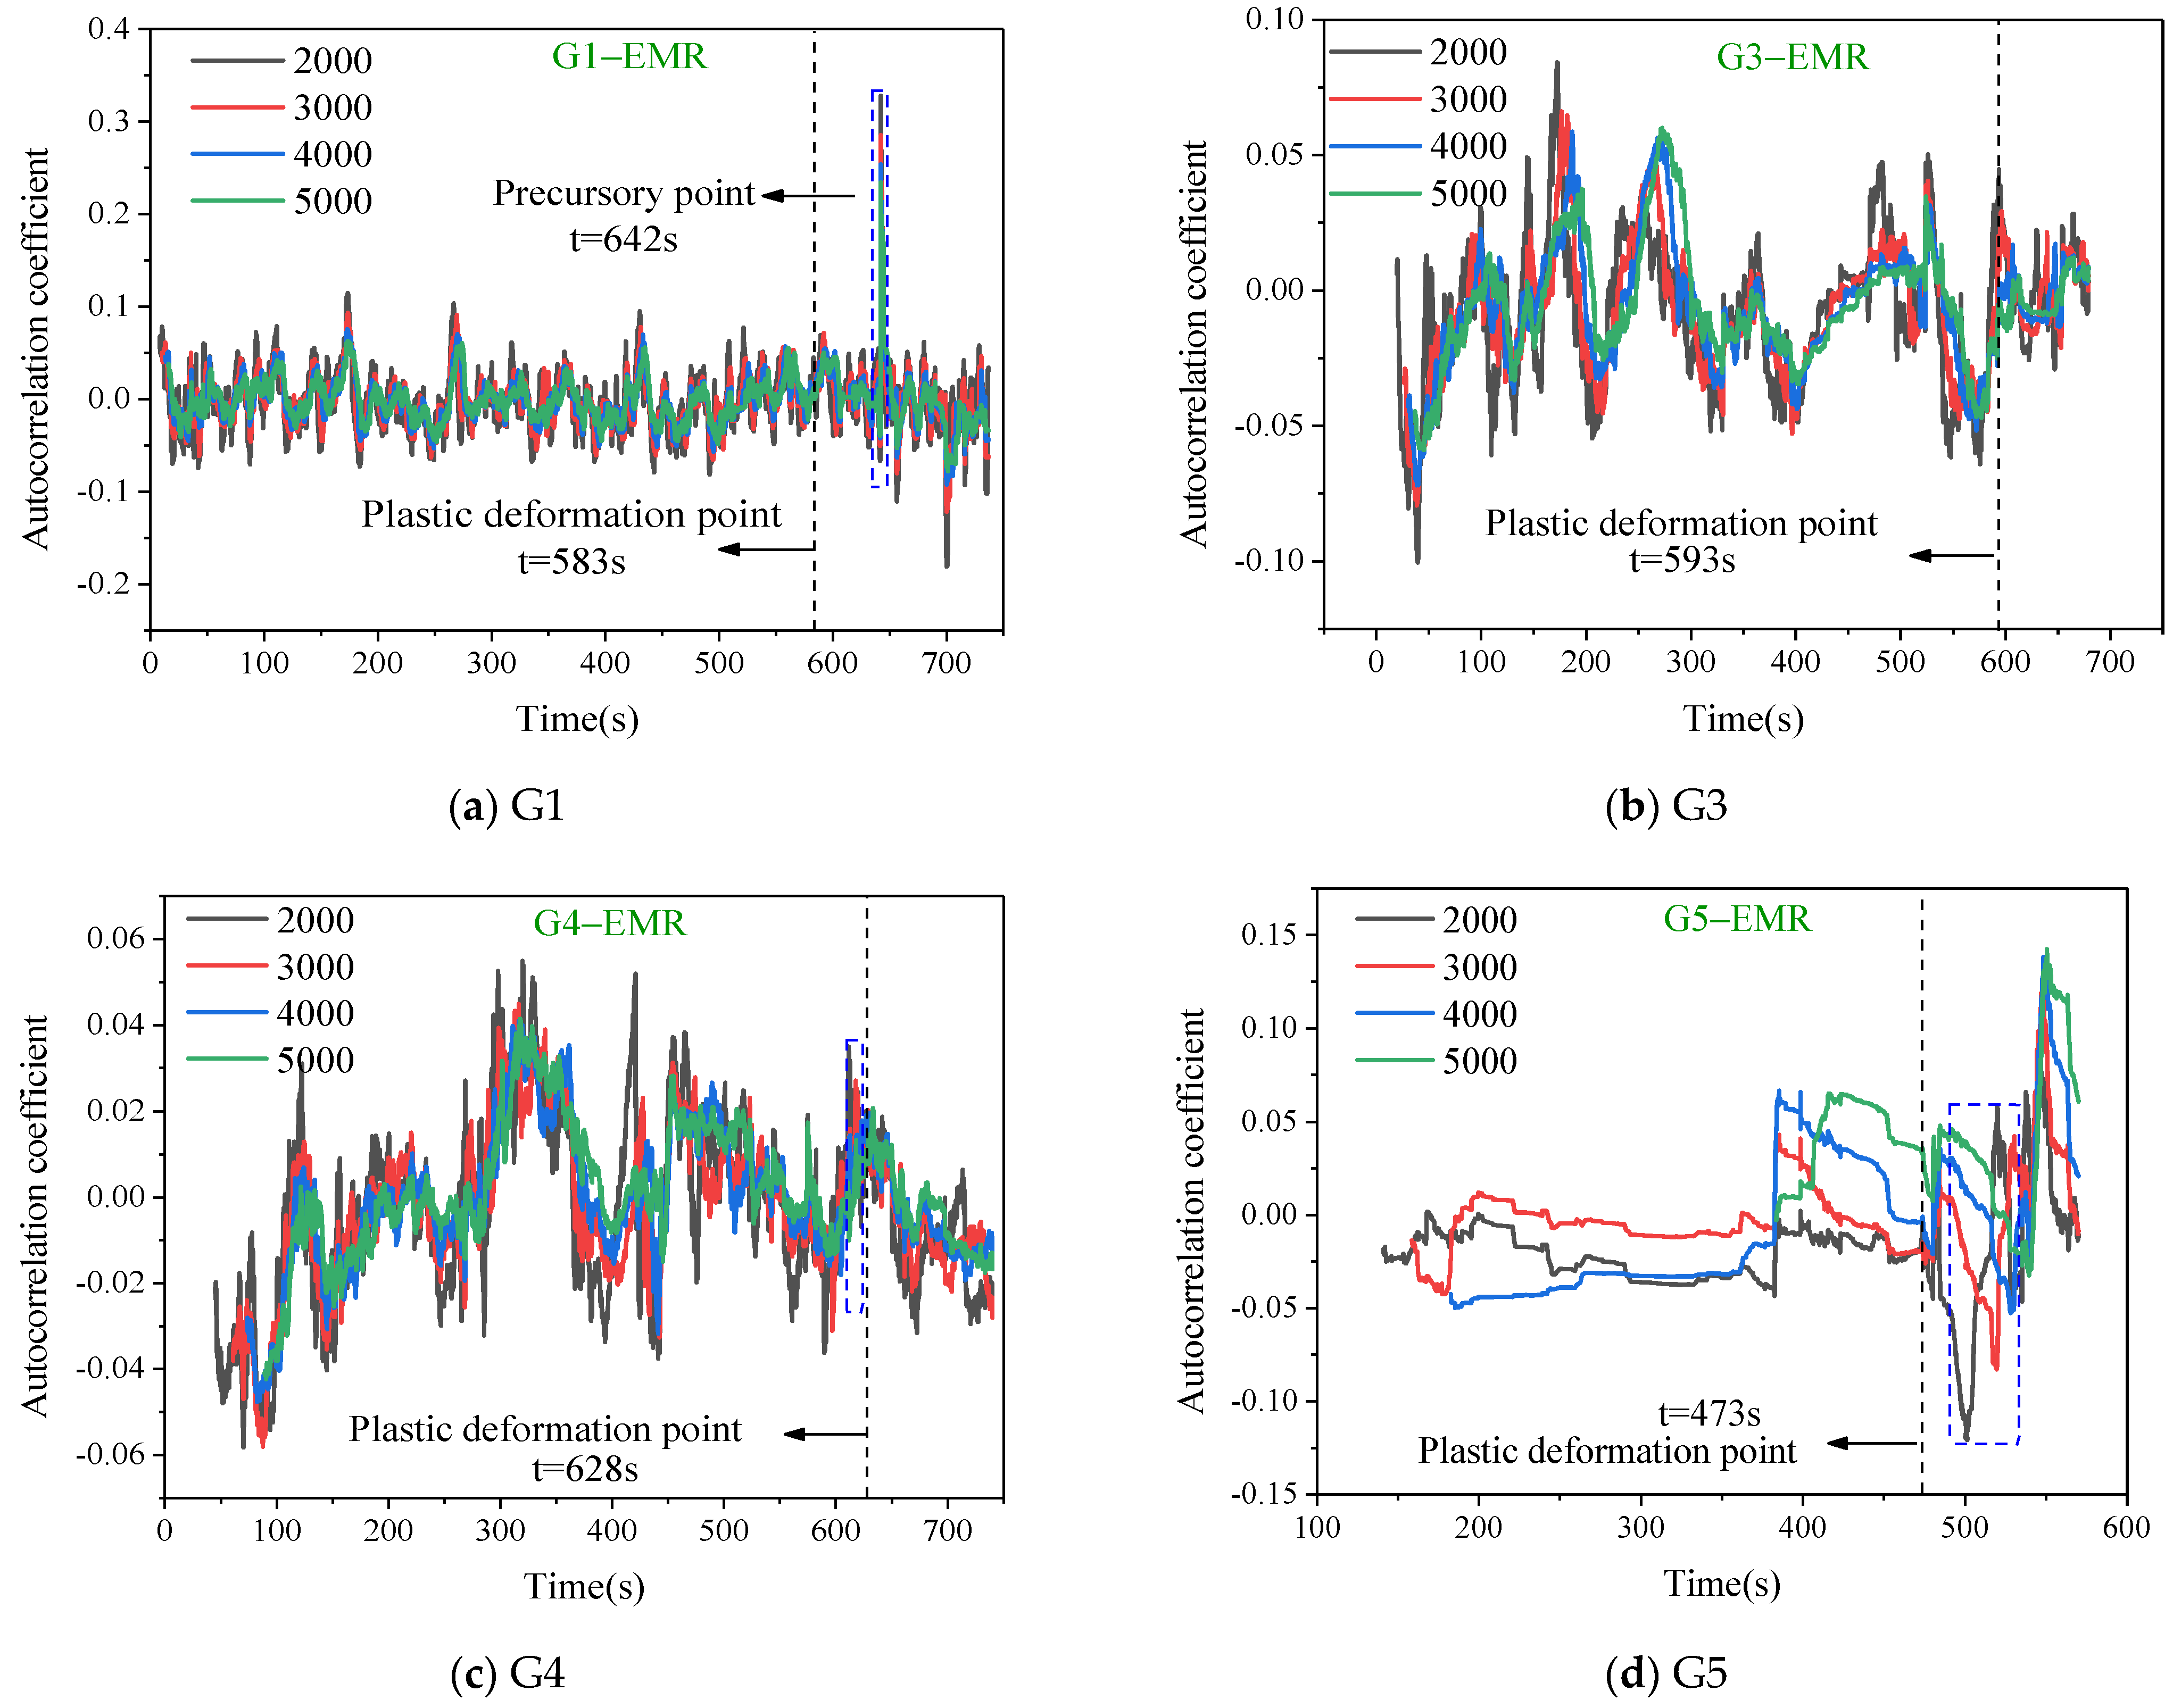
In the proximity of impending failure, the critical slowing–down parameters, namely, the variance and autocorrelation coefficients, for the AE and EMR signals exhibited an increasing trend. In comparison with the autocorrelation coefficients, the variance presented fewer false signals and displayed heightened sensitivity to large–scale fracture events. Moreover, the changes in critical slowing–down parameters demonstrated superior temporal continuity when compared with multifractal parameters. Therefore, variance served as a more advantageous reference indicator for the identification of precursors to rock failure. It was observed that the variance in AE–EMR signals consistently spiked when the stress level reached 80–90% of the peak stress.

Author Contributions

Conceptualization, Y.M. and D.W.; methodology, D.L.; validation, X.L. (Xuelong Li) and D.W.; formal analysis, H.Y.; investigation, D.W.; resources, D.W.; data curation, D.W.; writing—original draft preparation, D.W.; writing—review and editing, D.W.; visualization, Q.L.; supervision, Y.M.; project administration, D.W.; funding acquisition, Y.M. and X.L. (Xiaofei Liu). All authors have read and agreed to the published version of the manuscript.

Funding

This work was supported by the Open Foundation of Key Laboratory of Safety and High–efficiency Coal Mining, Ministry of Education (Anhui University of Science and Technology) (JYBSYS2021102), the National Natural Science Foundation of China (52174218), the Science and Technology Planning Project of Guizhou Province, China (No. [2022] General 078), and a project funded by the Priority Academic Program Development of Jiangsu Higher Education Institutions (PAPD).

Institutional Review Board Statement

Not applicable.

Informed Consent Statement

Not applicable.

Data Availability Statement

Data are contained within the article.

Conflicts of Interest

The authors declare no conflicts of interest.

References

  1. Wang, E.; He, X.; Wei, J.; Nie, B.; Song, D. Electromagnetic Emission Graded Warning Model and Its Applications against Coal Rock Dynamic Collapses. Int. J. Rock Mech. Min. Sci. 2011, 48, 556–564. [Google Scholar]
  2. Ding, Z.; Feng, X.; Wang, E.; Wei, Q.; Zhao, X.; Hu, Q. Acoustic Emission Response and Evolution of Precracked Coal in the Meta-Instability Stage under Graded Loading. Eng. Geol. 2023, 312, 106930. [Google Scholar] [CrossRef]
  3. Kong, X.; He, D.; Liu, X.; Wang, E.; Li, S.; Liu, T.; Ji, P.; Deng, D.; Yang, S. Strain Characteristics and Energy Dissipation Laws of Gas-Bearing Coal during Impact Fracture Process. Energy 2022, 242, 123028. [Google Scholar] [CrossRef]
  4. Ma, Q.; Tan, Y.; Liu, X.; Gu, Q.; Li, X. Effect of Coal Thicknesses on Energy Evolution Characteristics of Roof Rock-Coal-Floor Rock Sandwich Composite Structure and Its Damage Constitutive Model. Compos. Part B Eng. 2020, 198, 108086. [Google Scholar] [CrossRef]
  5. Hu, J.; He, M.; Li, H.; Tao, Z.; Liu, D.; Cheng, T.; Peng, D. Rockburst hazard control using the excavation compensation method (ECM): A case study in the Qinling Water Conveyance Tunnel. Engineering 2023. [Google Scholar] [CrossRef]
  6. Li, H.; He, M.; Qiao, Y.; Cheng, T.; Xiao, Y.; Gu, Z. Mode I fracture properties and energy partitioning of sandstone under coupled static-dynamic loading: Implications for rockburst. Theor. Appl. Fract. Mech. 2023, 127, 104025. [Google Scholar] [CrossRef]
  7. Li, H.; Qiao, Y.; He, M.; Shen, R.; Gu, Z.; Cheng, T.; Xiao, Y.; Tang, J. Effect of water saturation on dynamic behavior of sandstone after wetting-drying cycles. Eng. Geol. 2023, 319, 107105. [Google Scholar] [CrossRef]
  8. Novikov, E.A.; Oshkin, R.O.; Shkuratnik, V.L.; Epshtein, S.A.; Dobryakova, N.N. Application of Thermally Stimulated Acoustic Emission Method to Assess the Thermal Resistance and Related Properties of Coals. Int. J. Min. Sci. Technol. 2018, 28, 243–249. [Google Scholar] [CrossRef]
  9. Kong, X.; Zhan, M.; Cai, Y.; Ji, P.; He, D.; Zhao, T.; Hu, J.; Lin, X. Precursor Signal Identification and Acoustic Emission Characteristics of Coal Fracture Process Subjected to Uniaxial Loading. Sustainability 2023, 15, 11581. [Google Scholar]
  10. Wang, S.; Fan, H.; He, H.; Tang, L.; Tao, X. Effect of particle shape and roughness on the hydrophobicity of low-rank coal surface. Int. J. Coal Prep. Util. 2018, 40, 1423066. [Google Scholar] [CrossRef]
  11. Wang, S.; Kong, R. Analyzing the flotation kinetics of long-flame coal slurry using water-soluble emulsified collector mixtures. Fuel 2024, 360, 130572. [Google Scholar] [CrossRef]
  12. Zhang, Z.; Wang, E.; Li, N. Research on macroscopic mechanical properties and microscopic evolution characteristic of sandstone in thermal environment. Constr. Build. Mater. 2023, 366, 130152. [Google Scholar] [CrossRef]
  13. Zhang, R.; Liu, J.; Sa, Z.; Wang, Z.; Lu, S.; Wang, C. Experimental Investigation on Multi-Fractal Characteristics of Acoustic Emission of Coal Samples Subjected to True Triaxial Loading-Unloading. Fractals 2020, 28, 2050092. [Google Scholar] [CrossRef]
  14. Zhang, R.; Liu, J.; Sa, Z.; Wang, Z.; Lu, S.; Lv, Z. Fractal Characteristics of Acoustic Emission of Gas-Bearing Coal Subjected to True Triaxial Loading. Measurement 2021, 169, 108349. [Google Scholar] [CrossRef]
  15. Liu, J.; Li, Q.; Wang, X.; Wang, Z.; Lu, S.; Sa, Z.; Wang, H. Dynamic Multifractal Characteristics of Acoustic Emission about Composite Coal-Rock Samples with Different Strength Rock. Chaos Solitons Fractals 2022, 164, 112725. [Google Scholar] [CrossRef]
  16. Meng, F.; Zhou, H.; Wang, Z.; Zhang, L.; Kong, L.; Li, S.; Zhang, C. Experimental Study on the Prediction of Rockburst Hazards Induced by Dynamic Structural Plane Shearing in Deeply Buried Hard Rock Tunnels. Int. J. Rock Mech. Min. Sci. 2016, 86, 210–223. [Google Scholar] [CrossRef]
  17. Li, H.; Qiao, Y.; Shen, R.; He, M.; Cheng, T.; Xiao, Y.; Tang, J. Effect of Water on Mechanical Behavior and Acoustic Emission Response of Sandstone during Loading Process: Phenomenon and Mechanism. Eng. Geol. 2021, 294, 106386. [Google Scholar] [CrossRef]
  18. Frid, V. Electromagnetic Radiation Method for Rock and Gas Outburst Forecast. J. Appl. Geophys. 1997, 38, 97–104. [Google Scholar] [CrossRef]
  19. Wang, E.; He, X.; Nie, B. Principle of predicting coal and gas outburst using electromagnetic emission. J. China Univ. Mining Technol. 2000, 29, 225–229. [Google Scholar]
  20. He, X.; Nie, B.; Wang, E. Electromagnetic emission forecasting technology of coal or rock dynamic disasters in mine. J. China Coal Soc. 2007, 32, 56–59. [Google Scholar]
  21. Li, D.; Wang, E.; Li, Z.; Jia, H.; Wang, D.; Kong, X.; Wang, X.; Wang, X.; Ali, M. A Causal Mechanism for Anomalous Electromagnetic Radiations from Coal and Rock Failure. Geophysics 2018, 83, E423–E434. [Google Scholar] [CrossRef]
  22. Wei, M.; Song, D.; He, X.; Li, Z.; Qiu, L.; Lou, Q. Effect of Rock Properties on Electromagnetic Radiation Characteristics Generated by Rock Fracture During Uniaxial Compression. Rock Mech. Rock Eng. 2020, 53, 5223–5238. [Google Scholar] [CrossRef]
  23. Yin, S.; Song, D.; He, X.; Qiu, L.; Wei, M.; Wang, C.; Chen, Y.; Li, P.; Li, J. Time-Frequency Evolution Law and Generation Mechanism of Electromagnetic Radiation in Coal Friction Process. Eng. Geol. 2021, 294, 106377. [Google Scholar] [CrossRef]
  24. Li, X.; Chen, S.; Wang, E.; Li, Z. Rockburst Mechanism in Coal Rock with Structural Surface and the Microseismic (MS) and Electromagnetic Radiation (EMR) Response. Eng. Fail. Anal. 2021, 128, 105523. [Google Scholar] [CrossRef]
  25. Wang, Y.; He, X.; Dou, L. Study on regularity and mechanism of AE and electromagnetic emission during fracture process of coal samples. Chin. J. Geophys. 2007, 50, 1569–1575. [Google Scholar]
  26. Lou, Q.; Song, D.; He, X.; Li, Z.; Qiu, L.; Wei, M.; He, S. Correlations between Acoustic and Electromagnetic Emissions and Stress Drop Induced by Burst-Prone Coal and Rock Fracture. Saf. Sci. 2019, 115, 310–319. [Google Scholar] [CrossRef]
  27. Li, B.; Wang, E.; Li, Z.; Cao, X.; Liu, X.; Zhang, M. Automatic Recognition of Effective and Interference Signals Based on Machine Learning: A Case Study of Acoustic Emission and Electromagnetic Radiation. Int. J. Rock Mech. Min. Sci. 2023, 170, 105505. [Google Scholar] [CrossRef]
  28. Kong, X.; Wang, E.; Li, S.; Lin, H.; Xiao, P.; Zhang, K. Fractals and Chaos Characteristics of Acoustic Emission Energy About Gas-Bearing Coal During Loaded Failure. Fractals 2019, 27, 1950072. [Google Scholar] [CrossRef]
  29. Hu, S.; Wang, E.; Li, Z.; Shen, R.; Liu, J. Time-Varying Multifractal Characteristics and Formation Mechanism of Loaded Coal Electromagnetic Radiation. Rock Mech. Rock Eng. 2014, 47, 1821–1838. [Google Scholar] [CrossRef]
  30. Zhang, X.; Li, Z.; Niu, Y.; Cheng, F.; Ali, M.; Bacha, S. An Experimental Study on the Precursory Characteristics of EP before Sandstone Failure Based on Critical Slowing Down. J. Appl. Geophys. 2019, 170, 103818. [Google Scholar] [CrossRef]
  31. Li, H.; Shen, R.; Qiao, Y.; He, M. Acoustic Emission Signal Characteristics and Its Critical Slowing Down Phenomenon during the Loading Process of Water-Bearing Sandstone. J. Appl. Geophys. 2021, 194, 104458. [Google Scholar] [CrossRef]
Figure 1. Experimental samples.
Sustainability 16 01045 g001
Figure 2. AE–EMR monitoring and testing system. (a) Testing system; (b) Schematic diagram of the experimental system; (1) Sample and insulating aper; (2) AE sensor; (3) EMR antenna; (4) Press; (5) Shielding room; (6) Preamplifier; (7) Servo controller; (8) AE/EMR monitoring system; (9) Press control system.
Sustainability 16 01045 g002
Figure 3. Counting variation patterns of AE and EMR joint monitoring.
Sustainability 16 01045 g003aSustainability 16 01045 g003b
Figure 4. AE and EMR counting multifractal spectra.
Sustainability 16 01045 g004
Figure 5. AE multifractal characteristics.
Sustainability 16 01045 g005aSustainability 16 01045 g005b
Figure 6. EMR multifractal characteristics.
Sustainability 16 01045 g006
Figure 7. Autocorrelation of AE for samples with different window lengths.
Sustainability 16 01045 g007
Figure 8. Variance of AE for samples with different window lengths.
Sustainability 16 01045 g008aSustainability 16 01045 g008b
Figure 9. Autocorrelation of EMR for samples with different window lengths.
Sustainability 16 01045 g009
Figure 10. Variance of EMR for samples with different window lengths.
Sustainability 16 01045 g010
Table 1. Variance sudden increase points and corresponding stress levels.
Sample NumberAE Precursor PointEMR Precursor Point
Time LevelStress LevelTime LevelStress Level
G10.710.710.870.87
G30.890.890.890.89
G40.860.800.710.82
G50.950.850.970.88
Disclaimer/Publisher’s Note: The statements, opinions and data contained in all publications are solely those of the individual author(s) and contributor(s) and not of MDPI and/or the editor(s). MDPI and/or the editor(s) disclaim responsibility for any injury to people or property resulting from any ideas, methods, instructions or products referred to in the content.

