Article

Integrating Cargo Bikes and Drones into Last-Mile Deliveries: Insights from Pilot Deliveries in Five Greek Cities

by
Konstantinos Athanasopoulos
1,
Ioannis Chatziioannou
1,*,
Argyro-Maria Boutsi
1,
Georgios Tsingenopoulos
1,
Sofia Soile
1,
Regina Chliverou
1,
Zoe Petrakou
2,
Efstathios Papanikolaou
3,
Christos Karolemeas
1,
Efthymia Kourmpa
1,
Kalliopi Papadaki
1,
Eleftheria Tzika
1,
Charalabos Ioannidis
1,
Chryssy Potsiou
1 and
Thanos Vlastos
1
1
School of Rural, Surveying and Geoinformatics Engineering, National Technical University of Athens, 10682 Athens, Greece
2
Aethon Engineering, 25 Em. Benaki Str., 10678 Athens, Greece
3
Taxydema, 81 Xenodochoipallilon Str., 13677 Athens, Greece
*
Author to whom correspondence should be addressed.
Sustainability 2024, 16(3), 1060; https://doi.org/10.3390/su16031060
Submission received: 16 December 2023 / Revised: 22 January 2024 / Accepted: 23 January 2024 / Published: 26 January 2024

Abstract

:
Currently, there is a growing consensus that the use of more sustainable urban freight transportation has the potential to offer major energy and efficiency benefits which can be achieved through the appropriate combination of cargo bikes and the integration of drones into the urban logistics system. This study presents the results of a stepwise regression analysis that examines the role, benefits, and impact of electric vehicles such as e-bikes, cargo bikes, and drones for intermodal freight transportation in five Greek cities to support the green logistics paradigm. The results show that between routes of almost equal length, the most bicycle-friendly routes, such as routes along pedestrian areas or residential streets, should be avoided, as they reduce delivery speed and increase delivery costs in terms of energy and time expenditure. In addition, priority roads, which usually have higher traffic speeds and more trucks, are preferred by cyclists due to the quality of the road surface, even though the feeling of safety is lower on such roads. Finally, regarding drones, energy consumption is relatively low in the 0–5 mph and 6–10 mph wind speed ranges, indicating efficient energy use. In the 11–15 mph and 16–20 mph wind speed ranges, energy efficiency is significantly lower than the battery capacity, indicating that the cargo drone exhibits excessive energy consumption under these conditions.

1. Introduction

The 20th century experienced a pivotal change in global urbanization, driven by economic, social, cultural, and political forces like globalization and population growth. This led to the expansion of cities, necessitating numerous changes due to challenges like peripheral developments, overpopulation, and metropolization [1]. Cities transformed into diverse, multi-nuclear structures, suffering by high environmental pollution and internal insecurity. Consequently, public space degraded, urban areas became disorganized, connectivity between localities decreased, and there was a massive migration to the city outskirts, resulting in urban sprawl [2]. This phenomenon highlighted the essential need for travel within and from cities to other regions.
Hence, transport has emerged as a crucial factor in city planning [3], influencing both the economic strength of an area and the well-being of its residents [4,5,6]. The importance of transport is highlighted in the context of urbanization, where economic opportunities are concentrated in urban centers, contrasting with the residential areas, which are primarily situated on the outskirts. This dynamic generates a collective demand for mobility and longer travel distances originating from the suburbs [7,8]. Extensive literature reviews affirm that infrastructure investment plays a positive role in fostering growth and economic impact [9]. In contemporary research, various perspectives such as growth regressions and production functions have been employed to explore the impact of transport on growth rate, productivity, output, and overall economic development [10,11,12,13,14,15,16,17,18,19,20,21]. This growing body of scientific literature provides substantial evidence supporting the positive influence of transport on various facets of economic progress.
Moreover, it is crucial to consider transport infrastructure for improving both freight mobility and urban design scenarios [22,23]. The transportation of both people and goods is indispensable for a country’s development. However, both types of transport, whether for passengers or freight, share a common feature—they generate numerous negative externalities. Unfortunately, these are often overlooked by authorities in both the private and public sectors [24]. In the literature, there is a consensus that road transport, in particular, is responsible for various negative externalities like congestion, barrier effects, road crashes, oil dependence, and water and air pollution [25,26,27,28,29,30].
Private automobiles contribute dramatically to climate change via the generation of greenhouse gases and a variety of different pollutants. Greece, with 1,726,000 hectares of burned land due to increased temperatures and wildfires in 2023, ranks first for this year in terms of green land losses among European Union countries. In 2023, the extent of these burned areas increased by 420% compared to the average annual burned land area for the previous four years [31]. The rate of increase in the impacts of the climate crisis, especially when considering this year’s floods, with significant economic consequences and human casualties, is dramatic. This is not surprising, as greenhouse gases, which are increasing in the stratosphere at a rate closely tied to human activities, will continuously raise the planet’s temperature, resulting in increasingly larger natural disasters each year [32].
Many European cities are mobilized to become climate-neutral by 2050, but Greek cities will need to move even faster because the gap that separates them from the rest of Europe is substantial. In the field of passenger transportation, much more could have been accomplished in the past, but at least now it is clear which policies should be implemented. Sustainable urban mobility plans (SUMPs), outlining relevant strategies, have been developed for many cities [33]. Conversely, for freight transportation, the policies to be implemented will depend significantly on ongoing technological developments and the readiness of cities with narrow road networks to integrate them. Such adaptations regarding new modes of transport, such as e-bikes, electric cargo bikes, and drones, which are increasingly used in various urban areas around the world, are important because they do not generate congestion phenomena, while at the same time, consuming minimal energy, producing no pollution, and occupying very little public space [34,35]. The aforementioned transportation modes belong to the arsenal of sustainable mobility options that are essential for incorporation into freight transportation, replacing conventional cars. Moreover, it is worth mentioning that while electric bicycles are more flexible and faster than electric cargo bikes, they do have smaller carrying capabilities. Within this context, the question arises regarding whether the cargo bike’s higher transport capacity is useful in combination with drones when the corresponding capacity of relatively small drones is very limited. Hence, the successful adoption of schemes combining cargo bikes and drones will depend on the sizes of the drones used by transportation companies. Nevertheless, to the best of the authors knowledge, currently, there are no freight transport applications integrating cargo bikes and drones. On the contrary, a search of the existing literature showed that the comparison between different vehicles, as well as the combination of either drones or bicycles with conventional vehicles or trains, is a far more common practice [36]. This is a gap that the present study intents to fill by integrating cargo bikes and drones within five Greek cities. This article presents the results of research that investigates the role, benefits, and impacts of electric vehicles such as e-bikes, cargo bikes, and drones for combined freight transportation in tomorrow’s sustainable cities by taking the Greek cities of Athens, Kalamata, Iraklio, Patra, and Korinthos as case studies. The paper’s objective is to disseminate knowledge to researchers, the logistics sector in private industry, and policymakers. It aims to address specific challenges, facilitating the broader implementation of drones and cargo bikes. This, in turn, would enhance the value and benefits to logistics companies and communities affected by the limitations of traditional last-mile delivery methods.

2. Theoretic Background

2.1. Literature Review

The final leg of the delivery process, often referred to as the “last mile”, is of paramount importance in providing products and services to consumers. This stage accounts for a significant share of total supply-chain expenses, ranging from 13% to 75% of the total cost [37]. With the growing prevalence of e-commerce, which emphasizes technological advancements and convenience, there is increasing pressure on the last-mile distribution system, necessitating the development of new logistical solutions.
For this reason, in recent years, drones have been employed in diverse applications and services. Barmpounakis, Vlahogianni, and Golias [38] discussed the current uses and challenges of drone implementation and technology. Luppicini and So (2016) conducted a techno-ethical assessment of commercial drone usage within the framework of privacy, ethics, and governance [39]. Meanwhile, Otto, Agatz, Campbell, Golden, and Pesch (2018) carried out a comprehensive review of optimization methods for the civil applications of drones [40]. Originally designed for military purposes due to the risks faced by personnel in manned aircraft [41], since 2012–2013, the role of drones has been expanded beyond their military function [39]. Their applications, aside from military use, encompass parcel delivery [40,42], aerial inspections of items such as power lines and oil/gas pipelines, search and rescue operations [43], civil engineering-construction tasks [44], healthcare activities [45], agriculture [46], security and public safety [47], mining [48], and wireless sensor networks [49].
Cargo bikes offer a promising solution for improving the last-mile delivery approach, and they are already in use in some urban areas. These bikes are a specific type of electric commercial vehicle which are notably faster than cars when it comes to short-distance deliveries, as highlighted by Fontaine (2022) and Raeesi and Zografos (2022) [50,51]. What makes cargo bikes advantageous is their ability to bypass traffic congestion, take shortcuts through parks, and be conveniently parked on sidewalks or in dedicated parking places, reducing the need for long walks to make deliveries. Recent advancements in bicycle technology have played a significant role in promoting the use of bicycles for urban freight transportation. These advancements include the use of lightweight materials, the design of bikes with greater cargo capacity in terms of weight and volume, the development of cargo trailers, and the incorporation of electric motors that assist riders, especially on uphill routes. Consequently, this mode of transportation is gaining traction in major metropolitan areas, as observed by Munoz-Villamizar [52].
The shift from diesel vans to cargo bikes for parcel delivery has been proposed as a solution to address various urban logistics challenges. Melo and Baptista [53] noted that cargo bikes are primarily used for specific, smaller parcel deliveries. The combination of delivery vans and cargo bikes has been a subject of research within the field of operations research [54]. Cargo bikes offer several advantages over motorized delivery vehicles: (1) their compact size allows for easier navigation through narrow streets and quicker, closer parking to recipients; (2) they are electrically assisted, resulting in minimal noise and zero direct emissions; and (3) they have lower vehicle acquisition and maintenance costs, with comparable labor costs [55,56,57]. However, cargo bikes have limitations, including a smaller cargo capacity and a restricted range due to battery constraints. Furthermore, driver fatigue can be a concern for cargo bike operators [53]. The use of cargo bikes for goods distribution necessitates the establishment of smaller distribution centers, known as micro depots, in close proximity to customer locations. These micro depots receive deliveries from larger distribution centers via vans and subsequently utilize cargo bikes for last-mile delivery. Numerous studies have examined the potential impacts of cargo bikes using various freight models, primarily focusing on solving vehicle routing problems [53,58,59,60,61,62].
These tour-based models are designed to optimize the organization of delivery routes to accommodate a specified number of parcels, while also considering vehicle characteristics. Previous research, as cited in references [58,62,63], has indicated that cargo bikes typically have the capacity to carry 10–25 parcels (equivalent to about 5 to 15% of what light trucks can handle) and travel at speeds ranging from 10 to 25 km/h. According to findings by Zhang et al. [62], nearly replacing vans with cargo bikes delivery to commercial clients could result in a 28% reduction in distribution costs and a 22% reduction in emissions associated with parcel delivery. However, for cargo bikes and drones to become more popular, it is essential for the urban environment and infrastructures of cities to act as as allies to enable these types of sustainable freight transportation modes.

2.2. Urban Environment and Infrastructures Related to Cargo Bikes and Drones

Urban planning and environmental parameters play a significant role in facilitating or hindering cargo bike and drone deliveries in a city. Hence, the identification of potential planning and infrastructural problems is of paramount importance for the successful adoption of cargo bikes and drones and the establishment of sustainability in modern cities. There are two primary categories of potential issues related to the planning and creation of infrastructure for drones. On one hand, there are concerns about the requirements for urban planning processes. Local planning authorities are seen as unprepared to address the challenge of incorporating a new dimension of mobility into existing planning practices [64]. Furthermore, there is a need for participatory planning practices.
Apart from these planning considerations, there is a clear absence of well-defined requirements for the physical infrastructure [40]. Generally, the practice of drone delivery does not demand extensive infrastructure. Drones have the ability to land on various types of terrain, whether concrete or dirt, and can be recharged using standard power outlets akin to those used for other devices. Nevertheless, as the popularity of drone delivery continues to grow, the requirements for landing facilities and charging stations may evolve. There will be a necessity for supplementary infrastructure in strategic locations, including: (a) vertiports, which function as recharging, takeoff, and landing platforms for drones; (b) service centers dedicated to drone inspection and repair; and (c) distribution and receiving stations, including options like lockers, boxes, or platforms to receive items delivered by drones [65].
On the other hand, cargo bikes, due to their greater length and width compared to conventional bicycles, require wider roads with larger turning radii for ease of maneuverability. However, most cities lack infrastructure suitable for cargo bicycles, which also affects user safety perceptions. Users have expressed reluctance to use the bikes, especially in mixed traffic situations. Another very important factor is the width of existing bike lanes, which often does not account for the dimensions of cargo bikes. Design manuals for cycling lanes typically overlook the specific requirements of cargo bikes, as observed by Rudolph and Gruber [66]. Many cities do not consider cargo bikes within their cycling infrastructure planning. Moreover, the quality of road surfaces also plays a crucial role and should be considered in order to improve the feeling of safety and comfort of cyclists [67]. Parking constitutes a critical factor for the frequent use of cargo bikes, with cargo bikes showing a clear competitive advantage over other types of delivery vehicles, such as vans, by reducing the time spent searching for parking spots during deliveries [56]. However, another important hindrance for the adoption of cargo bikes is the lack of public charging stations [68]. This is of maximum importance for electric cargo bikes, as battery capacity is vital, and quick in-between charging may be necessary during a delivery.
Within this framework, it should also be highlighted that cargo bikes are most efficient in areas characterized by higher population density, which can be indicative of increased commercial activity [61,63]. These city centers tend to exhibit significant economic activities, attracting a large number of people; therefore, traffic congestion is a common challenge, making e-cargo bikes a favorable option for addressing delivery needs.

2.3. Security Issues Related to Cargo Bikes and Drones

Last-mile drone logistics contribute 25–30% of greenhouse gas emissions in the transportation sector [69]. Cargo drones have the capacity to reduce energy consumption by 94% and 31% and GHG emissions by 84% and 29% per package delivered by diesel trucks and electric vans, respectively [70]. For light-weighted parcels weighing less than five pounds, the energy required to power drones is 94% less than the energy consumed by delivery trucks [71]. On the other hand, drone activities are more energy-sensitive than conventional vehicle operations [72]. The drone’s autonomy can be affected by environmental factors and by the weight of the package that needs to be transported. The existing research indicates that the major environmental element forcing cargo drones to expend more energy, or hindering them in completing their missions, is the velocity and direction of the wind [73]. Strong winds create greater resistance, which requires the drone’s propulsion system to work harder to maintain forward motion. Nevertheless, when the wind blows in the direction of the drone’s travel, it can potentially shorten the total flight time by taking advantage of the speed increase. Moreover, air density and temperature may affect battery performance while adverse weather conditions can increase the energy consumption rate up to 50% [74].
Logistical safety in regards to cargo drone deliveries over densely populated areas is of paramount importance. The International Civil Aviation Authority (ICAO) declares the need for harmonized international terms and principles to guide the civil use of drones [75]. The Hellenic Civil Aviation Authority has established a clear and regulated airspace for drone operations in regards to air traffic control. There are three operational categories that determine drone regulations, based on the weight of the drone and the intended operation. The cargo drone is designed to operate within the “specific” category. To determine the necessary level of rigor in the specific category and to obtain operational approval, a risk assessment must be conducted for each operation. If the operation falls within the scope of one of the published Predefined Risk Assessments (PDRA), it allows the applicant to quickly develop an operator manual and produce the evidence of compliance using the PDRA table to demonstrate that the operation is safe.
Several studies have created location-based maps that quantify the risks to the population in urban areas, including the layers of population density, sheltering factors, no-fly zones, and obstacles [76,77]. In Greece, the Drone Aware—GR (DAGR) is a real-time UAS (drone) information system that provides situational awareness to UAS pilots and operators by informing them about flight limitations and allowing them to submit flight requests. The system falls under GIS services and comprises additional resources concerning the acceptance or the rejection of a flight request and the provision of aeronautical data [78].
The access to low-level airspace, especially in urban areas, dictates specific risk mitigation measures related to unmanned traffic, loss of control of communication, and citizen protection. A higher risk of accidents will occur when more drones are active in the sky, threatening assets such as infrastructures (buildings, public areas) and citizens. To prevent traffic flow accidents, a novel drone-following model, capable of maintaining a safe distance between drones, was presented by Dung et al. [78]. The longstanding approach to managing risk in congested airspace involves a controller, comprised of an individual or a team, with responsibility for a designated airspace; considerable authority over the pilots of aircraft within that airspace; and sufficient capacity to compute paths for all aircraft within the airspace, considering both the intentions of the pilots and current safety standards [79]. Cargo drones must carry VHF/UHF antennas and radio receivers, as well as motion-tracking sensors to perform obstacle detection and to activate avoidance procedures. It must be ensured that a permanently functioning data link is in place before entering more densely populated areas [80]. Missions are more prone to failure with higher destination altitudes, particularly when combined with stricter maximum allowable flight altitude, which eradicates legally viable airspace above high buildings en route from depot to customers [81]. Thus, accurate values should be provided for all location-based parameters to allow for the calculation of safety margins.
As for cargo bikes, there are also some safety concerns and perceived risk issues that need to be considered in modern day cities in order to promote and establish the paradigm of green logistics. Existing bicycle infrastructure (either as bicycle lanes or separated cycling routes) is one of the main factors for increasing safety (both objective and subjective) for cyclists [82]. Lack of lighting increases the likelihood of an accident and is often a cause of road crashes. Moreover, street lighting elements (horizontal reflective markings, light poles, etc.) are beneficial because they make visible points that would otherwise be dangerous and could cause cyclists to fall [83]. Additionally, the increase in cyclists risk appears to be proportional to the number of road traffic lanes, as more accidents occur on roads having more than two traffic lanes per direction [84].
The feeling of safety is also lower on two-lane roads in comparison to one-lane roads. The width of the road significantly affects safety, with wide roads increasing the likelihood of an accident to occur. In particular, the research of Hamann and Peek-Asa (2013) showed a 37% increase in the probability of an accident for every 3 m increase in the total width of the road [84]. Also, the parameter of slopes is directly related to lower safety levels, consequently constituting an inhibiting factor for bicycle utilization, as increased slope considerably increases the probability of an accident and the likelihood of injury to cyclists [85].
Furthermore, intersections (signalized or not) constitute high-risk points for cyclists. Consequently, the number of accidents increases in accordance with the number of signalized, as well as the unsignalized, intersections that a cyclist encounters on his/her route, while intersections are even more dangerous in suburban areas because higher speeds can be reached in these areas [86]. Increased vehicle traffic is a major factor in reducing the safety of cyclists. Traffic load is significantly associated with feeling unsafe, in contrast to light traffic roads, which were judged to be the most suitable environments for cyclists [87]. Finally, the quality of the road surface constitutes another environmental parameter that affects the utilization of cargo bikes. Its importance is highlighted by Ghekiere et al. (2018), and unsafe road surfaces are associated with a high accident rate [87].

2.4. Efficiency and Environmental Impact

The efficient and cost-effective transportation of goods often involves using freight rail networks and container ships. However, a significant challenge arises when these goods arrive at high-capacity freight stations or ports and need to be transported to their final destinations. This leg, referred to as the last mile, which entails the distribution of goods from a certain point, a collection center, to either the final recipient or a hub/center in his/her proximity, has piqued the interest of numerous researchers because, until now, it has been the least efficient and most complex segment of the supply chain, as it can account for a substantial portion—up to 53%—of the total shipping costs [88,89,90]. The costs and inefficiencies associated with last-mile delivery have been exacerbated by the rapid growth of e-commerce and consumer demand for faster and more cost-effective delivery.
Leading courier companies such as UPS, FedEx, DHL, and SF have achieved business growth in regards to parcel delivery services by focusing on meeting consumer demands for swift direct-to-doorstep delivery [91]. The transportation landscape has been enriched by various innovative modes of transportation as alternatives to conventional delivery vehicles, including electric trucks, electric bikes, e-cargo bikes, driverless carts, drones, and more [92,93].
Since electric bikes, electric cargo bikes, and drones are all electrically powered, thus eliminating emissions, it would be a positive step for them to initially handle some freight transportation, even in a separated and isolated way. However, this use of electrically powered vehicles would be inadequate because it would not be comprehensive. Neither electric bikes nor electric cargo bikes have a long range (not just due to their battery life, but also because of the rider’s endurance) to cover internal distances in large cities, and drones cannot penetrate urban areas due to flight safety restrictions for protecting overpopulated areas. It would be much more effective if these modes of transportation were used in cooperation. For example, combining the use of drones with electric bikes or electric cargo bikes could allow each of them, with minimal environmental impact, to cover the areas of the cities and their regions that are best suited to their performance.
This analysis examines the last-mile delivery process, with an emphasis on the integration of cargo bikes and drones [94,95]. This integration seeks to create a sustainable and efficient urban delivery network. To evaluate the potential benefits of this network, it is essential to consider the economic, environmental, and social sustainability aspects. Economic and social sustainability involves factors like efficiency, safety, and societal impacts, while environmental sustainability focuses on pollution. The following table (Table 1) shows the potential benefits resulting from the cooperation of cargo bikes and drones.
In summary, combining cargo deliveries using bicycles and drones is a promising solution for increasing the efficiency and reducing the environmental impact of urban logistics. Effective implementation requires thorough planning, clarification of regulatory issues, and the creation of an integrated supply chain network. If implemented effectively, this approach can contribute significantly to a more sustainable and efficient urban freight transportation system, taking into account economic, environmental, and social sustainability aspects. In Figure 1, Figure 2, Figure 3, Figure 4 and Figure 5 seen in the following lines can be appreciated integration of cargo bike and cargo drone delivery in urban and peri-urban areas of five Greek cities.

3. Methodology

In this section of the paper, a brief description of the research framework will be presented to familiarize the reader with the complete methodological process. First of all, the hardware requirements for the implementation of the research consisted of two cargo bikes, along with one cargo drone, that permitted the recording of routes. These modes of transportation, along with their related features, are detailed in the following table (Table 2):
The second step of this approach considers the customization of the selected cargo bikes (mainly) and drones in order to facilitate the implementation of an empirical study based on real scenarios. For example, each of the two cargo bikes was equipped with a digital camera, along with a smart phone device (Android operating system) with the capacity of geolocation and the capacity for installing and using the free mobile phone application, Sensor Logger. Additionally, measurements regarding acceleration, geolocation, speed, noise, proximity, altitude, direction of the device, heart rate, time stamp, and optional accompanying text could also be obtained. On the other hand, the cargo drone utilized in this context comes pre-equipped with satellite positioning systems: GPS with the Global Navigation Satellite System (GNSS), and integrated GLONASS to enhance accuracy. The 6-DoF Inertial Measurement Unit (IMU) plays a crucial role in overseeing the drone’s orientation, acceleration, and angular velocity. To facilitate long-distance communication and control beyond the default 10 km antenna range, beyond visual line of sight (BVLOS), 4G connectivity has been incorporated.
Additionally, the flight control system and the communication component of the drone feature a Pixhawk 3 autopilot with a GNSS module, along with onboard electronics such as a power management system and data communications module. The flight control system operates on the adaptable and parameter-tunable open-source software architecture of PX4. A YR16S transmitter and a compatible Sky Station YR16S receiver, supporting 20 channels, uses Datalink technology for data transmission. The antenna, with a 10 dBi gain, has a range set at 10 km in areas without 4G connectivity, and it supports real-time image transmission from an attached camera. The cargo drone’s firmware (Copter version V4.4.4) and ground control station constitute the final components. The firmware is crucial for the prototype’s safety and performance, running on the onboard computer platform to manage functions such as control mechanisms, stabilization, flight policies for obstacle avoidance, safety features, and communication protocols. The firmware supports the CAN communication protocol, recognizing connected devices based on the needs of the ground control station. Data transmission is encrypted to ensure the confidentiality and integrity of information. Furthermore, the firmware incorporates an analogue-to-digital converter (ADC) to measure analogue signals like voltage and current, converting them into digital data for processing by the ground station software or autopilot. The ground control station serves as an interface for monitoring, mapping, and flight planning under various conditions. Mission Planner by Arduino (1.3.80), an open-source software compatible with the autopilot architecture, was installed on a laptop for this purpose.
By subjecting a custom-made cargo bike and a cargo drone to varying conditions under different delivery conditions, empirical data that reflect their real-world performance under different environmental, regulatory, and safety constraints are gathered and analyzed.
The consideration of the geographic locations where the research will be implemented comprises the third step of the present approach; hence, five (5) Greek cities were selected for lightweighted deliveries on predesigned routes using cargo bikes and drones. The aforementioned Greek cities are described in detail below:
1. The Functional Urban Area (FUA) of Athens, which includes numerous municipalities in the region of Attica, with a total population of approximately 3.6 million people [96], where more than 70% of the nation’s domestic courier services, deliveries, and pick-ups are executed daily, according to the Hellenic Telecommunications and Posts Commission market report for 2021 [97]. Therefore, the FUA of Athens was selected as the main urban area to test cargo bike and drone routes. The FUA of Athens includes: (a) the ancient and modern urban core of Athens and Pireaus (Pireaus is a port city located 9 km from Athens), where 1.5 million people live in an area of approximately 100 sq.km. (population density 15,000 people per sq.km); (b) the dense expansions, created during the 20th century, to the south, west, and north of Athens, where 1.6 million people live in an area of approximately 200 sq km (population density approximately 8000 people per sq.km); and (c) the sparsely populated commuting zone on the east of the Attica peninsula, extending beyond the Penteli and Hymettos mountains (Regional Unit of East Attica). In fact, the last area consists of villages which have gradually been transformed into satellite cities of Athens due to urban sprawl. These areas consist of a densely populated urban core (center of the traditional village) and a sparsely populated area around the core. Due to the high number of airports and heliports, a large part of the Athens FUA area is a drone restricted area. In Athens, due to the high urban densities and the extended drone restriction areas, in this study, deliveries depended mainly on the cargo bike.
2. The FUA of Irakleio includes the city of Irakleio and its commuting zone. With a total population of 220,000 people, it is the third-largest urban area in Greece [95] and the capital of Crete in the south of Greece. The FUA of Irakleio was selected to test the cargo—drone scheme in a medium-sized insular metropolitan area. Again, as in the case with Athens, Heraklion has gradually evolved from a medieval city into a metropolitan area, with dense expansion in the nearby area outside the urban core (a city center surrounded by medieval walls). In recent years, following the massive increase in car use (which occurred in Greece only after the 1970s), the FUA has gradually extended up to 25 km outside the city center, which includes villages and small towns.
3. The FUA of Patra, comprising the city of Patra and its commuting zone, is the most populated city of the Peloponnese Peninsula, located in the southwest part of country’s mainland, with approximately the same population as Irakleio (224,372 residents). It was selected to test the cargo bike—cargo drone scheme in a linear metropolitan area. Patra is a linear harbor city, and due to the mountainous inland, its dense areas extend in a north-south direction along the seashore. In recent years, the metropolitan area has gradually become car-reachable by smaller villages (up to 35 km away from the city center) in the flat and hilly area southeast of the city.
4. The FUA of Kalamata includes the city of Kalamata and its commuting zone. It is the second-most populated area of the Peloponnese Peninsula, with 75,000 residents. Also, as a result of urban sprawl due to rising car use, in Kalamata, the FUA covers an area up to 25 km from the city center. Kalamata has a quite extensive cycling network covering the city center and the seashore (the part of the densely populated city where most activities occur). Kalamata was selected to test the cargo bike–cargo drone scheme in a bike-friendly, medium-sized city.
5. Finally, the FUA of Korinthos comprises the city of Korinthos, which is the third-most populated city of the Peloponnese Peninsula (approx. 34,000 residents). Korinthos is surrounded by agricultural land, and its FUA is rather small. A big part of the city center is pedestrianized, and around the pedestrianized area, radial cycle tracks connect the dense areas of the city with the city center. Korinthos was selected to test the cargo bike—cargo drone scheme in a bike-friendly small urban area.
The main criteria for the selection of the aforementioned five Greek cities are as follows:
  • Previous Sustainable Urban Mobility Initiatives: We decided to choose cities that have implemented similar initiatives in the past, as within these plans, sustainable freight transport approaches and green logistics can be adopted. Learning from previous experiences can provide valuable insights for the current study.
  • Public Acceptance: In order to facilitate the transition towards the green logistics paradigm, it is of paramount importance to gauge the level of public acceptance and awareness of sustainable delivery methods, as cities with a positive attitude toward innovative transportation solutions can be more receptive to new approaches. The population within the selected cities has been proven to be sustainable-mobility friendly and ready to experiment with cargo bike and drone initiatives.
  • Safety Considerations: The assessment of safety aspects for each city, including traffic conditions, pedestrian zones, and the potential risks associated with the introduction of cargo bikes and drones, is an essential issue. For this reason, in this study, the five Greek cities that were selected present a high risk of accidents.
  • Collaboration with Companies: The considered cities constitute cases in which delivery service companies were open to collaborating on the study. This can provide real-world scenarios and data for the implementation of cargo bikes and drones in the delivery sector. In our case, the selected courier company had offices in all five Greek urban areas chosen for the study, facilitating the implementation of real scenarios.
  • Urban Density: All of the selected cities exhibit a high concentration of inhabitants, generating elevated mobility demands and new freight transportation requirements. Moreover, the considered cities show varying levels of population density, facilitating an understanding of the impact of cargo bikes and drones in different urban settings.
  • Transportation Infrastructure: The evaluation of the existing transportation infrastructure in potential cities is another important factor to be considered. Cities with a well-developed infrastructure may possess different challenges and opportunities compared to those with less-developed systems. This is why the capital of Greece (Athens) was chosen, along with the capital of the biggest island of Greece (Iraklion), which is a busy touristic attraction due to the existence of the historic city, per se, as well as other historical areas, such as Knossos, in the wider geographical area. In addition, three relatively big cities sharing a coastal front (Korinthos and Kalamata) and which, apart from Patra, do not possess steep slopes, were selected within the continental body of Greece.
The next step of the present empirical approach is related to the definition, via a profound literature review, of the urban environment’s variables that can positively or negatively affect the usage and the adoption of cargo bikes and drones in order to take these into account while performing route recording. The most important variables concerning the safety and comfort of cyclists in regards to cargo bikes proved to be cycling infrastructure, the necessity for left turns, the strong interaction between cyclists and pedestrians in pedestrianized streets, heavy traffic (especially when there is an interaction with heavy vehicles), road surface quality, slopes, and intersections. In the case of drones, the most important variables were energy consumption, payload, and weather conditions. Hence, in order to collect data related to the previously mentioned important variables for cargo bike and drone usage, allowing researchers to extract conclusions based on real case situations, random routes were designed based on two parameters. The first is bike or drone battery capacity, and the second parameter is the stamina required by a young to middle-aged bike rider to complete a route without affecting delivery efficiency.

4. Results

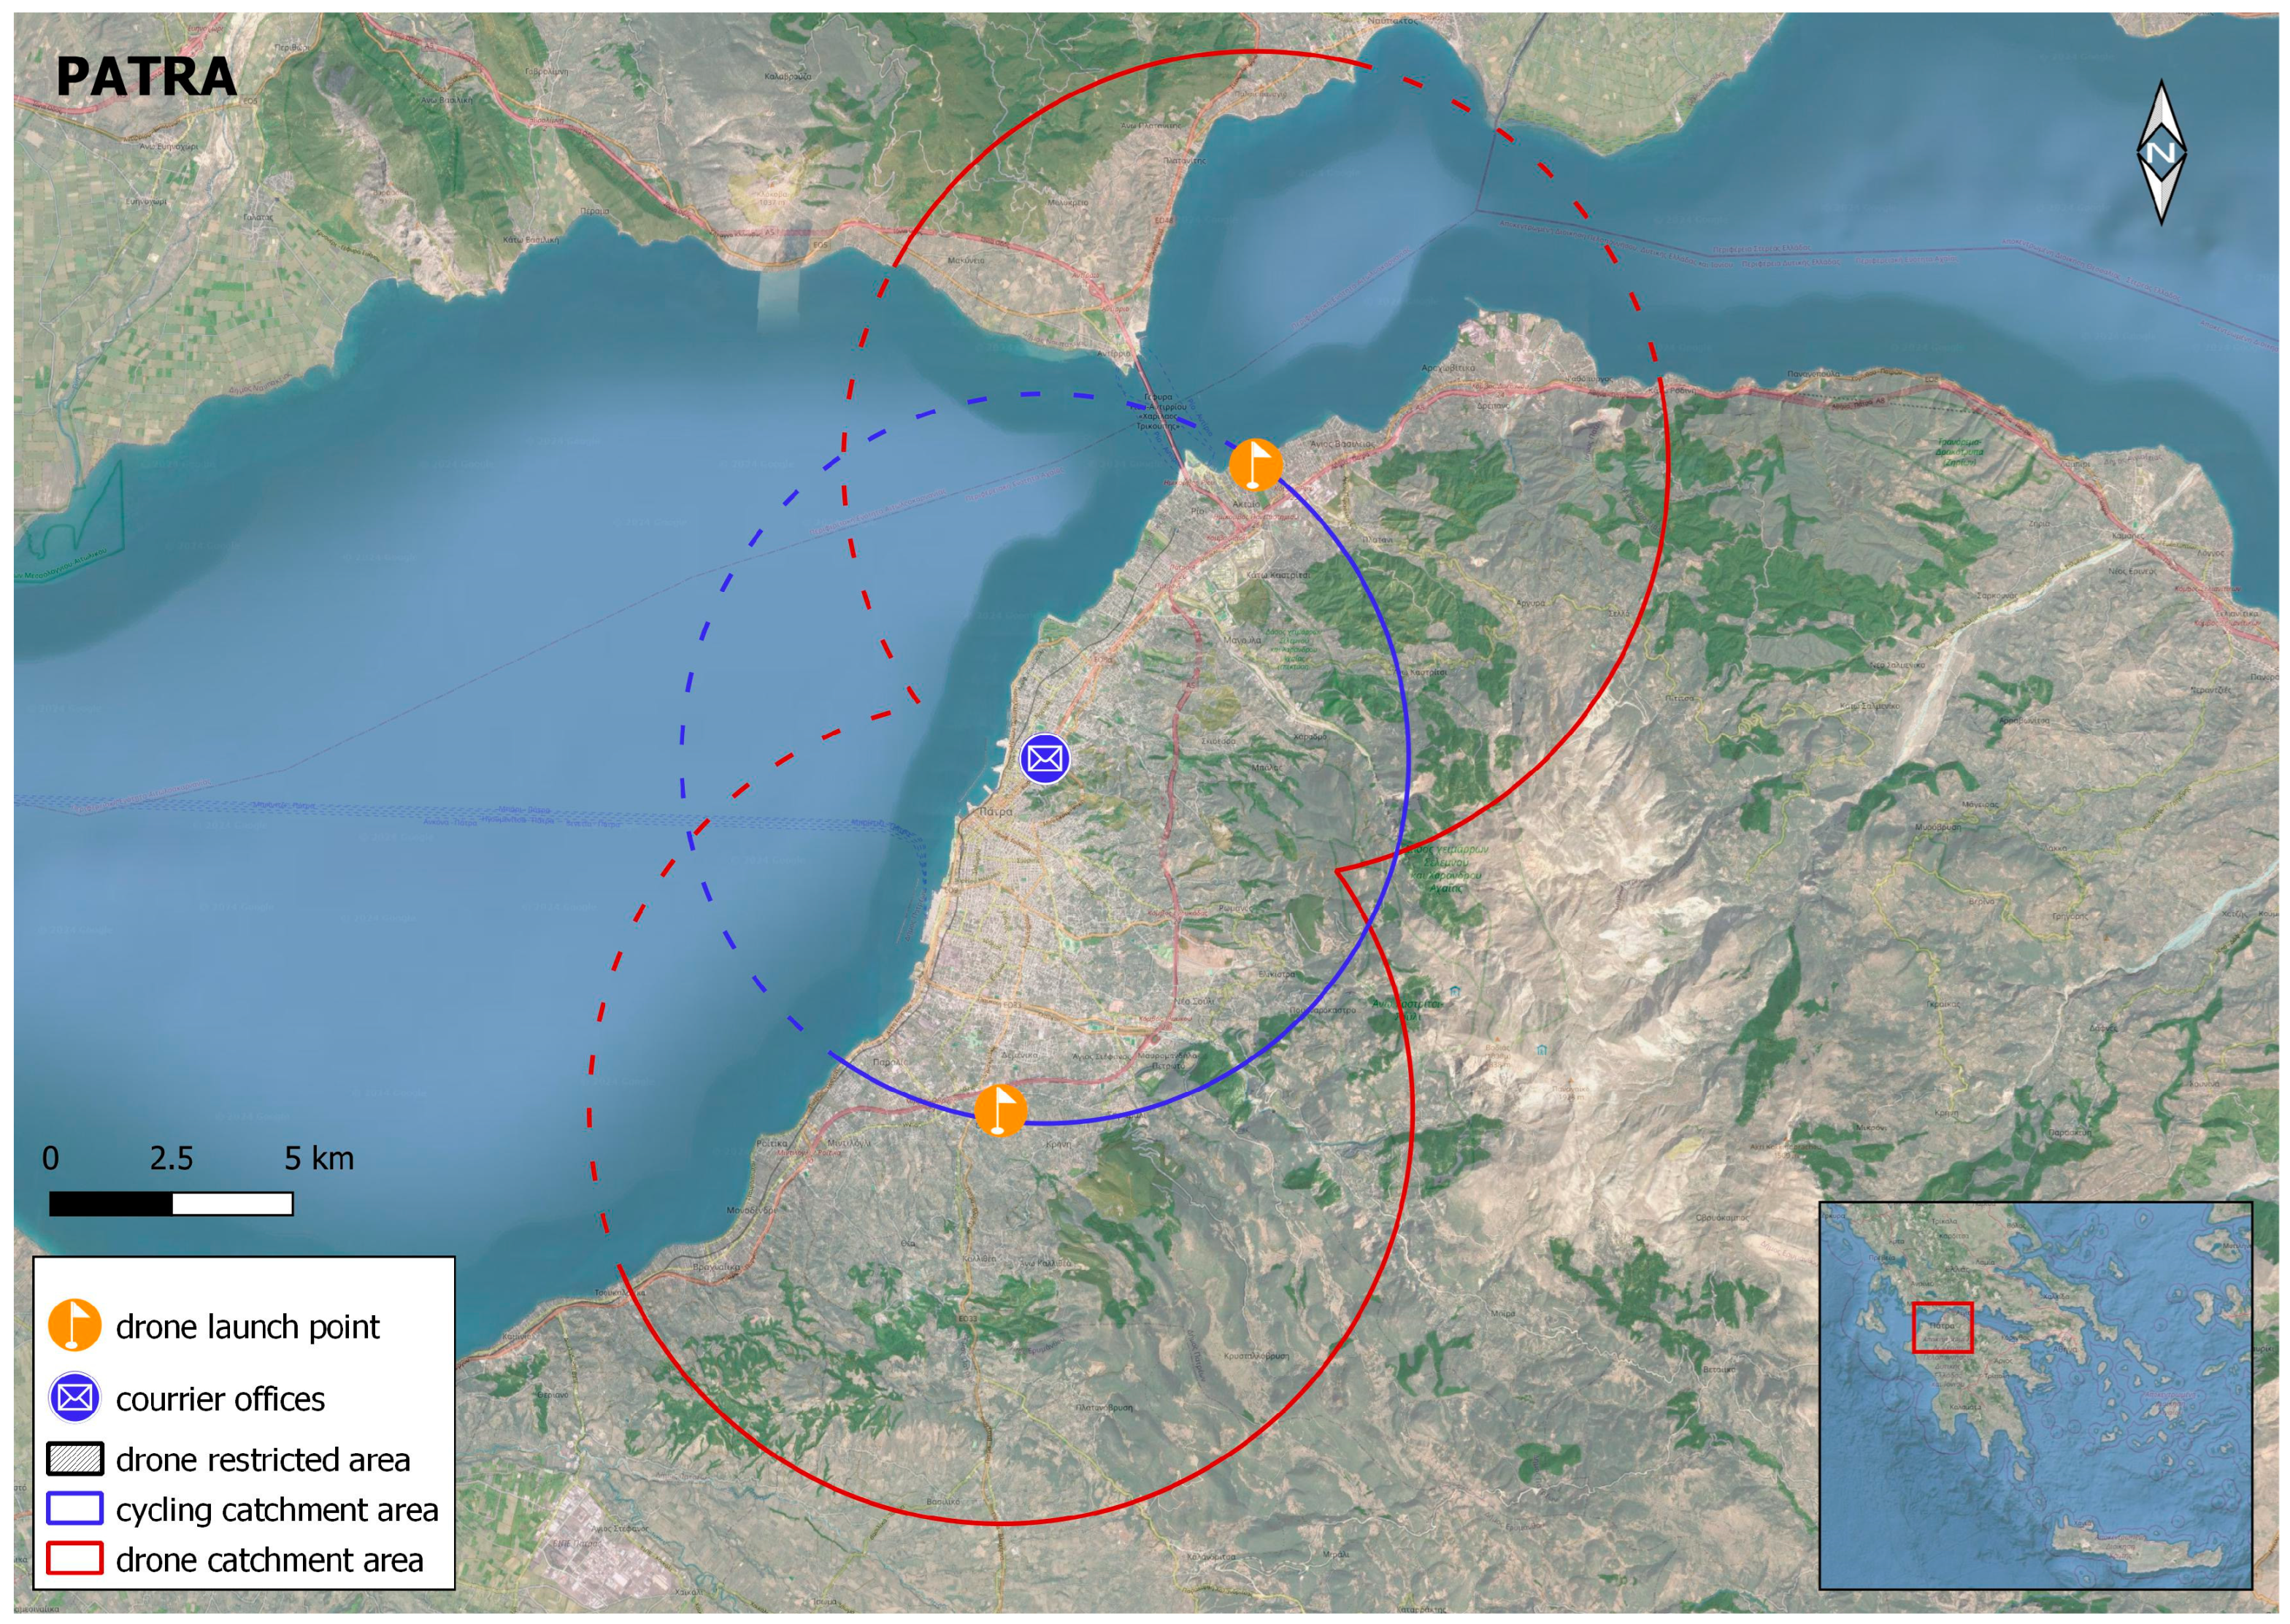
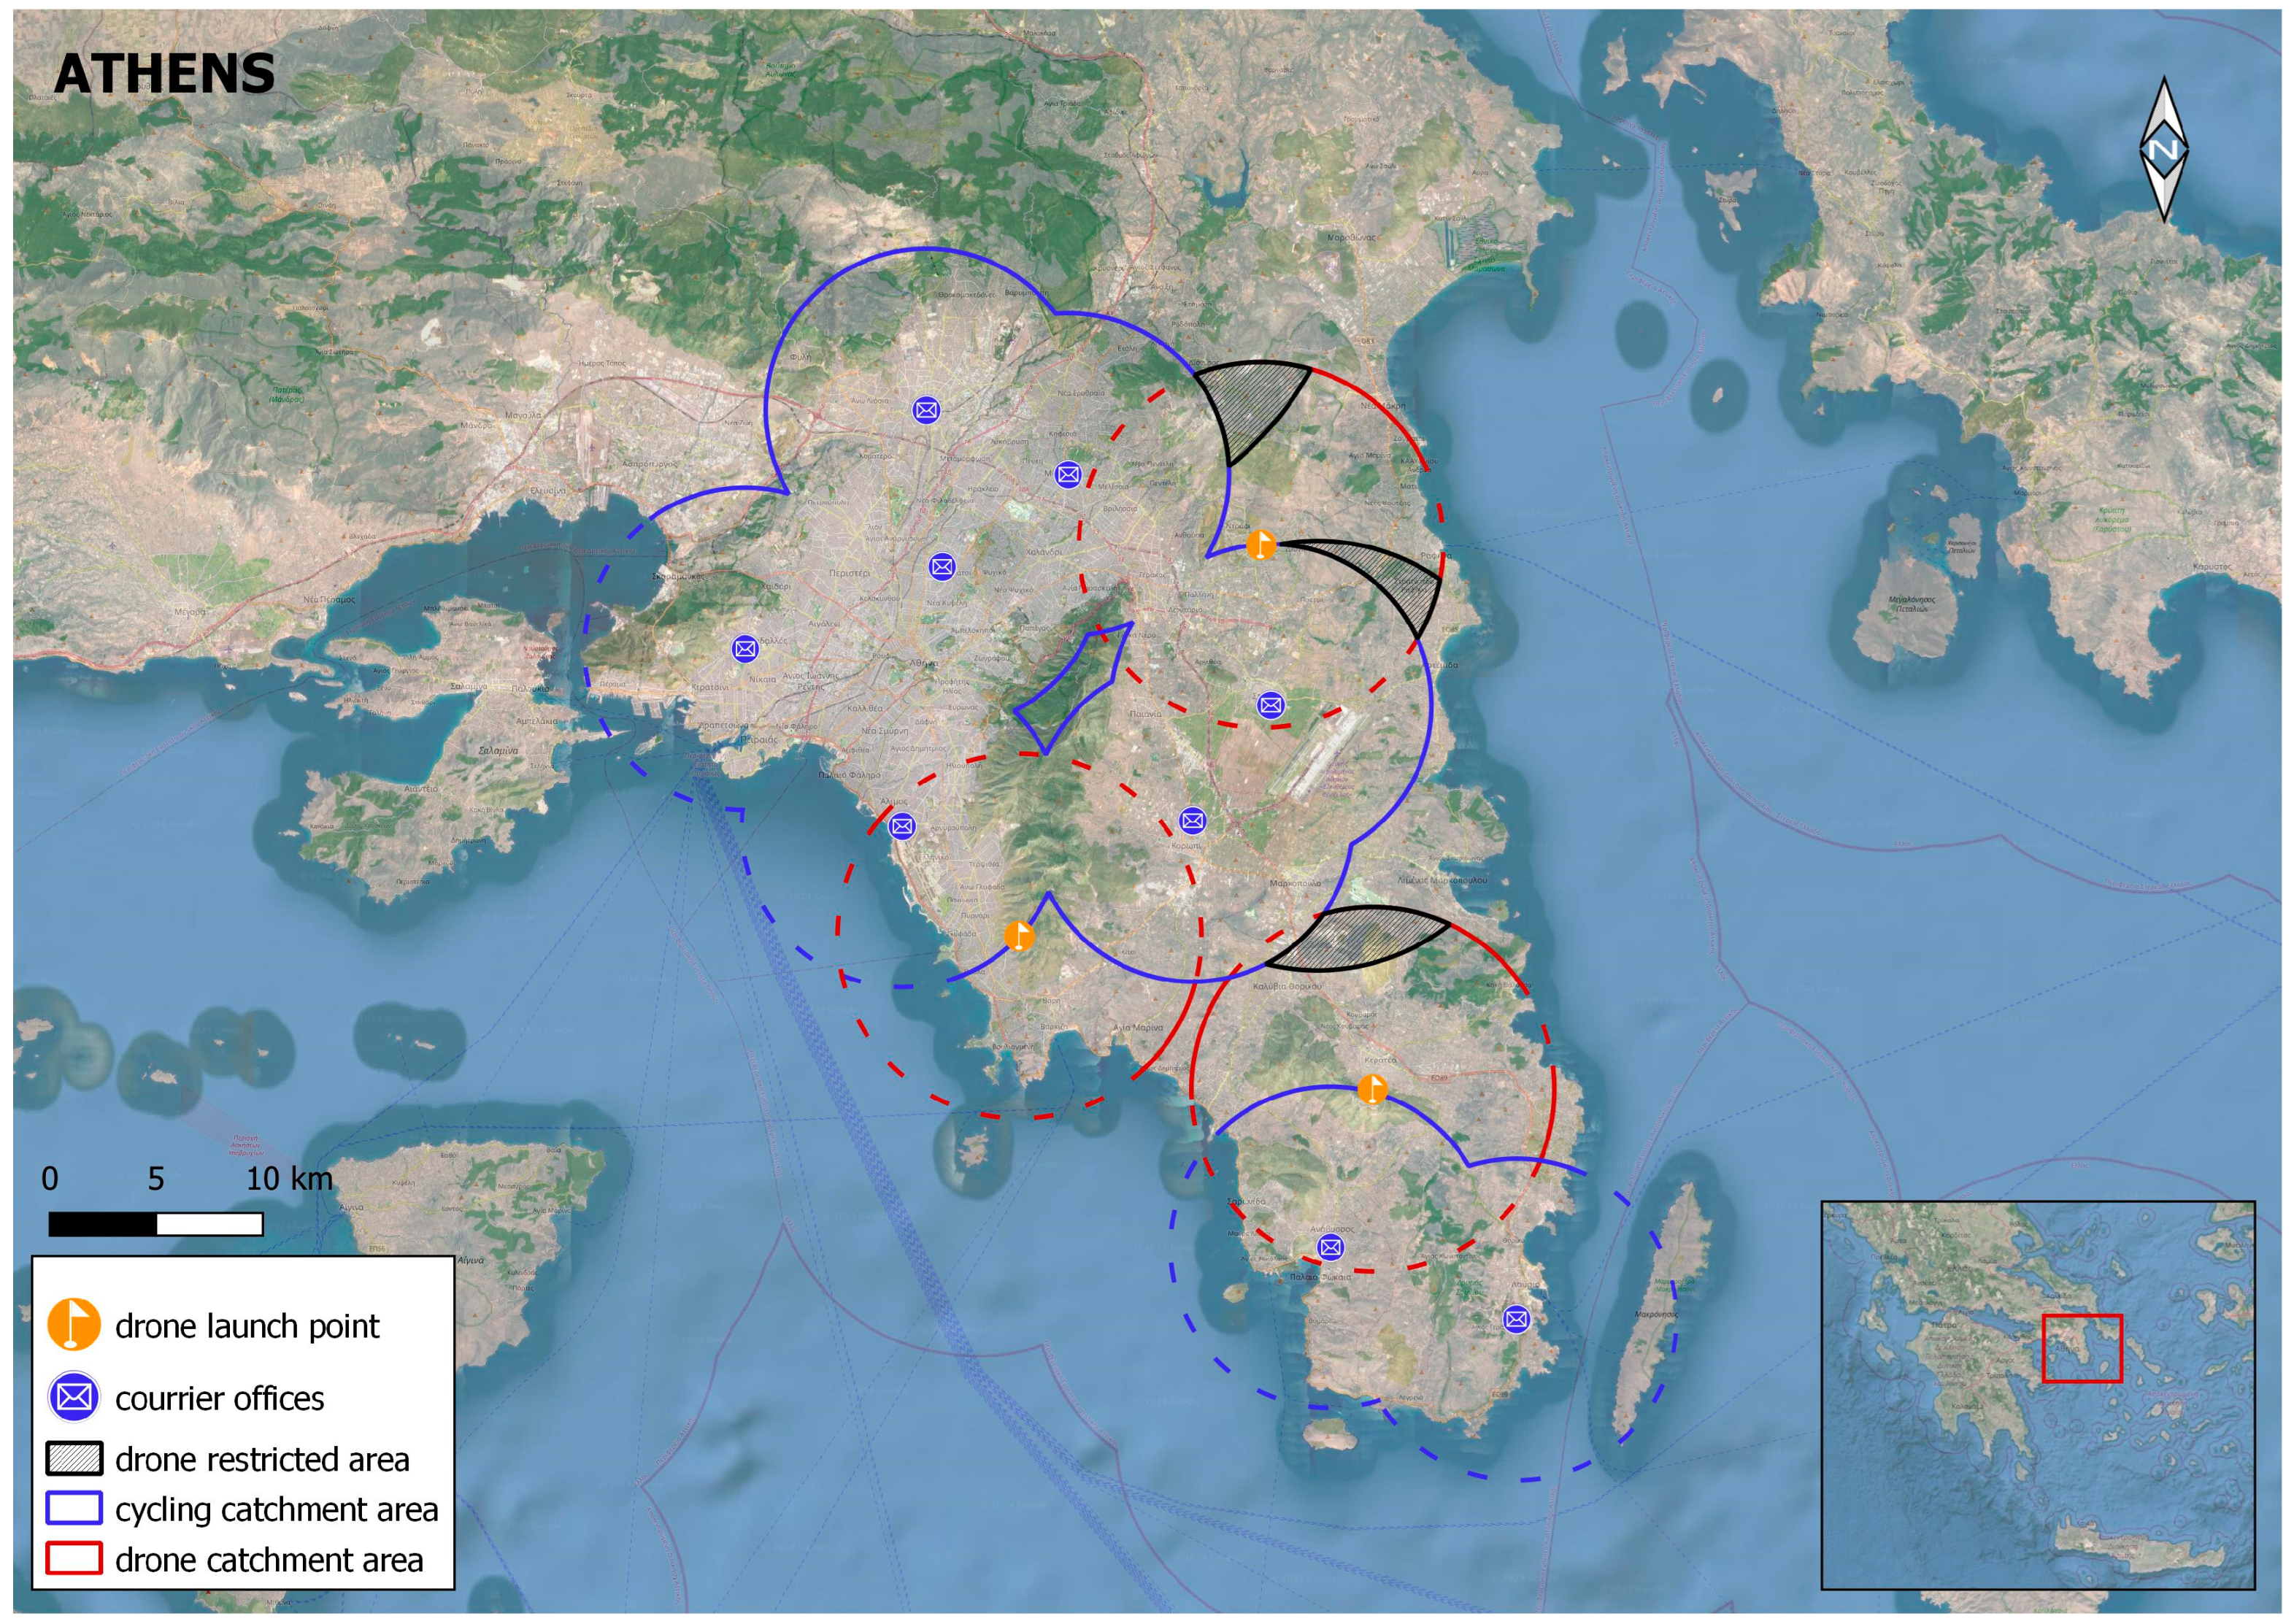
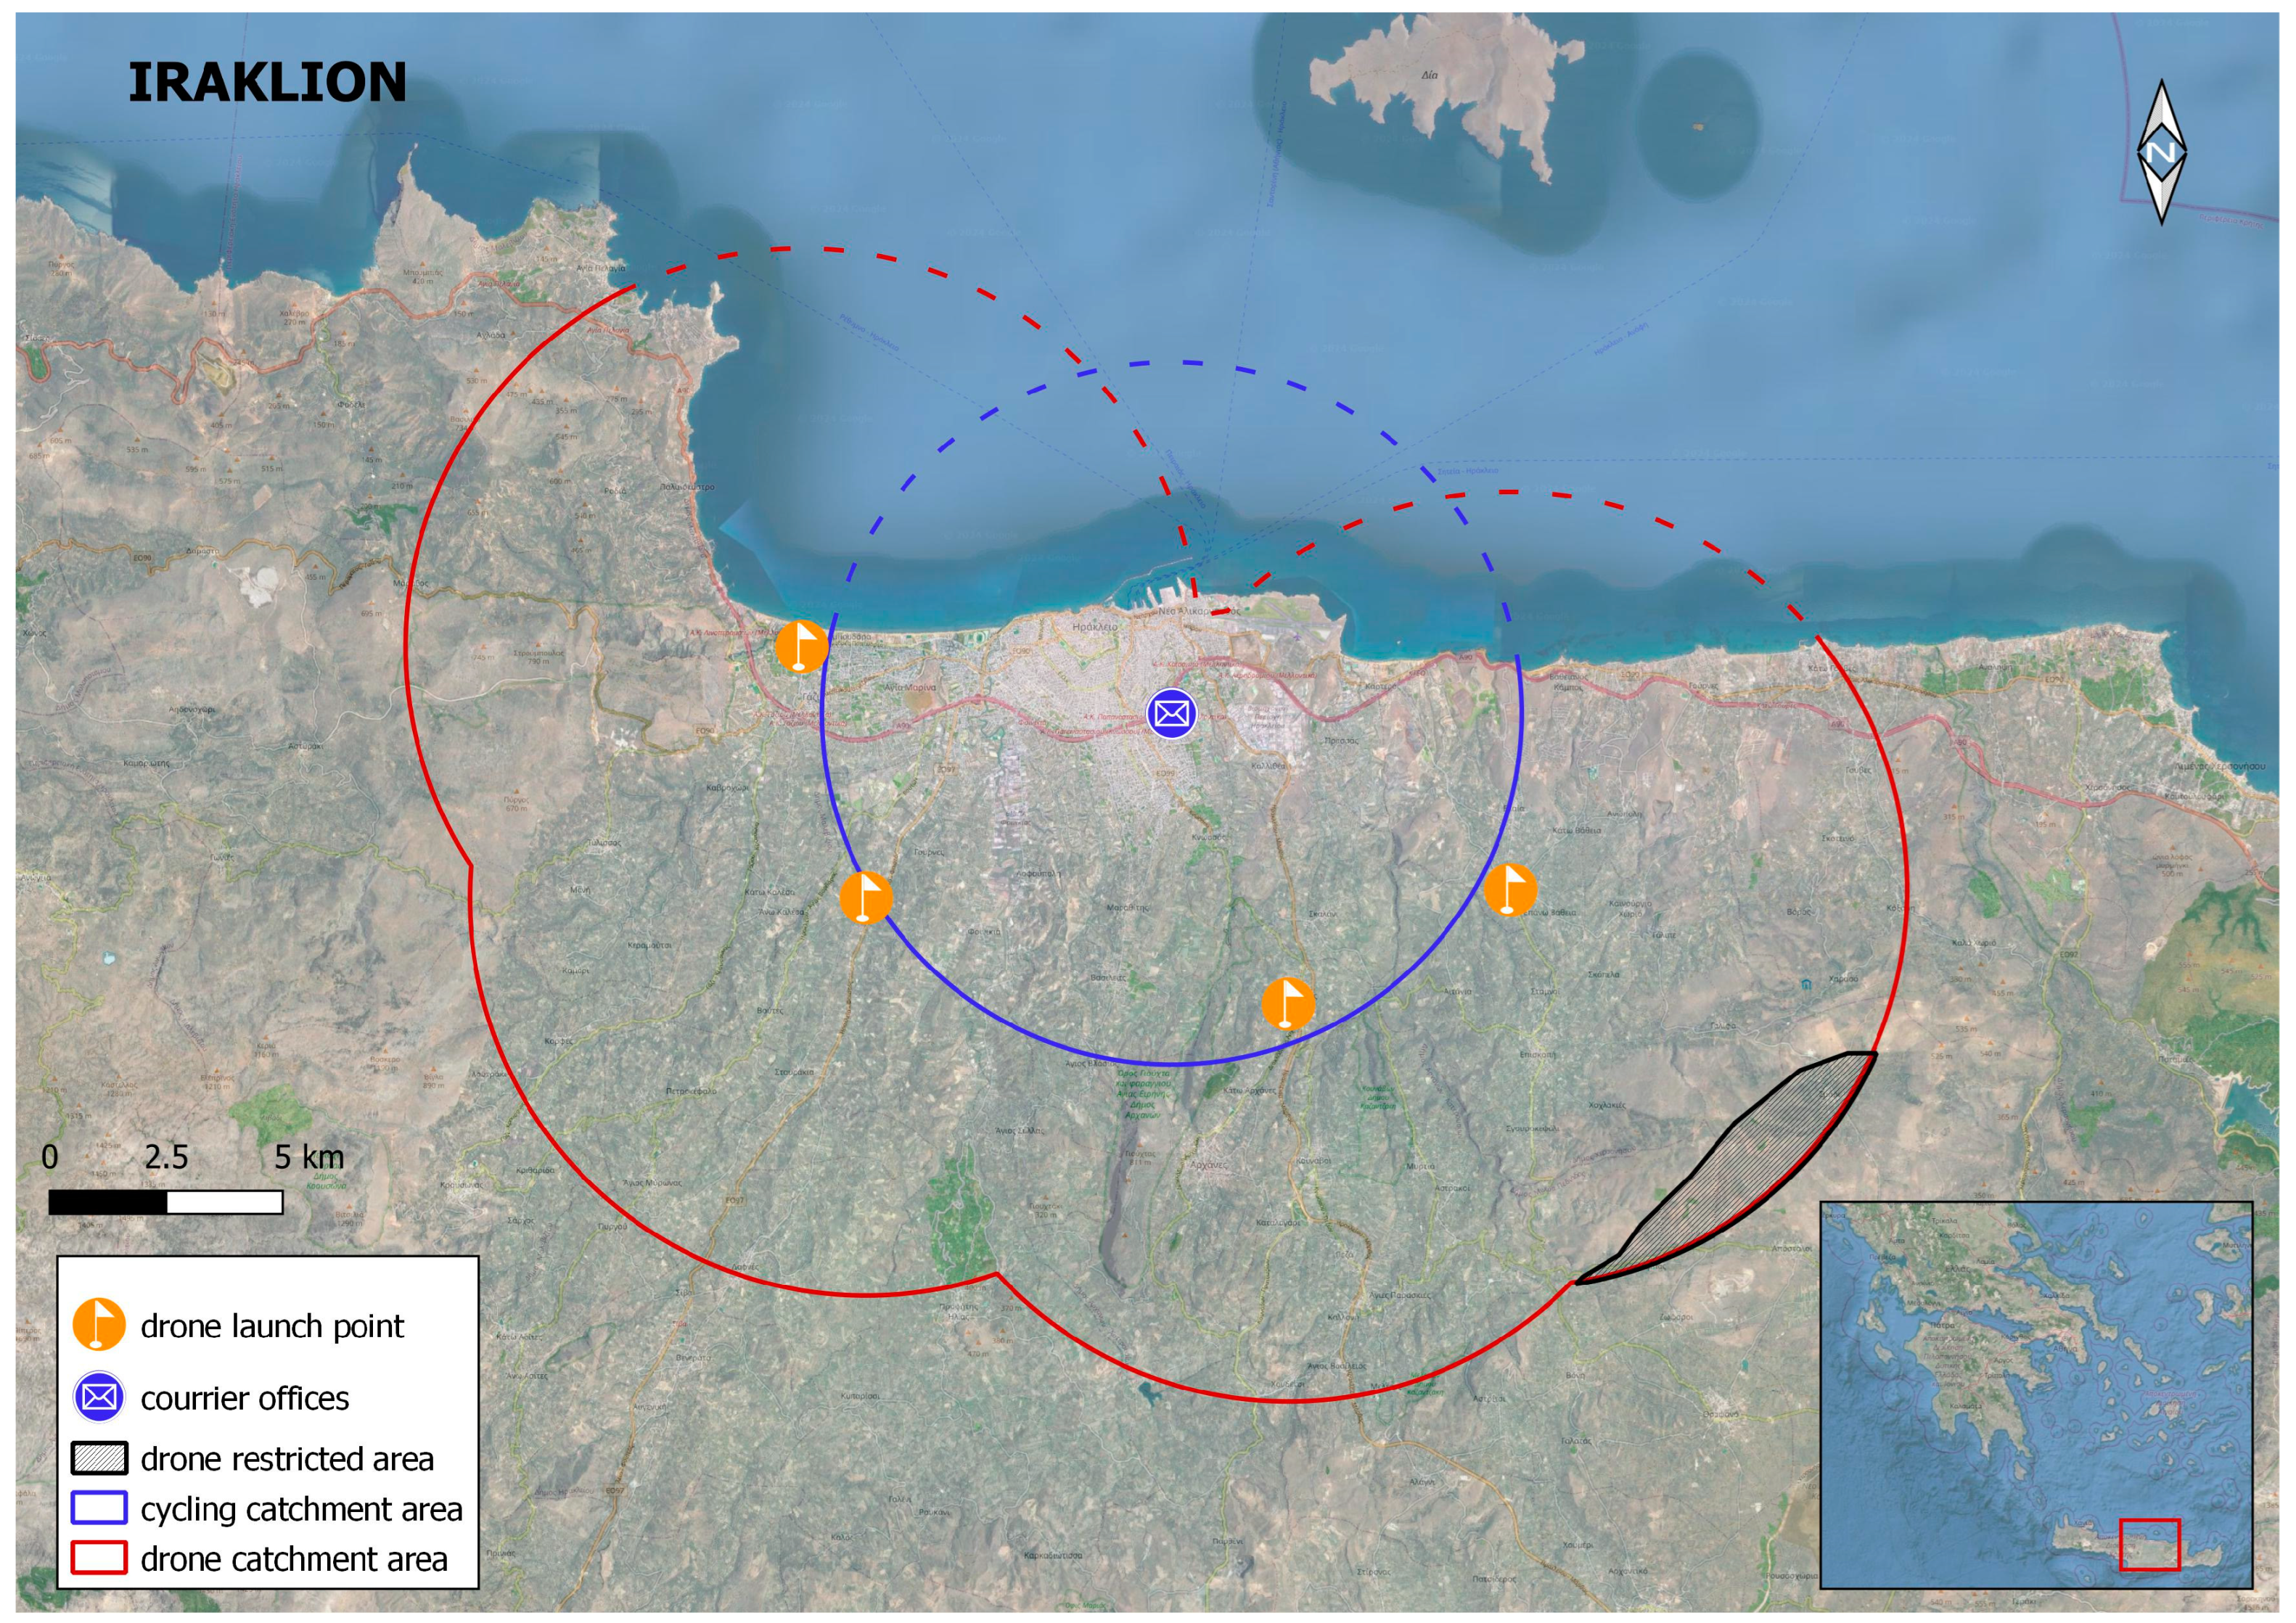
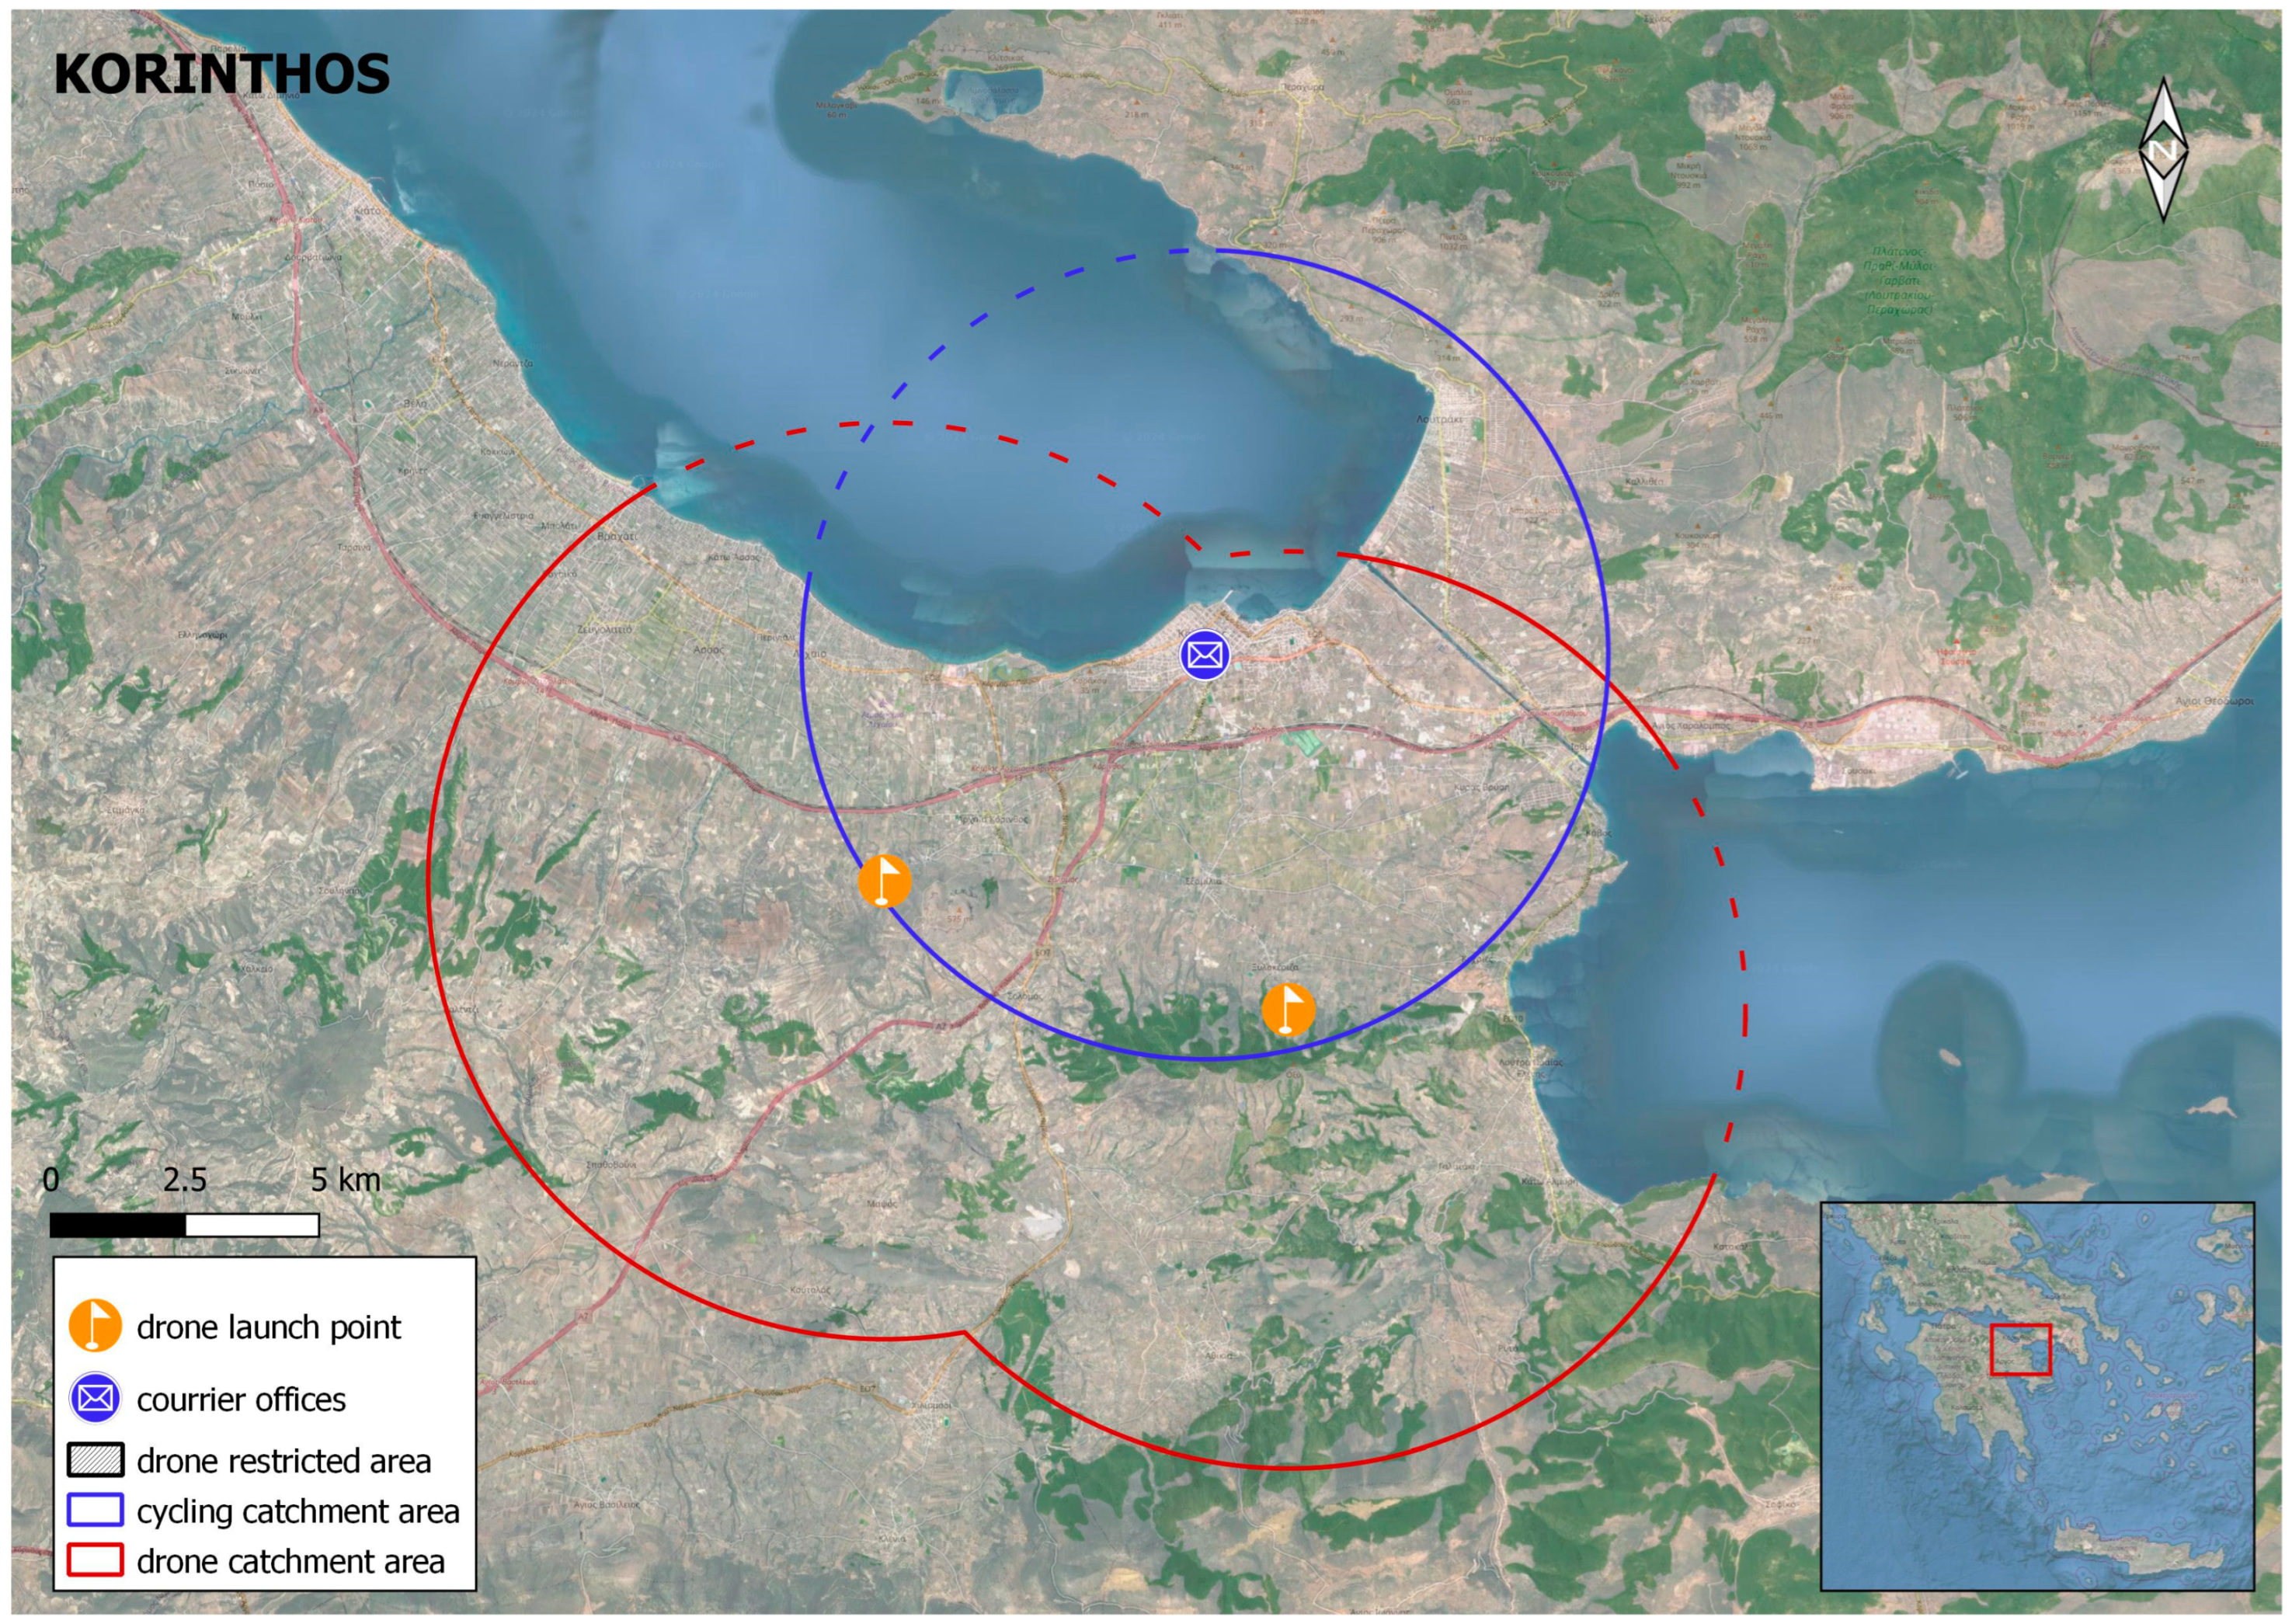
4.1. Route Selection

The FUA of each urban area was sub-divided according to local municipality borders. The first step in the route selection procedure was to randomly choose which local municipalities the route would connect. In the case of cargo bike routes between local municipalities, the dense sections of the urban area were much more likely to be chosen because these routes are more suitable to be used for cargo bike delivery purposes. For route selection in the case of the Athens urban area, the origin—destination (O-D) matrix was employed, which was available from the most recent travel survey in Athens [96]. The exact starting and ending points within a municipality were chosen through another process, in which every building block of the municipality was assigned a number, and through a random number generator, one building block was chosen as a trip start location and another as the final destination of the trip.
The next and final step was selecting the exact route design. To collect the greatest number of environmental parameters for cargo bike deliveries (which vary significantly when using the street network of densely populated urban areas), three alternative routes were designed for each delivery trip chosen. The shortest route (found using Google Maps pedestrian navigation), the fastest route (found through Google Maps driving navigation), and the route with most cyclist-friendly urban elements and characteristics (shared or exclusive bike lanes, low-traffic streets, pedestrianized areas etc.) were all identified.
The random trip generator process was also implemented to choose 40 drone delivery trips within the FUA of Athens. However, a different process was implemented to associate numbers with trips. In the drone delivery case, trips over densely populated areas were excluded, and on the other hand, trips over sparsely populated areas in the outskirt of the urban area were assigned numbers, according to the number of people making this trip in accordance with the records generated within the Athens O-D matrix [96].
Due to the lack of travel data for the rest of the chosen urban areas (Irakleio, Patra, Kalamata, and Korinthos), a different method was used to determine the range of numbers which would be associated with each trip between two municipalities. In that case, the selected routes depended on the population of the municipalities and the distance between them.
Through the above-described process, all cargo bike routes were performed in real traffic situations. The project included real experimentation; hence, a variety of routes were selected, based on topographical features and street categorization, including one or two-way streets, the existence of parking spaces on one or two sides of the road, traffic regulations, and road types, such as avenues, highways, narrow streets, etc. Moreover, cargo bike routes were completed during different daytime intervals under high, normal, and low traffic conditions on weekdays. A very limited number of routes (<5%) were implemented under night conditions, considering that the typical 9 a.m.–5 p.m. courier working hours leaves only a very limited time window for deliveries under late afternoon to night conditions, which are applicable mainly during winter. Based on this methodology, which combined a random trip generator process with data regarding land use and trip concentration in the urban areas of the five metropolitan areas, real-life case conditions were captured, removing any bias stemming from environmental and land formation conditions in the extracted conclusions.

4.2. Cargo Drone Deliveries

Efficient energy consumption modeling is crucial for the sustainable operation of the cargo drone. The electrical energy consumption (E) of the battery, in kilowatt-hours (kWh), associated with carrying different payload weights during the cargo drone flights is given by the following equation:
E = (Ivt + P)/1000
where I is the average energy consumed during each flight (in Amperes), v is the average voltage (in volts) of each flight, t the flight duration (in hours), and P the additional electrical energy consumed due to payload weight, which can be calculated as:
P = Wd
where W is the parcel weight (in kilograms), and d the additional energy consumption rate per unit weight (in mAh per kilogram).
The linear regression model predicting the usage of electricity based on the payload weight is expressed as follows:
E = β0 + β1 W + ε
where E is the electrical energy used by the drone’s battery (kWh), W is the payload weight (kg), or the estimated energy consumption if the payload weight is zero, with the change in energy consumption for a 1 kg increase in payload weight, and ε is the error term, accounting for variability not explained by the model.
The following hypotheses are formulated:
Null Hypothesis (H0): There is no linear relationship between payload weight and energy consumption (0).
Alternative Hypothesis (Ha): There is a linear relationship between payload weight and energy consumption (≠0).
β0 represents the estimated energy consumption when there is no payload weight. It is the intercept of the regression line. β1 represents the estimated change in energy consumption for each additional kilogram of payload weight. It is the slope of the regression line. The coefficient β1 is a measurement of how payload weight influences energy consumption. A positive value indicates that a higher payload weight leads to higher energy consumption, while a negative value indicates the opposite (Table 3).
The cruise speed of the cargo drone is fixed at 5.3 m/s (19.8 km/h). Increasing its payload capacity often necessitates trade-offs and considerations related to t overall performance. The additional power consumption required to maintain flight with a larger payload results in a reduced operational range and flight duration. Similar to the effects on the cargo box, the winch mechanism experiences a linear decrease in flight time with increasing payload weight. However, flight times are consistently shorter compared to those of the box mechanism across all payload weights, indicating the additional energy demands on the winch system. Figure 6 illustrates the relationship between payload capacity, flight time, and range. With a payload of 1 or 4 kg, the winch yields a substantial 7.5% reduction in flight time, as well as a total distance that is approximately 10.81% and 7.79% shorter than that of the box, respectively. It can be observed that the efficiency gains of the winch are particularly notable for heavier payloads, where the percentage reductions in regards to flight time and total distance are more pronounced.
The positive coefficient for parcel weight (β1 = 22.75) is a measure of how payload weight influences energy consumption. With a p-value less than 0.001, it suggests that an increase in parcel weight leads to a corresponding increase in electrical energy consumption. The R-squared (R2) value equals 0.49, indicating that approximately 49% of the variance in energy consumption can be explained by parcel weight. Since the model accounts for a substantial portion of the variance in electrical energy, practical implications are further examined. The average percentage increase in the remaining battery capacity for every 100 g increase in parcel weight is approximately 3.36%. This indicates a slight positive correlation between the two, but the effect is relatively small. Moreover, the observed variations between battery capacity and total energy consumption can be attributed to external factors such as wind speed and flight modes.
In wind speeds ranging between 0–5 mph and 6–10 mph, energy consumption is relatively close to the remaining battery capacity, indicating efficient energy usage. In ranges between 11–15 mph and 16–20 mph, it is noticeably lower than battery capacity, suggesting that the cargo drone may have excess energy reserves, under these conditions. Under higher wind conditions (11–20 mph), the cargo drone utilizes the available energy more efficiently, with an average of 6.78% energy consumption in relation to battery capacity.
Different flight modes may exhibit varying energy usage profiles. When the winch mechanism is enabled for delivery, the cargo drone hovers over the destination for 200 s. This duration includes 80 s for descending the cable, 40 s of waiting time for parcel retrieval by the customer, and 80 s for ascending the cable. Hovering for 200 s results in an average energy expenditure of 2.55 Wh. This is a significant portion of energy, considering that for a 22.8 V battery and 2.5 kg of parcel weight, the total energy consumption is approximately 6 Wh. A change in hovering time from 200 s to 150 s could result in an average energy savings of 0.63 Wh, with a standard deviation of 0.06 Wh.
Increasing a drone’s payload capacity often necessitates trade-offs and considerations related to the overall performance. The additional power consumption required to maintain flight with a larger payload results in a reduced operational range and flight duration. Using the winch mechanism, the flight time and distance are decreased by 6 min and 4 km, respectively, due to additional power consumption. The modular integrated circuit of the winch consumes extra energy for de-wiring, controlling the unloading process, and pulling the wire back into the drone after delivery. As the payload weight increases, it adds more stress and tension to the cable, causing greater oscillations and potentially making the flight less stable, potentially requiring more energy and control efforts to counteract these vibrations, which would further reduce the efficiency of the cargo drone’s operation.

4.3. Cargo Bike Deliveries

In the case of the cargo bike deliveries, the dependent variable to test the effect of environmental parameters regarding cargo bike delivery utility was the mean cargo delivery speed. To test the effect of environmental parameters on performance, real experimentation was conducted on cargo bike deliveries along the pre-selected routes (as in the cargo drone case).
The following environmental characteristics of the routes were recorded during the cargo bike deliveries (explanatory variables):
  • City
Variable recorded: true or not true for each city (Athens, Irakleio, Patra, Kalamata, Korinthos);
  • Road characteristics: primary, secondary, collector, residential, cycle path, pedestrian
Variables recorded: percentage of the route on primary, secondary, tertiary, residential road, cycleway, or pedestrian street;
  • Left turns during the route
Variable recorded: left turns per km;
  • Slope
Variables recorded: percentage of route with slope greater than 6%; percentage of route with slope over 2.5%;
  • Intersection characteristics
Variables recorded: number of stops per km, number of traffic lights per km, number of roundabouts per km;
  • Land use
Variables recorded: percentage of the route in the city center, urban areas, and rural areas;
  • Road surface quality
Variable recorded: number of points per km with unusual bike acceleration;
  • Type of bike
Variable recorded: two-wheel cargo bike or three-wheel cargo bike.
The impact of the route characteristics on delivery efficiency was estimated by measuring the mean delivery speed (m/s) for every route (dependent variable).
The following table (Table 4) shows the variables which were collected from 181 delivery routes.
Stepwise regression analysis results from the 181 cargo bike routes are shown below (Table 5):
The coefficient table of the final model (Table 6), including variables significant at the 0.1 level, is shown below (n = 181; R-Square: 0.3677; Adj R-Square: 0.3496).
The results of the stepwise regression analysis show that between routes with almost the same length, the cycle-friendliest routes, like routes along pedestrian areas or dense activity areas, or along quiet residential streets, should be avoided, as they significantly reduce delivery speed and as a consequence, increase delivery cost in terms of energy and time consumed. As expected, the most negative effect on delivery speed is when the cyclist uses pedestrian streets because cyclists must respect pedestrian presence and pedestrian speed. In addition, when there is a lack of awareness or communication between cargo bike drivers and pedestrians, there can be an increased risk of accidents. Cargo bike drivers, being vulnerable road users, depend on cooperation with pedestrians to navigate safely. The existence of negative interactions among cyclists and pedestrians may result in complaints or concerns from pedestrians, affecting the reputation of the delivery service. Therefore, adequate infrastructure and designated spaces for cargo bike usage can help minimize conflicts between cyclists and pedestrians. Urban planning that considers the needs of various road users can contribute to safer interactions.
Road surface quality is also important. Often, cities lack data regarding the quality of the road surface along the street network; nevertheless, this proves to be significantly influential when determining the routes that cargo bike couriers should use. Cargo bike couriers must avoid routes along road surfaces which provoke vertical acceleration to cyclists, not only for the comfort of the rider, but also to maintain delivery speed and efficiency. It seems that in the case of road surface quality, choosing routes which improve the safety and comfort of the rider also contributes to delivery speed. On the other hand, priority roads, which usually have higher traffic speeds and truck presence, should be preferred, although they cause discomfort to cyclists.
A rather unexpected outcome is that in the case of cargo e-bikes, slopes with incline do not significantly affect delivery speed, perhaps because the cargo bikes utilized in the present study were equipped with electrical assistance. Notwithstanding, slopes do have a minor effect on energy consumption, which is negligible in comparison to the low maintenance and capital costs of cargo bikes; hence, this minor effect is not capable of influencing the overall delivery costs regarding cargo bikes.
Finally, a rather obvious but important result of the regression analysis is that two-wheel cargo bikes are more effective than three-wheel cargo bikes when small packages need to be delivered. However, three-wheel cargo bikes proved to be very useful in cases where the volume or the weight of the goods delivered do not allow the use of a two-wheel e-bike, as cargo trikes are capable of replacing van usage. Moreover, during the deliveries, it became obvious that three-wheel cargo bikes have different parking space requirements, which in dense cities, can significantly influence delivery speed (almost all Greek cities are high-density cites, boasting buildings without parking infrastructure due to the fact that until the 1970s, car usage was not popular in these areas). Three-wheel cargo bikes luck maneuverability and cannot be parked vertically to the appropriate parking spaces. Finally, energy consumption is higher when using three-wheel cargo bikes, which significantly increases delivery cost due to reduced battery autonomy (the e-bike used offers 60 km of autonomy, while the selected e-cargo bike offers 40 km of autonomy).

5. Discussion

In contemporary societies, the concentration of large populations in urban areas has resulted in increased carbon dioxide emissions. Given the pressing issue of climate crisis, the primary objective of urban centers is to minimize these pollutants. Consequently, the incorporation of cargo bikes and drones into freight transportation prevails as an advantageous approach to fulfill this objective. The positive outcomes stemming from the utilization of cargo bikes and drones in urban and peri-urban freight transport are significant, as they actively contribute to society by diminishing negative externalities that the current transportation system generates, such as greenhouse gas emissions and congestion, while mitigating air pollution and noise [97]. Nevertheless, the integration of cargo bikes and drones into urban logistics is not an easy task, and for this reason, the discussion of the paper will be based upon two axes.
The first axis is related to various regulatory challenges that demand taking into account matters such as (a) airspace regulations for the smooth interaction between drones and manned aircraft [98]; (b) data privacy and security issues resulting from the ability of drones to collect data and use them in an inappropriate way during operations, or cybersecurity breach phenomena, in which a hacker can take control of the drone and adopt a bizarre behavior [98]; (c) civil liability insurance, associated with the establishment of insurance policies for potential accidents or damage caused by drones and cargo bikes [99]; and (d) noise pollution affecting residents in urban areas [100].
Hence, it is of paramount importance to advocate for clear and updated regulations that distinguish between different types of drones, in collaboration with local authorities, to develop and implement urban air mobility regulations that consider safety, noise levels, and congestion in urban areas. Moreover, it is essential to work with transportation authorities to establish guidelines for safe routes and designated landing areas for drones, as well as to ensure that cargo bikes adhere to traffic rules. Another significant recommendation consists of implementing robust data protection measures in order to clearly communicate privacy policies and collaborate with regulatory bodies for the establishment of standards regarding data security in logistics operations.
Undoubtedly, the education of the public about the benefits and safety measures of using cargo bikes and drones in urban logistics will be a helpful ally towards the effort to integrate cargo bikes and drones within the urban logistics system, as it will help to address concerns and build support for these technologies. In parallel, the engagement with local communities, businesses, and regulators will assist in gathering feedback for the refinement of regulations and the establishment of a collaborative approach towards the integration of cargo bikes and drones. Finally, the implementation of remote identification systems for drones will enhance accountability and traceability in case of incidents.
The second axis of discussion is related to the transformation of urban space via urban planning and infrastructure enhancements in order to facilitate the adoption of cargo bikes and drones as a true sustainable freight alternative. Within this framework, it is essential: (i) to offer shared bike lanes for conventional bikes and cargo bikes to ensure safe and efficient movement throughout the city; these lanes should be strategically planned to connect key delivery points [101]; (ii) to designate and build drone landing pads or docking stations at strategic locations, such as delivery hubs, public spaces, and commercial areas [102], ensuring compliance with aviation regulations and safety standards; (iii) to create designated loading and unloading zones for cargo bikes and drones [67]; these areas should be strategically located to minimize disruptions to traffic and pedestrian flow; and (iv) to install charging stations for electric cargo bikes at key locations and to establish drone battery charging or swapping stations to ensure continuous operation [103,104].
All of the previous mentioned factors are related and can be considered by several public policies which are not isolated countermeasures, but which form part of sustainable urban mobility plans to assure continuity and generate sustainable futures. The policies that have been identified as closely related to the environmental factors relating to cargo bikes and drones are as follows:
  • The reorganization of road network hierarchy and speed limit reduction.
  • The creation of peripheral roads around urban areas should be protected in order to avoid through flows.
  • The upgrading of intersections to enhance road safety.
  • The creation of exclusive and mixed-use cycling infrastructure and bicycle parking areas.
  • The implementation of traffic calming measures.
  • The creating a smart freight supply system using innovative tools.
  • The establishment of urban consolidation centers.
  • The promotion of urban air mobility schemes.
  • Traffic management for heavy vehicles.
  • The replacement of asphalt paving materials on the streets.
Regarding drones, the effect of atmospheric factors, which can cause moderate to very severe hazards and limit their adoption, should not be underestimated. Moderate hazards are those resulting from phenomena that reduce visibility but do not damage the aircraft, such as fog, glare, and cloud cover. Adverse hazards are related to weather conditions that may cause loss of control and communication and may adversely affect the operator, such as wind and turbulence, rain, solar storms, and extreme temperatures. Finally, severe hazards are those that would result in serious damage or loss of the drone, placing the operator or personnel in a dangerous situation. These hazards include thunderstorms, lightning, hail, tornadoes, and similar phenomena.
Safety issues in the operation of unmanned aerial vehicles are of crucial importance, as the number of these aircraft is increasing exponentially, and they are now used in many sectors such as industry, medicine, and especially, in the commercial sector. Currently, through innovative perspectives in terms of legislative development, several steps have been taken to make the use of drones safer and to strengthen the paradigm of goods transportation towards greener and cleaner solutions.
Future research could investigate the potential for contactless deliveries at predefined drop-off points when the last-mile delivery is carried out by drones. In urban environments, the use of predefined drop-off points at facilities such as hospitals, civil protection infrastructure, etc., and buildings that support predefined landing zones could increase the speed of last-mile delivery. Furthermore, in some cases, depending on the type of cargo transported, contactless delivery could be mandatory, or even a “nice-to-have” case that reduces risks. In addition, future research could investigate the possibility of drones executing predefined standard routes at standard times, e.g., picking up the cargo at a courier station or in a predefined zone so that the cargo bike/e-bike can complete the last-mile delivery. The need for companies to configure urban transportation operations based on cargo characteristics and customer needs while reducing their carbon footprint and energy consumption undoubtedly leaves room for further research regarding how, under which transportation model, and with which other complementary technological solutions any combination of cargo bikes, e-bikes, and drones can serve as the pillars of the last- and middle-mile delivery of light weight cargo.

Author Contributions

Conceptualization, K.A., I.C., S.S., C.K., C.I., C.P. and T.V.; Methodology, K.A., I.C., A.-M.B., G.T., Z.P., C.K., C.I., C.P. and T.V.; Investigation, I.C., R.C., E.P., E.K., K.P. and E.T.; Writing—original draft, K.A., I.C., A.-M.B., G.T., S.S., R.C., Z.P. and E.P.; Writing—review & editing, C.I., C.P. and T.V. All authors have read and agreed to the published version of the manuscript.

Funding

This research was co-financed by the European Regional Development Fund of the Eu-ropean Union and Greek national funds, National Strategic Reference Framework 2014–2020 (NSRF), through the Operational Program “Competitiveness, Entrepreneurship, and Innovation”, under the RESEARCH—CREATE—INNOVATE project (project code: T2EDK-04829).

Institutional Review Board Statement

Not applicable.

Informed Consent Statement

Not applicable.

Data Availability Statement

Data are contained within the article.

Conflicts of Interest

Author Zoe Petrakou was employed by the company Aethon Engineering and author Efstathios Papanikolaou was employed by the company Taxydema. The remaining authors declare that the research was conducted in the absence of any commercial or financial relationships that could be construed as a potential conflict of interest.

References

  1. Gibsone, C.; Jolly, J.F.; Monteoliva Vilches, A.; Rojas Parra, F. Algunas reflexiones sobre la movilidad urbana en Colombia desde la perspectiva del desarrollo humano. Pap. Polít. Bogotá 2011, 16, 485–514. [Google Scholar]
  2. Ascher, F. Los Nuevos Principios del Urbanismo; Alianza: Madrid, Spain, 2004. [Google Scholar]
  3. Rojas, F. Mutaciones urbanas. In Memorias II Coloquio de Profesores de la Facultad de Ciencia Política y Relaciones Internacionales; Pontificia Universidad Javeriana: Bogota, Colombia, 2007. [Google Scholar]
  4. Petrakos, G.; Tsanos, E. Egnatia Odos and Regional Development: A theoretical and experimental study. Rev. Econ. Sci. 2008, 14, 127–160. [Google Scholar]
  5. Skayannis, P.; Kaparos, G. The infrastructure projects in Greece and the presence of Mega Transport Infrastructure Proects (MTIPs): Changing paradigms and priorities. Aeichoros 2013, 18, 12–65. [Google Scholar]
  6. Hanson, S.; Giuliano, G. (Eds.) The Geography of Urban Transportation, 3rd ed.; Guilford Press: New York, NY, USA, 2004. [Google Scholar]
  7. Rodrigue, J.P. The Geography of Transport Systems, 4th ed.; Routledge: New York, NY, USA, 2017. [Google Scholar]
  8. Vlastos, T.; Bakogiannis, E. Cities and Bicycles: A Network for Bicycles in Greek Cities; Onasis Foundation: Athens, Greece, 2017. [Google Scholar]
  9. Flores, I.; Chatziioannou, I.; Segura, E.; Hernández, S. Urban transport infrastructure: A state of the art. In Proceedings of the European Modelling and Simulation Symposium, Athens, Greece, 25–27 September 2013; pp. 83–92. [Google Scholar]
  10. Calderon, C.; Chong, A. Labor market institutions and income inequality: An empirical exploration. Public Choice 2009, 138, 65–81. [Google Scholar] [CrossRef]
  11. Calderon, C.; Serven, L. Infrastructure and Economic Development in Sub-Saharan Africa; Working Paper 2008; The World Bank Policy Research: Washington, DC, USA, 2008; Volume 4712, pp. 1–64. [Google Scholar]
  12. Estache, A.; Fay, M. Current Debates on Infrastructure Policies; Commission on Growth and Development; The World Bank Policy Research: Washington, DC, USA, 2009. [Google Scholar]
  13. Fan, S.; Zhang, X. Public expenditure, growth and poverty reduction in rural Uganda. Afr. Dev. Rev. 2008, 20, 466. [Google Scholar] [CrossRef]
  14. Khandker, S.R.; Bakht, Z.; Koolwal, G.B. The poverty impact of rural roads: Evidence from Bangladesh. Econ. Dev. Cult. Change 2009, 57, 685–722. [Google Scholar] [CrossRef]
  15. Melo, P.; Graham, D.; Brage-Ardao, R. The productivity of transport infrastructure investment: A meta-analysis of empirical evidence. Reg. Sci. Urban Econ. 2013, 43, 695–706. [Google Scholar] [CrossRef]
  16. Mu, R.; van de Walle, D. Rural Roads and Poor Area Development in Vietnam; The World Bank: Washington, DC, USA, 2007. [Google Scholar]
  17. Schofer, J.L.; Mahmassani, H.S. (Eds.) Mobility 2050. A Vision for Transportation Infrastructure; The Transportation Center, Northwestern University: Evanston, IL, USA, 2016. [Google Scholar]
  18. Zhang, X. Transport infrastructure, spatial spillover and economic growth: Evidence from China. Front. Econ. China 2008, 3, 585–597. [Google Scholar] [CrossRef]
  19. Aschauer, D.A. Transportation Spending and Economic Growth: The Effects of Transit and Highway Expenditures; Report 1991; American Transit Association: Washington, DC, USA, 1991. [Google Scholar]
  20. Álvarez-Herranz, A.; Martínez-Ruiz, M.P. Evaluating the economic and regional impact on national transport and infrastructure policies with accessibility variables. Transport 2012, 27, 414–427. [Google Scholar] [CrossRef]
  21. Alminas, M.; Vasiliauskas, A.V.; Jakubauskas, G. The impact of transport on the competitiveness of national economy. Dep. Transp. Manag. 2009, 24, 93–99. [Google Scholar]
  22. Musolino, G.; Polimeni, A.; Vitetta, A. Freight vehicle routing with reliable link travel times: A method based on network fundamental diagram. Transp. Lett. 2016, 10, 159–171. [Google Scholar] [CrossRef]
  23. Van Wee, B. Land use and transport: Research and policy challenges. J. Transp. Geogr. 2002, 10, 259–271. [Google Scholar] [CrossRef]
  24. Romero Perea, A. Metodología Para la Jerarquización de Políticas de Transporte Urbano de Pasajeros que Minimicen las Externalidades Negativas. Master’s Dissertation, Universidad Nacional Autónoma de México, Mexico City, Mexico, 2012. [Google Scholar]
  25. Santos, G.; Behrendt, H.; Maconi, L.; Shirvani, T.; Teytelboym, A. Part I: Externalities and economic policies in road transport. Res. Transp. Econ. 2010, 28, 2–45. [Google Scholar] [CrossRef]
  26. Ferdman, A. Corporate ownership of automated vehicles. Transp. Rev. 2020, 40, 95–113. [Google Scholar] [CrossRef]
  27. Lindsey, R.; Santos, G. Addressing transportation and environmental externalities with economics: Are policy makers listening? Res. Transp. Econ. 2020, 82, 100872. [Google Scholar] [CrossRef]
  28. Girardi, P.; Brambilla, P.C.; Mela, G. Life Cycle Air Emissions External Costs Assessment for Comparing Electric and Traditional Passenger Cars. Integr. Environ. Assess. Manag. 2020, 16, 140–150. [Google Scholar] [CrossRef] [PubMed]
  29. European Commission, Directorate-General for Mobility and Transport; Essen, H.; Fiorello, D.; El Beyrouty, K.; van Wijngaarden, L.; Schroten, A.; Sutter, D.; Bieler, C.; Maffii, S.; Brambilla, M.; et al. Handbook on the External Costs of Transport—Version 2019—1.1, Publications Office. 2020. Available online: https://data.europa.eu/doi/10.2832/51388 (accessed on 15 December 2023).
  30. Chatziioannou, I.; Alvarez-Icaza, L.; Bakogiannis, E.; Kyriakidis, C.; Chias-Becerril, L. A Structural Analysis for the Categorization of the Negative Externalities of Transport and the Hierarchical Organization of Sustainable Mobility’s Strategies. Sustainability 2020, 12, 6011. [Google Scholar] [CrossRef]
  31. Gkourmpatsi, A. Fire Report 2023. 2023. Available online: https://dasarxeio.com/2023/09/03/128685/ (accessed on 15 December 2023).
  32. Nunes, L.J.R. The Rising Threat of Atmospheric CO2: A Review on the Causes, Impacts, and Mitigation Strategies. Environments 2023, 10, 66. [Google Scholar] [CrossRef]
  33. Chatziioannou, I.; Nikitas, A.; Tzouras, P.G.; Bakogiannis, E.; Alvarez-Icaza, L.; Chias-Becerril, L.; Karolemeas, C.; Tsigdinos, S.; Wallgren, P.; Rexfelt, O. Ranking Sustainable Urban Mobility Indicators and Their Matching Transport Policies to Support Liveable City Futures: A MICMAC Approach. Transp. Res. Interdiscip. Perspect. 2023, 18, 100788. [Google Scholar] [CrossRef]
  34. Gonzalez-Calderon, C.A.; Posada-Henao, J.J.; Granada-Muñoz, C.A.; Moreno-Palacio, D.P.; Arcila-Mena, G. Cargo bicycles as an alternative to make sustainable last-mile deliveries in Medellin, Colombia. Case Stud. Transp. Policy 2022, 10, 1172–1187. [Google Scholar]
  35. Vasiutina, H.; Szarata, A.; Rybicki, S. Evaluating the Environmental Impact of Using Cargo Bikes in Cities: A Comprehensive Review of Existing Approaches. Energies 2021, 14, 6462. [Google Scholar] [CrossRef]
  36. Crişan, G.C.; Nechita, E. On a cooperative truck-and-drone delivery system. Procedia Comput. Sci. 2019, 159, 38–47. [Google Scholar] [CrossRef]
  37. Wang, M.; Zhang, C.; Bell, M.G.H.; Miao, L. A branch-and-price algorithm for location routing problems with pick-up stations in the last-mile distribution system. Eur. J. Oper. Res. 2023, 303, 1258–1276. [Google Scholar] [CrossRef]
  38. Barmpounakis, E.N.; Vlahogianni, E.; Golias, J.C. Unmanned Aerial Aircraft Systems for transportation engineering: Current practice and future challenges. Int. J. Transp. Sci. Technol. 2016, 5, 111–122. [Google Scholar] [CrossRef]
  39. Luppicini, R.; So, A. A technoethical review of commercial drone use in the context of governance, ethics, and privacy. Technol. Soc. 2016, 46, 109–119. [Google Scholar] [CrossRef]
  40. Otto, A.; Agatz, N.; Campbell, J.; Golden, B.; Pesch, E. Optimization approaches for civil applications of unmanned aerial vehicles (UAVs) or aerial drones: A survey. Networks 2018, 72, 411–458. [Google Scholar] [CrossRef]
  41. Kilcullen, D.; Exum, A.M. Death from above, outrage down below. N. Y. Times 2009, 16, 529–535. [Google Scholar]
  42. Bamburry, D. Drones: Designed for product delivery. Des. Manag. Rev. 2015, 26, 40–48. [Google Scholar] [CrossRef]
  43. Silvagni, M.; Tonoli, A.; Zenerino, E.; Chiaberge, M. Multipurpose UAV for search and rescue operations in mountain avalanche events. Geomat. Nat. Hazards Risk 2017, 8, 18–33. [Google Scholar] [CrossRef]
  44. Ham, Y.; Han, K.K.; Lin, J.J.; Golparvar-Fard, M. Visual monitoring of civil infrastructure systems via camera-equipped Unmanned Aerial Vehicles (UAVs): A review of related works. Vis. Eng. 2016, 4, 1. [Google Scholar] [CrossRef]
  45. Kim, S.J.; Lim, G.J.; Cho, J.; Côté, M.J. Drone-Aided Healthcare Services for Patients with Chronic Diseases in Rural Areas. J. Intell. Robot. Syst. 2017, 88, 163–180. [Google Scholar] [CrossRef]
  46. Malveaux, C.; Hall, S.G.; Price, R. Using drones in agriculture: Unmanned aerial systems for agricultural remote sensing applications. In 2014 Montreal, Quebec, Canada, 13–16 July 2014; American Society of Agricultural and Biological Engineers: St. Joseph, MI, USA, 2014; p. 1. [Google Scholar]
  47. He, D.; Chan, S.; Guizani, M. Drone-Assisted Public Safety Networks: The Security Aspect. IEEE Commun. Mag. 2017, 55, 218–223. [Google Scholar] [CrossRef]
  48. Lee, S.; Choi, Y. Reviews of unmanned aerial vehicle (drone) technology trends and its applications in the mining industry. Geosyst. Eng. 2016, 19, 197–204. [Google Scholar] [CrossRef]
  49. Ho, D.-T.; Grtli, E.I.; Sujit, P.T.; Johansen, A.; Sousa, J.B. Optimization of Wireless Sensor Network and UAV data acquisition. J. Intell. Robot. Syst. 2015, 78, 159–179. [Google Scholar] [CrossRef]
  50. Fontaine, P. The vehicle routing problem with load-dependent travel times for cargo bicycles. Eur. J. Oper. Res. 2022, 300, 1005–1016. [Google Scholar] [CrossRef]
  51. Raeesi, R.; Zografos, K.G. Coordinated routing of electric commercial vehicles with intra-route recharging and en-route battery swapping. Eur. J. Oper. Res. 2022, 301, 82–109. [Google Scholar] [CrossRef]
  52. Muñoz-Villamizar, A.; Quintero-Araújo, C.L.; Montoya-Torres, J.R.; Faulin, J. Short- and mid-term evaluation of the use of electric vehicles in urban freight transport collaborative networks: A case study. Int. J. Logist. Res. Appl. 2019, 22, 229–252. [Google Scholar] [CrossRef]
  53. Melo, S.; Baptista, P. Evaluating the impacts of using cargo cycles on urban logistics: Integrating traffic, environmental and operational boundaries. Eur. Transp. Res. Rev. 2017, 9, 30. [Google Scholar] [CrossRef]
  54. Anderluh, A.; Hemmelmayr, V.C.; Nolz, P.C. Synchronizing Vans and Cargo Bikes in a City Distribution Network. Cent. Eur. J. Oper. Res. 2017, 25, 345–376. [Google Scholar] [CrossRef]
  55. Lenz, B.; Riehle, E. Bikes for urban freight? Transp. Res. Rec. 2013, 2379, 39–45. [Google Scholar] [CrossRef]
  56. Sheth, M.; Butrina, P.; Goodchild, A.; McCormack, E. Measuring delivery route cost trade-offs between electric-assist cargo bicycles and delivery trucks in dense urban areas. Eur. Transp. Res. Rev. 2019, 11, 11. [Google Scholar] [CrossRef]
  57. Gruber, J.; Narayanan, S. Travel Time Differences between Cargo Cycles and Cars in Commercial Transport Operations. Transp. Res. Rec. J. Transp. Res. Board 2019, 2673, 623–637. [Google Scholar] [CrossRef]
  58. Arnold, F.; Cardenas, I.; Sörensen, K.; Dewulf, W. Simulation of B2C e-commerce distribution in Antwerp using cargo bikes and delivery points. Eur. Transp. Res. Rev. 2017, 10, 2. [Google Scholar] [CrossRef]
  59. Lee, K.; Chae, J.; Kim, J. A courier service with electric bicycles in an urban area: The case in Seoul. Sustainability 2019, 11, 1255. [Google Scholar] [CrossRef]
  60. Naumov, V.; Starczewski, J. Choosing the localisation of loading points for the cargo bicycles system in the Krakow Old Town. Lect. Notes Netw. Syst. 2019, 68, 353–362. [Google Scholar]
  61. Niels, T.; Hof, M.T.; Bogenberger, K. Design and operation of an urban electric courier cargo bike system. In Proceedings of the 2018 21st International Conference on Intelligent Transportation Systems (ITSC), Maui, HI, USA, 4–7 November 2018; pp. 2531–2537. [Google Scholar]
  62. Zhang, L.; Matteis, T.; Thaller, C.; Liedtke, G. Simulation-based Assessment of Cargo Bicycle and Pick-up Point in Urban Parcel Delivery. Procedia Comput. Sci. 2018, 130, 18–25. [Google Scholar] [CrossRef]
  63. Choubassi, C.; Seedah, D.P.K.; Jiang, N.; Walton, C.M. Economic Analysis of Cargo Cycles for Urban Mail Delivery. Transp. Res. Rec. 2016, 2547, 102–110. [Google Scholar] [CrossRef]
  64. Balac, M.; Vetrella, A.R.; Axhausen, K.W. Towards the integration of aerial transportation in urban settings. In Proceedings of the 97th Annual Meeting Transportation Research Board (TRB 2018), Washington, DC, USA, 7–11 January 2018. [Google Scholar]
  65. Cohn, P.; Green, A.; Langstaff, M.; Roller, M. Commercial Drones Are Here: The Future of Unmanned Aerial Systems; McKinsey & Company: New York, NY, USA, 2017; pp. 2–10. [Google Scholar]
  66. Rudolph, C.; Gruber, J. Cargo cycles in commercial transport: Potentials, constraints, and recommendations. Res. Transp. Bus. Manag. 2017, 24, 26–36. [Google Scholar] [CrossRef]
  67. Nürnberg, M. Analysis of using cargo bikes in urban logistics on the example of Stargard. Transp. Res. Procedia 2019, 39, 360–369. [Google Scholar] [CrossRef]
  68. Narayanan, S.; Antoniou, C. Electric cargo cycles—A comprehensive review. Transp. Policy 2021, 116, 278–303. [Google Scholar] [CrossRef]
  69. Narayanan, S.; Gruber, J.; Liedtke, G.; Antoniou, C. Purchase Intention and Actual Purchase of Cargo Cycles: Influencing Factors and Policy Insights. Transp. Res. Part A Policy Pract. 2022, 155, 31–45. [Google Scholar] [CrossRef]
  70. Kostrzewski, M.; Abdelatty, Y.; Eliwa, A.; Nader, M. Analysis of Modern vs. Conventional Development Technologies in Transportation—The Case Study of a Last-Mile Delivery Process. Sensors 2022, 22, 9858. [Google Scholar] [CrossRef]
  71. Cheng, C.; Adulyasak, Y.; Rousseau, L.M. Drone routing with energy function: Formulation and exact algorithm. Transp. Res. Part B Methodol. 2020, 139, 364–387. [Google Scholar] [CrossRef]
  72. Beigi, P.; Rajabi, M.S.; Aghakhani, S. An Overview of Drone Energy Consumption Factors and Models. arXiv 2022, arXiv:2206.10775. [Google Scholar]
  73. D’Andrea, R. Guest editorial can drones deliver? IEEE Trans. Autom. Sci. Eng. 2014, 11, 647–648. [Google Scholar] [CrossRef]
  74. International Civil Aviation Organization. Available online: https://www.icao.int/Pages/default.aspx (accessed on 17 October 2023).
  75. Primatesta, S.; Guglieri, G.; Rizzo, A. A risk-aware path planning strategy for uavs in urban environments. J. Intell. Robot. Syst. 2019, 95, 629–643. [Google Scholar] [CrossRef]
  76. Primatesta, S.; Rizzo, A.; la Cour-Harbo, A. Ground Risk Map for Unmanned Aircraft in Urban Environments. J. Intell. Robot. Syst. 2020, 97, 489–509. [Google Scholar] [CrossRef]
  77. Drone Aware—GR (DAGR). Available online: https://dagr.hasp.gov.gr/el/ (accessed on 17 October 2023).
  78. Dung, N.D. Developing models for managing drones in the transportation system in smart cities. Sci. J. Riga Tech. Univ. Electr. Control Commun. Eng. 2019, 15, 71–78. [Google Scholar] [CrossRef]
  79. Clarke, R.; Moses, L.B. The regulation of civilian drones’ impacts on public safety. Comput. Law Secur. Rev. 2014, 30, 263–285. [Google Scholar] [CrossRef]
  80. Peinecke, N.; Mühlhausen, T. Cargo Drone Airspace Integration in Very Low Level Altitude. In Automated Low-Altitude Air Delivery. Research Topics in Aerospace; Dauer, J.C., Ed.; Springer: Cham, Switzerland, 3 November 2021. [Google Scholar] [CrossRef]
  81. Reynolds, C.C.O.; Harris, M.A.; Teschke, K.; Cripton, P.A.; Winters, M. The Impact of Transportation Infrastructure on Bicycling Injuries and Crashes: A Review of the Literature. Environ. Health 2009, 8, 47. [Google Scholar] [CrossRef]
  82. Boettge, B.; Hall, D.; Crawford, T. Assessing the Bicycle Network in St. Louis: A Place Based User-Centered Approach. Sustainability 2017, 9, 241. [Google Scholar] [CrossRef]
  83. Chataway, E.S.; Kaplan, S.; Nielsen, T.A.S.; Prato, C.G. Safety perceptions and reported behavior related to cycling in mixed traffic: A comparison between Brisbane and Copenhagen. Transp. Res. Part F 2014, 23, 32–43. [Google Scholar] [CrossRef]
  84. Hamann, C.; Peek-Asa, C. On-road bicycle facilities and bicycle crashes in Iowa, 2007–2010. Accid. Anal. Prev. 2013, 56, 103–109. [Google Scholar] [CrossRef]
  85. Zimmermann, M.; Mai, T.; Frejinger, E. Bike route choice modeling using GPS data without choice sets of paths. Transp. Res. Part C Emerg. Technol. 2017, 75, 183–196. [Google Scholar] [CrossRef]
  86. De Rome, L.; Boufous, S.; Georgeson, T.; Senserrick, T.; Richardson, D.; Ivers, R. Bicycle crashes in different riding environments in the Australian capital territory. Traffic Inj. Prev. 2014, 15, 81–88. [Google Scholar] [CrossRef]
  87. Ghekiere, A.; Deforche, B.; De Bourdeaudhuij, I.; Clarys, P.; Mertens, L.; Cardon, G.; de Geus, B.; Nasar, J.; van Cauwenberg, J. An experimental study using manipulated photographs to examine interactions between micro-scale environmental factors for children’s cycling for transport. J. Transp. Geogr. 2018, 66, 30–34. [Google Scholar] [CrossRef]
  88. Maksimenko, G. The Challenges of Last-Mile Delivery Logistics and the Tech Solutions. 24 September 2023. Available online: https://adexin.com/blog/last-mile-delivery-challenges/ (accessed on 24 January 2024).
  89. Scott, M. Improving Freight Movement in Delaware Central Business Districts (PDF); Institute for Public Administration, University of Delaware: Newark, DE, USA, 2009. [Google Scholar]
  90. Rodrigue, J.P.; Comtois, C.; Slack, B. The “Last Mile” in Freight Distribution. In The Geography of Transport Systems, 2nd ed.; Routledge: Abingdon, UK, 2009; p. 212. ISBN 978-0-415-48323-0. [Google Scholar]
  91. Allen, B. Improving Freight Efficiency within the ‘Last Mile’: A Case Study of Wellington’s Central Business District. Master’s Thesis, University of Otago, Dunedin, New Zealand, 2012. [Google Scholar]
  92. McCunney, B.; Cauwenberghe, K. Simulation Test Bed for Drone-Supported Logistics Systems. Ph.D. Thesis, Massachusetts Institute of Technology, Cambridge, MA, USA, 2019. [Google Scholar]
  93. Boucher, P. Domesticating the drone: The demilitarisation of unmanned aircraft for civil markets. Sci. Eng. Ethics 2015, 21, 1393–1412. [Google Scholar] [CrossRef] [PubMed]
  94. Aiello, G.; Quaranta, S.; Certa, A.; Inguanta, R. Optimization of Urban Delivery Systems Based on Electric Assisted Cargo Bikes with Modular Battery Size, Taking into Account the Service Requirements and the Specific Operational Context. Energies 2021, 14, 4672. [Google Scholar] [CrossRef]
  95. Conceição, A. Logistics Challenges in a New Distribution Paradigm: Drone Delivery; Technical Report; Instituto Superior Técnico: Lisboa, Portugal, 2019. [Google Scholar]
  96. OECD. Greece—FUA, OECD Publishing, Paris. 2016. Available online: https://www.oecd.org/cfe/regionaldevelopment/Greece-fua.pdf (accessed on 15 December 2023).
  97. Hellenic Telecommunications & Posts Commission (HTPC), Market Review. 2021. Available online: https://www.eett.gr/stoicheia-agoras/apologistika-stoicheia/tachydromikes-ypiresies/stoicheia-ellinikis-agoras/episkopisi-agoron/ (accessed on 15 December 2023).
  98. Lockhart, A.; While, A.; Marvin, S.; Kovacic, M.; Odendaal, N.; Alexander, C. Making space for drones: The contested reregulation of airspace in Tanzania and Rwanda. Trans. Inst. Br. Geogr. 2021, 46, 850–865. [Google Scholar] [CrossRef]
  99. Eskandaripour, H.; Boldsaikhan, E. Last-mile drone delivery Past, present, and future. Drones 2023, 7, 77. [Google Scholar] [CrossRef]
  100. Konert, A.; Kotliński, M. U-Space—Civil Liability for damages caused by Unmanned Aircraft. Transp. Res. Procedia 2020, 51, 304–312. [Google Scholar] [CrossRef]
  101. Schäffer, B.; Pieren, R.; Heutschi, K.; Wunderli, J.M.; Becker, S. Drone Noise Emission Characteristics and Noise Effects on Humans—A Systematic Review. Int. J. Environ. Res. Public Health 2021, 18, 5940. [Google Scholar] [CrossRef] [PubMed]
  102. Dybdalen, D.; Ryeng, E.O. Understanding how to ensure efficient operation of cargo bikes on winter roads. Res. Transp. Bus. Manag. 2021, 44, 100652. [Google Scholar] [CrossRef]
  103. Roesing, J.; Lima, I.; Feldhoff, E.; Hoenen, S.; Kuehnel, F.; Theissen, A. Identifying requirements for airborne-supplied city hubs. J. Air Transp. Manag. 2023, 107, 102326. [Google Scholar] [CrossRef]
  104. Mukku, V.D.; Kania, M.; Brinken, J.; Salah, I.H.; Assmann, T. Evaluation of Energy Supply Technologies for Autonomous Cargo Bike-Sharing System. IFAC PapersOnLine 2023, 56, 1784–1790. [Google Scholar] [CrossRef]
Figure 1. Integration of cargo bike and cargo drone delivery in urban and peri-urban areas of Patra.
Sustainability 16 01060 g001
Figure 2. Integration of cargo bike and cargo drone delivery in the metropolitan area of Athens.
Sustainability 16 01060 g002
Figure 3. Integration of cargo bike and cargo drone delivery in the metropolitan area of Irakleio.
Sustainability 16 01060 g003
Figure 4. Integration of cargo bike and cargo drone delivery in urban and peri-urban areas of Kalamata.
Sustainability 16 01060 g004
Figure 5. Integration of cargo bike and cargo drone delivery in urban and peri-urban areas of Korinthos.
Sustainability 16 01060 g005
Figure 6. Relationship between payload capacity, flight time, and range.
Sustainability 16 01060 g006
Table 1. The potential benefits and security–regulatory issues involved in the cooperation of cargo bikes and drones.
IDThemeBrief Description
1EfficiencyLast-mile delivery efficiency: Cargo bikes and drones excel in this segment of the delivery of goods. Electric cargo bikes can navigate congested urban areas, avoiding traffic, as well as environmental and parking issues, leading to faster deliveries, even to the very door of the recipient, while drones are ideal for transporting smaller parcels to hubs that better accommodate the final recipients’ needs for collection compared to other peri-urban centers that may be harder to reach because of inadequate infrastructure.
Reduced congestion: replacing traditional vehicles with cargo bikes and drones reduces traffic congestion and improves overall transportation efficiency.
Speed: cargo bikes and drones can reach their destinations swiftly, which is vital for time-sensitive deliveries.
2Environmental impactLower emissions: cargo bikes produce zero emissions, significantly reducing air pollution and carbon emissions.
Fuel consumption: shifting to cargo bikes and drones leads to substantial fuel savings and a smaller carbon footprint.
Noise pollution: cargo bikes generate less noise pollution than traditional delivery vehicles, contributing to a quieter urban environment.
Air Quality: fewer emissions from delivery vehicles leads to better air quality in urban areas, positively impacting residents’ health.
3Optimized routesCombining cargo bikes and drones allows for route optimization: Drones can handle longer distances and navigate around obstacles, or even overcome them easily by flying above them in a straight line, while cargo bikes are the more flexible modes in regards to the urban road network. This hybrid approach creates a flexible and adaptable delivery network, ensuring that packages reach the right place at the right time, even in complex urban, peri-urban, or even rural and remote environments, in which case, the drone can be the advantageous means of transport, compared to both bikes and conventional vehicles.
4Reduced infrastructure costsCargo bikes and drones require less infrastructure investment than do traditional methods, reducing the need for extensive road networks and arteries required by large delivery vehicles. Drones can utilize existing landing areas, minimizing the requirement for new infrastructure.
5Airspace
regulations and insurance
requirements
Drones operate in controlled airspace, and adherence to local aviation regulations is crucial. Compliance with altitude restrictions, no-fly zones, and the obtaining of the necessary permits is essential. Moreover, drones may require insurance coverage for potential accidents, damages, or liability issues. Meeting insurance requirements set by regulatory bodies is crucial for legal operation.
6Licensing and certificationPilots or operators of cargo bikes and drones may need specific licenses or certifications. Ensuring compliance with local aviation or transportation authority requirements is essential.
7Weather
phenomena
Moderate, adverse, or severe weather phenomena can cause loss of communication and control that may ultimately lead to severe damage or loss of the aircraft.
8Education and public
awareness
The European Union Aviation Safety Agency (EASA) highlights that citizens should be educated about safety measures, privacy considerations, and the benefits of drone delivery in the context of urban air mobility (UAM).
9Cyclist
infrastructure
Existing bicycle infrastructure is one of the main factors that increases safety for cyclists. Lack of lighting increases the likelihood of an accident and is often a cause of road crashes. Moreover, street lighting elements are beneficial because they make visible points that would otherwise be dangerous and could cause cyclists to fall. Additionally, the increase in cyclists risk appears to be proportional to the number of traffic lanes on the road, as more accidents occur on roads having more than two traffic lanes per direction.
Table 2. Types of cargo bikes and drones, along with their key features, used in the study.
IDCategoryUtilized Mode of TransportKey Characteristics
1e-cargo bikeMessenger cargo bikeThe cargo bike has two wheels, and the basket is located on the front and/or rear of the handlebar, with dimensions of 0.03–0.05 sq.m. It has a load capacity of up to 20–40 kg and is used for small parcels.
2e-cargo bikeFront-load cargo trikeThe trike has a maximum load capacity equal to 200 kg. The cargo basket is located at the front of the bike, with dimensions of 0.2–0.6 sq.m. Electric assistance is necessary for its usage.
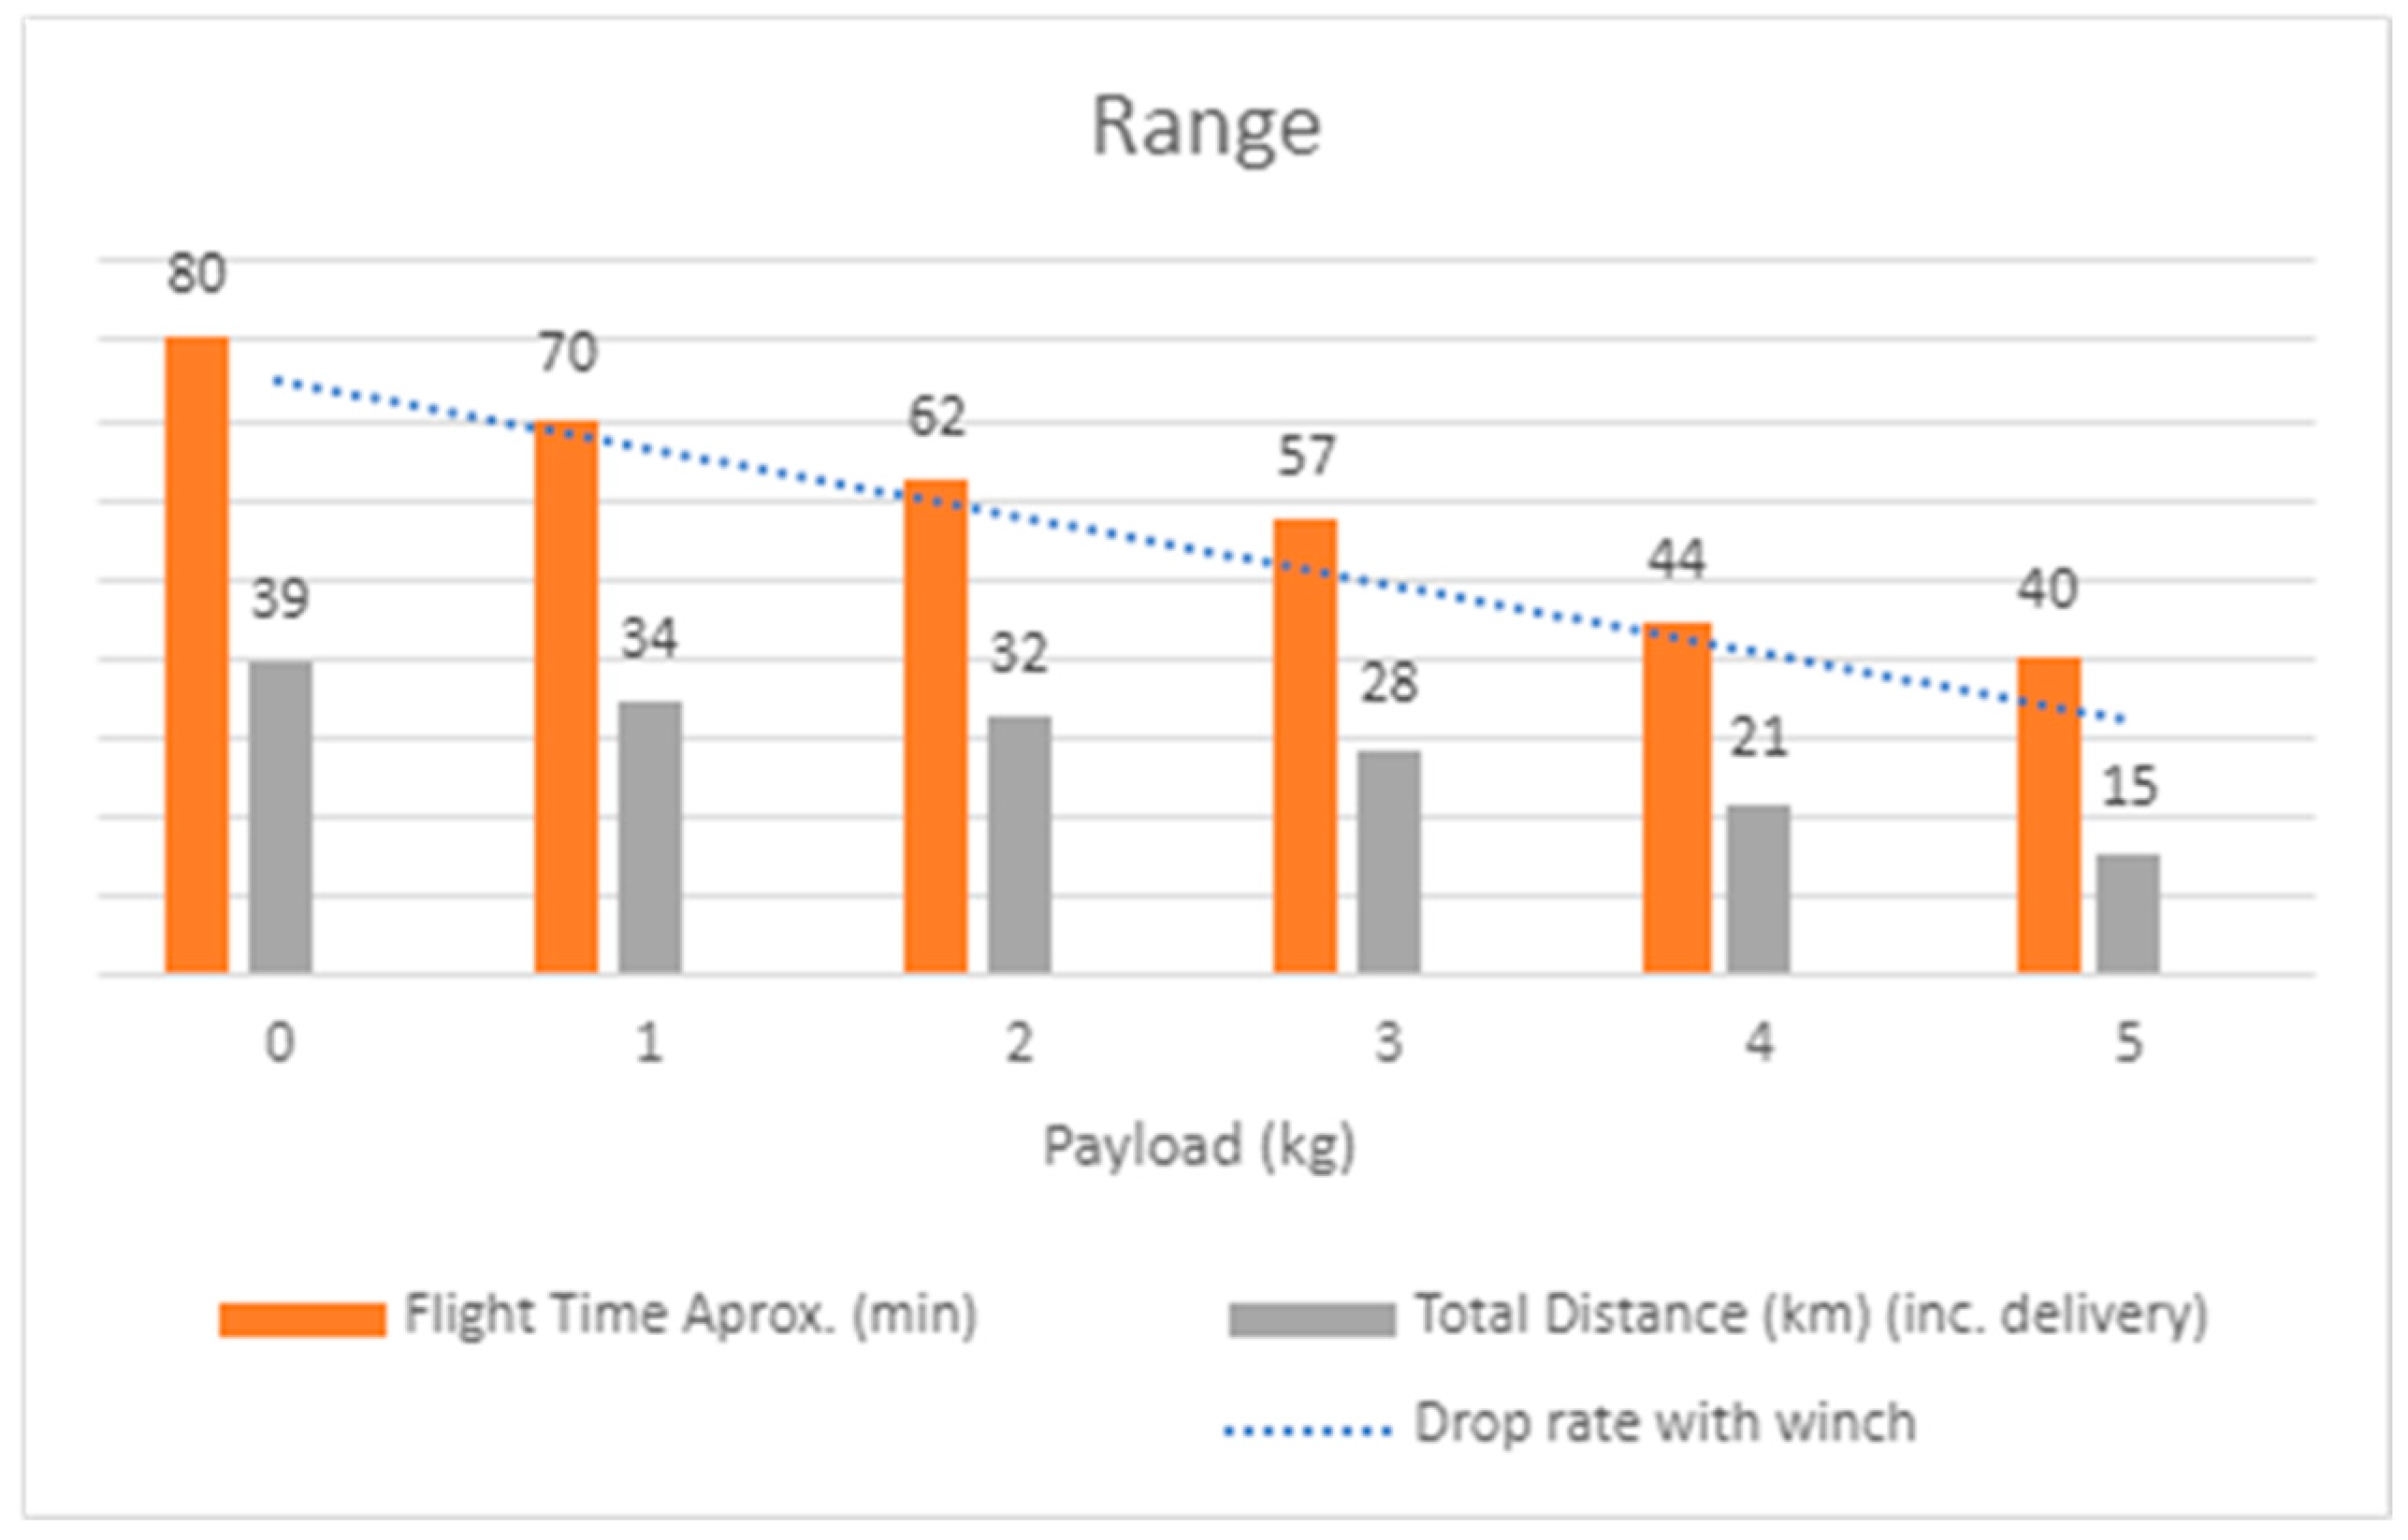
3Cargo droneVertical take-off and landing (VTOL) quadrotorThe vehicle is a quadcopter equipped with four rotors and four 29 × 8.7-inch fixed propellers. It features a robust, yet lightweight frame weighing 5 kg, offering a substantial payload capacity of up to 10 kg. It is capable of an extended flight time of up to 80 min without any payload. The prototype typically operates at a cruise speed of 35 km/h and is capable of a max speed of 70 km/h. The drone can handle wind speeds of Beaufort level 6 without losing control. Finally, it can withstand a maximum humidity of 90%, heat of up to 40 °C, and cold environments of up to −20 °C.
Table 3. Results of the energy consumption model ± typical error (p value < 0.001; number of flights n = 100).
Energy Consumption Model
β097.17 ± 13.6
β122.75 ± 1.8
R20.49
Table 4. Variables recorded from the cargo bike delivery routes.
Explanatory VariablesDescription
CityFor each city, true or not true
Pct_Primary_roadPercent of the length of the route on primary road (OpenStreetMap Road classification)
Pct_Secondary_roadPercent of the length of the route on secondary road (OpenStreetMap Road classification)
Pct_Tertiary_RoadPercent of the length of the route on tertiary road (OpenStreetMap Road classification)
Pct_ResidentialPercent of the length of the route on residential road (OpenStreetMap Road classification)
Pct_CyclewayPercent of the length of the route on cycleway (OpenStreetMap Road classification)
Pct__PedestrianPercent of the length of the route on pedestrian street (OpenStreetMap Road classification)
Left_turn_kmLeft turns along the route, per km
Pct_route__slope_gt_6pctPercent of the length of the route with incline greater than 6%
Pct_route__slope_gt_25pctPercent of the length of the route with incline greater than 2.5%
Stop_per_kmStop signs along the route, per km
Traffic_light_per_kmTraffic lights along the route, per km
Roundabout_per_kmRoundabouts along the route, per km
Ιntersections_per_kmStop signs, traffic lights, or roundabouts along the route, per km
Pct_route_in_centerPercent of the length of the route in urban centers (with high density of activities)
Pct_route_urban_areaPercent of the length of the route in urban areas (with low density of activities)
Pct_route_nonurban_areaPercent of the length of the route in rural areas (with very low residential density)
Pct_route_industrial_areaPercent of the length of the route in industrial area
Type_of_bikeFor each bike (three-wheel cargo e-bike or two-wheel cargo e-bike), true or not true
ACC_per_KMNumber of points with bike acceleration exceeding the threshold per route km.
Dependent VariableDescription
Speed_m_s Mean speed during the route
Table 5. Summary of the stepwise selection.
StepVariableVariableNumberPartialModelC(p)F ValuePr > F
EnteredRemovedVars InR-SquareR-Square
1electro_bike 10.19170.1917361.84442.46<0.0001
2ACC_per_KM 20.11720.308972.64430.20<0.0001
3Pct__Pedestrian 30.03390.34290.32149.130.0029
4Pct_route_in_center 40.01450.3574−15.1093.980.0476
5Pct_Residential 50.01030.3677−22.2322.850.0934
Table 6. Coefficient table.
VariableParameterStandardType II SSF ValuePr > F
EstimateError
Intercept4.9440.25966385.406362.45<0.0001
Pct_Residential−0.0040.002593.0262.850.0934
Pct__Pedestrian−0.0330.013636.2085.840.0167
Pct_route_in_center−0.0040.001954.9584.660.0322
ACC_per_KM−0.0002 0.0000336.20134.04<0.0001
electro_bike0.9720.1748932.83030.87<0.0001
Disclaimer/Publisher’s Note: The statements, opinions and data contained in all publications are solely those of the individual author(s) and contributor(s) and not of MDPI and/or the editor(s). MDPI and/or the editor(s) disclaim responsibility for any injury to people or property resulting from any ideas, methods, instructions or products referred to in the content.

