
Experimental Study on Styrene–Butadiene–Styrene-Modified Binders and Fly Ash Micro-Filler Contributions for Implementation in Porous Asphalt Mixes

 ,
,  , , and
Abstract
:1. Introduction
2. Materials and Methods
2.1. Materials
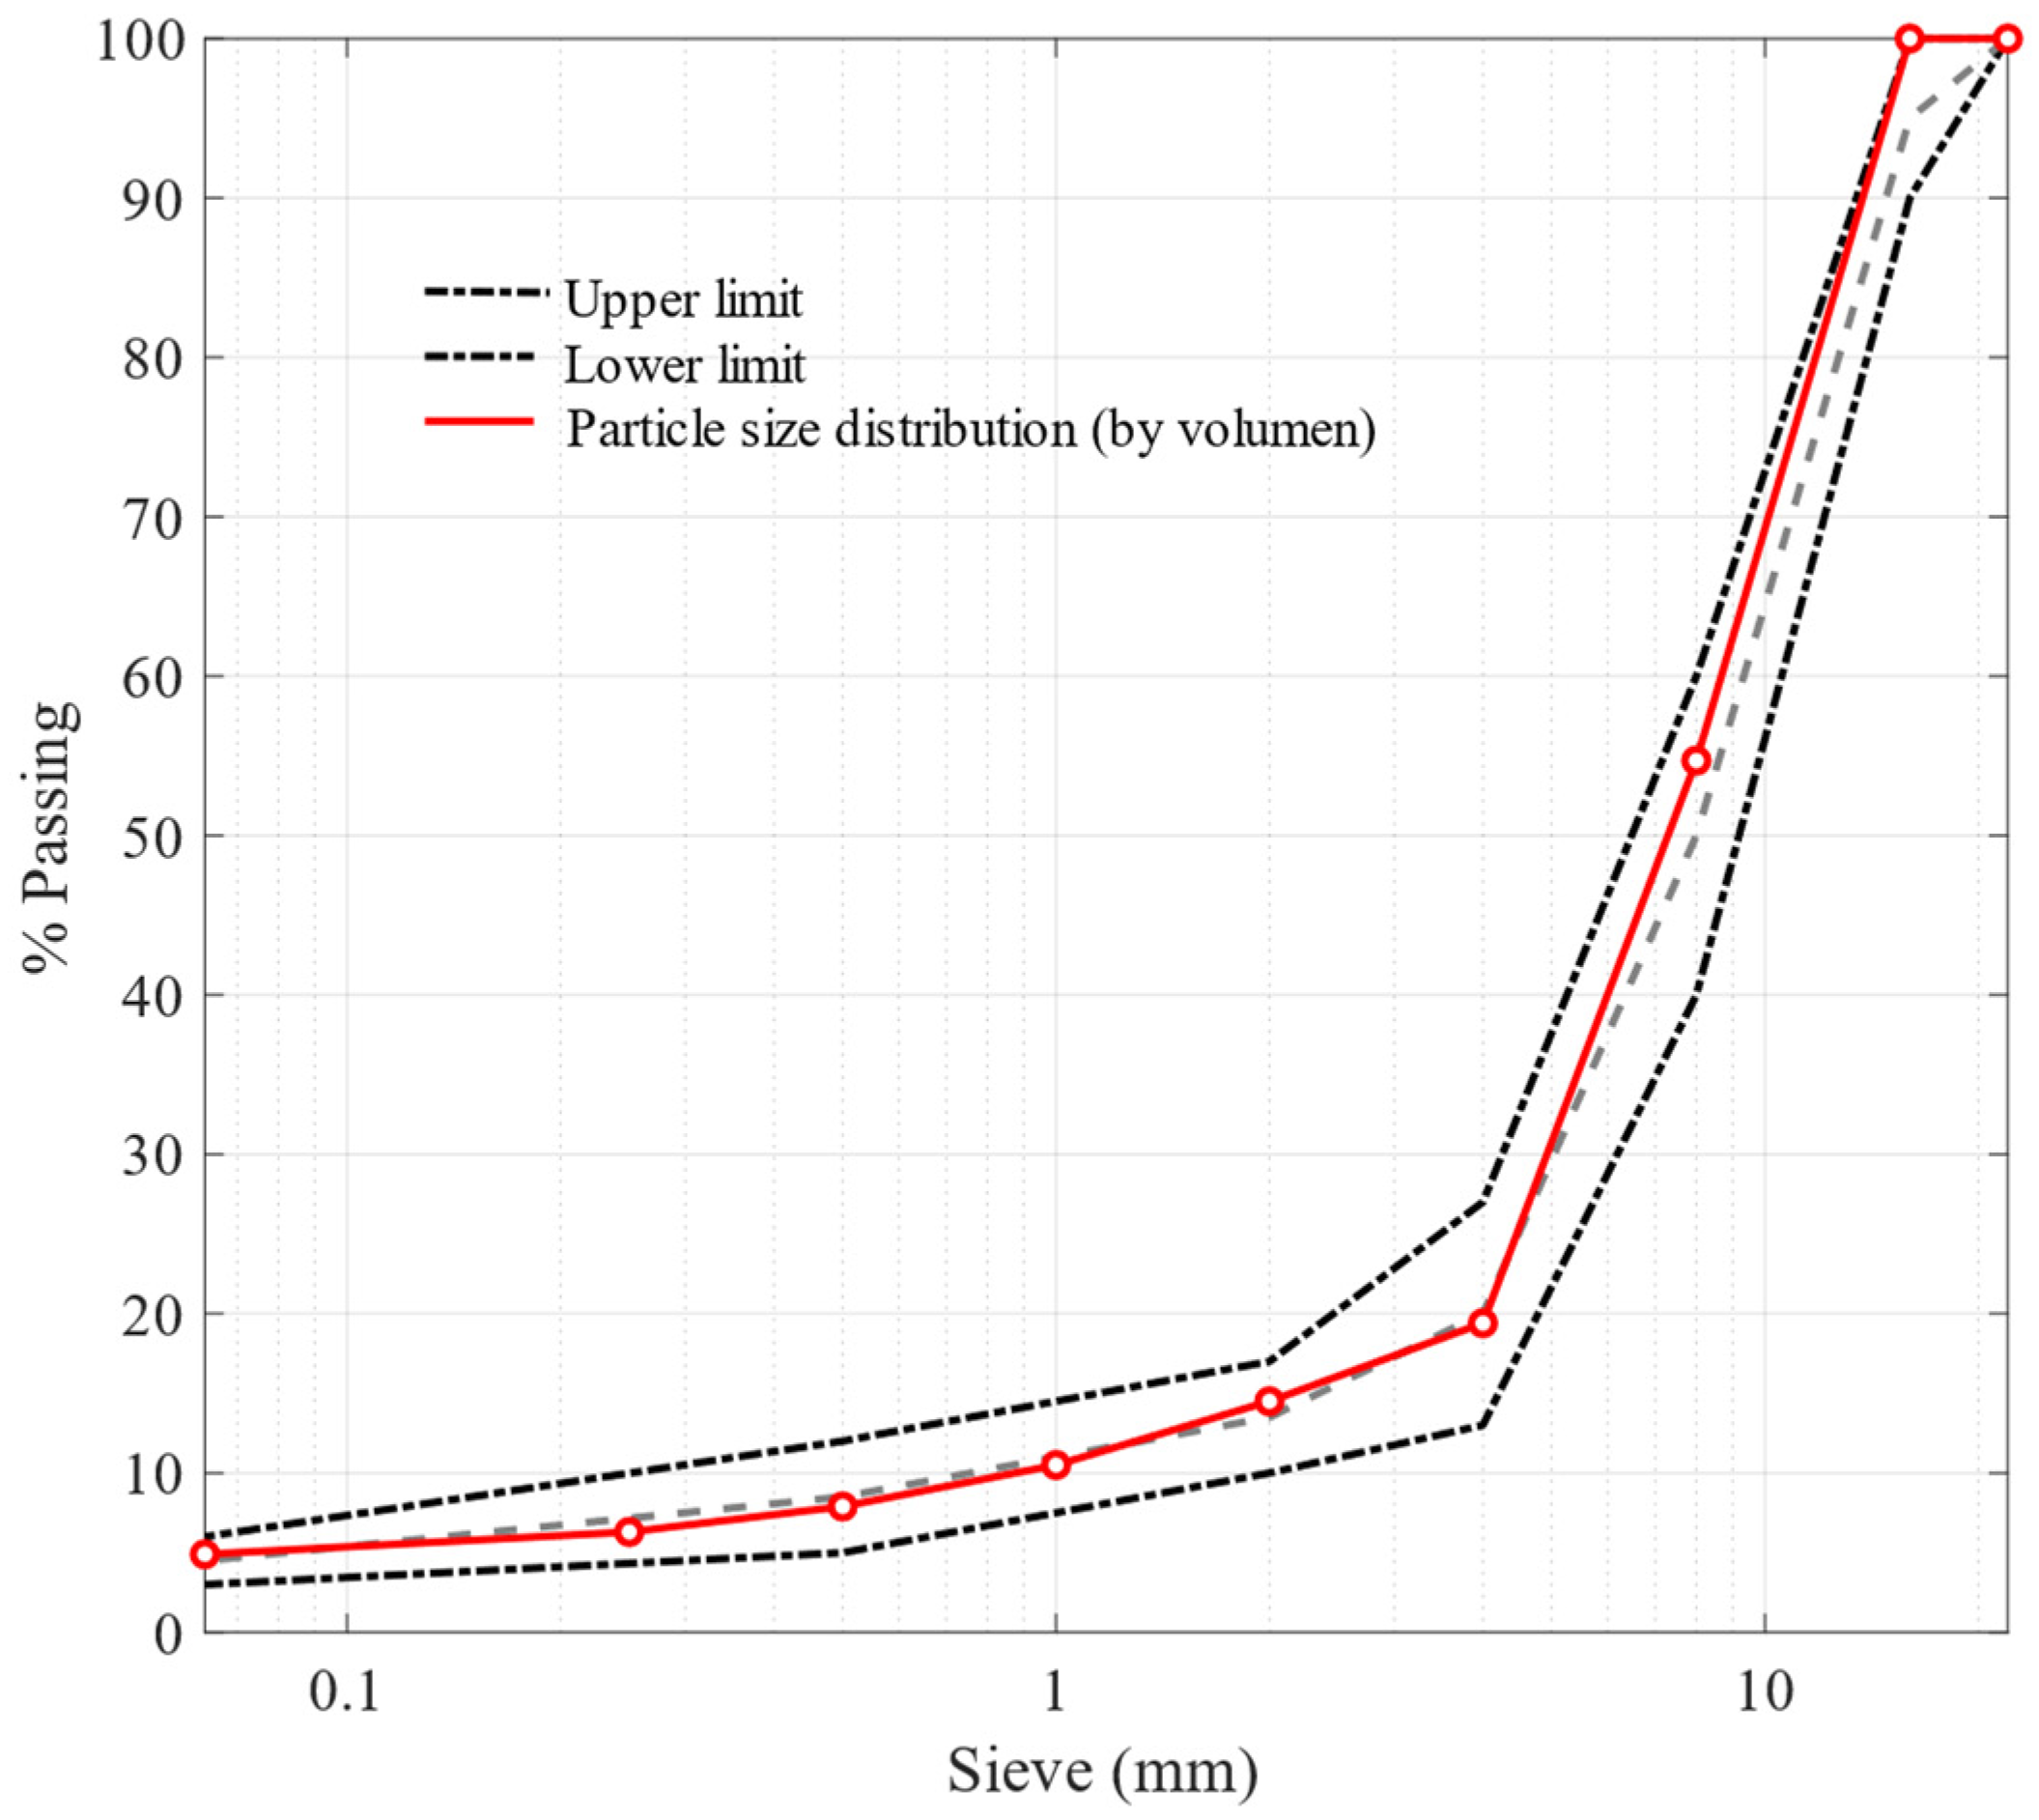
2.1.1. Aggregates
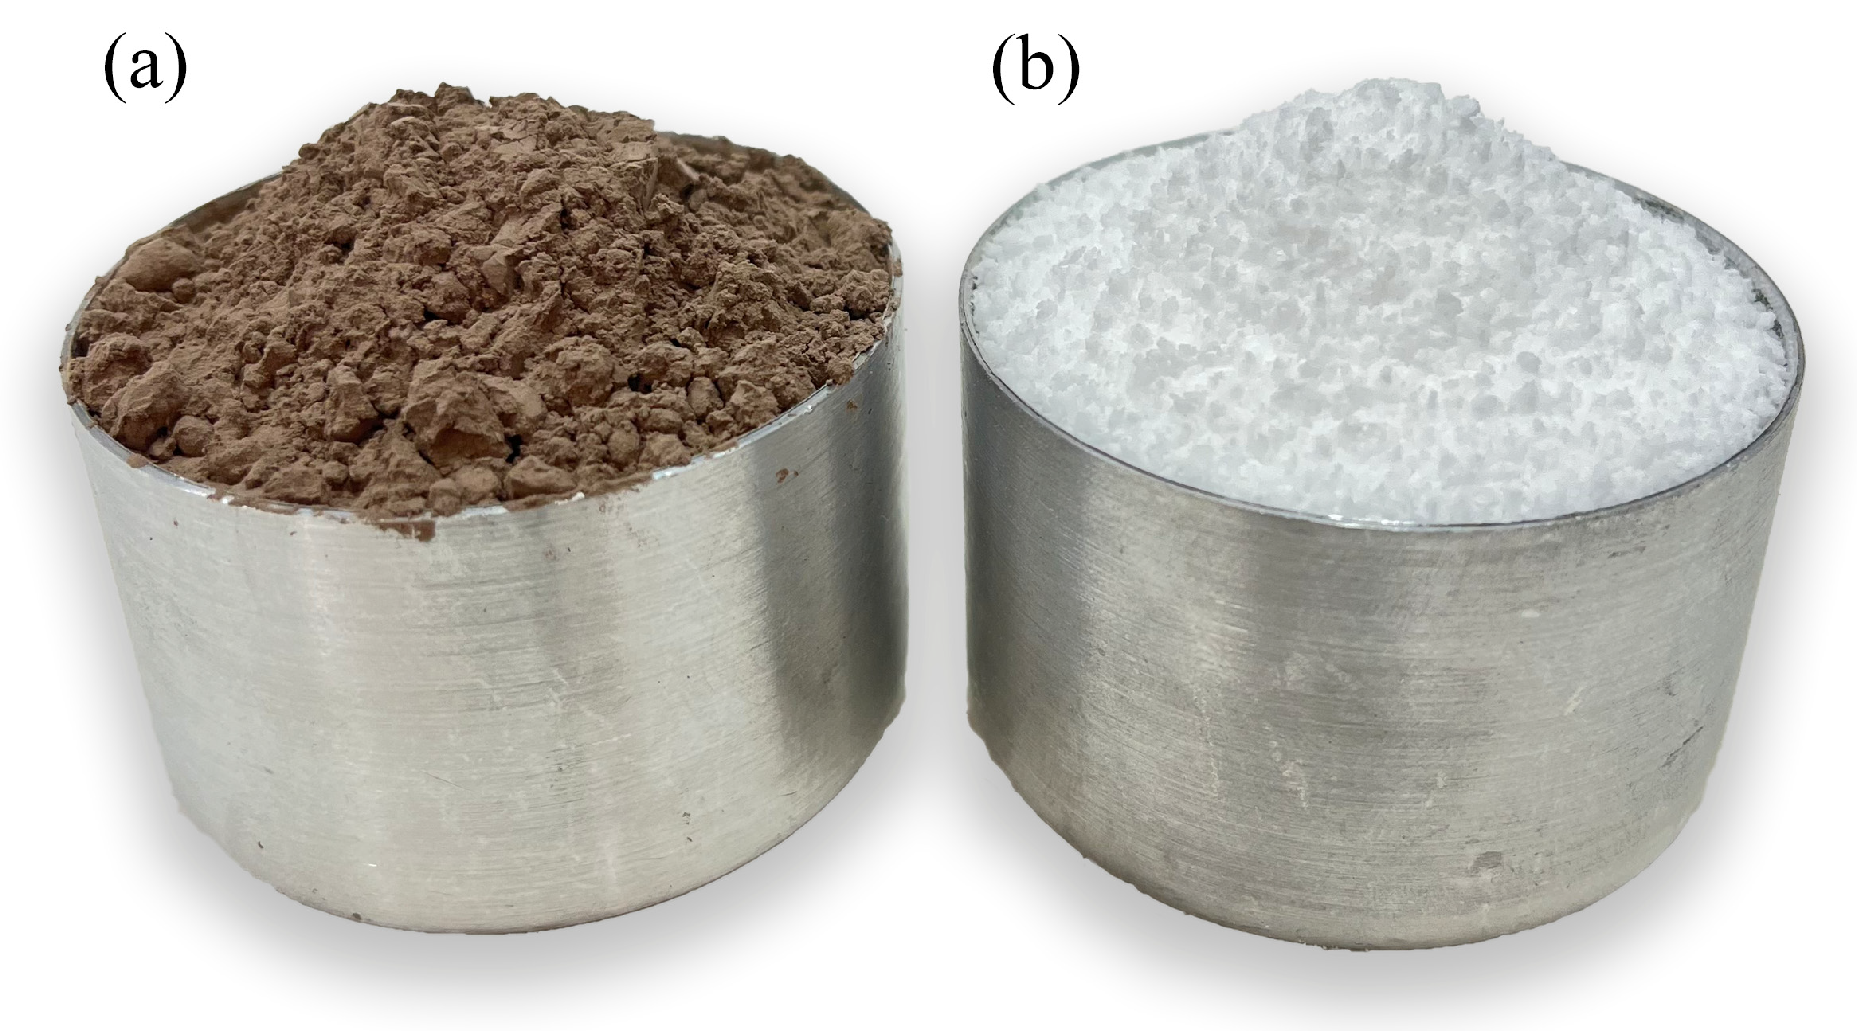
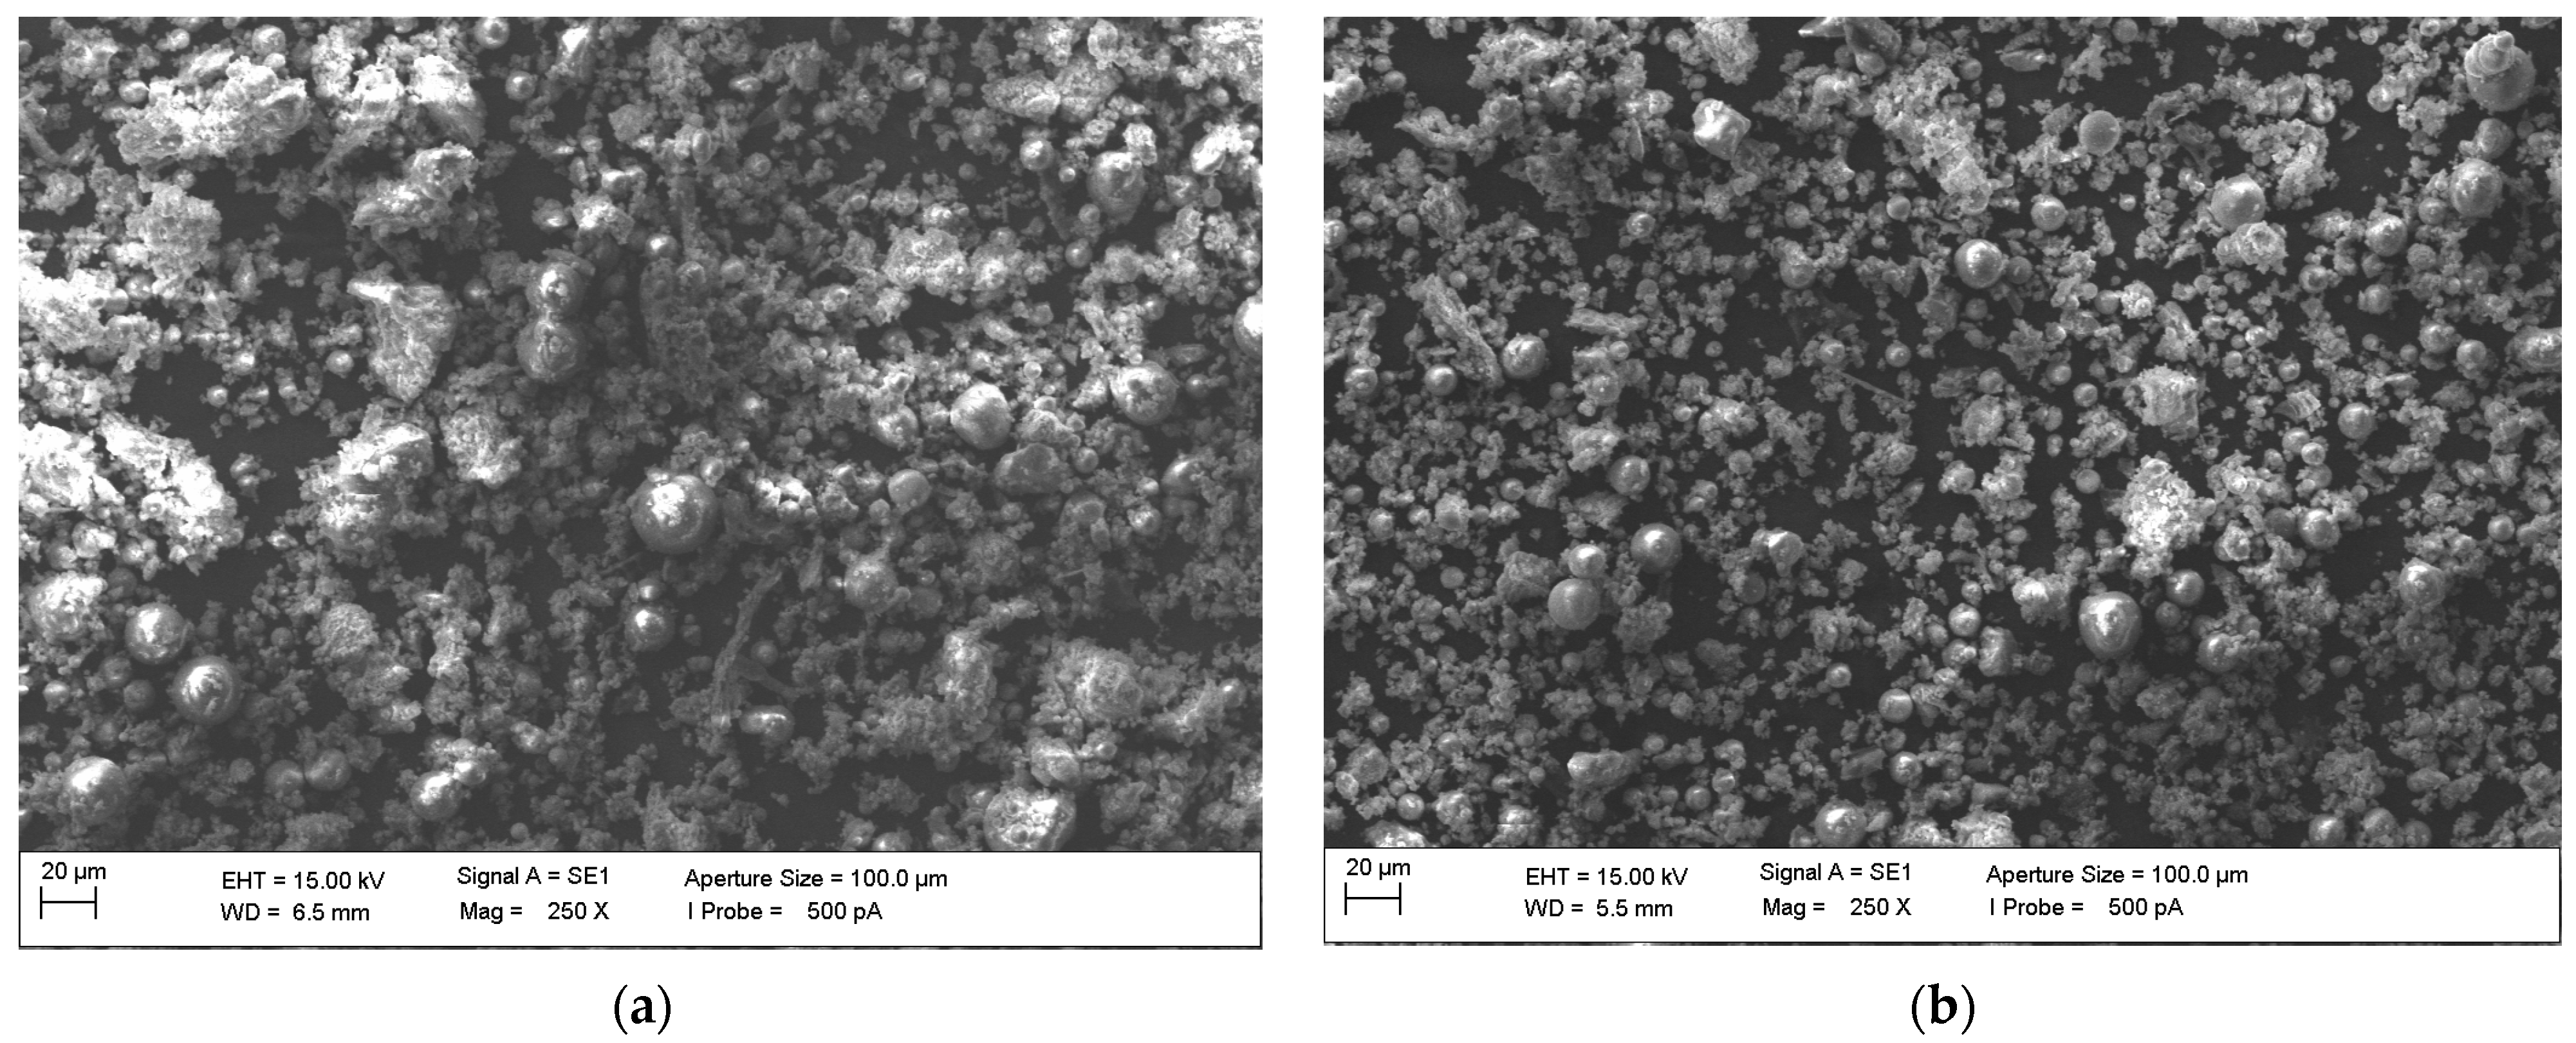
2.1.2. Asphalt Binder and Modifiers
2.1.3. Asphalt Mixes
2.2. Methodology
2.2.1. Penetration
2.2.2. Dynamic Shear Rheometer (DSR) Test
2.2.3. Multiple Stress Creep and Recovery (MSCR)
2.2.4. Linear Amplitude Sweep (LAS)
2.2.5. Binder Yield Energy (BYET) Test
2.2.6. Binder Draindown
2.2.7. Volumetric Test
2.2.8. Water Sensitivity Test
2.2.9. Cantabrian Particle Loss Test
3. Results and Discussion
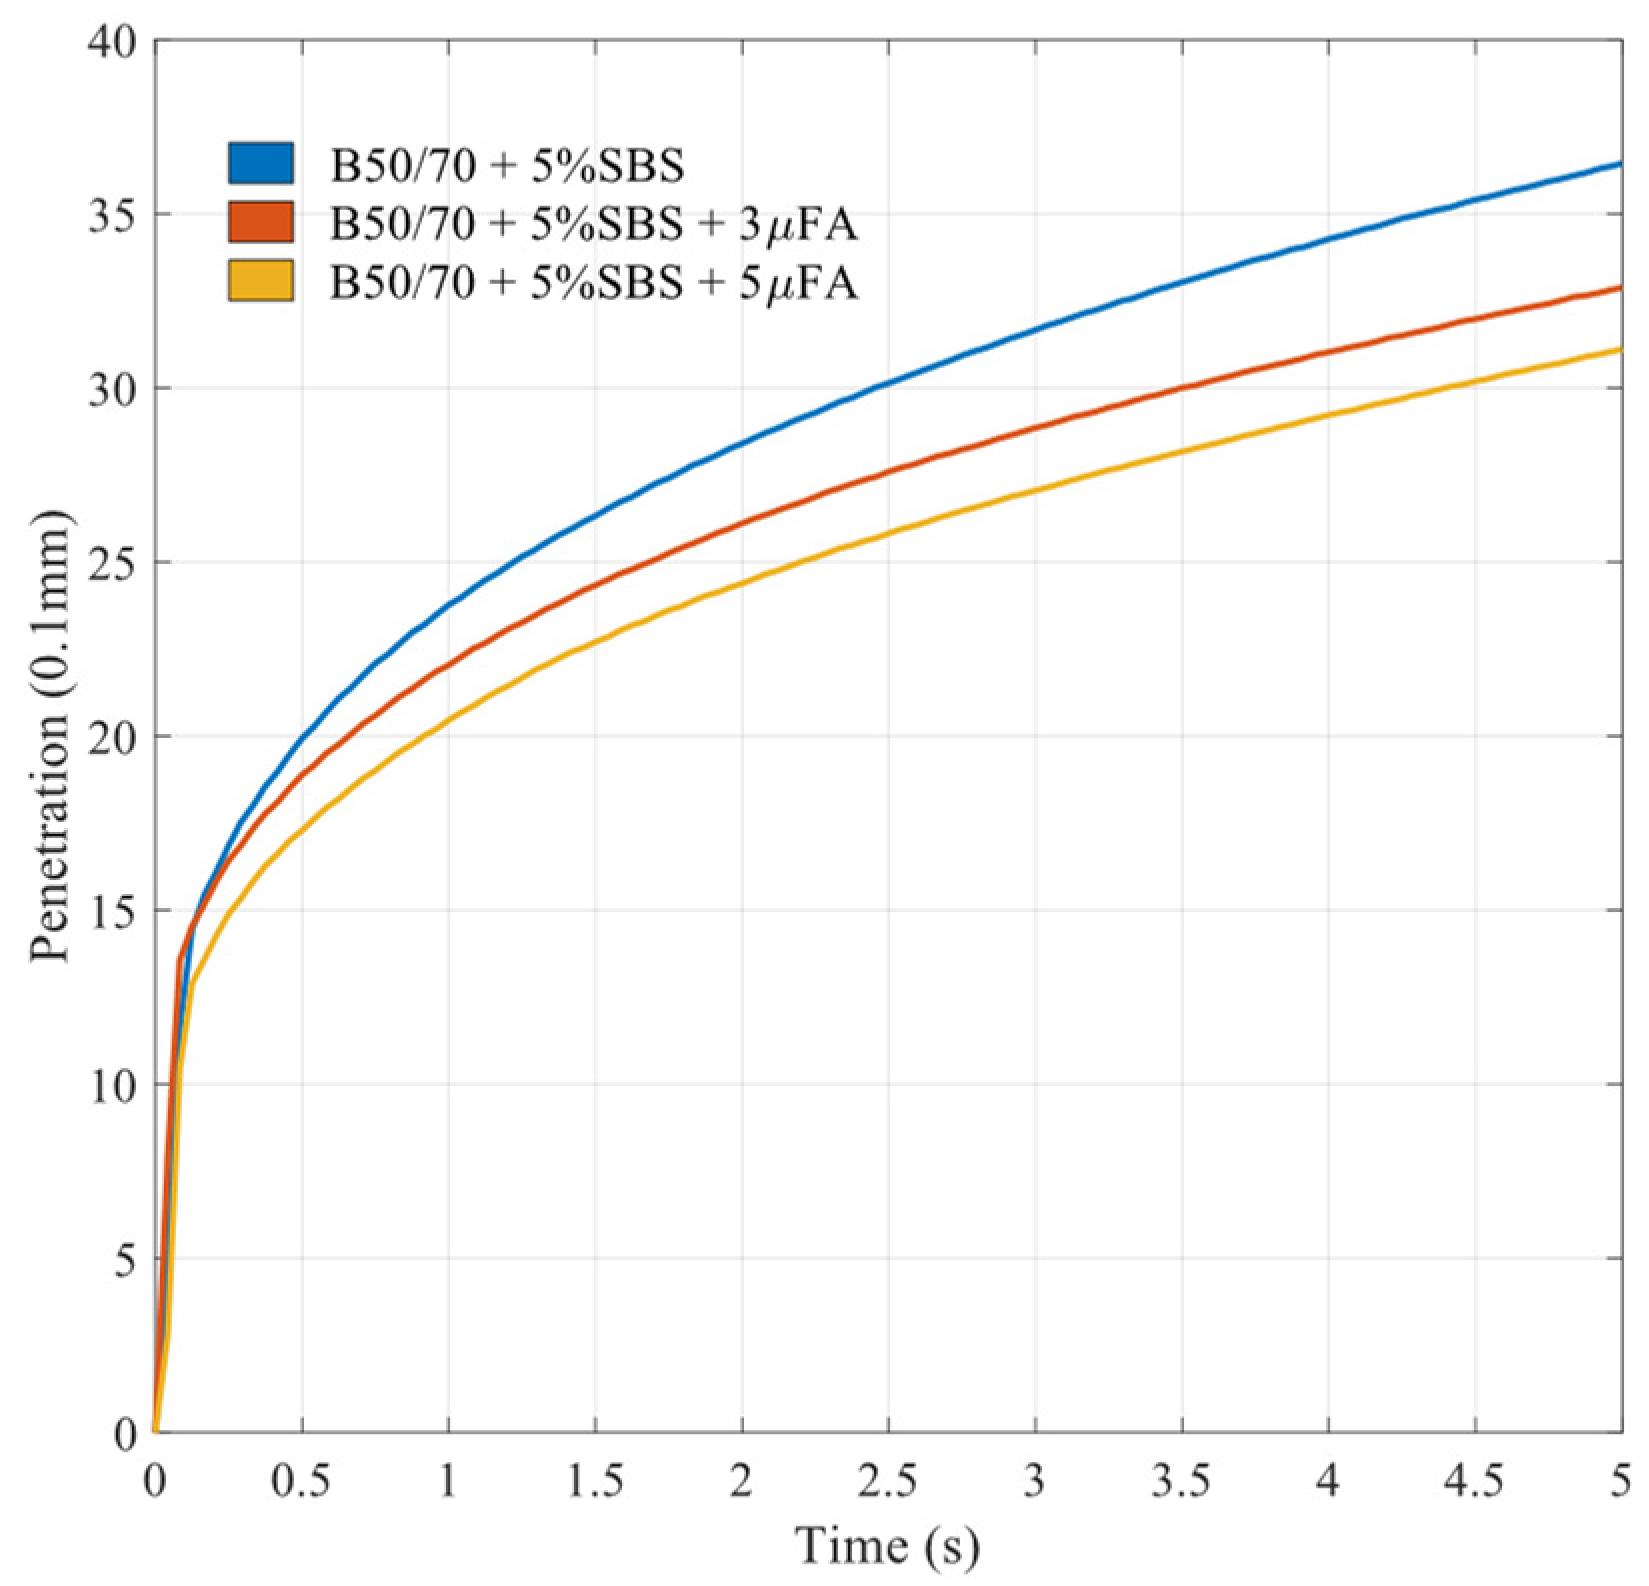
3.1. Penetration
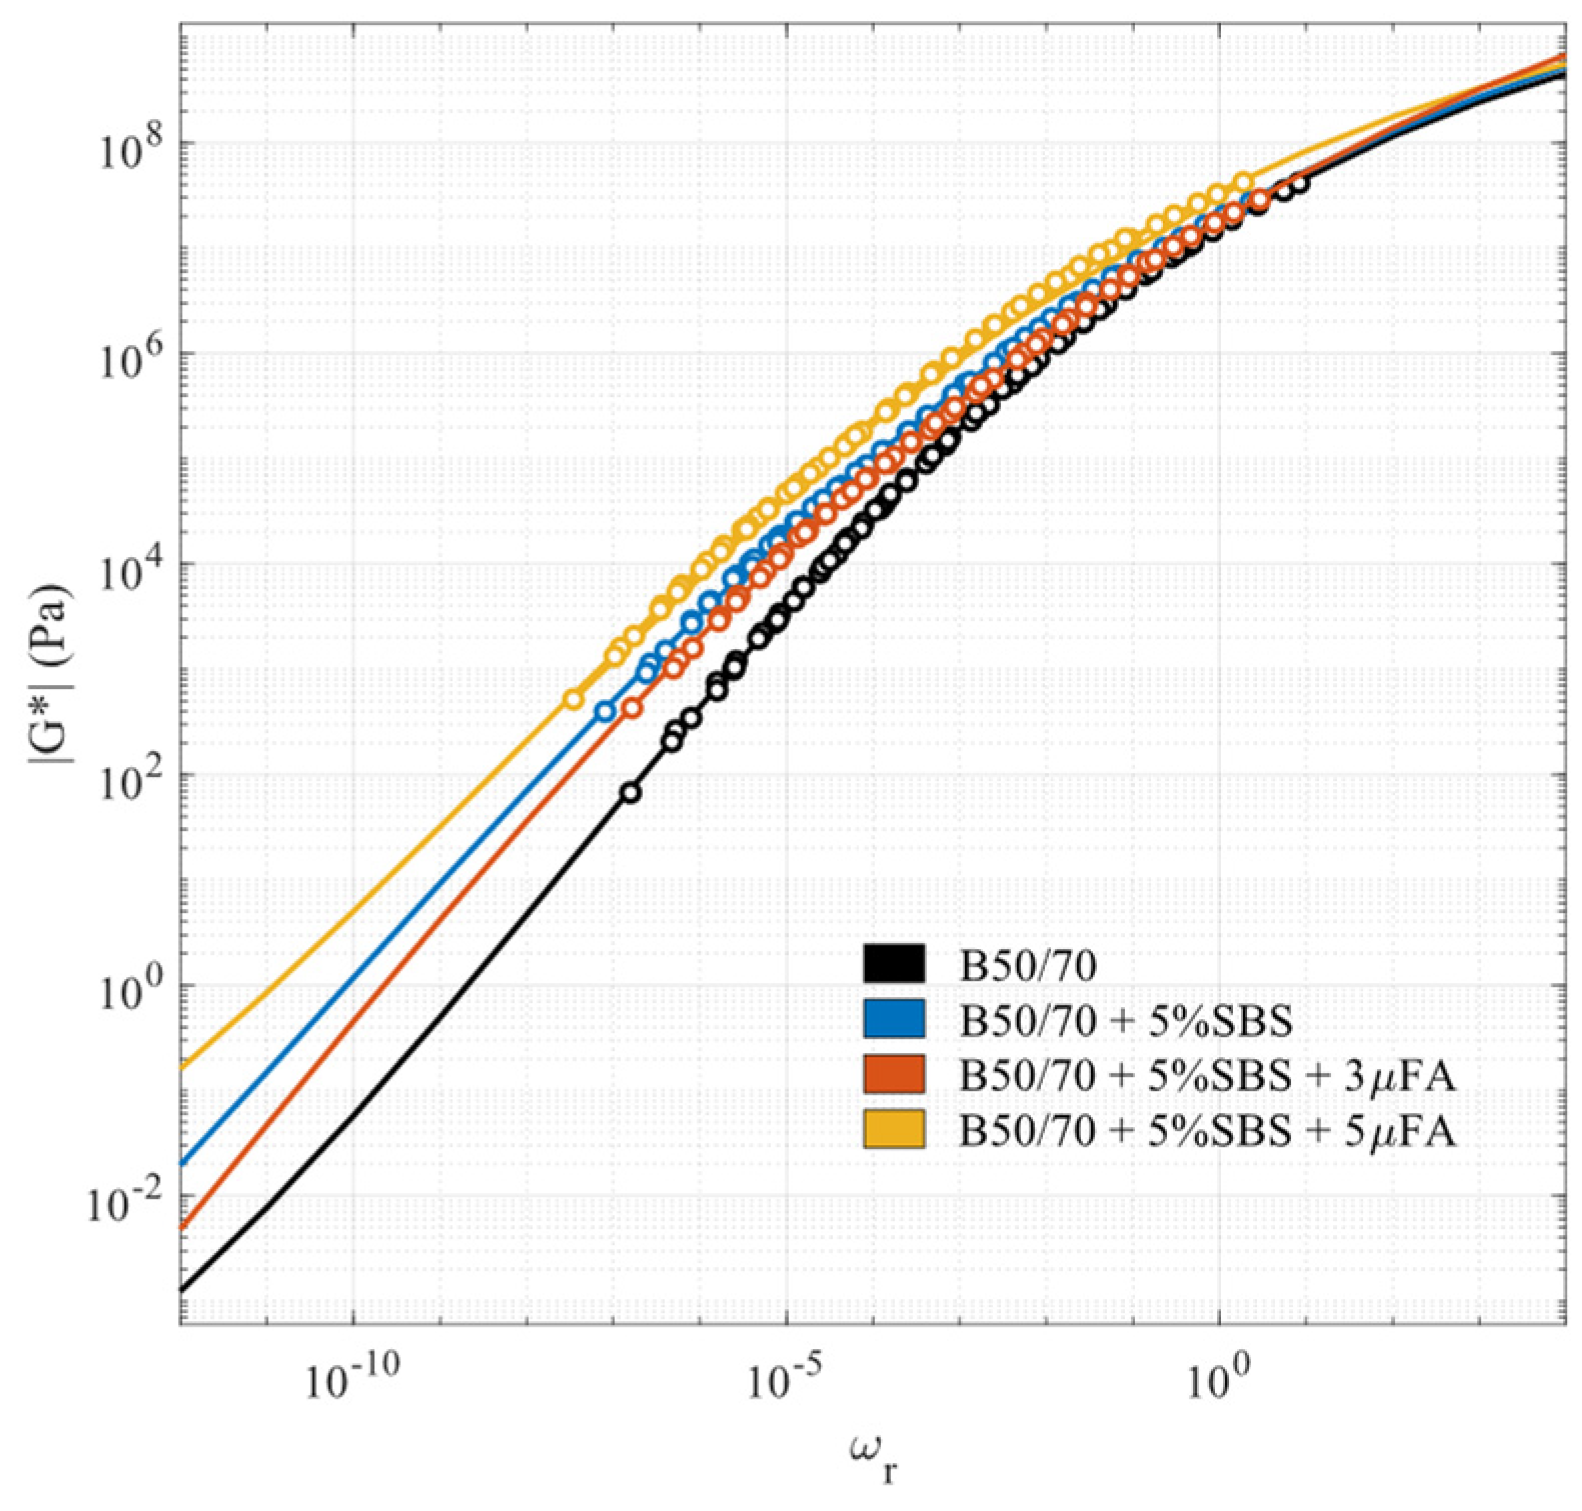
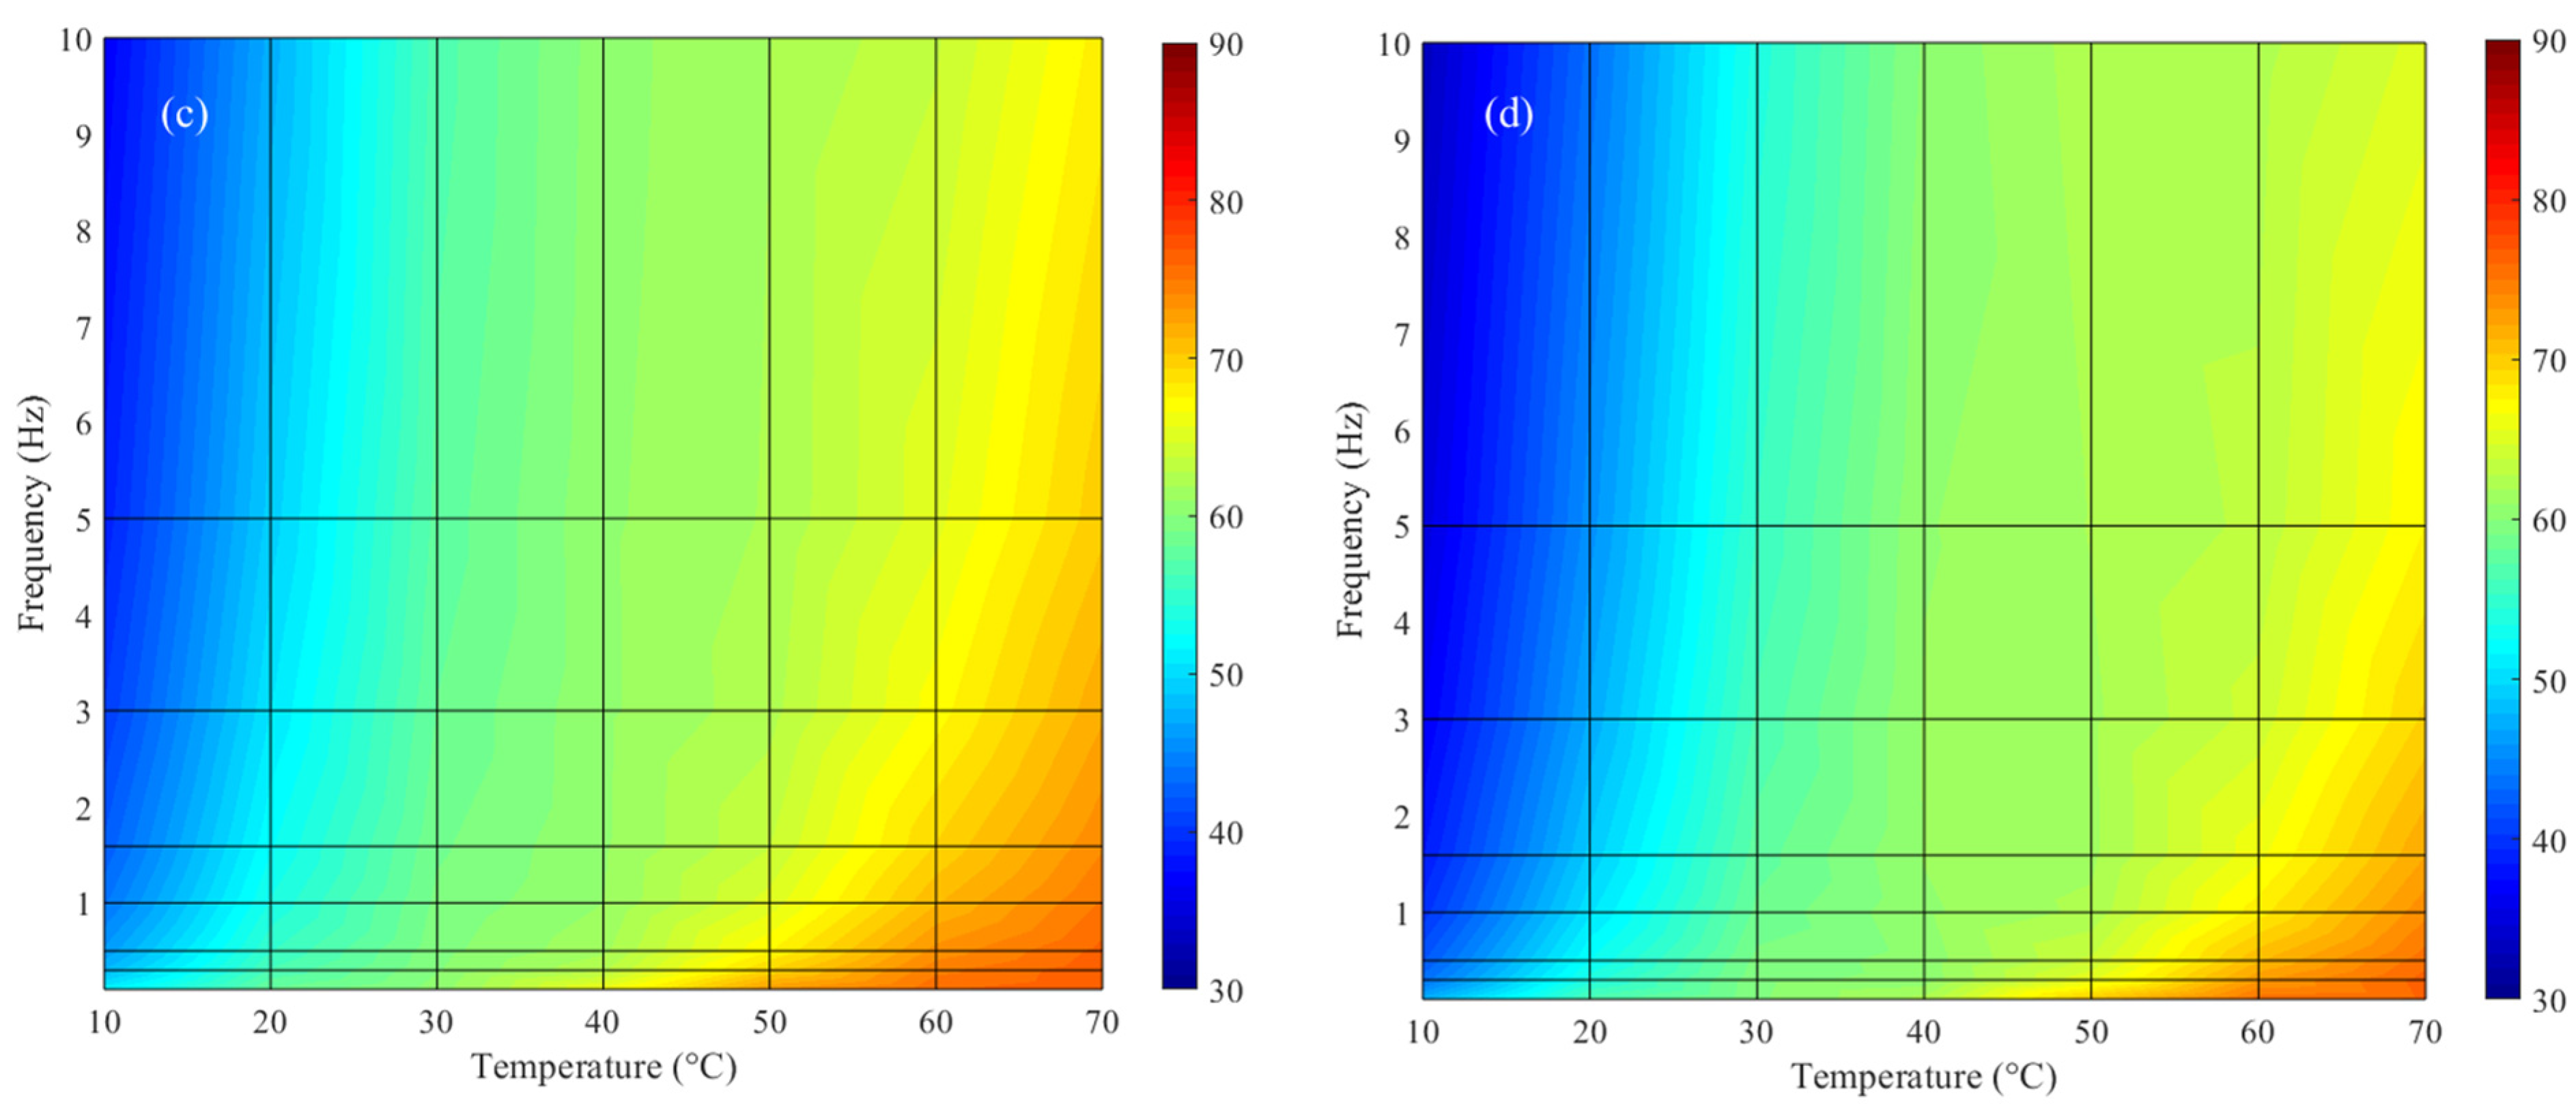
3.2. DSR Test
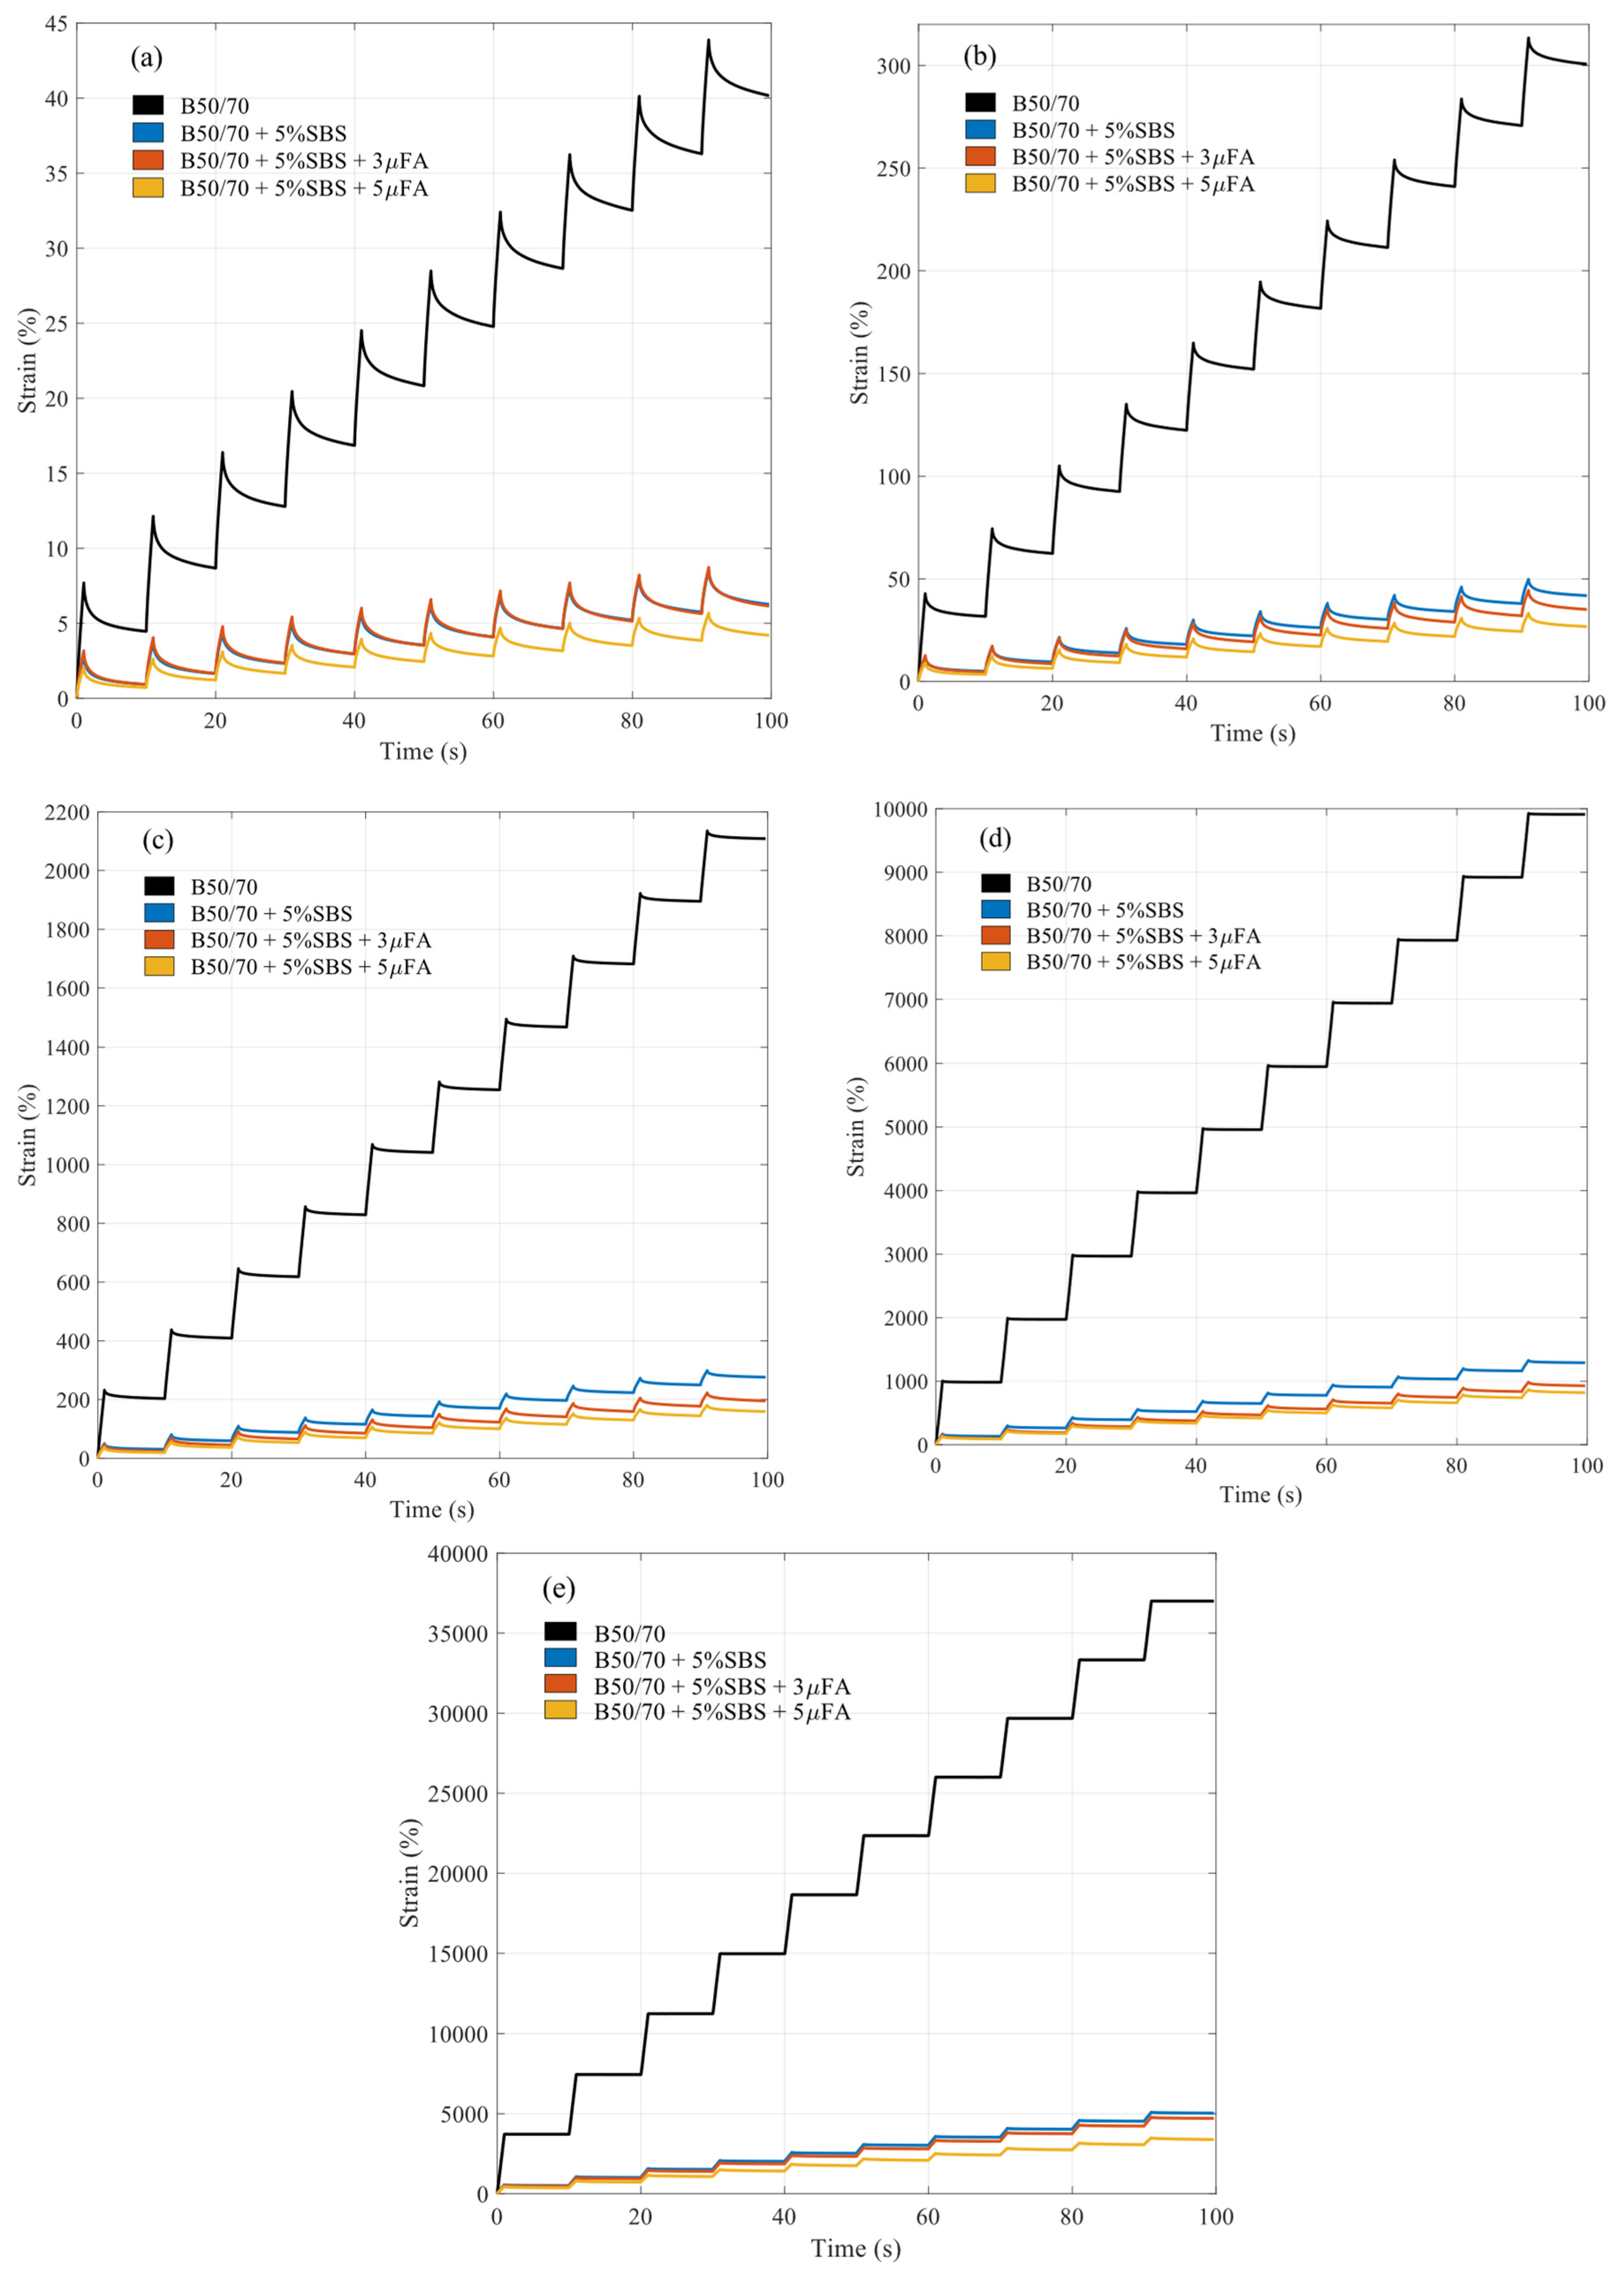
3.3. MSCR Test
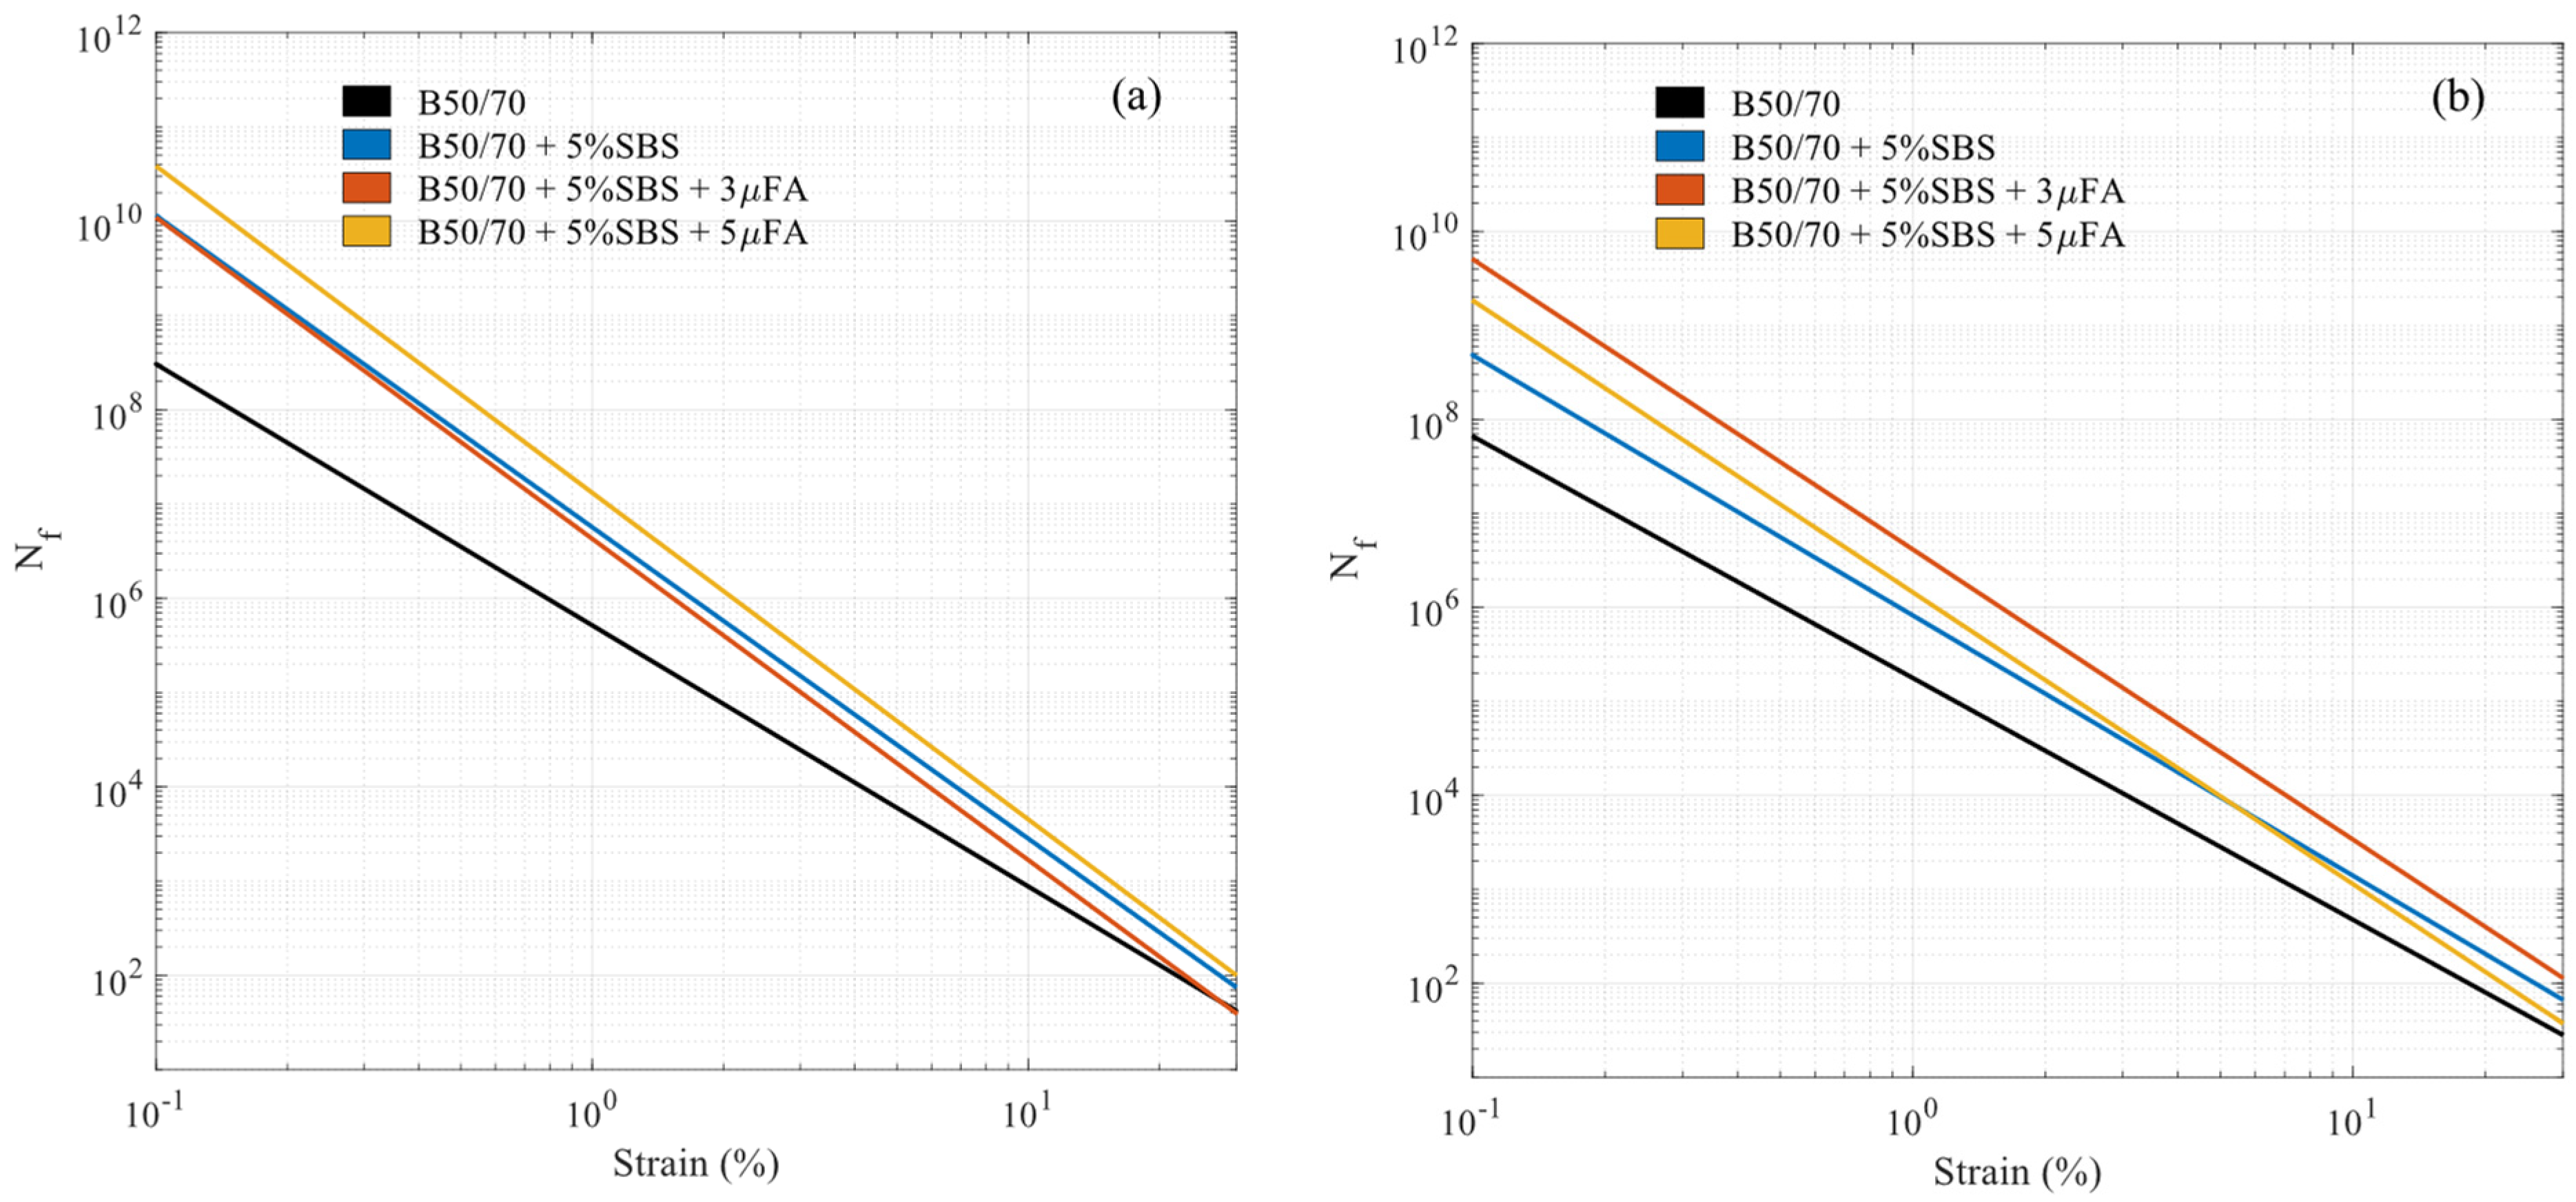
3.4. LAS Test
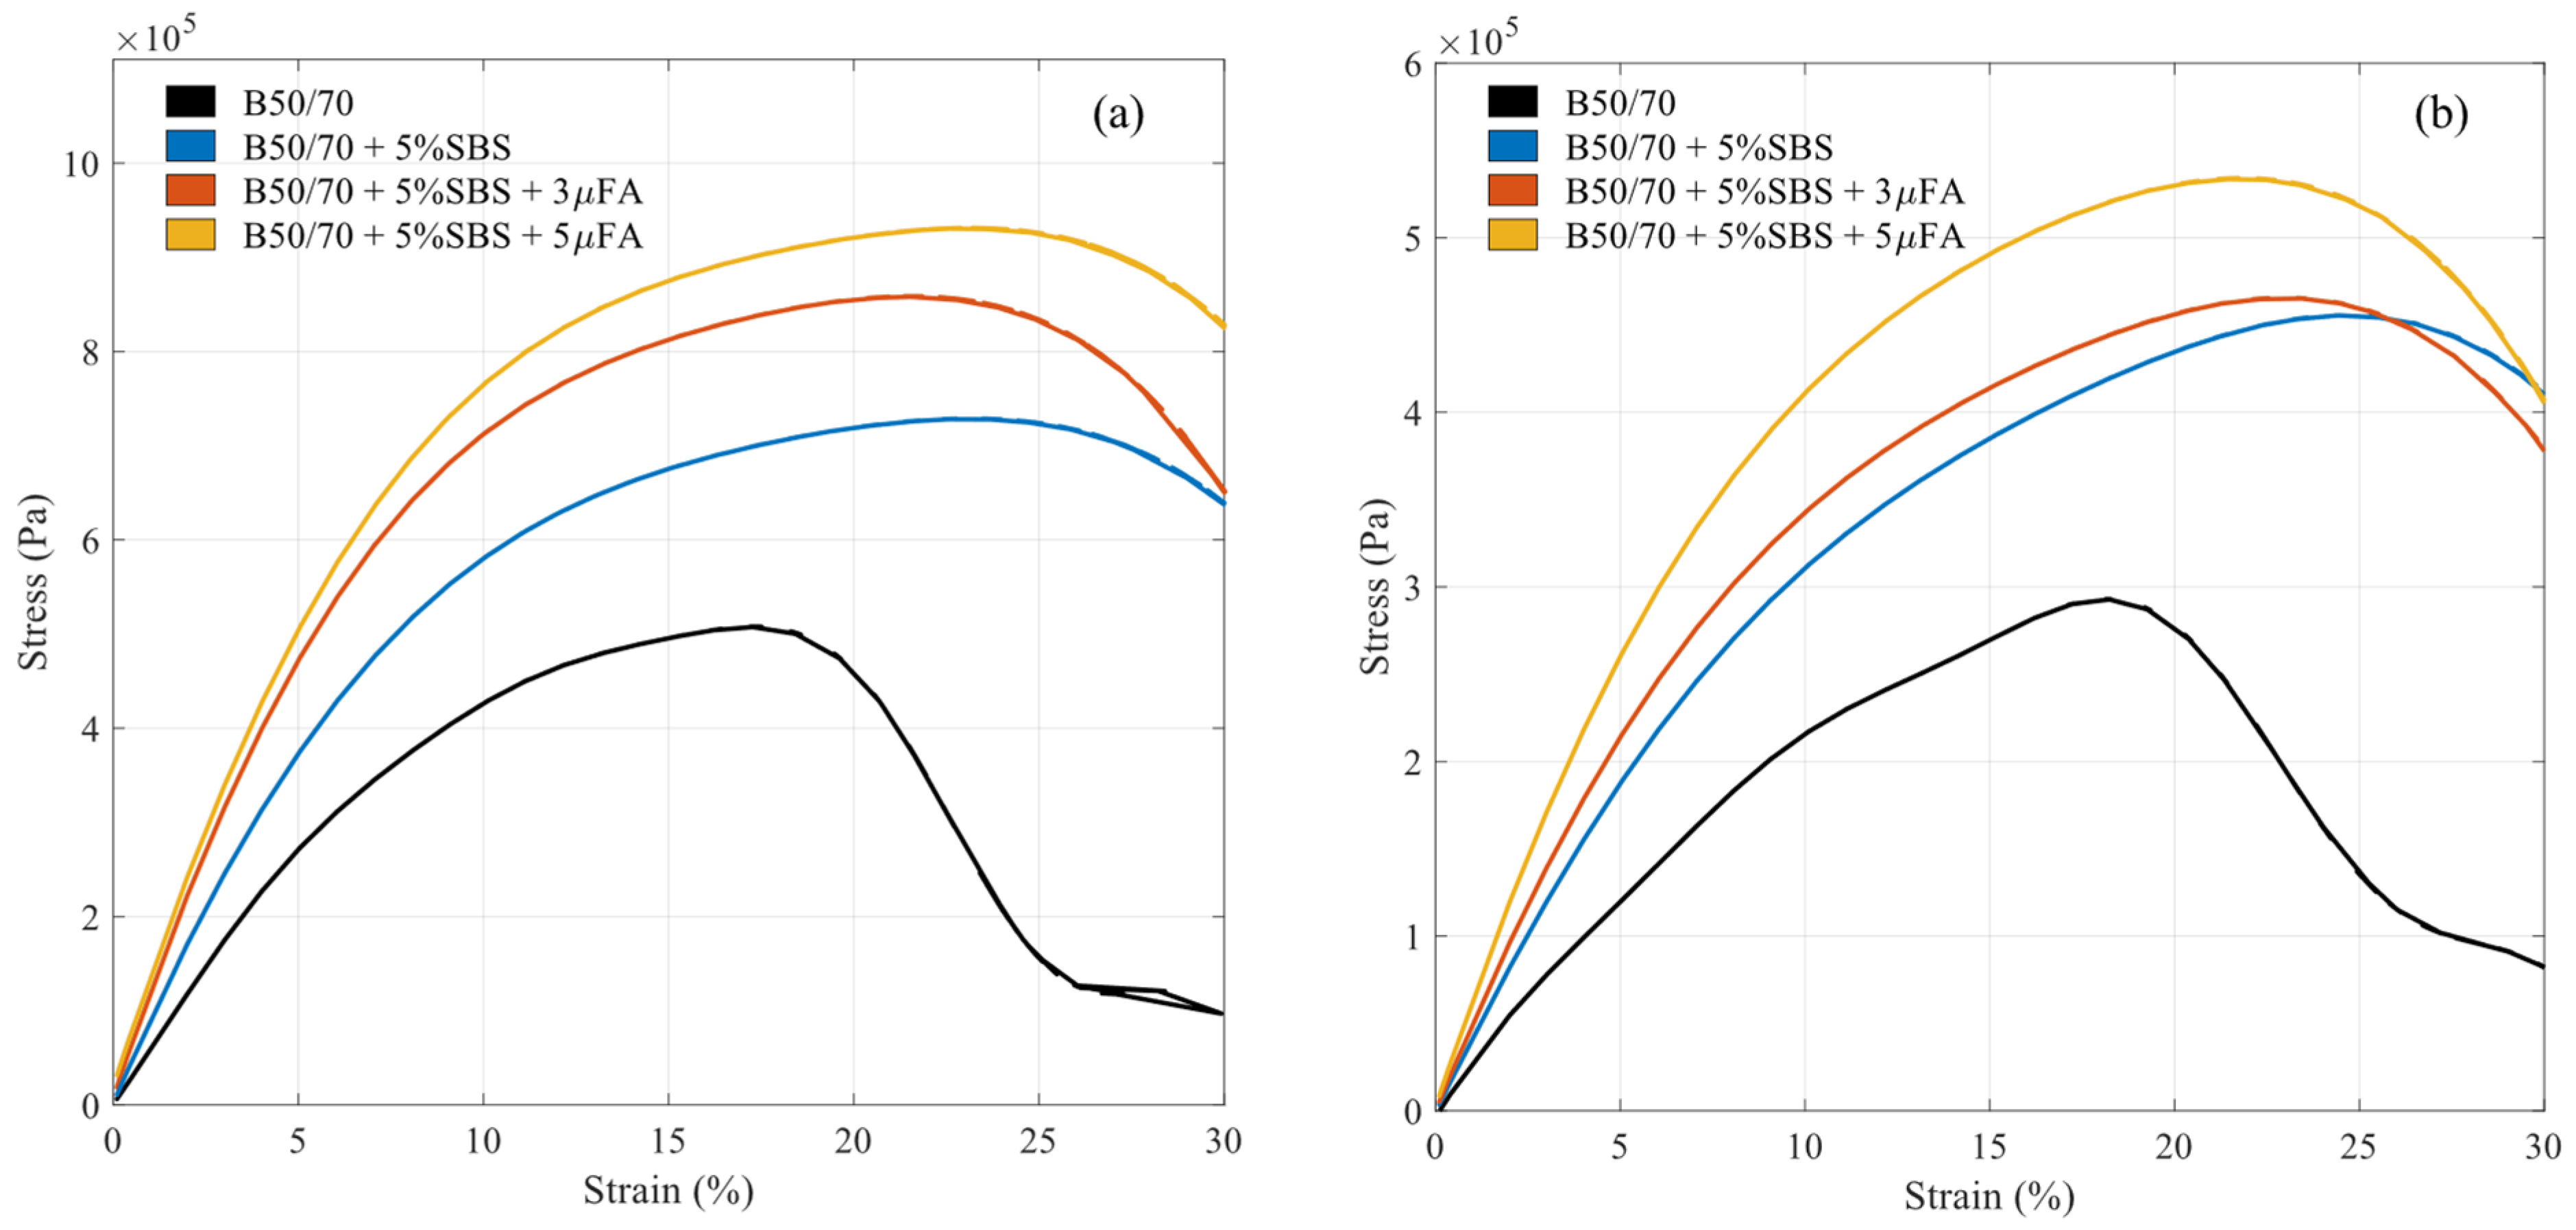
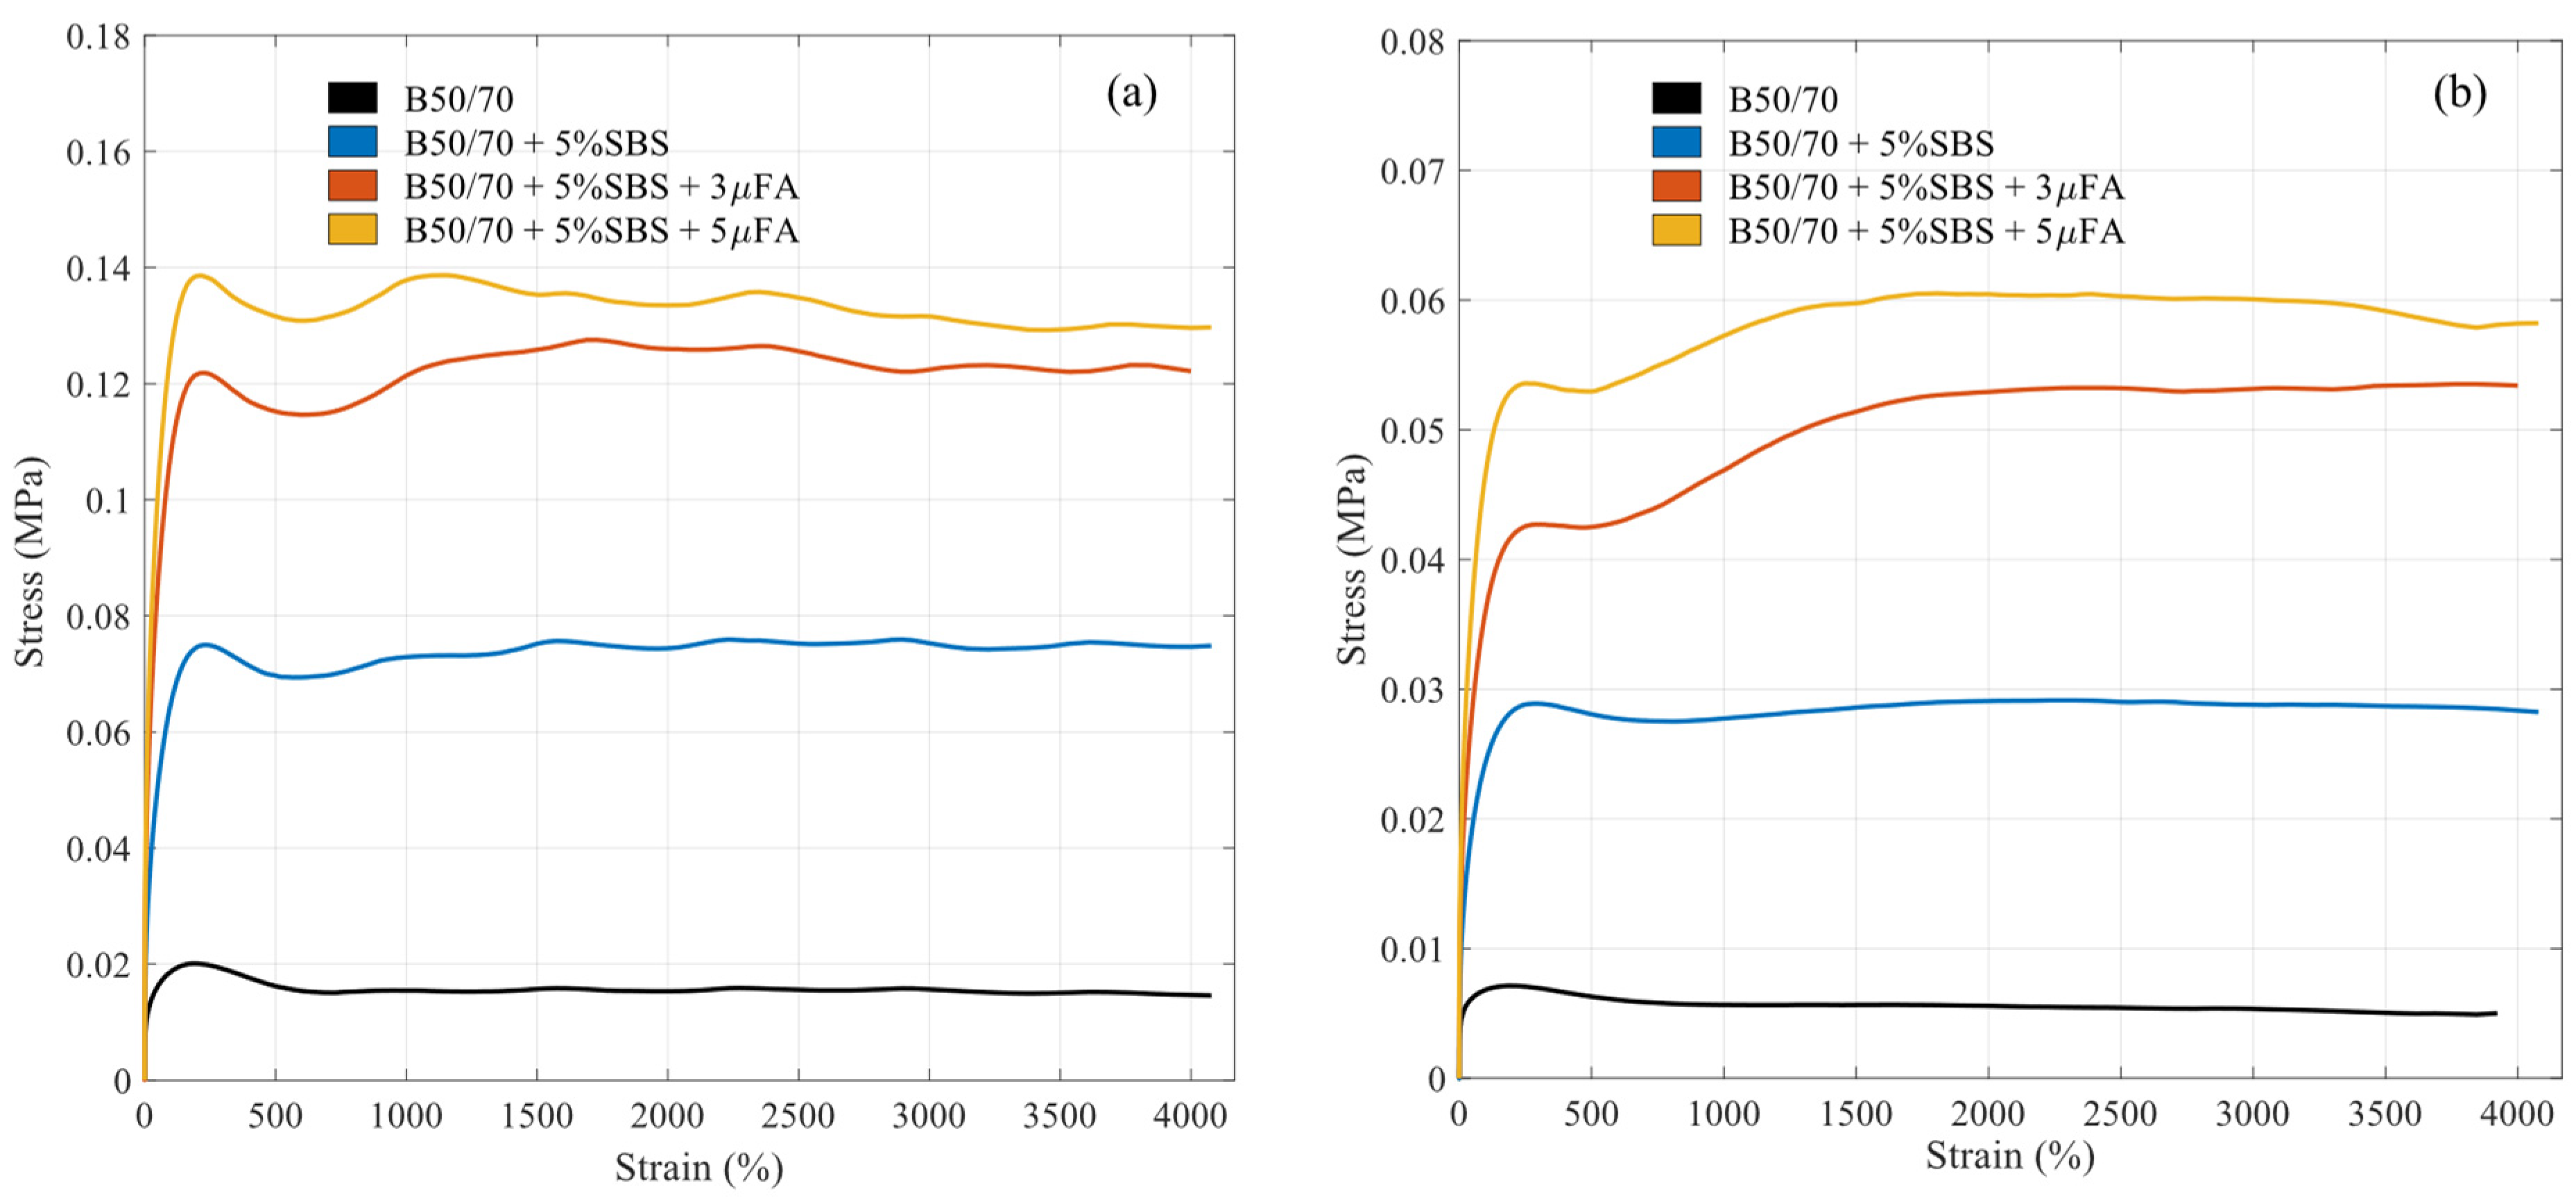
3.5. BYET Test
3.6. Binder Draindown
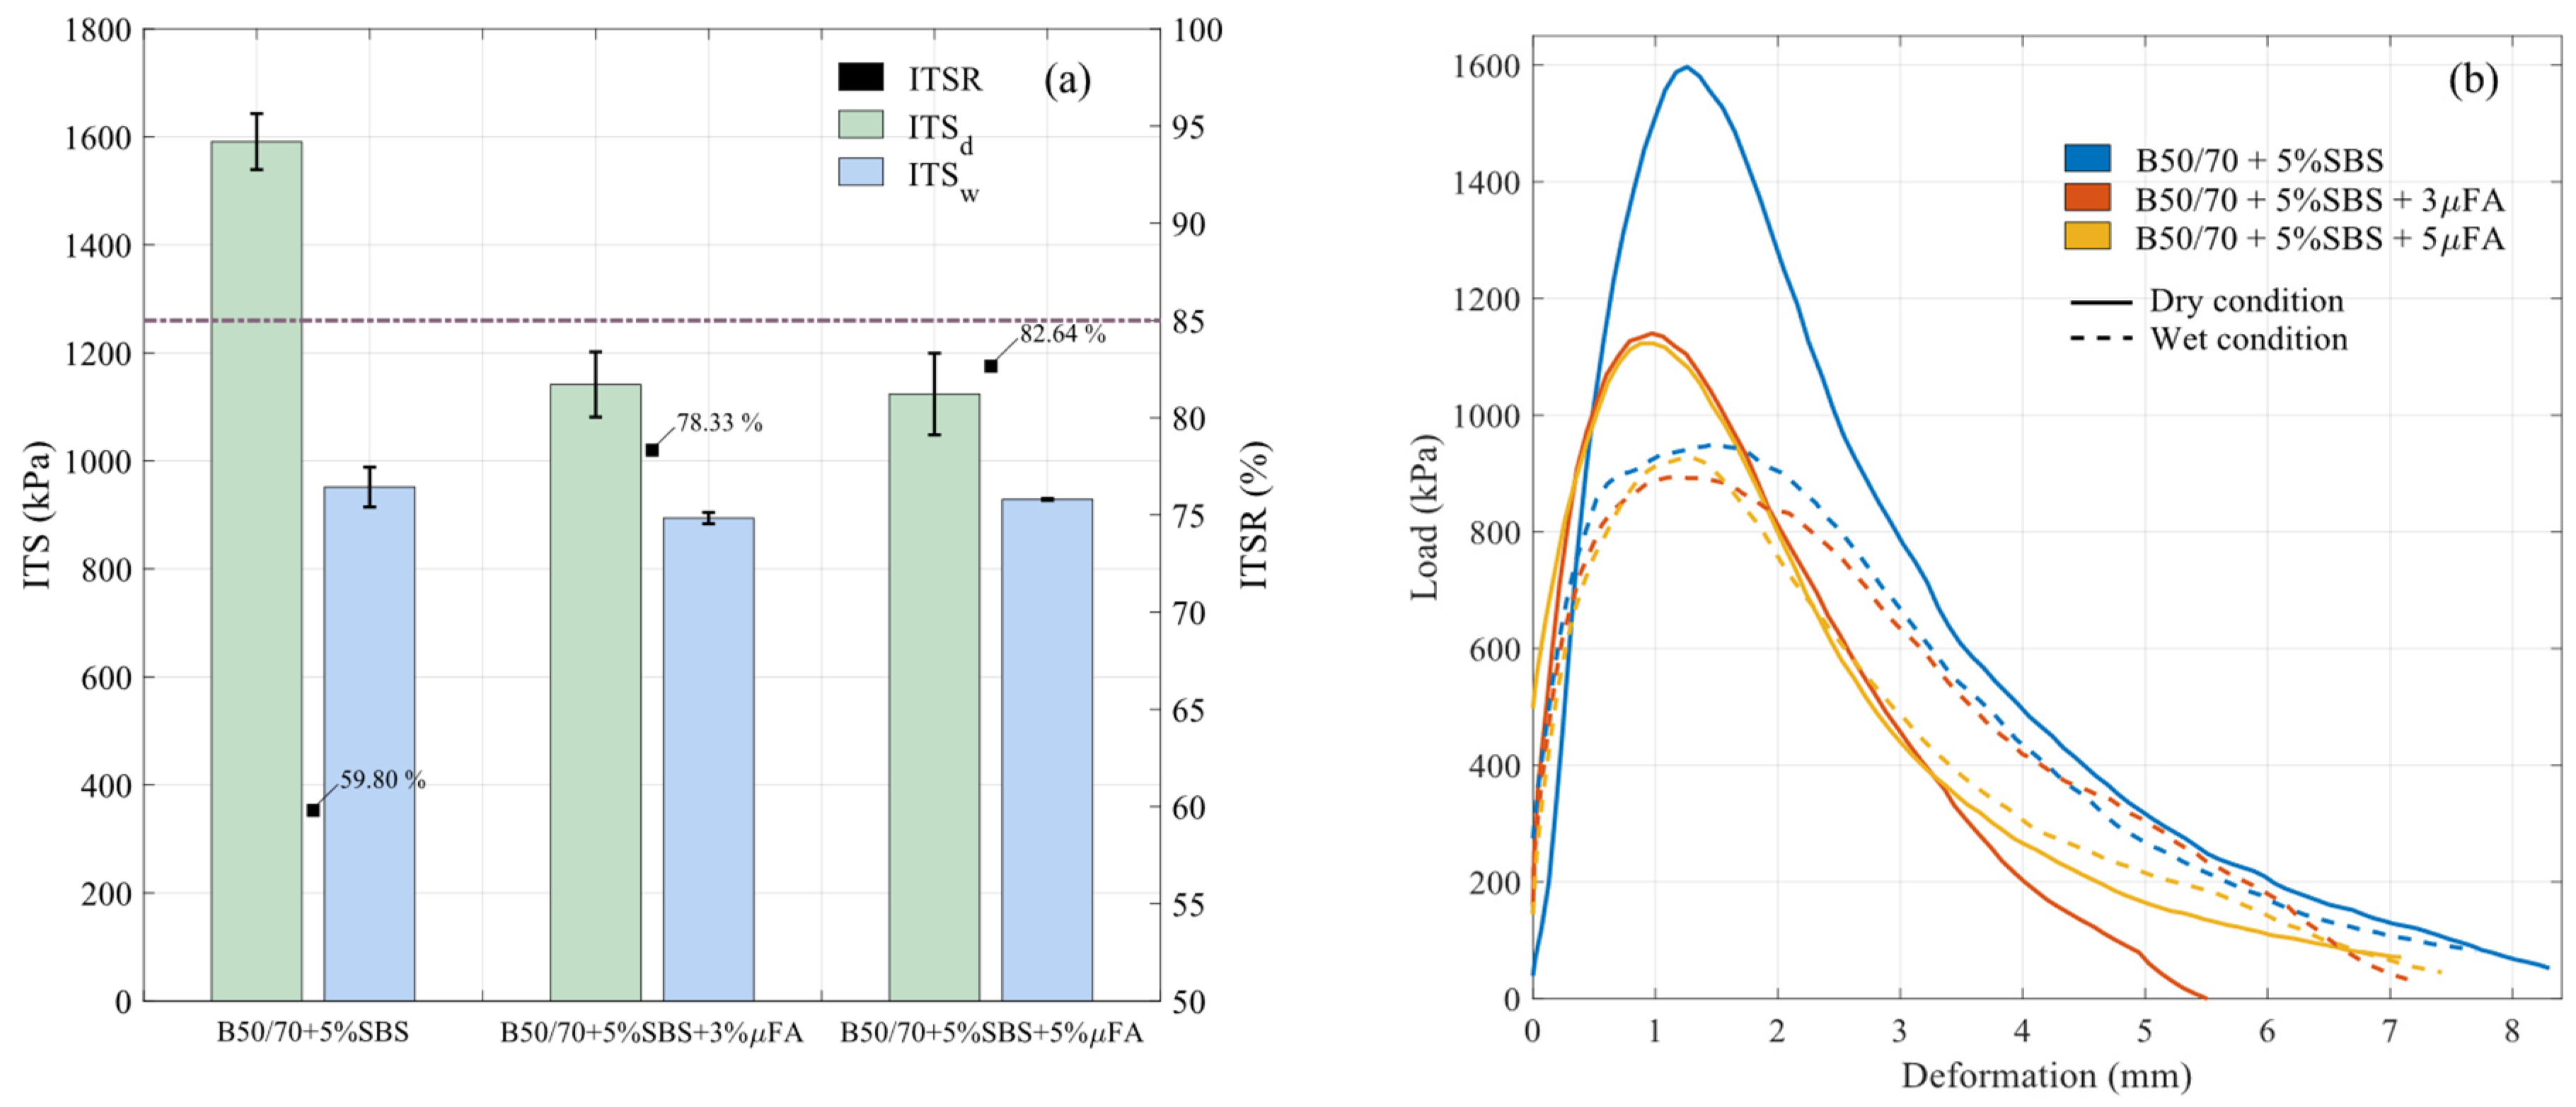
3.7. Water Sensitivity Test
3.8. Cantabrian Loss Particle Test (Dry and Wet Conditions)
4. Conclusions
- -
- Based on the results obtained, it is validated that SBS improves the mechanical properties of the conventional binder, increasing the stiffness (|G*|) and elasticity. In addition, it is found that by increasing the temperature, the increase in d is reduced, preventing premature softening of the binder. Based on the progressive damage tests, it is determined that SBS reduces the plastic range at high temperatures, increasing the R and decreasing the Jnr. Concerning low temperatures, SBS achieves remarkable behavior by increasing the damage intensity D, thus generating a higher C integrity than the conventional binder. Also, SBS increases the fatigue life Nf and creep yield energy Er compared with the conventional binder.
- -
- Based on the rheological tests, adding mFA micro-filler significantly improves the stiffness |G*| of SBS binders in the LVE range. However, the incorporation of mFA does not generate a noticeable impact on d, which shows that its incorporation generates mainly a physical and not a chemical contribution. Concerning the MSCR test, mFA reduces all the test temperatures for creep and recovery phenomena, performing better against permanent deformation and cupping. Based on the VECD simulation, mFA does not significantly affect sample integrity with increasing damage intensity. In this sense, binders with mFA only achieve better C integrity for high damage intensities (D = 176) than the base binder. Concerning the BYET test, the samples with mFA caused an increase in stress after reaching the first maximum stress at 25 °C. The authors hypothesize that this behavior is due to a higher displacement of the binder in the torque caused by the DSR. Thereby, the mFA particles provide extra stiffness, which could be defined as a reserve of the material.
- -
- Based on the results of the PA16 porous mixes, adding mFA to the SBS-modified binder slightly reduces the percentage of voids in the sample (22.45%). This behavior is because the samples with mFA produce a binder with a thicker film, generating a higher bulk density and less binder runoff. Regarding abrasion resistance, it is concluded that all the samples meet the requirements in dry and wet conditions. However, the samples incorporating mFA in wet conditions achieve a higher particle loss with increasing concentration. In contrast, none of the PA samples meet the water sensitivity requirement. However, the addition of mFA manages to decrease the difference between dry and wet ITS. In the dry state, the samples with micro-filler reduce the FE and PE energy due to higher cracking before failure and faster propagation after failure. In the wet state, the mFA samples increase the FE and PE energy due to higher ductility.
- -
- Using FA micro-filler as a secondary modifier in a polymeric binder with SBS improves the mechanical performance at the rheological level and other micro- or nanomaterials studied in the literature review, such as clay or silica fume. On the other hand, it is concluded that the operating conditions in the binder modification process can affect the rheological properties and, thus, the future strength of the pavement. Therefore, implementing the fly ash micro-filler as a second modifier at different dosages should be further investigated in future research for its correct technical and mechanical implementation and eventual economic improvement.
- -
- Future work will compare the μFA material presented in this work with experimental tests on semi-dense and dense asphalt mixtures that will include different temperature conditions and loading frequencies. This is because, in the future, using micromaterials from industrial by-products will reduce pollutants and improve the mechanical properties of the pavement.
Author Contributions
Funding
Institutional Review Board Statement
Informed Consent Statement
Data Availability Statement
Acknowledgments
Conflicts of Interest
References
- Elizondo-Martínez, E.J.; Andrés-Valeri, V.C.; Jato-Espino, D.; Rodriguez-Hernandez, J. Review of porous concrete as multifunctional and sustainable pavement. J. Build. Eng. 2020, 27, 100967. [Google Scholar] [CrossRef]
- Youssef, A.M.; Fahmy, E.A. Evaluation of porous asphalt mixes stabilized by human scalp hair. Case Stud. Constr. Mater. 2023, 19, e02524. [Google Scholar] [CrossRef]
- Cai, J.; Song, C.; Gong, X.; Zhang, J.; Pei, J.; Chen, Z. Gradation of limestone-aggregate-based porous asphalt concrete under dynamic crushing test: Composition, fragmentation and stability. Constr. Build. Mater. 2022, 323, 126532. [Google Scholar] [CrossRef]
- Andrés-Valeri, V.C.; Rodriguez-Torres, J.; Calzada-Perez, M.A.; Rodriguez-Hernandez, J. Exploratory study of porous asphalt mixtures with additions of reclaimed tetra pak material. Constr. Build. Mater. 2018, 160, 233–239. [Google Scholar] [CrossRef]
- Alvarez, A.E.; Martin, A.E.; Estakhri, C. A review of mix design and evaluation research for permeable friction course mixtures. Constr. Build. Mater. 2011, 25, 1159–1166. [Google Scholar] [CrossRef]
- Lagos-Varas, M.; Movilla-Quesada, D.; Raposeiras, A.C.; Monsalve-Cárcamo, P.; Castro-Fresno, D. Rheological analyses of binders modified with triple combinations of Crumb-Rubber, Sasobit and Styrene-Butadiene-Styrene. Case Stud. Constr. Mater. 2023, 19, e02235. [Google Scholar] [CrossRef]
- Yao, X.; Li, C.; Xu, T. Multi-scale studies on interfacial system compatibility between asphalt and SBS modifier using molecular dynamics simulations and experimental methods. Constr. Build. Mater. 2022, 346, 128502. [Google Scholar] [CrossRef]
- Schaur, A.; Unterberger, S.H.; Lackner, R. Impact of molecular structure of SBS on thermo mechanical properties of polymer modified bitumen. Eur. Polym. J. 2017, 96, 256–265. [Google Scholar] [CrossRef]
- Özel, F.; Deniz, M.T.; Yüce, M.İ. Evaluation of olive pomace and SBS modified bitumen to the performance characteristics. Case Stud. Constr. Mater. 2023, 19, e02432. [Google Scholar] [CrossRef]
- Laukkanen, O.V.; Soenen, H.; Winter, H.H.; Seppälä, J. Low-temperature rheological and morphological characterization of SBS modified bitumen. Constr. Build. Mater. 2018, 179, 348–359. [Google Scholar] [CrossRef]
- Shirini, B.; Imaninasab, R. Performance evaluation of rubberized and SBS modified porous asphalt mixtures. Constr. Build. Mater. 2016, 107, 165–171. [Google Scholar] [CrossRef]
- Liu, J.; Li, H.; Harvey, J.; Airey, G.; Lin, S.; Lee, S.L.J.; Zhou, Y.; Yang, B. Study on leaching characteristics and biotoxicity of porous asphalt with biochar fillers. Transp. Res. D Transp. Environ. 2023, 122, 103855. [Google Scholar] [CrossRef]
- Lagos-Varas, M.; Movilla-Quesada, D.; Raposeiras, A.C.; Arenas, J.P.; Calzada-Pérez, M.A.; Vega-Zamanillo, P.L.-G.A. Influence of limestone filler on the rheological properties of bituminous mastics through susceptibility master curves. Constr. Build. Mater. 2020, 231, 117126. [Google Scholar] [CrossRef]
- Lagos-Varas, M.; Movilla-Quesada, D.; Raposeiras, A.C.; Castro-Fresno, D.; Muñoz-Cáceres, O.; Andrés-Valeri, V.C.; Rodríguez-Esteban, M.A. Viscoelasticity modelling of asphalt mastics under permanent deformation through the use of fractional calculus. Constr. Build. Mater. 2022, 329, 127102. [Google Scholar] [CrossRef]
- Tian, Y.; Sun, L.; Li, H.; Zhang, H.; Harvey, J.; Yang, B.; Zhu, Y.; Yu, B.; Fu, K. Laboratory investigation on effects of solid waste filler on mechanical properties of porous asphalt mixture. Constr. Build. Mater. 2021, 279, 122436. [Google Scholar] [CrossRef]
- Yang, B.; Li, H.; Zhang, H.; Sun, L.; Harvey, J.; Tian, Y.; Zhu, Y.; Zhang, X.; Han, D.; Liu, L. Environmental impact of solid waste filler in porous asphalt mixture. Constr. Build. Mater. 2021, 303, 124447. [Google Scholar] [CrossRef]
- Paul, D.; Suresh, M.; Pal, M. Utilization of fly ash and glass powder as fillers in steel slag asphalt mixtures. Case Stud. Constr. Mater. 2021, 15, e00672. [Google Scholar] [CrossRef]
- Blissett, R.S.; Rowson, N.A. A review of the multi-component utilisation of coal fly ash. Fuel 2012, 97, 1–23. [Google Scholar] [CrossRef]
- Suheibani, A.-R.S. The Use of Fly Ash as an Asphalt Extender in Asphalt Concrete Mixes. 1986. Available online: https://www.proquest.com/dissertations-theses/use-fly-ash-as-asphalt-extender-concrete-mixes/docview/303423260/se-2?accountid=26778 (accessed on 1 January 1986).
- Li, F.; Yang, Y.; Wang, L. Evaluation of physicochemical interaction between asphalt binder and mineral filler through interfacial adsorbed film thickness. Constr. Build. Mater. 2020, 252, 119135. [Google Scholar] [CrossRef]
- Mistry, R.; Roy, T.K. Effect of using fly ash as alternative filler in hot mix asphalt. Perspect. Sci. 2016, 8, 307–309. [Google Scholar] [CrossRef]
- Fadil, H.; Jelagin, D.; Partl, M.N. A new viscoelastic micromechanical model for bitumen-filler mastic. Constr. Build. Mater. 2020, 253, 119062. [Google Scholar] [CrossRef]
- El-Shafie, M.; Ibrahim, I.M.; El Rahman, A.M.M.A. The addition effects of macro and nano clay on the performance of asphalt binder. Egypt. J. Pet. 2012, 21, 149–154. [Google Scholar] [CrossRef]
- Roman, C.; García-Morales, M. Comparative assessment of the effect of micro- and nano- fillers on the microstructure and linear viscoelasticity of polyethylene-bitumen mastics. Constr. Build. Mater. 2018, 169, 83–92. [Google Scholar] [CrossRef]
- Farias, L.G.A.T.; Leitinho, J.L.; de C. Amoni, B.; Bastos, J.B.S.; Soares, J.B.; Soares, S.D.A.; de Sant’Ana, H.B. Effects of nanoclay and nanocomposites on bitumen rheological properties. Constr. Build. Mater. 2016, 125, 873–883. [Google Scholar] [CrossRef]
- Sedaghat, B.; Taherrian, R.; Hosseini, S.A.; Mousavi, S.M. Rheological properties of bitumen containing nanoclay and organic warm-mix asphalt additives. Constr. Build. Mater. 2020, 243, 118092. [Google Scholar] [CrossRef]
- Shi, X.; Cai, L.; Xu, W.; Fan, J.; Wang, X. Effects of nano-silica and rock asphalt on rheological properties of modified bitumen. Constr. Build. Mater. 2018, 161, 705–714. [Google Scholar] [CrossRef]
- Fathi, M.; Yousefipour, A.; Hematpoury Farokhy, E. Mechanical and physical properties of expanded polystyrene structural concretes containing Micro-silica and Nano-silica. Constr. Build. Mater. 2017, 136, 590–597. [Google Scholar] [CrossRef]
- Cheraghian, G.; Wistuba, M.P. Effect of fumed silica nanoparticles on ultraviolet Aging Resistance of Bitumen. Nanomaterials 2021, 11, 454. [Google Scholar] [CrossRef]
- UNE-EN 1097-2; Tests for Mechanical and Physical Properties of Aggregates. Part 2: Methods for the Determination of Resistance to Fragmentation. AENOR: Madrid, Spain, 2021.
- UNE-EN 1097-6; Tests for Mechanical and Physical Properties of Aggregates—Part 6: Determination of Particle Density and Water Absorption. European Committee for Standardization: Brussels, Belgium, 2022.
- UNE-EN 933-8; Tests for Geometrical Properties of Aggregates. Part 8: Assessment of Fines Sand Equivalent Test. AENOR: Madrid, Spain, 2015.
- UNE-EN 1097-8; Tests for Mechanical and Physical Properties of Aggregates. Part 8: Determination of the Polished Stone Value. AENOR: Madrid, Spain, 2021.
- UNE-EN 933-3; Tests for Geometrical Properties of Aggregates. Part 3: Determination of Particle Shape. Flakiness Index. AENOR: Madrid, Spain, 2012.
- UNE-EN 1426; Bitumen and Bituminous Binders. Determination of Needle Penetration. AENOR: Madrid, Spain, 2015.
- UNE-EN 1427; Bitumen and Bituminous Binders. Determination of the Softening Point. Ring and Ball Method. AENOR: Madrid, Spain, 2015.
- UNE-EN 15326; Bitumen and Bituminous Binders. Measurement of Density and Specific Gravity. Capillary-Stoppered Pyknometer Method. AENOR: Madrid, Spain, 2009.
- UNE-EN 12591; Bitumen and Bituminous Binders. Specifications for Paving Grade Bitumens. AENOR: Madrid, Spain, 2009.
- Lagos-Varas, M.; Raposeiras, A.C.; Movilla-Quesada, D.; Arenas, J.P.; Castro-Fresno, D.; Muñoz-Cáceres, O.; Andres-Valeri, V.C. Study of the permanent deformation of binders and asphalt mixtures using rheological models of fractional viscoelasticity. Constr. Build. Mater. 2020, 260, 120438. [Google Scholar] [CrossRef]
- UNE-EN 12697-18; Bituminous Mixtures Test Methods Part 18: Binder Drainage. AENOR: Madrid, Spain, 2018.
- UNE-EN 12697-8; Bituminous Mixtures. Test Methods. Part 8: Determination of Void Characteristics of Bituminous Specimens. AENOR: Madrid, Spain, 2020.
- Lagos-Varas, M.; Movilla-Quesada, D.; Raposeiras, A.C.; Castro-Fresno, D.; Vega-Zamanillo, Á.; Cumian-Benavides, M. Use of Hydrated Ladle Furnace Slag as a filler substitute in asphalt mastics: Rheological analysis of filler/bitumen interaction. Constr. Build. Mater. 2022, 332, 127370. [Google Scholar] [CrossRef]
- Lastra-González, P.; Indacoechea-Vega, I.; Calzada-Pérez, M.A.; Castro-Fresno, D.; Vega-Zamanillo, A. Mechanical assessment of the induction heating as a method to accelerate the drying process of cold porous asphalt mixtures. Constr. Build. Mater. 2019, 208, 646–650. [Google Scholar] [CrossRef]
- Slebi-Acevedo, C.J.; Lastra-González, P.; Indacoechea-Vega, I.; Castro-Fresno, D. Laboratory assessment of porous asphalt mixtures reinforced with synthetic fibers. Constr. Build. Mater. 2020, 234, 117224. [Google Scholar] [CrossRef]
- Arrieta, V.S.; Maquilón, J.E.C. Resistance to Degradation or Cohesion Loss in Cantabro Test on Specimens of Porous Asphalt Friction Courses. Procedia-Soc. Behav. Sci. 2014, 162, 290–299. [Google Scholar] [CrossRef]
- Zhao, S.; Huang, B.; Shu, X.; Moore, J.; Bowers, B. Effects of WMA technologies on asphalt binder blending. J. Mater. Civ. Eng. 2016, 28, 04015106. [Google Scholar] [CrossRef]
- Sun, Y.; Wang, W.; Chen, J. Investigating impacts of warm-mix asphalt technologies and high reclaimed asphalt pavement binder content on rutting and fatigue performance of asphalt binder through MSCR and LAS test. J. Clean Prod. 2019, 219, 879–893. [Google Scholar] [CrossRef]
- Micaelo, R.; Guerra, A.; Quaresma, L.; Cidade, M.T. Study of the effects of filler on the fatigue behavior of bitumen-filler mastics under DSR testing. Constr. Build. Mater. 2017, 155, 228–238. [Google Scholar] [CrossRef]


| Properties | Result | Limits | Standard |
|---|---|---|---|
| Limestone | |||
| Los Angeles coefficient | 28 | - | EN 1097-2 [30] |
| Specific weight (g/cm3) | 2.724 | - | EN 1097-6 [31] |
| Sand equivalent | 78 | >55 | EN 933-8 [32] |
| Ophite | |||
| Los Angeles coefficient | 13 | ≤20 | EN 1097-2 [30] |
| Specific weight (g/cm3) | 2.794 | - | EN 1097-6 [31] |
| Polished stone value (PSV) | >56 | ≥50 | EN 1097-8 [33] |
| Flakiness index (%) | 8 | ≤20 | EN 933-3 [34] |
| Water absorption | 0.60 | - | EN 1097-6 [31] |
| Test | Units | Result | Standard |
|---|---|---|---|
| Penetration (25 °C) | dmm | 65 | EN 1426 [35] |
| Softening point | °C | 48.8 | EN 1427 [36] |
| Density | g/cm3 | 1.045 | EN 15326 [37] |
| Penetration index | - | −1.0 | EN 12591 [38] |
| Test | Units | Result | Standard |
|---|---|---|---|
| Styrene-Butadiene-Styrene | |||
| Size max | mm | 6.3 | - |
| Specific weight | g/cm3 | 0.93 | - |
| Type | - | Block Copolymer | - |
| Provider | - | Dynasol | - |
| Fly ash filler | |||
| Density | g/cm3 | 2.450 | - |
| Rigden voids | % | 73 | - |
| Size (mm) | 0.063 | 0.056 | 0.050 | 0.040 | 0.032 | 0.025 | 0.015 |
| Passed through (%) | 84.68 | 69.34 | 57.03 | 39.57 | 19.80 | 9.55 | 6.55 |
| Sample | Variables | 10 °C | 20 °C | 30 °C | 40 °C | 50 °C | 60 °C | 70 °C |
|---|---|---|---|---|---|---|---|---|
| B50/70 | |G*| (kPa) | 10,470.60 | 1957.60 | 324.67 | 64.08 | 12.47 | 3.35 | 1.04 |
| |G*|/sin(d) (kPa) | 14,306.15 | 2301.72 | 353.28 | 66.96 | 12.71 | 3.38 | 1.05 | |
| |G*|·sin(d) (kPa) | 7663.38 | 1664.93 | 298.38 | 61.33 | 12.23 | 3.33 | 1.04 | |
| B50/70 5% SBS | |G*| (kPa) | 12,353.60 | 2803.60 | 532.72 | 117.50 | 34.05 | 11.00 | 4.26 |
| |G*|/sin(d) (kPa) | 18,813.21 | 3608.50 | 626.54 | 135.65 | 38.52 | 11.86 | 4.45 | |
| |G*|·sin(d)(kPa) | 8111.93 | 2178.24 | 452.94 | 101.77 | 30.10 | 10.20 | 4.09 | |
| B50/70 5% SBS 3% mFA | |G*| (kPa) | 12,990.70 | 2784.68 | 574.81 | 141.96 | 41.10 | 12.62 | 4.37 |
| |G*|/sin(d) (kPa) | 19,277.19 | 3517.00 | 671.38 | 162.63 | 45.84 | 13.47 | 4.55 | |
| |G*|·sin(d) (kPa) | 8754.30 | 2204.85 | 492.13 | 123.92 | 36.85 | 11.81 | 4.20 | |
| B50/70 5% SBS 5% mFA | |G*| (kPa) | 20,311.90 | 4750.43 | 899.47 | 179.22 | 46.56 | 14.66 | 5.38 |
| |G*|/sin(d) (kPa) | 32,723.15 | 6292.15 | 1064.33 | 204.93 | 52.92 | 16.02 | 5.65 | |
| |G*|·sin(d) (kPa) | 12,607.99 | 3586.47 | 760.15 | 156.74 | 40.97 | 13.42 | 5.12 |
| Temperature | Variables | B50/70 | B50/70 5% SBS | B50/70 5% SBS 3% mFA | B50/70 5% SBS 5% mFA |
|---|---|---|---|---|---|
| 30 °C | Strain (%) | 40.16 | 6.27 | 6.15 | 4.21 |
| R (%) | 17.80 | 40.36 | 43.54 | 39.57 | |
| Jnr (1/kPa) | 1.25 | 0.20 | 0.20 | 0.13 | |
| 40 °C | Strain (%) | 300.64 | 41.83 | 35.07 | 26.75 |
| R (%) | 9.75 | 29.04 | 34.77 | 33.27 | |
| Jnr (1/kPa) | 9.39 | 1.31 | 1.10 | 0.84 | |
| 50 °C | Strain (%) | 2108.47 | 276.14 | 195.24 | 159.01 |
| R (%) | 3.73 | 16.16 | 23.36 | 22.81 | |
| Jnr (1/kPa) | 65.89 | 8.63 | 6.10 | 4.97 | |
| 60 °C | Strain (%) | 9912.17 | 1290.28 | 927.95 | 819.29 |
| R (%) | 0.56 | 7.31 | 13.58 | 13.09 | |
| Jnr (1/kPa) | 309.76 | 40.32 | 29.00 | 25.60 | |
| 70 °C | Strain (%) | 37,004.30 | 5036.79 | 4711.44 | 3386.70 |
| R (%) | 0.26 | 3.16 | 4.16 | 6.95 | |
| Jnr (1/kPa) | 1156.38 | 157.40 | 147.23 | 105.83 |
| Temperature | Variables | B50/70 | B50/70 5% SBS | B50/70 5% SBS 3% mFA | B50/70 5% SBS 5% mFA |
|---|---|---|---|---|---|
| 20 °C | a | 1.38 | 1.65 | 1.7 | 1.73 |
| A | 517,000 | 5,690,000 | 4,280,000 | 13,200,000 | |
| B | −2.77 | −2.77 | −3.41 | −3.46 | |
| k | 1.53 | 1.78 | 2.03 | 2.02 | |
| Df | 102 | 181 | 134 | 201 | |
| smáx | 546,473 | 818,917 | 979,366 | 1,055,270 | |
| Strain | 16.38 | 23.98 | 23.24 | 24.15 | |
| N2.5 | 40,842 | 275,459 | 188,636 | 550,618 | |
| N5 | 5988 | 27,896 | 17,778 | 49,874 | |
| N7.5 | 1948 | 7308 | 4466 | 12,240 | |
| N10 | 878 | 2825 | 1676 | 4518 | |
| 25 °C | a | 1.29 | 1.38 | 1.54 | 1.55 |
| A | 177,000 | 823,000 | 4,150,000 | 1,450,000 | |
| B | −2.57 | −2.77 | −3.09 | −3.11 | |
| k | 1.43 | 1.33 | 1.46 | 1.67 | |
| Df | 72.1 | 147 | 202 | 129 | |
| smáx | 308,492 | 491,099 | 503,937 | 582,975 | |
| Strain | 19.35 | 26.6 | 23.54 | 22.72 | |
| N2.5 | 16,802 | 65,006 | 244,761 | 84,204 | |
| N5 | 2824 | 9531 | 28,779 | 9781 | |
| N5.5 | 995 | 3100 | 8227 | 2776 | |
| N10 | 475 | 1397 | 3384 | 1136 |
| Temperature | Variables | B50/70 | B50/70 5% SBS | B50/70 5% SBS 3% mFA | B50/70 5% SBS 5% mFA |
|---|---|---|---|---|---|
| 20 °C | smax (MPa) | 0.020 | 0.075 | 0.128 | 0.138 |
| Strain (%) | 190.2 | 234.9 | 225.0 | 215.3 | |
| Er (MPa) | 3.311 | 14.523 | 22.788 | 25.064 | |
| 30 °C | smax (MPa) | 0.007 | 0.0288 | 0.042 | 0.054 |
| Strain (%) | 192.7 | 298.3 | 288.5 | 249.64 | |
| Er (MPa) | 1.244 | 7.329 | 10.417 | 11.215 |
| Air Voids | ±Deviation | Bulk Density | ±Deviation | Draindown Test | |
|---|---|---|---|---|---|
| (%) | (%) | (gr/cm3) | (gr/cm3) | (%) | |
| B50/70 + 5% SBS | 23.13 | 1.12 | 1.992 | 0.028 | 0.20 |
| B50/70 + 5% SBS + 3% mFA | 22.66 | 1.01 | 2.004 | 0.025 | 0.07 |
| B50/70 + 5% SBS + 5% mFA | 22.45 | 1.28 | 2.009 | 0.032 | 0.04 |
Disclaimer/Publisher’s Note: The statements, opinions and data contained in all publications are solely those of the individual author(s) and contributor(s) and not of MDPI and/or the editor(s). MDPI and/or the editor(s) disclaim responsibility for any injury to people or property resulting from any ideas, methods, instructions or products referred to in the content. |
© 2024 by the authors. Licensee MDPI, Basel, Switzerland. This article is an open access article distributed under the terms and conditions of the Creative Commons Attribution (CC BY) license (https://creativecommons.org/licenses/by/4.0/).
Share and Cite
Lagos-Varas, M.; Movilla-Quesada, D.; Raposeiras, A.C.; Villarroel, M.; Ramos-Gavilán, A.B.; Castro-Fresno, D. Experimental Study on Styrene–Butadiene–Styrene-Modified Binders and Fly Ash Micro-Filler Contributions for Implementation in Porous Asphalt Mixes. Sustainability 2024, 16, 1131. https://doi.org/10.3390/su16031131
Lagos-Varas M, Movilla-Quesada D, Raposeiras AC, Villarroel M, Ramos-Gavilán AB, Castro-Fresno D. Experimental Study on Styrene–Butadiene–Styrene-Modified Binders and Fly Ash Micro-Filler Contributions for Implementation in Porous Asphalt Mixes. Sustainability. 2024; 16(3):1131. https://doi.org/10.3390/su16031131
Chicago/Turabian StyleLagos-Varas, Manuel, Diana Movilla-Quesada, Aitor C. Raposeiras, Melany Villarroel, Ana B. Ramos-Gavilán, and Daniel Castro-Fresno. 2024. "Experimental Study on Styrene–Butadiene–Styrene-Modified Binders and Fly Ash Micro-Filler Contributions for Implementation in Porous Asphalt Mixes" Sustainability 16, no. 3: 1131. https://doi.org/10.3390/su16031131