Article

A Hybrid MRA-BN-NN Approach for Analyzing Airport Service Based on User-Generated Contents

by
Thitinan Pholsook
1,
Warit Wipulanusat
2,* and
Vatanavongs Ratanavaraha
3
1
Engineering Program in Energy and Logistics Management Engineering, Institute of Engineering, Suranaree University of Technology, Nakhon Ratchasima 30000, Thailand
2
Thammasat University Research Unit in Data Science and Digital Transformation, Department of Civil Engineering, Thammasat School of Engineering, Thammasat University, Pathum Thani 12120, Thailand
3
School of Transportation Engineering, Institute of Engineering, Suranaree University of Technology, Nakhon Ratchasima 30000, Thailand
*
Author to whom correspondence should be addressed.
Sustainability 2024, 16(3), 1164; https://doi.org/10.3390/su16031164
Submission received: 12 December 2023 / Revised: 19 January 2024 / Accepted: 22 January 2024 / Published: 30 January 2024

Abstract

:
As the world transitions from the COVID-19 pandemic to a new normal, the Airports Council International (ACI) has disclosed that the Asia-Pacific region is lagging other regions in terms of air traffic recovery. This research comprehensively examines passenger satisfaction at leading airports in Southeast Asia. A multimethod approach incorporating multiple regression analysis, Bayesian networks, and neural network analysis was utilized to scrutinize user-generated content from Skytrax. The study contemplates eight distinct attributes of airport customer ratings: queuing time, cleanliness, seating areas, signage, food services, retail options, Wi-Fi availability, and staff courtesy. The findings reveal that queuing time and staff courtesy are the most important factors influencing the overall airport service rating. These results provide empirical evidence supporting the enhancement of airport services in the region and contribute significantly to the theoretical understanding and managerial implications for airport management and authorities. This research thus offers a valuable resource for improving service quality and operational efficiency in the airport industry, which could lead to a recovery and increase in the number of air passengers in this region.

1. Introduction

In the transition from the COVID-19 pandemic to a new normal, Airports Council International (ACI) data [1] revealed that the Asia-Pacific region experienced the least improvement in the first and second quarters of 2022. This contrasts with the findings of other regions, which experienced an early recovery in the first half of 2021. The expected global passenger traffic rebound is predicted to be driven mainly by domestic travel. However, the slow recovery in the Asia-Pacific region and the delayed resurgence of international travel could hinder this overall progress. Although traffic forecasts for the full year of 2023 align with those of 2019, the recovery trajectories differ for domestic and international passenger traffic. Predictions indicate that global domestic passenger traffic will revert to 2019 levels by late 2023. In contrast, the revival of international passenger traffic is projected to take nearly another year, with full recovery not anticipated until the second half of 2024. Only in 2025 is international passenger traffic expected to fully recover to the levels observed in 2019.
In the pursuit of expediting passenger traffic, airport management prioritizes the enhancement of passenger satisfaction. This is achieved by ensuring smooth execution and secure procedures across all activities within the airport facilities. The overarching objective is to create an efficient and secure environment that not only meets but also exceeds passenger expectations, thereby contributing to an overall positive travel experience [2]. In 2006, the ACI established a global benchmark for analyzing customer perceptions of service quality, known as the airport service quality (ASQ) program [3]. The ASQ program, which evaluates 34 service attributes across eight categories [4], provides a standardized measure of global airport performance. With the participation of nearly 400 airports in 95 countries, the ASQ has become a leading initiative for assessing passenger satisfaction. While many studies have focused on passenger perceptions of airport services using ASQ measurements, few have explored passenger expectations or satisfaction with ASQ dimensions. Understanding passenger expectations is crucial for enhancing overall satisfaction.
Recent advancements in the study of airport service quality have incorporated big data and user-generated online content (UGC), offering authentic and diverse perspectives. Researchers have turned to platforms such as Google Maps [4,5,6], TripAdvisor [7,8], Twitter [9,10], Skytrax [11,12,13,14,15,16,17,18,19,20,21], and airports’ social media channels [22] for service quality analysis. A recent study by Abouseada, Hassan [23] employed a quantitative content analysis approach to examine data from various travel platforms, including Skytrax, TripAdvisor, Traveler, and Flight Reports. These platforms enable travelers to assign star ratings and post reviews, thereby providing valuable insights into diverse facets of airport services. Such ratings and reviews are instrumental for travelers, service providers, and other stakeholders, serving as a rich source of information.
Despite the existence of numerous quality measurement systems for airport services, this study focuses on Skytrax’s star rating system. Skytrax’s airport star ratings, a globally recognized benchmark for airport service quality, were developed based on extensive professional experience and in-depth knowledge of the airport industry [24]. Skytrax has established itself as a reliable indicator of airport service levels, accurately mirroring the perceptions of passengers regarding the services provided. Launched in 1999, the Skytrax evaluation program uses online passenger ratings to rank airlines and airports based on the quality and standards of their products and services [25]. According to the study’s focus, nine variables were used for the analysis, with the total airport rating initially considered a potential dependent variable. The independent variables included eight service indicators: queuing time, cleanliness, seating areas, signage, food services, retail options, Wi-Fi availability, and staff courtesy.
Considering the extended recovery timeline, our research aimed to identify strategic variables that can significantly boost passenger volume at airports within the Asia-Pacific region, with a particular focus on Southeast Asian airports. The study specifically targeted the top ten busiest airports in Southeast Asia, identified as primary revenue generators for the regional aviation sector.
This study proposed a multistage methodology that incorporated multiple regression analysis (MRA), Bayesian networks (BNs), and neural networks (NNs). This approach was employed to scrutinize the service attributes of Skytrax Airport and pinpoint the attribute exerting the most significant influence on the total airport rating. MRA was used to test the research hypotheses and identify significant attributes, which were subsequently incorporated into BNs to estimate the current total airport rate based on the occurrence of each attribute. Finally, NNs were employed to identify the most critical service attribute for improving the total rating score of the airport. This approach allows for the identification of linear relationships, captures probabilistic dependencies, and is proficient in recognizing nonlinear patterns. To our knowledge, this study represents the first effort to scrutinize the essential service attributes of the top ten busiest airports in Southeast Asia by employing the proposed hybrid method. In addition, a systematic literature review conducted by Sadou and Tchouamou Njoya [26] provided insights into the application of artificial intelligence in the air transport industry, revealing that only nine percent of total air transport articles focus on traveler experience. This research addresses the pivotal factors of airport services that influence total airport ratings. The insights provided in this study could assist airport managers and other stakeholders in obtaining a deeper understanding of the key attributes of airport services. This knowledge could be instrumental in identifying potential challenges and predicting future trends in airport services.
The remainder of this paper is structured as follows: Section 2 reviews the literature pertaining to airport service variables and discusses the proposed hypotheses. Section 3 elaborates on the methodological approach adopted, encompassing details about the data, variables, and analytical methods employed. Section 4 discloses the outcomes of the analysis. The paper culminates with Section 5, which encompasses a discussion and conclusion, implications of the study, acknowledgment of study limitations, and propositions for future research.

2. Relevant Literature

This section summarizes the relevant literature, identifies gaps in the existing body of knowledge, and formulates the proposed hypotheses.

2.1. Relevant Literature on Airport Service Quality

According to the research conducted by the Airports Council International [27], the optimal strategy for boosting nonaviation revenue (NAR) lies in prioritizing the customer experience. The research revealed a significant correlation, indicating that an increase of 1% in the number of passengers corresponds to an increase of 0.7% to 1% in the NAR. Furthermore, a 1% increase in overall passenger satisfaction results in an average increase of 1.5% in the NAR. This highlights the direct and tangible impact of passenger satisfaction on revenue generation in the aviation sector.
Previous studies on airport service quality have focused predominantly on the intricate and multifaceted concept of airport passenger satisfaction. Elevating passenger satisfaction is a critical goal in airport management and plays a pivotal role in enhancing competitiveness and overall operational efficiency. Airport aeronautical and nonaeronautical performance and passengers’ experiences are interrelated, according to aviation research [28]. NAR has emerged as an important driver of the aviation sector’s overall economic expansion. Airport service quality (ASQ) is recognized as essential for travelers and affects their journeys substantially [29,30,31,32]. The benchmark for assessing passenger satisfaction while navigating airports was established as the ASQ, a standardized evaluation tool globally recognized by the ACI [33]. This underscores the sector’s commitment to meeting and exceeding passenger expectations.
Effectively evaluating airport service levels and passenger satisfaction is a comprehensive approach that includes both internal and external assessments. According to Fodness and Murray [34], it is critical to systematically analyze passenger expectations to prioritize improvements in critical service dimensions. This finding is consistent with Lubbe, Douglas [35], whose findings emphasized the necessity of adding air travelers’ viewpoints to service-level assessments. Bezerra and Gomes [36] used structural equation modeling (SEM) to explore connections between the factors influencing passenger satisfaction, revealing insights into passenger expectations, ASQ, switching costs, and competitive dynamics on loyalty. Isa, Ghaus [37] studied Kuala Lumpur International Airport’s klia2 terminal and identified eight dimensions affecting overall satisfaction through PLS SEM. Bulatović, Dempere [20] employed two analysis methods, ordinal regression and maximum likelihood structural equation modeling (ML SEM), to evaluate the efficacy of the Skytrax evaluation system. Their findings revealed that the most significant indicators of airport service are facility comfort, wayfinding and signage, and restaurant outlets.
Hybrid methodologies have been applied within the domain of airport management. Specifically, Bakır, Akan [16] conducted an analysis of online reviews of airports in Europe, employing multiple regression analysis (MRA) and necessary condition analysis (NCA) to pinpoint airport operators as the foremost influential factors shaping passenger experiences. Moreover, Pholsook, Wipulanusat [38] undertook a comprehensive three-stage analysis to ascertain the key dimensions of airport service quality (ASQ), identifying airport facilities, wayfinding, and security as integral factors crucial for overall passenger satisfaction.

2.2. User-Generated Online Content

In the context of the pandemic, the “new normal” has evolved, and in the data-driven era, alternative channels for gathering the voice of customers have become crucial. The two prominent methods include the following: (1) Creating online questionnaires: online platforms facilitate the creation of digital questionnaires, enabling airports to directly collect feedback from travelers. This method offers a structured approach to gathering specific insights into various aspects of the airport experience. (2) Scraping data from user-generated online content (UGC), i.e., social media platforms and review websites such as Google Maps [4,5,6], TripAdvisor [7,8], Twitter [9,10], Skytrax [11,12,13,14,15,16,17,18,19,20,21], and airports’ social media channels [22]. Recently, Abouseada, Hassan [23] conducted quantitative analysis of data extracted from the Skytrax, TripAdvisor, Traveler, and Flight Report platforms. Scraping data from these platforms allows airports to analyze real-time, unfiltered feedback from passengers.
UGC has become an alternative data source for evaluating service levels in the age of data analytics and machine learning. Many studies [4,8,9,10,11,12,14,17] highlight the potential of leveraging UGC for this purpose. The popularity of online platforms has amplified the voices of passengers, providing a powerful channel for them to express their opinions and satisfaction levels regarding airports. While customer reviews offer valuable insights for airport improvement, the sheer volume of daily reviews poses a challenge for effective management. The field of data mining and analytics has emerged as a promising solution, allowing airports to efficiently examine enormous datasets from review and rating websites.
Skytrax stands out as a reputable platform in the aviation industry, aggregating passenger reviews and comments and offering a rich source of data for comprehensive analysis in airport management research. Integrating alternative channels and utilizing user-generated content, especially from platforms such as Skytrax, represents a significant trend in airport management research. This approach enables airports to stay attuned to passenger sentiments, driving continuous improvement and adaptation in response to evolving customer expectations and experiences.
Despite the growing interest in airport passenger satisfaction and the adoption of advanced analytical models, there are notable gaps in the current body of knowledge. Many studies focus on individual models or a limited set of variables, potentially overlooking complex interactions among various factors. While user-generated content data are increasingly recognized as valuable, there is still a need for research that delves deeper into their nuances, addressing issues such as sentiment analysis, topic modeling, and the influence of cultural and demographic factors on feedback.
The literature on airport service quality (ASQ) predominantly employs individual analysis methods, with a paucity of studies exploring the integration of techniques. The utilization of extensive secondary data sources, particularly in combination with advanced methods such as multiple regression analysis (MRA), Bayesian networks (BNs), and neural networks (NNs), has not been explored, especially when applied to the analysis of airport passenger satisfaction using organic Skytrax UGC data. The scarcity of research incorporating these advanced methods underscores the necessity for further investigation, emphasizing the importance of examining both the challenges and benefits associated with their integration to gauge practical applicability in airport management contexts.
Recognizing the pivotal role of airport passenger satisfaction in effective airport management, there is growing interest among scholars and industry experts in better understanding and increasing levels of passenger satisfaction. This study aims to fill these knowledge gaps by using an innovative approach that integrates MRA and BNs. Furthermore, this study intends to use NNs to find the most influential attribute affecting total evaluations.

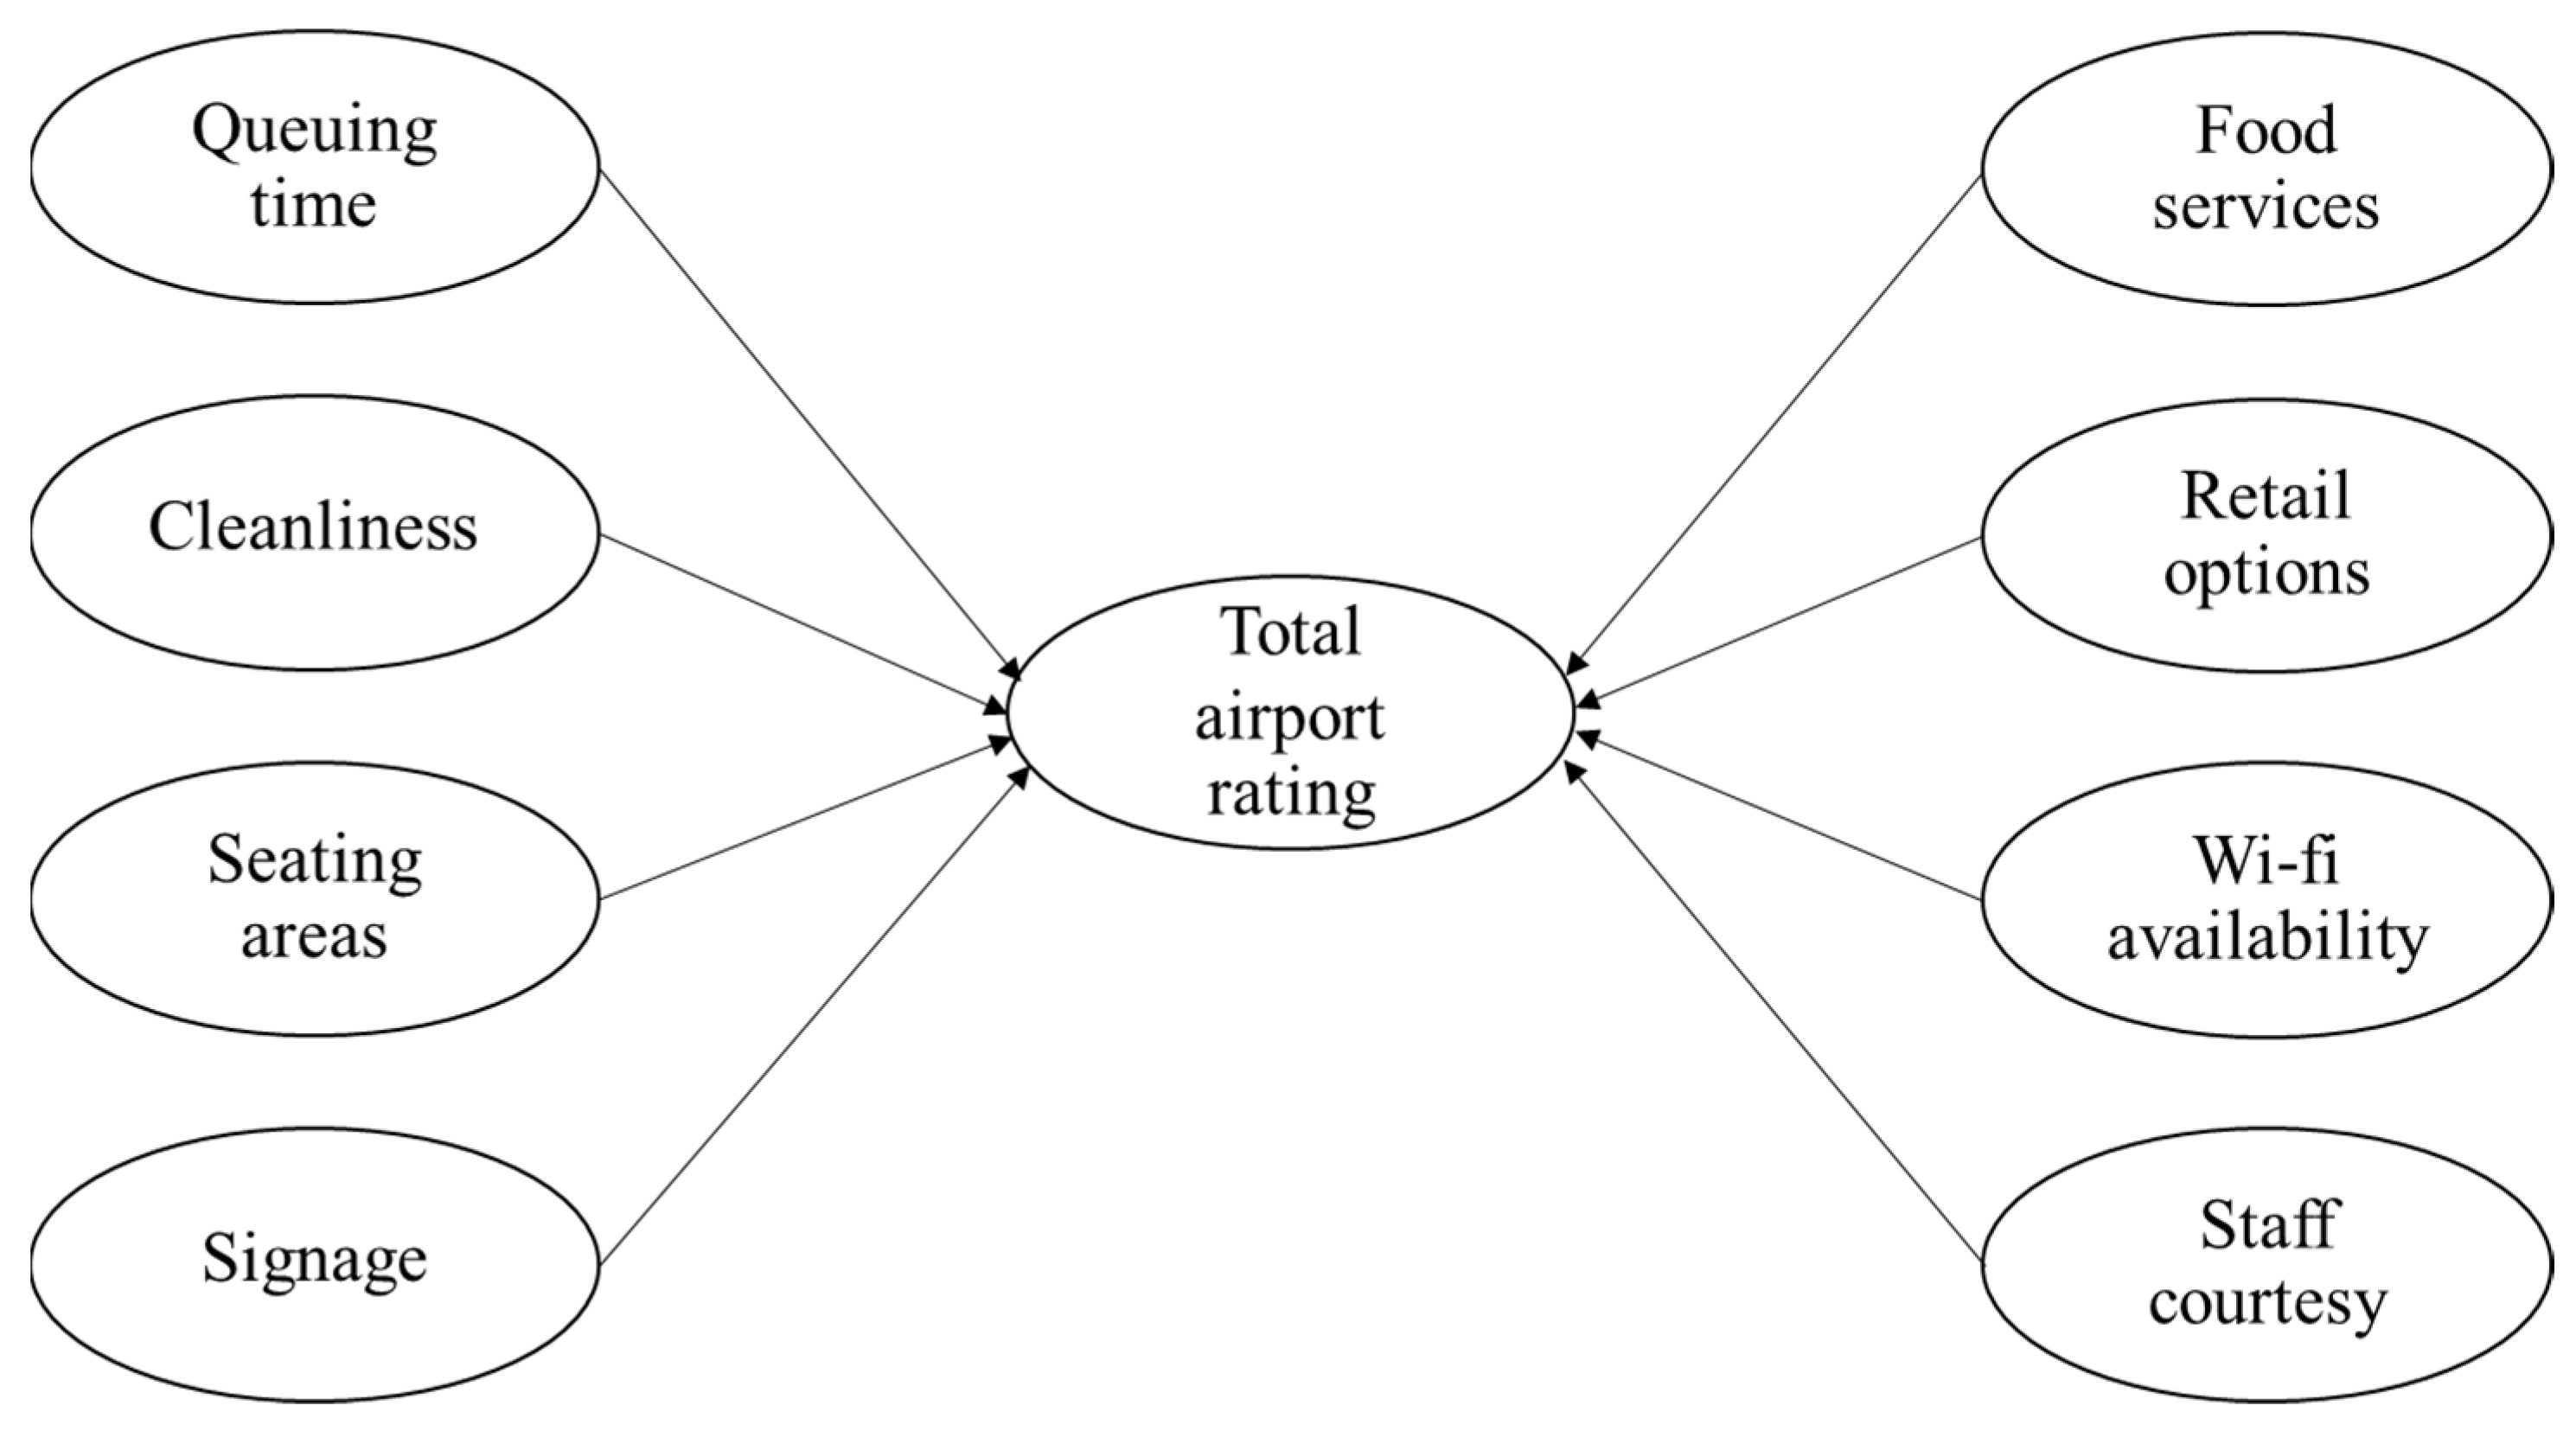
2.3. Hypothesis Development

Derived from secondary data extracted from the Skytrax online review platform [39], eight distinct attributes contribute to the evaluation of Skytrax airport service levels. These dimensions are queuing time, which refers to the time passengers spend waiting in queues (specifically, the duration of waiting in lines at the airport); cleanliness, which refers to the straightforwardness of the terminal environment; seating areas, which involves the accessibility and convenience of places to sit within the terminal; signage, which encompasses well-designed, informative signs within the terminal that address aspects of quality, clarity, and usefulness; food services, which relates to the quality and diversity of food and beverage choices available at the airport; retail options, which revolves around the shopping options accessible to passengers within the airport; Wi-Fi availability, which pertains to the quality and availability of the internet services at the airport; and staff courtesy, which is concerned with the behavior and assistance provided by airport operators, encompassing their courteousness and helpfulness.
Airport terminals are dynamic environments where passengers engage significantly in boarding and check-in procedures [40]. Throughout these processes, queues frequently arise, hindering access to services and causing time inefficiencies [41,42]. A reduction in queuing time is paramount for airport operators, as prolonged waiting negatively affects the service rate and overall passenger satisfaction [15]. Halpern and Mwesiumo [18] posited that airport user satisfaction is notably more adversely impacted by service disruptions related to employees and queuing than by issues pertaining to shopping and internet services.
Kiliç and Çadirci [13] utilized text mining on Skytrax data to analyze airport experiences, revealing predominantly positive sentiments toward airports. However, slightly negative sentiments were associated with baggage claims, queues, employee services, and human interactions. Schultz, Luo [43] emphasized the negative effects of performance issues, especially in the check-in area, resulting in significant passenger queues and creating bottlenecks at security checkpoints.
Pandey [44] assessed service quality at major Thai airports, identifying areas for improvement, including check-in wait time, security inspection delays, baggage delivery speed, and passport/ID inspection wait time. Terminal cleanliness has long been a concern for passengers, impacting tolerance for lapses [18]. Research supports that terminal cleanliness positively influences passengers’ emotions and overall satisfaction [8,15,17,45,46]. Travelers arriving early prioritize cleanliness, while foreign passengers emphasize information displays [47]. Lee and Yu [4] found that smaller airports prioritize convenient transportation, cleanliness, and staff friendliness, while larger airports focus on customs inspection and ambiance.
Lopez-Valpuesta and Casas-Albala [48] highlighted the critical dimensions of cleanliness and comfort in airport facilities, particularly during health emergencies. Terminal seating areas are crucial for diverse customer groups, affecting overall customer satisfaction [15,49,50]. The spacing between seats facilitates mobility and influences service quality [17,49,50].
Airports have evolved into complex environments, posing challenges for effective service utilization [40]. Terminal signage plays a vital role in preventing confusion and missed flights [51,52]. Well-designed signage contributes to higher service quality [52]. Jianxin, Song [51] focused on improving the efficiency of pedestrian guiding signs (PGSs), and Das and Choudhury [53] emphasized the impact of visual signage and wayfinding measures on passenger satisfaction. Farr, Kleinschmidt [54] studied the dynamics of wayfinding, influenced by both human and environmental factors. Pholsook, Wipulanusat [38] identified airport facilities, wayfinding, and security as essential factors influencing passenger satisfaction.
Nonaeronautical activities, specifically retail and food services, significantly contribute to airport profitability [9,30,55]. Research indicates that an increased variety of food and beverage facilities positively influences service quality and passenger satisfaction [56]. However, high airport retail prices, often because of elevated concession fees, can negatively affect customer satisfaction [30]. Offering reasonable prices is crucial for customer satisfaction [57]. Freitas, Silva [32] identified variables influencing passengers’ perceptions of food and beverage services.
Shopping is a favored activity among airport passengers, providing entertainment and contributing to nonaeronautical revenue [40]. Shopping facilities significantly predict overall satisfaction [12,17,55]. Han, Yu [58] emphasized that satisfied shoppers exhibit increased loyalty. Molaei and Hunter [5] highlighted the importance of improving shopping and relaxation facilities for balanced passenger satisfaction.
The internet has become fundamental at airports, with passengers considering it essential for tasks and leisure [4,8,9,17,35,59]. Wi-Fi hotspots significantly impact airport service quality (ASQ) [35]. Passengers expect courteous and competent operators for a positive airport experience [16,44,46,60]. Staff orientation toward passenger satisfaction influences service perceptions significantly [7,18,34,56]. The courtesy displayed by airport operators positively influences service perceptions [46,61]. Employee resources affect check-in queuing processes and passenger arrival [41].
In summary, the holistic passenger experience at airports is shaped by various attributes, including queuing time, cleanliness, seating areas, signage, food services, retail options, Wi-Fi availability, and staff courtesy. Tackling these aspects is essential for elevating service standards and augmenting the total airport rating. According to the literature, eight hypotheses have been formulated, as follows.
H1. 
Queuing time correlates significantly with the total airport rating.
H2. 
Cleanliness correlates significantly with the total airport rating.
H3. 
Seating areas correlate significantly with the total airport rating.
H4. 
Signage correlates significantly with the total airport rating.
H5. 
Food services correlate significantly with the total airport rating.
H6. 
Retail options correlate significantly with the total airport rating.
H7. 
Wi-Fi availability correlates significantly with the total airport rating.
H8. 
Staff courtesy correlates significantly with the total airport rating.
The above eight hypotheses were constructed to depict the influence of the eight attributes of airport services on the total rating. This relationship was assessed through the application of multiple regression analysis (MRA), as illustrated in Figure 1.

3. Research Methodology

3.1. Data

This research specifically targets the top ten busiest airports in Southeast Asia, identified as primary revenue generators for the regional aviation sector. As of January 2024, data sourced from OAG Aviation Worldwide Limited [62] highlight the prominence of these airports. The list encompasses three airports in Indonesia, two in Thailand, two in Vietnam, one in Singapore, one in Malaysia, and one in the Philippines: Bangkok Don Mueang International Airport (DMK, Thailand), Bangkok Suvarnabhumi International Airport (BKK, Thailand), Changi Airport (SIN, Singapore), Denpasar Ngurah Rai International Airport (DPS, Indonesia), Hanoi Airport (HAN, Vietnam), Ho Chi Minh City Airport (SGN, Vietnam), Jakarta Soekarno-Hatta Airport (CGK, Indonesia), Kuala Lumpur International Airport (KUL, Malaysia), Manila Ninoy Aquino International Airport (MNL, Philippines), and Sultan Hasanuddin International Airport (UPG, Indonesia). Comprehensive examination of these airports is crucial for understanding and strategically addressing the dynamics of passenger traffic in the Southeast Asian aviation landscape.
The source of the user-generated data selected for this study was the Skytrax online review website [39]. Skytrax, a globally recognized air transportation assessment organization, introduced the World Airline and Airport Star assessment program in 1999. This initiative relies on online passenger ratings to assess and rank airlines and airports, considering aspects such as product quality and staff service standards [63]. The justification for utilizing Skytrax data in this research lies in the requirement for passengers to authenticate their identities before their reviews are published, thereby mitigating potential participant bias when passengers voluntarily contribute their feedback [14]. Moreover, Skytrax compiles data from worldwide airports, yielding a highly representative dataset. Punel, Al Hajj Hassan [64] emphasized the reliability of Skytrax as a well-established and trustworthy measure of satisfaction among passengers in aviation sectors.
The field of air transport research has increasingly turned to Skytrax as a source of data owing to its comprehensive and dependable characteristics [11,18,19,20,21,65]. Skytrax has become widely employed in the literature as a tool for representing online word-of-mouth because of the richness of the data it provides [66].
This study examined secondary data derived from user-generated content (UGC) extracted from the Skytrax online review website [39] using the R programming language. The data encompassed airport service ratings across eight distinct attributes and a total airport rating. It is crucial to emphasize that the UGC data analyzed in this research were voluntarily shared by airport passengers. However, the Skytrax online review website provides data for only the nine busiest airports in Southeast Asia, excluding the tenth airport. Consequently, this study relies only on UGC data from the region’s top nine airports.
The initial phase of gathering airport passenger reviews on Skytrax involved acquiring demographic information from respondents. This information encompasses various characteristics, including the passenger’s name, residence country, airport, visiting date, and trip purpose. After that, passengers could rate eight different aspects of airport services: queuing time, cleanliness, seating areas, signage, food services, retail options, Wi-Fi availability, and staff courtesy. Skytrax’s airport star ratings, a universally recognized benchmark for airport service quality, are formulated based on extensive professional experience and specialized knowledge of the airport industry [24]. These ratings, derived from customer experiences throughout their airport journey, range from one to five. A 5-star rating signifies that the service standards meet or exceed global best practices. A 4-star rating indicates good quality standards but not the best quality standard. A 3-star rating is given when the service standards are average, indicating inconsistencies or weaknesses in service systems. A 2-star rating is assigned when the airport amenities/facilities are subpar and do not meet the airport passengers’ typical expectations. Finally, a 1-star rating denotes an unacceptable standard of service. Moreover, passengers are invited to assess their overall experience by assigning star ratings ranging from one to ten. This serves as an overall satisfaction indicator. Additionally, passengers convey their willingness to recommend the airport, with this recommendation being expressed as a binary response—either “yes” or “no”.
The UGC data were obtained by scraping the Skytrax passenger review website [39] using the R programming language. The dataset consists of reviews for nine Asian airports collected from 2015 to July 2023, resulting in 1016 valid reviews. The demographic profile of the content reviewers is presented in Table 1, reflecting a diverse range of passenger backgrounds. The table provides a comprehensive overview of the passenger demographics. The primary category, “Passenger Characteristics”, encapsulates various aspects of passenger demographics. “Category” and “Subcategory” further refine these characteristics into more specific segments. For instance, the category “Passenger Experience” is divided into subcategories such as “Arrival and Departure” and “Departure Only”. This pattern is mirrored in “Passenger Type” and “Passenger by Continent”, each of which is further subdivided into more specific classifications. The “Frequency” and “Percentage” columns present the actual data. The frequency denotes the number of respondents in each subcategory, while the percentage represents the proportion of total respondents in each category calculated as a percentage of the total number of respondents. Among the reviewers, 408 (40.16%) used the airport for both arrival and departure, followed by 362 (35.63%) for departures, 146 (14.37%) for transit, and 100 (9.84%) for arrivals. Further categorization based on the purpose of travel revealed that 357 (35.14%) were solo leisure travelers, 238 (23.43%) were on business trips, 224 (22.05%) were on family leisure trips, and 197 (19.39%) were on couple leisure trips. Regarding geographical location, most reviewers (54.74%) lived in Asia, with a significant portion (44.49%) hailing from Southeast Asian countries. European reviewers constituted 20.08% of the reviewer population, followed by Oceanian reviewers at 15.16% and others at 10.04%.

3.2. Data Analysis

Skytrax employs eight criteria to assess airport services: queuing time, cleanliness, seating areas, signage, food services, retail options, Wi-Fi availability, and staff courtesy. Each attribute is assessed using a five-point Likert scale, enabling respondents to articulate their opinions on a spectrum from 1 (lowest rating) to 5 (highest rating). The total rating gauges the overall satisfaction of airport travelers, and ranges from 1 (lowest rating) to 10 (highest rating).
The initial step of this study was to analyze the suggested relationships using multiple regression analysis (MRA). MRA is a statistical method that employs multiple explanatory variables to predict the result of an objective variable. MRA establishes a model that depicts the relationship between service attributes and the total rating of airports. It operates on the assumption of a linear correlation between the input and output [67].
The second methodology in this research involves the application of Bayesian networks (BNs), which are constructed based on a validated MRA model. These BNs can predict and diagnose enhancements in the total rating of airport services. BNs are a type of graphical model that learns independently from data, is grounded in probability theory, and facilitates scenario analysis while supporting predictions and decision-making [68]. However, when BNs are applied individually, their accuracy depends solely on the experience of experts, which is a limitation [69]. Therefore, the integration of MRA and BN analysis not only improves reliability but also provides operational benefits to airports.
The third methodology in this study focuses on identifying crucial airport service attributes that require enhancement, utilizing neural networks (NNs) derived from the MRA model. NNs, alternatively called simulated neural networks (SNNs) or artificial neural networks (ANNs), are a subset of machine learning. The field of transportation has witnessed a plethora of applications for neural networks, leveraging their sophisticated pattern recognition and data processing capabilities to enhance various aspects of transportation systems [70,71]. NNs examine the most significant factors, and improvements in these critical areas can lead to an increase in the total airport star rating. NNs are inherently nonlinear, enabling them to model complex relationships and patterns in data. When dealing with the complexities of human decision-making processes, they outperform traditional models in terms of forecasting accuracy [72,73].
This comprehensive approach integrates the MRA model with the graphical interaction of BNs. The MRA is utilized to examine the proposed relationships between service attributes and the total rating score. The BNs function as a decision-support model. Finally, the NNs are used to uncover the complex and nonlinear relationships among the most significant factors influencing the total rating. SPSS version 22 was used for the analysis.

4. Results

4.1. Descriptive Statistics

Table 2 shows the descriptive data along with Pearson correlations for the service attributes. The table presents a summary of the statistics and a correlation matrix derived from a study involving 1016 participants. The attributes represent the variables evaluated in the study, which include the overall total rating and various elements of a service or experience, such as queuing time, cleanliness, seating areas, signage, food services, retail options, Wi-Fi availability, and staff courtesy. Each attribute is associated with a mean (average) score and a standard deviation (SD), which measures the dispersion or variation from the average. The table also displays the Pearson correlation coefficients between each pair of attributes. These coefficients, typically within the range of +1 to −1, indicate the strength and direction of the relationship between two variables. A positive number signifies a positive relationship, while a negative number indicates a negative relationship. The notation “**” next to the numbers suggests that the correlation is statistically significant at the 0.001 level, indicating a high level of confidence that the relationship observed in the sample is representative of the population. This comprehensive analysis provides valuable insights into the interplay between different aspects of the service experience.
Passengers’ average evaluations of these attributes range from 2.76 to 3.33 on a 1 to 5 Likert scale. These averages show that a significant number of the passengers are dissatisfied, neutral, or satisfied with their airport experiences. The average overall satisfaction score is 4.90, indicating that passengers are mostly indifferent to their perception of their overall experience, ranging from 1 to 10. Furthermore, the correlation analysis indicates that the variables under consideration have a moderate positive correlation and are statistically significant. Notably, ‘staff courtesy’ (0.805, p < 0.001) has the greatest influence on the airport rating score, closely followed by ‘queuing time’ (0.804, p < 0.001).
The data presented in Table 2 indicate strong positive correlations between the total score and factors such as queuing time, cleanliness, seating areas, signage, food services, retail options, and staff courtesy. These correlations suggest that enhancements in these areas are likely to lead to a higher total rating.

4.2. Results of the MRA Model

MRA, a potent statistical method, has been utilized effectively in the literature for comprehensive analysis of online reviews, as evidenced by Chatterjee and Mandal [66]. However, it is crucial to ensure that certain prerequisites are satisfied before initiating MRA. According to Pallant [74], the N > 50 + 8 k rule was applied in this research. This is a rule of thumb for determining the minimum sample size needed for MRA. Here, N represents the total sample size and k denotes the number of independent variables in the model. In this study, with a sample size of 1016, the sample size surpassed the threshold set by the rule, ensuring that the sample size was adequate for the MRA. The research also confirmed the absence of collinearity risk among the independent variables, as depicted in Table 3, using the variance inflation factor (VIF), as recommended by Mooi and Sarstedt [67]. The variance inflation factor (VIF) is used to ensure that there is no chance of collinearity between the independent variables. The VIF measures the extent to which an estimated regression coefficient’s variance increases due to multicollinearity. A VIF greater than five indicates a significant level of multicollinearity. However, in this research, all the VIFs fell below this threshold, indicating the absence of multicollinearity. The research thus validates the absence of collinearity risk among the independent variables, ensuring the robustness and validity of the MRA model.
The significance of the F test in Table 3 indicates a highly significant relationship (p < 0.001) between attributes and the total score in this model. Moreover, the proposed model accounts for a substantial proportion of the variance in the total score, as demonstrated by the R-squared value of 0.830. This finding suggests that the model explains 83.0% of the variance, which is a notable degree of explanatory power in consumer behavior research. The Durbin–Watson statistics, with a value of 1.895, fall within the range of 1.5 to 2.5, confirming that the model errors are free from autocorrelation [67].
As further illustrated in Table 3, ‘queuing time’ (β is 0.298, p < 0.001) emerges as the most potent predictive service attribute, closely trailed by ‘staff courtesy’ (β is 0.252, p < 0.001), validating hypotheses H1 and H8. Furthermore, the effects of ‘signage’ (β is 0.125, p < 0.001), ‘retail option’ (β is 0.109, p < 0.001), ‘food services’ (β is 0.091, p < 0.05), ‘seating area’ (β is 0.084, p < 0.05), and ‘cleanliness’ (β is 0.072, p < 0.05) on the total rating are statistically significant, leading to hypotheses H4, H6, H5, H3, and H2, respectively, according to the research model. However, ‘Wi-Fi availability’ is found to exert no influence on the total rating, resulting in the rejection of hypothesis H7 (β is 0.029, p < 0.120).

4.3. Results of the BNs

Bayesian networks (BNs), as probabilistic graphical models, serve as valuable instruments for decision-making under uncertainty. These data were used to refine and mathematically express the correlations identified using the MRA, which pinpointed seven significant factors (queuing time, cleanliness, seating areas, signage, food services, retail options, and staff courtesy) influencing the total airport rating. The findings of the BN analysis assisted in determining the total airport service rating.
For an efficient learning process, it is essential to discretize the data first. Typically, the data are segmented into three states: low, medium, and high [75]. Considering that the independent variables in this study are measured on a 5-point scale, the airport service variables are divided into three equal states: [1, 1.6] for low, [1.6, 3.3] for medium, and [3.3, 5] for high. For overall airport service, which is gauged on a 10-point scale, the dependent variables are segmented into three equal states: [1, 3.3] as low, [3.3, 6.6] as medium, and [6.6, 10] as high.
As illustrated in Figure 2, the Bayesian networks of service factors comprise eight nodes and seven links connecting these nodes. The parent node symbolizes seven significant attributes, while the child node signifies the total score. Figure 2 illustrates that each node is associated with varying probabilities, denoted as percentages, across three states: high, medium, and low. Below each node, the two figures represent the mean and standard deviation, respectively. The BNs serve as a crucial tool for assessing the influence of attributes on the total score for airport services. The outcomes of the BNs represent the current state of the total score. Specifically, 33.8% of the travelers expressed high satisfaction, while 33.0% and 33.3% express medium and low satisfaction, respectively. The mean of the total service score was computed to be 4.98, with a standard deviation of 2.9. Despite the fact that most passengers expressed moderate satisfaction, there is room for enhancing the service level. In the final stage of the analysis, neural networks (NNs) were utilized to ascertain which service variables exerted the greatest impact on the total rating score.

4.4. Results of NNs

Neural networks (NNs) were used to find complex and nonlinear interactions within the empirical framework to address the limitation that it can oversimplify the complexities of human decision-making processes. NNs excel at discovering intricate and nonlinear relationships between service attributes and the total airport score. A multilayer perceptron (MLP) was applied to train and test our data. The input variables for the NN model, as shown in Figure 3, include queuing time, cleanliness, seating areas, signage, food services, retail options, and staff courtesy. The output layer of the network model signifies the dependent variable and the total airport score.
The model was trained using the MLP training algorithm, with 70% of the samples chosen for training and the remaining 30% set aside for validation. After the NNs were developed, their accuracy was evaluated. A classification matrix was used in this study to assess the performance of the NNs in the classification test. The classification matrix, with columns representing the NNs’ expected values and rows indicating the observed values corresponding to overall satisfaction levels, was instrumental in this evaluation. A tabulation method was used to record the agreements and discrepancies between the expected and observed values, leading to the calculation of an accurate percentage. These percentage-based accuracy evaluations allowed us to evaluate the NNs’ predictive ability during both the training and testing periods. According to the data from the classification matrix, which are shown in Table 4 and were used to test the robustness and effectiveness of the NNs, the training phase achieved an accuracy rate of 81.7%, while the testing phase yielded a correctness rate of 79.4%. These results suggest that the constructed NNs have a high degree of accuracy.
When conducting the sensitivity analysis, the mean predictive relevance of the variables was determined. The normalized importance of each variable was subsequently calculated by dividing its importance by the maximum importance value. Table 5 summarizes the relative importance of the variables. The results from the NN model indicate that among the service attributes, queuing time and staff courtesy are the most significant variables for enhancing overall satisfaction. These areas are followed by seating areas, signage, retail options, food services, and cleanliness.

5. Conclusions

The importance of evaluating airport services is well established among both industry experts and academic researchers [40]. This study adopts a multimethod approach, combining multiple regression analysis (MRA), Bayesian networks (BNs), and neural networks (NNs) to examine the relationships between various service factors and overall airport ratings. The research is grounded in an analysis of data-driven crowdsourcing obtained from user-generated content (UGC) on Skytrax, encompassing reviews of the nine busiest airports in Southeast Asia. The extensive findings from this study illuminate key aspects, such as the factors influencing passenger satisfaction, the importance of each airport service attribute, and the potential implications for airport management. Additionally, this study not only enhances passenger satisfaction but also contributes to minimizing environmental impacts through optimal resource utilization.

5.1. Discussion and Theoretical Implications

The initial results from the MRA underscore the positive impact of several factors on airport service. The key contributors to airport service ratings include queuing time, cleanliness, seating areas, signage, food services, retail options, and staff courtesy. These findings align with prior research studies [15,17,50,61,76], further emphasizing the importance of these factors in boosting passenger satisfaction. Interestingly, the availability of Wi-Fi was found to have a minimal effect on airport service ratings, which significantly deviates from the influence of other factors. This observation is in line with the studies by Halpern and Mwesiumo [18] and Bakır, Akan [16], suggesting that deficiencies in Wi-Fi services have a limited impact on passenger loyalty. Furthermore, Pandey [44] noted that internet access is not a high-priority service criterion at Thai airports. This implies that most passengers use their own mobile internet. In contrast, Pamucar, Yazdani [77] argued that internet access is the most impactful service factor at Spanish airports. Bunchongchit and Wattanacharoensil [11] found that the internet service significantly affects the satisfaction of business travelers, and Kayapınar and Erginel [78] emphasized that the internet is a vital requirement at Turkish airports.
The BN results not only validated the findings from the MRA but also offered a comprehensive visual depiction of the relationships between the various airport service attributes and the total airport rating. Notably, the BNs demonstrated that the service rating score is evenly distributed across three levels—high, medium, and low—with a substantial number of passengers assigning a medium rating. These results represent a significant opportunity for improving airport services.
The study employed NNs to probe the nonlinear and noncompensatory relationships between airport service attributes and the total airport rating. The results from the NNs were consistent with the findings from the MRA and BNs, highlighting the importance of queuing time and staff courtesy as the most crucial factors influencing passenger satisfaction. This finding is consistent with the findings of Bae and Chi [19], Fodness and Murray [34], Halpern and Mwesiumo [18], Kiliç and Çadirci [13], and Pantouvakis and Renzi [79]. Antwi, Fan [80] found that the helpfulness and communication of airport employees significantly impact passenger loyalty and satisfaction. Bakır, Akan [16] also identified airport employees as the most influential determinant of passenger satisfaction.
In line with the findings of Halpern and Mwesiumo [18], it has been observed that the courtesy of staff and the duration of queuing are the most significant factors affecting passenger experiences. On the other hand, shortcomings in airport retailers and internet services have the least influence on the likelihood of passenger satisfaction. These observations underscore the necessity of addressing service failures, particularly those related to staff interactions and queuing time, to increase passenger satisfaction and elevate airport rating scores. In addition, Paramonovs and Ijevleva [46] identified staff courtesy and availability as two of the five key elements influencing passenger satisfaction at the airport. This further emphasizes the critical role of staff in shaping the passenger experience at airports.

5.2. Managerial Implications

The findings of this research offer valuable insights to executives in the airport industry, providing a comprehensive understanding of passenger perceptions of airport services. Utilizing online reviews as a data-driven reflection of passengers’ experiences can aid airports in identifying the key elements of airport services. The user-generated content (UGC) approach is a sustainable strategy that leverages current platforms, decreasing the need for additional resources to collect valuable passenger feedback. This approach not only offers a cost-effective method for airports to collect passenger feedback but also offers an opportunity to identify strategies to generate positive WOM. Based on real reviews, this paper presents vital information for airport management teams to formulate appropriate operational strategies to cater to customer needs.
This study has several significant managerial implications for managers across Southeast Asian airports to increase the level of airport service. The rising popularity of UGC platforms has led to a substantial increase in travelers willing to share their experiences. Crowdsourcing data have become a vital resource for airport executives, offering profound insights into consumer needs and preferences [4,9]. The outcome of this research indicates that effective queue management and improved staff conduct are crucial to enhancing passenger satisfaction.
Long waiting times can be mitigated by implementing more efficient processes or increasing the number of staff members during peak periods. Poor customer service can be addressed by providing superior training and ensuring accountability for staff actions. These factors are closely associated with customer dissatisfaction. Therefore, improvements in every queuing process and in staff courtesy are necessary.
The implementation of self-service check-in kiosks has led to some concerns. The integration of touchless systems featuring automated gates and sensors could further reduce queuing time across various airport procedures. The use of technology could expedite processes, lower energy usage, and reduce the carbon footprint. The ambiance of the areas should be improved, or various kinds of entertainment should be provided to distract passengers while they wait in line. Preliminary checking of passengers’ documents by airport staff while they are in queue could shorten the processing time at counters and prevent any issues from occurring that could extend the waiting time of other passengers in the line. This includes enhancing customer service by training staff to handle challenging or frustrating situations, improving security procedures for quick and efficient passport checks, and ensuring that check-in areas are not overcrowded. Fodness and Murray [34] suggested that staff manner contributes to improving airport service level and that staff who are well trained on the importance of excellent service and communication skills could increase the level of the airport’s efficiency and productivity [79].
In the context of unexpected delays at airports, it is crucial to consider the provision of facilities and services that cater to the needs of passengers. This includes an evaluation of how effectively airports manage disruptions, the quality of communication regarding delays, and the steps taken to ensure passenger comfort and well-being during such instances. Efficient airport services should be provided to handle unforeseen situations, which entails effective communication between staff and passengers and the availability of relaxation amenities such as comfortable seating, electric massage chairs, and airport hotels. Round-the-clock restaurants and café services also contribute to passenger convenience. For travelers accompanied by children, the presence of family-friendly facilities, play areas, and accommodations tailored to their specific needs is essential. Similarly, individuals with health concerns would benefit from onsite medical facilities, prompt response to medical emergencies by airport staff, and additional support services. Incorporating these elements into the operations of Southeast Asian airports would not only improve their overall assessment but also provide valuable insights for travelers with specific needs or concerns. Resilience and preparedness are important sustainability factors. Ensuring that airports are ready to handle disruptions not only enhances the passenger experience but also demonstrates a commitment to sustainable operations in challenging situations.
The outcomes of this study carry substantial implications for the field of airport management. Through the dissection of service components and the prioritization of pivotal factors, airports can augment their operational efficiency and elevate service standards. Additionally, this approach allows airports or investors to refrain from allocating resources to less critical areas, thereby achieving cost savings. This holds particular significance for developing countries, which are predominant in the Southeast Asia region, where resources for airport infrastructure investments are constrained. By leveraging the findings of this study, airport management teams, authorities, and other stakeholders can strategically address problems and improve the areas that have the most substantial impact on passenger experience, operational efficiency, cost savings, and environmental and economic benefits.

5.3. Limitations and Prospective Research

This research has certain limitations that need to be considered. First, this study was conducted only on the nine busiest Southeast Asian airports. Future research could conduct a cross-regional comparative study, incorporating a more diverse pool of data from various nations. Such an approach could provide insights into the cultural influences on passenger satisfaction, offering a more nuanced understanding of the factors at play in different countries. Second, the current study used only one UGC platform, Skytrax. Future research could compare other platforms, such as Google Maps, TripAdvisor, and Twitter to measure similarity to or differentiation from the results of this study. Third, the credibility of the research findings could be strengthened by incorporating robustness tests or preliminary analyses. Panel regression, an alternative method, involves observing multiple entities across two or more time periods. Fourth, the potential impact of the COVID-19 era on the data under consideration is indeed a significant factor. It is plausible that segregating the data into pre-COVID-19 and post-COVID-19 periods may yield different results. Currently, however, the quantity of Skytrax reviews for Southeast Asian airports is insufficient for comprehensive analysis. Nevertheless, this presents an opportunity for future research. Finally, future research could incorporate qualitative methodologies to augment the depth of the insights garnered from airport passengers. A data-driven crowdsourcing approach could be adopted, employing sentiment analysis and leveraging state-of-the-art natural language processing (NLP) techniques that account for sentence context. This nuanced sentiment analysis has the potential to furnish a more precise evaluation of passengers’ perspectives on airport services and better meet their needs and expectations.

Author Contributions

Conceptualization, T.P. and W.W.; Methodology, T.P. and W.W.; Software, T.P and W.W.; Validation, T.P. and W.W.; Investigation, T.P.; Resources, T.P. and W.W.; Writing—original draft, T.P.; Writing—review & editing, W.W.; Supervision, W.W. and V.R. All authors have read and agreed to the published version of the manuscript.

Funding

This research received no external funding.

Institutional Review Board Statement

The study was conducted in accordance with the Declaration of Helsinki and approved by the Ethics Committee of Suranaree University of Technology (protocol code EC-65-0139; date of approval 18 January 2023).

Informed Consent Statement

Not applicable.

Data Availability Statement

The data from this study are available upon request from the corresponding author and are subject to privacy restrictions.

Acknowledgments

This study received support from the Doctoral Scholarship of Suranaree University of Technology. The Thammasat University Research Unit in Data Science and Digital Transformation funded the article publishing charge.

Conflicts of Interest

The authors declare no conflicts of interest.

References

  1. ACI. Global Passenger Traffic Expected to Recover by 2024 and Reach 9.4 Billion Passengers. 2023. Available online: https://aci.aero/2023/09/27/global-passenger-traffic-expected-to-recover-by-2024-and-reach-9-4-billion-passengers/ (accessed on 19 January 2024).
  2. Elshafey, M.; Rowlands, D.; Contestabile, E.; El Halim, A.O.A. Airport level of service perceptions before and after September 11: A neural network analysis. WIT Trans. Built Environ. 2007, 94, 337–345. [Google Scholar]
  3. ACI. About ACI. 2022. Available online: https://aci.aero/about-aci/ (accessed on 6 October 2022).
  4. Lee, K.; Yu, C. Assessment of airport service quality: A complementary approach to measure perceived service quality based on Google reviews. J. Air Transp. Manag. 2018, 71, 28–44. [Google Scholar] [CrossRef]
  5. Molaei, P.; Hunter, W.C. A qualitative exploration of Incheon international airport (ICN) service quality from the passengers’ perspective in a web-based environment. Int. J. Tour. Sci. 2019, 19, 287–306. [Google Scholar] [CrossRef]
  6. Li, L.; Mao, Y.; Wang, Y.; Ma, Z. How has airport service quality changed in the context of COVID-19: A data-driven crowdsourcing approach based on sentiment analysis. J. Air Transp. Manag. 2022, 105, 102298. [Google Scholar] [CrossRef] [PubMed]
  7. Sezgen, E.; Mason, K.J.; Mayer, R. Voice of airline passenger: A text mining approach to understand customer satisfaction. J. Air Transp. Manag. 2019, 77, 65–74. [Google Scholar] [CrossRef]
  8. Nghiêm-Phú, B.; Suter, J.R. Airport image: An exploratory study of McCarran International Airport. J. Air Transp. Manag. 2018, 67, 72–84. [Google Scholar] [CrossRef]
  9. Martin-Domingo, L.; Martín, J.C.; Mandsberg, G. Social media as a resource for sentiment analysis of Airport Service Quality (ASQ). J. Air Transp. Manag. 2019, 78, 106–115. [Google Scholar] [CrossRef]
  10. Barakat, H.; Yeniterzi, R.; Martín-Domingo, L. Applying deep learning models to twitter data to detect airport service quality. J. Air Transp. Manag. 2021, 91, 102003. [Google Scholar] [CrossRef]
  11. Bunchongchit, K.; Wattanacharoensil, W. Data Analytics of Skytrax’s Airport Review and Ratings: Views of Airport Quality by Passengers Types. Res. Transp. Bus. Manag. 2021, 41, 100688. [Google Scholar] [CrossRef]
  12. Gitto, S.; Mancuso, P. Improving airport services using sentiment analysis of the websites. Tour. Manag. Perspect. 2017, 22, 132–136. [Google Scholar] [CrossRef]
  13. Kiliç, S.; Çadirci, T.O. An evaluation of airport service experience: An identification of service improvement opportunities based on topic modeling and sentiment analysis. Res. Transp. Bus. Manag. 2022, 43, 100744. [Google Scholar] [CrossRef]
  14. Wattanacharoensil, W.; Schuckert, M.; Graham, A.; Dean, A. An analysis of the airport experience from an air traveler perspective. J. Hosp. Tour. Manag. 2017, 32, 124–135. [Google Scholar] [CrossRef]
  15. Yavuz, N.; Olgaç, S.; Günay Aktaş, S.; Mert Kantar, Y. Passenger Satisfaction in European Airports in Travel and Tourism: Sustainability, Economics, and Management Issues; Springer: Singapore, 2020. [Google Scholar]
  16. Bakır, M.; Akan, S.; Özdemir, E.; Nguyen, P.-H.; Tsai, J.-F.; Pham, H.-A. How to Achieve Passenger Satisfaction in the Airport? Findings from Regression Analysis and Necessary Condition Analysis Approaches through Online Airport Reviews. Sustainability 2022, 14, 2151. [Google Scholar] [CrossRef]
  17. Bogicevic, V.; Yang, W.; Bilgihan, A.; Bujisic, M. Airport service quality drivers of passenger satisfaction. Tour. Rev. 2013, 68, 3–18. [Google Scholar] [CrossRef]
  18. Halpern, N.; Mwesiumo, D. Airport service quality and passenger satisfaction: The impact of service failure on the likelihood of promoting an airport online. Res. Transp. Bus. Manag. 2021, 41, 100667. [Google Scholar] [CrossRef]
  19. Bae, W.; Chi, J. Content Analysis of Passengers’ Perceptions of Airport Service Quality: The Case of Honolulu International Airport. J. Risk Financ. Manag. 2022, 15, 5. [Google Scholar] [CrossRef]
  20. Bulatović, I.; Dempere, J.; Papatheodorou, A. The explanatory power of the SKYTRAX’s airport rating system: Implications for airport management. Transp. Econ. Manag. 2023, 1, 104–111. [Google Scholar] [CrossRef]
  21. Homaid, M.S.; Moulitsas, I. Measuring Airport Service Quality Using Machine Learning Algorithms. In Proceedings of the 6th International Conference on Advances in Artificial Intelligence, New York, NY, USA, 18–20 November 2023; Association for Computing Machinery: Birmingham, UK, 2023; pp. 8–14. [Google Scholar]
  22. Arasli, H.; Saydam, M.B.; Jafari, K.; Arasli, F. Nordic Airports’ service quality attributes: Themes in online reviews. Scand. J. Hosp. Tour. 2023, 23, 248–263. [Google Scholar] [CrossRef]
  23. Abouseada, A.A.A.H.; Hassan, T.H.; Saleh, M.I.; Radwan, S.H. The power of airport branding in shaping tourist destination image: Passenger commitment perspective. GeoJournal Tour. Geosites 2023, 47, 440–449. [Google Scholar] [CrossRef]
  24. Skytrax. Explaining Airport Star Rating Levels. 2024. Available online: https://skytraxratings.com/explaining-airport-star-ratings-levels (accessed on 13 January 2024).
  25. Skytrax. Our Background. 2023. Available online: https://www.airlinequality.com/about-us/ (accessed on 3 July 2023).
  26. Sadou, A.; Tchouamou Njoya, E. Applications of Artificial Intelligence in the Air Transport Industry: A Bibliometric and Systematic Literature Review. J. Aerosp. Technol. Manag. 2023, 15, 1312. [Google Scholar] [CrossRef]
  27. ACI. Airport Service Quality Customer Experience. 2021. Available online: https://aci.aero/programs-and-services/asq/ (accessed on 6 July 2021).
  28. Wattanacharoensil, W.; Schuckert, M.; Graham, A. An Airport Experience Framework from a Tourism Perspective. Transp. Rev. 2015, 36, 318–340. [Google Scholar] [CrossRef]
  29. Graham, A. How important are commercial revenues to today’s airports? J. Air Transp. Manag. 2009, 15, 106–111. [Google Scholar] [CrossRef]
  30. Del Chiappa, G.; Martin, J.C.; Roman, C. Service quality of airports’ food and beverage retailers. A fuzzy approach. J. Air Transp. Manag. 2016, 53, 105–113. [Google Scholar] [CrossRef]
  31. Bezerra, G.C.L.; Gomes, C.F. Determinants of passenger loyalty in multi-airport regions: Implications for tourism destination. Tour. Manag. Perspect. 2019, 31, 145–158. [Google Scholar] [CrossRef]
  32. Freitas, P.T.; Silva, L.M.; Nascimento, M.V.; Borille, G.M. Passenger profile and its effects on satisfaction level in food and beverage establishments: Case study of major Brazilian airports. Case Stud. Transp. Policy 2021, 9, 1219–1224. [Google Scholar] [CrossRef]
  33. ACI. Airport Service Quality (ASQ). 2021. Available online: https://aci.aero/customer-experience-asq/ (accessed on 6 July 2021).
  34. Fodness, D.; Murray, B. Passengers’ expectations of airport service quality. J. Serv. Mark. 2007, 21, 492–506. [Google Scholar] [CrossRef]
  35. Lubbe, B.; Douglas, A.; Zambellis, J. An application of the airport service quality model in South Africa. J. Air Transp. Manag. 2011, 17, 224–227. [Google Scholar] [CrossRef]
  36. Bezerra, G.C.L.; Gomes, C.F. Antecedents and consequences of passenger satisfaction with the airport. J. Air Transp. Manag. 2020, 83, 101766. [Google Scholar] [CrossRef]
  37. Isa, N.A.M.; Ghaus, H.; Hamid, N.A.; Tan, P.-L. Key drivers of passengers’ overall satisfaction at klia2 terminal. J. Air Transp. Manag. 2020, 87, 101859. [Google Scholar] [CrossRef]
  38. Pholsook, T.; Wipulanusat, W.; Thamsatitdej, P.; Ramjan, S.; Sunkpho, J.; Ratanavaraha, V. A Three-Stage Hybrid SEM-BN-ANN Approach for Analyzing Airport Service Quality. Sustainability 2023, 15, 8885. [Google Scholar] [CrossRef]
  39. Skytrax. Airline and Airport Customer Reviews. 2023. Available online: https://www.airlinequality.com/ (accessed on 1 July 2023).
  40. Bezerra, G.C.L.; Gomes, C.F. Measuring airport service quality: A multidimensional approach. J. Air Transp. Manag. 2016, 53, 85–93. [Google Scholar] [CrossRef]
  41. Stolletz, R. Analysis of passenger queues at airport terminals. Res. Transp. Bus. Manag. 2011, 1, 144–149. [Google Scholar] [CrossRef]
  42. Aniyeri, R.; Nadar, R. Passengers queue analysis in international airports terminals in Kerala using multiphase queuing system. Int. J. Math. Oper. Res. 2018, 12, 1. [Google Scholar] [CrossRef]
  43. Schultz, M.; Luo, M.; Lubig, D.; Mota, M.M.; Scala, P. COVID-19-Related Challenges for New Normality in Airport Terminal Operations. In Proceedings of the Winter Simulation Conference (WSC), Phoenix, AZ, USA, 12–15 December 2021. [Google Scholar]
  44. Pandey, M.M. Evaluating the service quality of airports in Thailand using fuzzy multi-criteria decision making method. J. Air Transp. Manag. 2016, 57, 241–249. [Google Scholar] [CrossRef]
  45. Allen, J.; Bellizzi, M.G.; Eboli, L.; Forciniti, C.; Mazzulla, G. Identifying strategies for improving airport services: Introduction of the Gap-IPA to an Italian airport case study. Transp. Lett. 2021, 13, 243–253. [Google Scholar] [CrossRef]
  46. Paramonovs, S.; Ijevleva, K. Factor Analysis of Passengers’ Satisfaction at “RIGA International Airport”. Econ. Bus. 2015, 27, 46–52. [Google Scholar] [CrossRef]
  47. Bellizzi, M.G.; Eboli, L.; Forciniti, C.; Mazzulla, G. Air Transport Passengers’ Satisfaction: An Ordered Logit Model. Transp. Res. Procedia 2018, 33, 147–154. [Google Scholar] [CrossRef]
  48. Lopez-Valpuesta, L.; Casas-Albala, D. Has passenger satisfaction at airports changed with the onset of COVID-19? The case of Seville Airport (Spain). J. Air Transp. Manag. 2023, 108, 102361. [Google Scholar] [CrossRef]
  49. Wakefield, K.L.; Blodgett, J.G. The effect of the servicescape on customers’ behavioral intentions in leisure service settings. J. Serv. Mark. 1996, 10, 45–61. [Google Scholar] [CrossRef]
  50. Zheng, M.-C. How Airport Users luggage affects their Perception of Seat Design at Airports. J. Asian Archit. Build. Eng. 2014, 13, 141–148. [Google Scholar] [CrossRef]
  51. Lin, J.; Song, R.; Dai, J.; Jiao, P. Pedestrian Guiding Signs Optimization for Airport Terminal. Discret. Dyn. Nat. Soc. 2014, 2014, 125910. [Google Scholar] [CrossRef]
  52. Fewings, R. Wayfinding and Airport Terminal Design. J. Navig. 2001, 54, 177–184. [Google Scholar] [CrossRef]
  53. Das, A.; Choudhury, P. Identifying airline passengers satisfaction and ground airport services perception of kolkata airport during COVID19—ASQ (Airport Service Quality) perspective. Int. J. Health Sci. 2022, 6, 5583–5595. [Google Scholar] [CrossRef]
  54. Farr, A.C.; Kleinschmidt, T.; Johnson, S.; Yarlagadda, P.K.D.V.; Mengersen, K. Investigating effective wayfinding in airports: A Bayesian network approach. Transport 2014, 29, 90–99. [Google Scholar] [CrossRef]
  55. Cao, M.; Li, L.; Zhang, Y. Developing a passenger-centered airport: A case study of Urumqi airport in Xinjiang, China. J. Air Transp. Manag. 2023, 108, 102363. [Google Scholar] [CrossRef]
  56. D’Alonzo, L.; Leva, M.C.; Bucciarelli, E. Comparing Passenger Satisfaction, Employees’ Perspective and Performance on Quality and Safety Indicators: A Field Study. Sustainability 2021, 13, 5636. [Google Scholar] [CrossRef]
  57. Han, S.; Ham, S.; Yang, I.; Baek, S. Passengers’ perceptions of airline lounges: Importance of attributes that determine usage and service quality measurement. Tour. Manag. 2012, 33, 1103–1111. [Google Scholar] [CrossRef]
  58. Han, H.; Yu, J.; Kim, W. Airport shopping—An emerging non-aviation business: Triggers of traveler loyalty. J. Travel Tour. Mark. 2018, 35, 835–845. [Google Scholar] [CrossRef]
  59. Jiang, H.; Zhang, Y. An assessment of passenger experience at Melbourne Airport. J. Air Transp. Manag. 2016, 54, 88–92. [Google Scholar] [CrossRef]
  60. Antwi, C.O.; Fan, C.-J.; Ihnatushchenko, N.; Aboagye, M.O.; Xu, H. Does the nature of airport terminal service activities matter? Processing and non-processing service quality, passenger affective image and satisfaction. J. Air Transp. Manag. 2020, 89, 101869. [Google Scholar] [CrossRef]
  61. Mirghafoori, S.H.; Izadi, M.R.; Daei, A. An integrated approach for prioritizing the barriers to airport service quality in an intuitionistic-fuzzy environment. Cogent Bus. Manag. 2018, 5, 1532277. [Google Scholar] [CrossRef]
  62. OAG. Southeast Asia Aviation Market. 2024. Available online: https://www.oag.com/south-east-asia-aviation-flight-data (accessed on 19 January 2024).
  63. Skytrax. About Skytrax Rating. 2023. Available online: https://skytraxratings.com/about (accessed on 30 June 2023).
  64. Punel, A.; Al Hajj Hassan, L.; Ermagun, A. Variations in airline passenger expectation of service quality across the globe. Tour. Manag. 2019, 75, 491–508. [Google Scholar] [CrossRef]
  65. Shadiyar, A.; Ban, H.-J.; Kim, H.-S. Extracting Key Drivers of Air Passenger’s Experience and Satisfaction through Online Review Analysis. Sustainability 2020, 12, 9188. [Google Scholar] [CrossRef]
  66. Chatterjee, S.; Mandal, P. Traveler preferences from online reviews: Role of travel goals, class and culture. Tour. Manag. 2020, 80, 104108. [Google Scholar] [CrossRef]
  67. Mooi, E.; Sarstedt, M. A Concise Guide to Market Research, 3rd ed.; Springer: Berlin/Heidelberg, Germany, 2019; p. 308. [Google Scholar]
  68. Wipulanusat, W.; Panuwatwanich, K.; Stewart, R.A.; Arnold, S.L.; Wang, J. Bayesian network revealing pathways to workplace innovation and career satisfaction in the public service. J. Manag. Anal. 2020, 7, 253–280. [Google Scholar] [CrossRef]
  69. Zhou, Y.; Fenton, N.; Neil, M. Bayesian network approach to multinomial parameter learning using data and expert judgments. Int. J. Approx. Reason. 2014, 55, 1252–1268. [Google Scholar] [CrossRef]
  70. Zou, W.; Sun, Y.; Zhou, Y.; Lu, Q.; Nie, Y.; Sun, T.; Peng, L. Limited Sensing and Deep Data Mining: A New Exploration of Developing City-Wide Parking Guidance Systems. IEEE Intell. Transp. Syst. Mag. 2022, 14, 198–215. [Google Scholar] [CrossRef]
  71. Chen, J.; Wang, Q.; Peng, W.; Xu, H.; Li, X.; Xu, W. Disparity-Based Multiscale Fusion Network for Transportation Detection. IEEE Trans. Intell. Transp. Syst. 2022, 23, 18855–18863. [Google Scholar] [CrossRef]
  72. Leong, L.Y.; Hew, T.S.; Lee, V.H.; Ooi, K.B. An SEM–artificial-neural-network analysis of the relationships between SERVPERF, customer satisfaction and loyalty among low-cost and full-service airline. Expert Syst. Appl. 2015, 42, 6620–6634. [Google Scholar] [CrossRef]
  73. Kalinic, Z.; Marinkovic, V.; Molinillo, S.; Liébana-Cabanillas, F. A multi-analytical approach to peer-to-peer mobile payment acceptance prediction. J. Retail. Consum. Serv. 2019, 49, 143–153. [Google Scholar] [CrossRef]
  74. Pallant, J. SPSS Survival Manual: A Step by Step Guide to Data Analysis Using IBM SPSS, 7th ed.; Routledge: London, UK, 2020; p. 378. [Google Scholar]
  75. Häger, D.; Andersen, L.B. A knowledge based approach to loss severity assessment in financial institutions using Bayesian networks and loss determinants. Eur. J. Oper. Res. 2010, 207, 1635–1644. [Google Scholar] [CrossRef]
  76. Kichhanagari, R.; Motley, R.D.; Duffy, S.A.; Fisher, D.L. Airport Terminal Signs: Use of Advance Guide Signs to Speed Search Times. Transp. Res. Rec. 2002, 1788, 26–32. [Google Scholar] [CrossRef]
  77. Pamucar, D.; Yazdani, M.; Montero-Simo, M.J.; Araque-Padilla, R.A.; Mohammed, A. Multi-criteria decision analysis towards robust service quality measurement. Expert Syst. Appl. 2021, 170, 114508. [Google Scholar] [CrossRef]
  78. Kayapınar, S.; Erginel, N. Designing the airport service with fuzzy QFD based on SERVQUAL integrated with a fuzzy multi-objective decision model. Total Qual. Manag. Bus. Excell. 2019, 30, 1429–1448. [Google Scholar] [CrossRef]
  79. Pantouvakis, A.; Renzi, M.F. Exploring different nationality perceptions of airport service quality. J. Air Transp. Manag. 2016, 52, 90–98. [Google Scholar] [CrossRef]
  80. Antwi, C.O.; Fan, C.-J.; Nataliia, I.; Aboagye, M.O.; Xu, H.; Azamela, J.C. Do airport staff helpfulness and communication generate behavioral loyalty in transfer passengers? A conditional mediation analysis. J. Retail. Consum. Serv. 2020, 54, 102002. [Google Scholar] [CrossRef]
Figure 1. The model of airport service.
Sustainability 16 01164 g001
Figure 2. BN results for the Skytrax total rating score.
Sustainability 16 01164 g002
Figure 3. Neural network model.
Sustainability 16 01164 g003
Table 1. Demographic information (n = 1016).
Passenger
Characteristics
CategorySubcategoryFrequencyPercentage
Passenger
Experience
Arrival and
Departure
40840.16%
Departure Only 36235.63%
Transit 14614.37%
Arrival Only 1009.84%
Passenger TypeSolo Trip 35735.14%
Business Trip 23823.43%
Family Trip 22422.05%
Couple Trip 19719.39%
Passenger by
Continent
AsiaSoutheast Asia45244.49%
East Asia565.51%
South Asia272.66%
West Asia212.07%
OceaniaAustralia and New Zealand15415.16%
EuropeNorthern Europe13212.99%
Western Europe555.41%
Southern Europe90.89%
Eastern Europe80.79%
North AmericaNorth America898.76%
Central America10.10%
South AmericaSouth America20.20%
AfricaSouthern Africa10.10%
NonidentifiedNonidentified90.89%
Table 2. Summary statistics and correlations (n = 1016).
AttributesMeanSD 1OverallQueuing TimeCleanlinessSeating AreasSignageFood ServicesRetail OptionsWi-Fi AvailabilityStaff Courtesy
Total rating4.903.2841
Queuing time2.761.5550.804 **1
Cleanliness3.331.4140.759 **0.661 **1
Seating areas2.961.4900.769 **0.659 **0.791 **1
Signage3.291.4260.766 **0.651 **0.720 **0.742 **1
Food services2.911.4970.761 **0.625 **0.717 **0.767 **0.714 **1
Retail options2.921.4720.763 **0.633 **0.712 **0.742 **0.708 **0.846 **1
Wi-Fi availability 3.051.4870.665 **0.610 **0.632 **0.620 **0.622 **0.616 **0.606 **1
Staff courtesy2.911.5570.805**0.705 **0.682 **0.673 **0.682 **0.667 **0.666 **0.619 **1
1 standard deviation, ** significant at the 0.001 level.
Table 3. Summary of MRA results.
Hypothesis PathBStandard Errorβt ValueDecisionVIF
Constant−1.9300.118-−16.363 **--
H1: Queuing time → Total airport rating0.6300.0430.29814.591 **Supported2.476
H2: Cleanliness → Total airport rating0.1670.0550.0723.017 *Supported3.380
H3: Seating areas → Total airport rating0.1850.0560.0843.319 *Supported3.800
H4: Signage → Total airport rating0.2880.0520.1255.581 **Supported2.972
H5: Food services → Total airport rating0.1990.0590.0913.356 *Supported4.327
H6: Retail options → Total airport rating0.2440.0580.1094.175 **Supported4.069
H7: Wi-Fi availability → Total airport rating0.0640.0410.0291.558Not Supported2.070
H8: Staff courtesy → Total airport rating0.5320.0450.25211.785 **Supported2.719
Total airport rating: dependent variable; B: unstandardized coefficient; β: standardized coefficient. R2 = 0.830, SEE = 1.395, F = 614.862, Sig. of F = 0.000, Dubin–Watson = 1.895, * p < 0.05, ** p < 0.001.
Table 4. Classification matrix for evaluating robustness.
SampleObservationPrediction
LowMediumHighPercent Accuracy
TrainingLow30223990.4%
Medium44422438.2%
High32623288.9%
Overall Percent49.5%12.9%37.6%81.7%
TestingLow1217293.1%
Medium26102117.5%
High3511693.5%
Overall Percent48.2%7.1%44.7%79.4%
Table 5. Importance of airport service attributes (independent variables).
AttributeImportanceNormalized Importance
Queuing time0.220100.0%
Staff courtesy0.21196.0%
Seating areas0.16173.4%
Signage0.13561.3%
Retail options0.09543.1%
Food services0.09242.0%
Cleanliness0.08739.6%
Disclaimer/Publisher’s Note: The statements, opinions and data contained in all publications are solely those of the individual author(s) and contributor(s) and not of MDPI and/or the editor(s). MDPI and/or the editor(s) disclaim responsibility for any injury to people or property resulting from any ideas, methods, instructions or products referred to in the content.

