Abstract
Green walls and roofs are sustainable building systems with several benefits. However, the irrigation requirements of these building systems conflict with water sustainability goals in water-scarce places. This study investigates using greywater directly to irrigate ornamental species for such situations by examining the effects of freshwater and greywater irrigation on Ruellia tuberosa growth, plant health and soil characteristics. Five replicates for each condition were grown for 91 days. Greywater irrigation led to a 15% higher plant growth height, a 31% higher plant biomass (p = 0.065), and a 71% increase in stem biomass (p < 0.001) compared to freshwater irrigation. However, greywater-irrigated plants had reduced chlorophyll content (10.7%, p < 0.001), and increased leaf chlorosis (p = 0.003), likely caused by stress from laundry and detergent chemicals. Greywater irrigation led to greater mineral content in greywater-irrigated plant biomass and soil for all minerals tested, most notably boron, which was deficient in the soil. Greywater-irrigated soil also had a higher organic content according to FTIR and electron dispersive spectroscopy. Greywater irrigation improved nutritional and soil conditions, including phosphate, which helped Ruellia tuberosa flourish. This study suggests raw greywater can replace freshwater in water-scarce climates for green wall irrigation instead of high-energy onsite greywater treatment systems.
1. Introduction
In many parts of the world, there is an increasing concern over water scarcity. With the increasing global population, urbanisation, and the challenges posed by climate change, there is a growing need for efficient and sustainable water management strategies. Greywater recycling, which involves using wastewater from sources such as showers, kitchens, sinks, and washing machines for nonpotable activities like irrigation [1,2] and toilet flushing [3], is gaining significant interest. This approach not only minimises the amount of wastewater sent to treatment facilities but also conserves water. Greywater, originating from nontoilet sources, does not contain human faecal waste. In some cases, kitchen wastewater is excluded from greywater to reduce the organic loading from food waste and oil, referred to as lightly polluted greywater [4]. Overall, lightly contaminated greywater has lower pathogenic contamination compared to blackwater. Recycling lightly contaminated greywater presents a potential solution to address the rising water demand and declining water supplies. This approach offers environmental, economic, and social benefits by reducing household and community expenses, while also contributing to climate resilience.
Greywater treatment using nature-based systems is a popular approach due to its low energy use, carbon sequestration ability, ecological benefits and generally lower cost and complexity [5,6,7]. Nature-based systems for greywater treatment use innate processes to eliminate impurities and cleanse water. These systems are intended to cleanse water by emulating natural processes, and they typically use plants, soils, and natural bacteria to do so [8]. These systems include constructed wetlands, biofiltration systems, green roofs, and green walls and rely on a number of processes, including adsorption, filtration, phytoremediation and biodegradation. To achieve effective treatment, it is crucial to carefully assess whether these nature-based greywater treatment systems are appropriate for a certain application and to properly design, implement, and manage them to ensure that the system successfully processes the greywater, protects public health, and conforms with appropriate regulations [9].
Nature-based systems used for greywater treatment come in a variety of shapes and sizes. For instance, constructed wetlands, one of the most commonly employed systems, utilise a succession of shallow ponds or channels filled with gravel, sand, and other media that encourage plant growth and promote filtration, sedimentation, biological conversion and UV irradiation [10]. The horizontal land space needed for constructed wetlands can be a limiting factor for their deployment in urban and other densely populated areas, as well as areas with a high groundwater table, flood risk or steep topography [11,12].
A relatively emergent technique for treating greywater is the use of green walls. Similar to other nature-based systems, green walls use plants to filter pollutants and purify air and water [13]. Green walls are ideal for urban settings due to their vertical nature, minimising valuable urban land area [14]. Using plants to treat greywater is also a natural and sustainable approach to water treatment, as it requires minimal energy and avoids harmful chemicals. Plants absorb and degrade organic materials and pollutants as greywater travels through their root zones [15]. The symbiotic link between plant roots and a variety of microorganisms found in the root zone supports this process. These bacteria help break down pollutants, purifying the water. It is critical to choose plants that can flourish in a particular area and are resilient to potential changes in greywater quality [16]. However, as existing studies have generally struggled to meet reuse standards [17], particularly for phosphorus and bacterial indicators, an alternative is to assess greywater purely for its irrigation potential, with partially treated water being returned to sewer or passed to further treatment. With this limitation in mind, this study aims to directly compare the performance of greywater vs. freshwater on irrigating a common ornamental plant that could be used in a green wall or green roof system in arid or hyper-arid climates. This research addresses a pivotal gap in sustainable irrigation techniques that are suitable for green infrastructure, particularly in arid regions. The study assesses the implications of irrigation with untreated greywater and freshwater with respect to plant growth parameters, health indicators, and soil properties.
Ruellia tuberosa was selected for the study based on its suitability for climatic conditions and availability in Qatar after shortlisting the best-performing plants like Wedelia, Portulaca, Nephrolepis, Ruellia, Alternanthera, and Hemigraphis from previous studies focusing on green wall greywater treatment [18,19,20]. To fully evaluate the impact of greywater, a range of growth, plant health (chlorophyll), and biomass composition indicators were measured. In addition, the study focused on changes in the quality of the soils, which play a major role in the treatment performance of such systems.
2. Materials and Methods
2.1. Plant and Media Selection
In this study, a small-scale pot test was conducted for 90 days from 4th May to the 2nd of August 2021, over the hottest and most challenging growing season in Doha, Qatar. The test considered one ornamental plant, Ruellia tuberosa, as it is locally available, is compact and attractive, and is suited to partial sunlight and hot climates, making it suitable for local conditions. To reduce structural requirements and keep the green wall tidy, the plants should be compact, typically no more than 30 cm in height. Therefore, plants were selected with an initial average height of 20 ± 1.2 cm. The temperature condition during the experiment averaged 36.4 °C with a maximum of 43 °C and the relative humidity was in the range of 29% to 51%. Five replicate pots, each containing a single plant, were considered for both freshwater irrigation and greywater irrigation conditions. The pots had a diameter of 14 cm and a height of 12 cm. They were filled with 450 g of plant-growing media consisting of a 1:2 mix of potting soil and sand. The pots were placed in the balcony area of a building to give partial sunlight. Pots were rotated regularly to ensure equal sunlight availability for all plants.
2.2. Media Characterisation
The characterisation of the growing media before and after irrigation is essential for understanding the effects of irrigation on the media structure and composition. The characteristics analysed were pH, electrical conductivity (ECE), zeta potential, moisture content, BET surface area, porosity, bulk density, Fourier transform infrared spectroscopy (FTIR), scanning electron microscopy (SEM) analysis, energy dispersive X-ray spectroscopy (EDS), nutrients content and salts analysis. The 1:2 mixture of potting soil to sand-growing media was oven-dried at 105 °C before characterisation after washing in the distilled water.
The pH and ECE were determined by mixing 10 g of each media with 50 mL of Milli-q water and agitating at 150 rpm in a shaker for 1 h. The mixture was then allowed to equilibrate for an additional 1 h. The solution was stirred well and then measured for pH and ECE using an Orion multiparameter meter, (Orion Star A121 and A329, Thermo Scientific, Waltham, MA, USA) with probes for pH and EC, respectively [21]. The zeta potential was analysed by adding 0.1 g of the media in 200 mL distilled water, making a solution with a ratio of 1:2000 media to liquid. The resulting solution was then agitated at 150 rpm for 12 h [22], before measuring the zeta potential using a Malvern zeta nanosizer, (Malvern P analytical, Malvern, UK). The porosity was measured by packing media into a 50 mL centrifuge tube and measuring the volume required to fill the pore space [23]. The bulk density was calculated using pycnometers with a capacity of 10 mL. The weight difference of an empty and media-filled pycnometer divided by the volume gives the bulk density in g/cm3 [24]. The BET surface area is an important parameter to understand the pore space and pore volume and was measured using an ASAP 2020plus BET analyser (Micromeritics, Norcross, GA, USA). The adsorbate used was liquid nitrogen. 0.1–0.2 g of sample was first degassed to remove contaminants for 8 h before analysis. The initial soil, the freshwater-irrigated soil, and the greywater-irrigated soil were characterised.
Biofilm is expected to grow on the soil after the water treatments [25,26]. Therefore, the soil samples were stored at −80 °C prior to morphological analysis by environmental SEM. The SEM analysis was carried out on an FEI Quanta 650FEG (Field Electron and Ion Company, Hillsboro, OR, USA). The soil samples before and after irrigation were imaged to observe surface changes and biofilm growth. The sample was coated with a 5 nm layer of gold for conductivity before testing. EDS is a technique that is coupled to the SEM and was used for analysing the soil samples′ elemental composition. This study provided insights into the differences in elemental composition between soils irrigated with freshwater and with greywater, and into changes in chemical composition over the course of irrigation. It was carried out using a Quantax EDS detector (Bruker, Billerica, MA, USA). FTIR analyses were performed to provide further understanding of the chemical composition of the soil. FTIR makes it possible to recognise chemical bond structures in soil, including water, minerals, and organic materials. This information can be used to assess soil quality, nutrient availability, and carbon sequestration capacity [27,28]. FTIR measurements were carried out in the transmittance mode on a Nicolet iS50 FT-IR spectrometer (Thermo Scientific, Waltham, MA, USA), equipped with an attenuated total reflectance sampling accessory with a diamond crystal plate. Spectra were recorded with 32 scans per sample/background in the spectral range of 4000–400 cm−1 at 4 cm−1 spectral resolution.
For nutrient and heavy metal analysis, soil samples were microwave acid digested in an Ethos UP (Milestone). For the metals analysis, the digestion reagent consisted of 8 mL of nitric acid, 5 mL of hydrochloric acid, and 2 mL of hydrogen peroxide for each digestion vessel. The microwave was operated with a ramp rate of 13 °C/min, a pressure of 90 bar, and a residence time of 30 min, with a final temperature setpoint of 200 °C. Following digestion, 2 mL of hydrochloric acid was then added to completely digest the samples. Prior to detecting the mineral content using inductively coupled plasma optical emission spectroscopy (ICP-OES; ICP-OES 5110, Agilent, Palo Alto, CA, USA), which enables simultaneous measurement from both axial and radial approaches, soil samples were diluted ten times and filtered using 0.45-micron PTFE syringe filters. Samples also underwent a similar microwave digestion prior to nutrient analysis in a Sans++ automated wet chemistry analyser (Skalar, Breda, The Netherlands) following a similar method using an alternative acid digestion solution. The digestion solution consisted of 8 parts sulfuric acid and 2 parts hydrochloric acid and was used to digest 0.1 g of soil for subsequent phosphate analysis.
2.3. Greywater Recipe and Characterization
The plants were irrigated daily with 50 mL of synthetic greywater or freshwater except for the last two weeks, where 100 mL was used due to the increasing temperature and plant water requirements during this period. Each of the two water source conditions consisted of five replicates. Synthetic greywater was used to avoid pathogen risks, which otherwise consisted of real household components likely to stress plants and the greywater was prepared as described by [29]. The recipe for greywater is given in Table 1.

Table 1.
Synthetic greywater recipe.
Greywater was characterised by following the standard methods for analysis of water and wastewater [30]. The raw greywater’s pH and ECE were measured using Thermo Scientific Orion multiparameter probes. All other parameters were analysed after filtering the greywater with 0.45 μm Durapore hydrophilic PVDF filter papers through a vacuum filtration apparatus. The resulting greywater was used for chemical oxygen demand (COD) analysis by the Hach process using low-range (0–150 ppm) Hach COD vials. Organics in greywater were also analysed in the form of total organic carbon (TOC) using a TOC-L analyser (Shimadzu, Kyoto, Japan). The nutrients, ammonia and phosphate, were measured using a Sans++ automated wet chemistry analyser (Skalar, Breda, The Netherlands).
2.4. Plant Characterisation
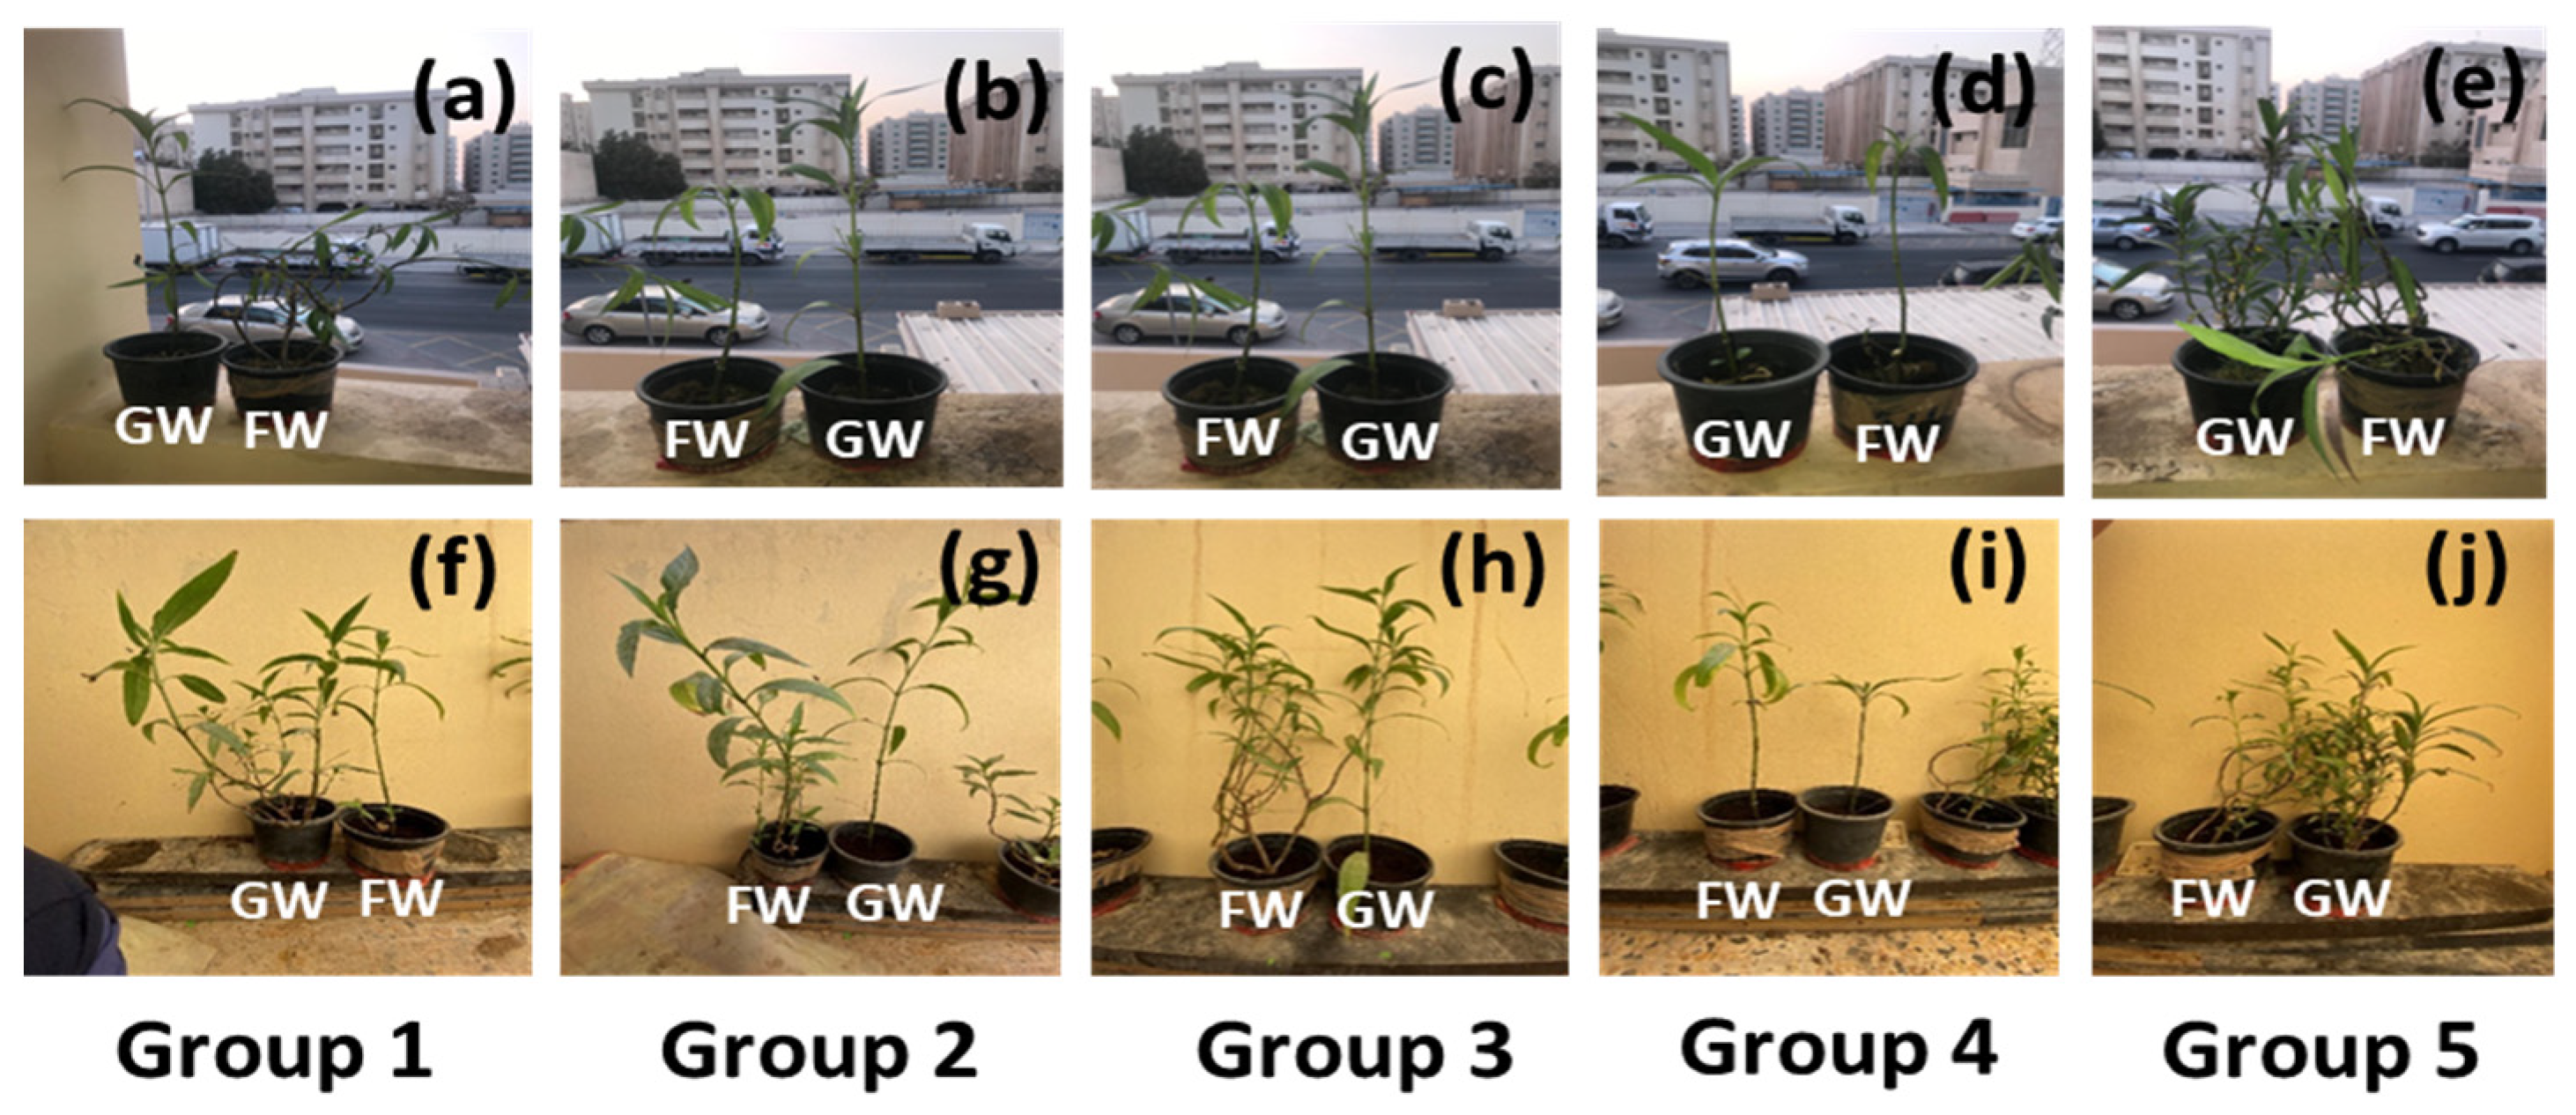
The initial plant height, number of branches, and leaves were measured before supplying the first cycle of freshwater or greywater. The pots were clustered into five pairs consisting of one freshwater-irrigated plant and one greywater-irrigated plant, as shown in Figure 1a–e. The clustering was performed based on the shortest two plants, followed by the third and fourth shortest plants, etc., so that each plant pair was a similar height. In each pair, the irrigation condition was randomly assigned between the plants. This clustering process was performed due to the varied height of the original plants. The evapotranspiration in plants was calculated by the weight method in which the mass-loss of water following irrigation and drainage was calculated over 24 h [31].
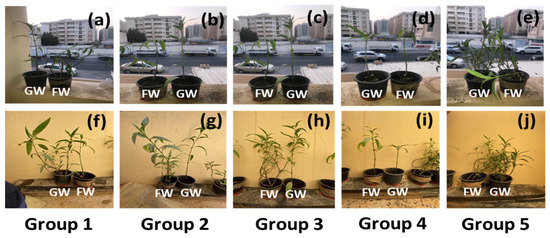
Figure 1.
Images of the plant pairs at (a–e) the initial day of the experiment and (f–j) the final day of the experiment. GW: greywater; FW: freshwater.
All pots were irrigated with the same volume of freshwater and greywater. The final plant growth of each group was analysed by considering the increase in plant height, the number of branches developed, the average leaf length and width, and the plant biomass after harvesting plants. Plant health was also monitored by visual inspection of yellow leaf blemishes and the appearance of brown spots on leaves. The leaf chlorophyll of each plant was measured for five leaves with an Apogee MC 100 chlorophyll meter and reported as an average. After 90 days of plant growth, shown in Figure 1f–j, the plants were harvested, and the soil from the roots was cleaned gently with a brush.
2.5. Plant Biomass
After harvesting the plants, the plant root, shoot, and leaves were separated and dried at 60 °C in an incubator for 48 h, and the weight of dried biomass was measured. FTIR was used to analyse the chemical makeup of the plant tissue from the three sections. The nutrient (phosphate) and metal analyses of the plant biomass were carried out in a similar manner to the soil samples, with the exception that only 2 mL rather than 5 mL of HCl was used in the digestion acid solution for the plant biomass.
Elemental analysis of plant biomass from various plant parts was conducted using a Euro EA 3000 elemental analyzer (EuroVector, Pavia, Italy). This analyser employs the flash dynamic combustion process, ensuring complete combustion of the sample within a high-temperature reactor. Subsequently, the gaseous products from this combustion were separated through gas chromatography and quantified using a thermal adsorption detector (TCD). The calibration standard for the analysis was achieved using sulfanilamide. For sample preparation, plant biomass was finely ground and sieved to a particle size below 200 µm using a sieve shaker. Accurately weighed samples, ranging from 1 to 2 mg, were encapsulated in pressed tin capsules for the analysis.
2.6. Statistical Analysis
The study’s main aim is to compare plant traits when irrigated with either freshwater or greywater over the 90 days of observation. To test differences for parameters monitored throughout the plant growth period, linear mixed models utilising the Satterthwaite method were applied. The irrigation type, days of application, and plant pair were considered fixed effects, and the individual plant differences were modelled as random effects. Interactions of day-irrigation and day-pair were considered, while the irrigation-pair interaction was not modelled. For the comparison of end-of-test measures, such as leaf dimensions (length and width) and plant biomass, the independent samples Student-t test was applied. In cases of unequal variance, the Welch correction was applied, or when normality was violated, the nonparametric Mann–Whitney test was used. Correlation of the elements was carried out by Pearson’s correlation test or, when non-normality was encountered, Spearman’s rho test was performed. A significant threshold of 0.05 was applied for all tests and all analyses were conducted using JASP (version 0.18.1.0).
3. Results and Discussion
3.1. Characteristics of Greywater and Media
The greywater and freshwater characteristics were analysed to understand the organics and nutrients available to the plants. Various characteristics of freshwater and greywater are listed in Table 2. It is obvious from Table 2 that greywater has much higher nutrients and organics available for plant uptake and promotes soil microbial activity better than freshwater by 2–3 orders of magnitude.
Table 2.
Various characteristics of freshwater and greywater.
The media characterisation of mixed soil was performed prior to the planting and is represented in Table 3. The soil was a mixture of potting soil and sandy soil typical to the study region and had a porosity value of 60 ± 2%. This is greater than that of pure sand and potting soil, which typically ranges between 35% and 49% [32,33] and 40% and 60% [34], respectively. This is a relatively high porosity, which aids in water transport and soil aeration. The water holding capacity and initial moisture content in the original unplanted mixed soil were 43.6 ± 2.4% and 55.9 ± 1.1%. These values are relatively high and provide sufficient moisture to the plant during hot dry weather. The zeta potential value was −20.3 ± 1.7 mV, indicating the soil will have some interaction with charged ions [35], which is ideal for nutrient capture and plant growth. Overall, it shows that the original unplanted soil has the desirable characteristics of being well-drained, with moderate organic content and the ability to interact with charged minerals, making it suitable for the growth of Ruellia, which has a taproot structure.
Table 3.
Analysis of various physicochemical properties of mixed soil.
3.2. Plant Morphological and Biomass Characteristics
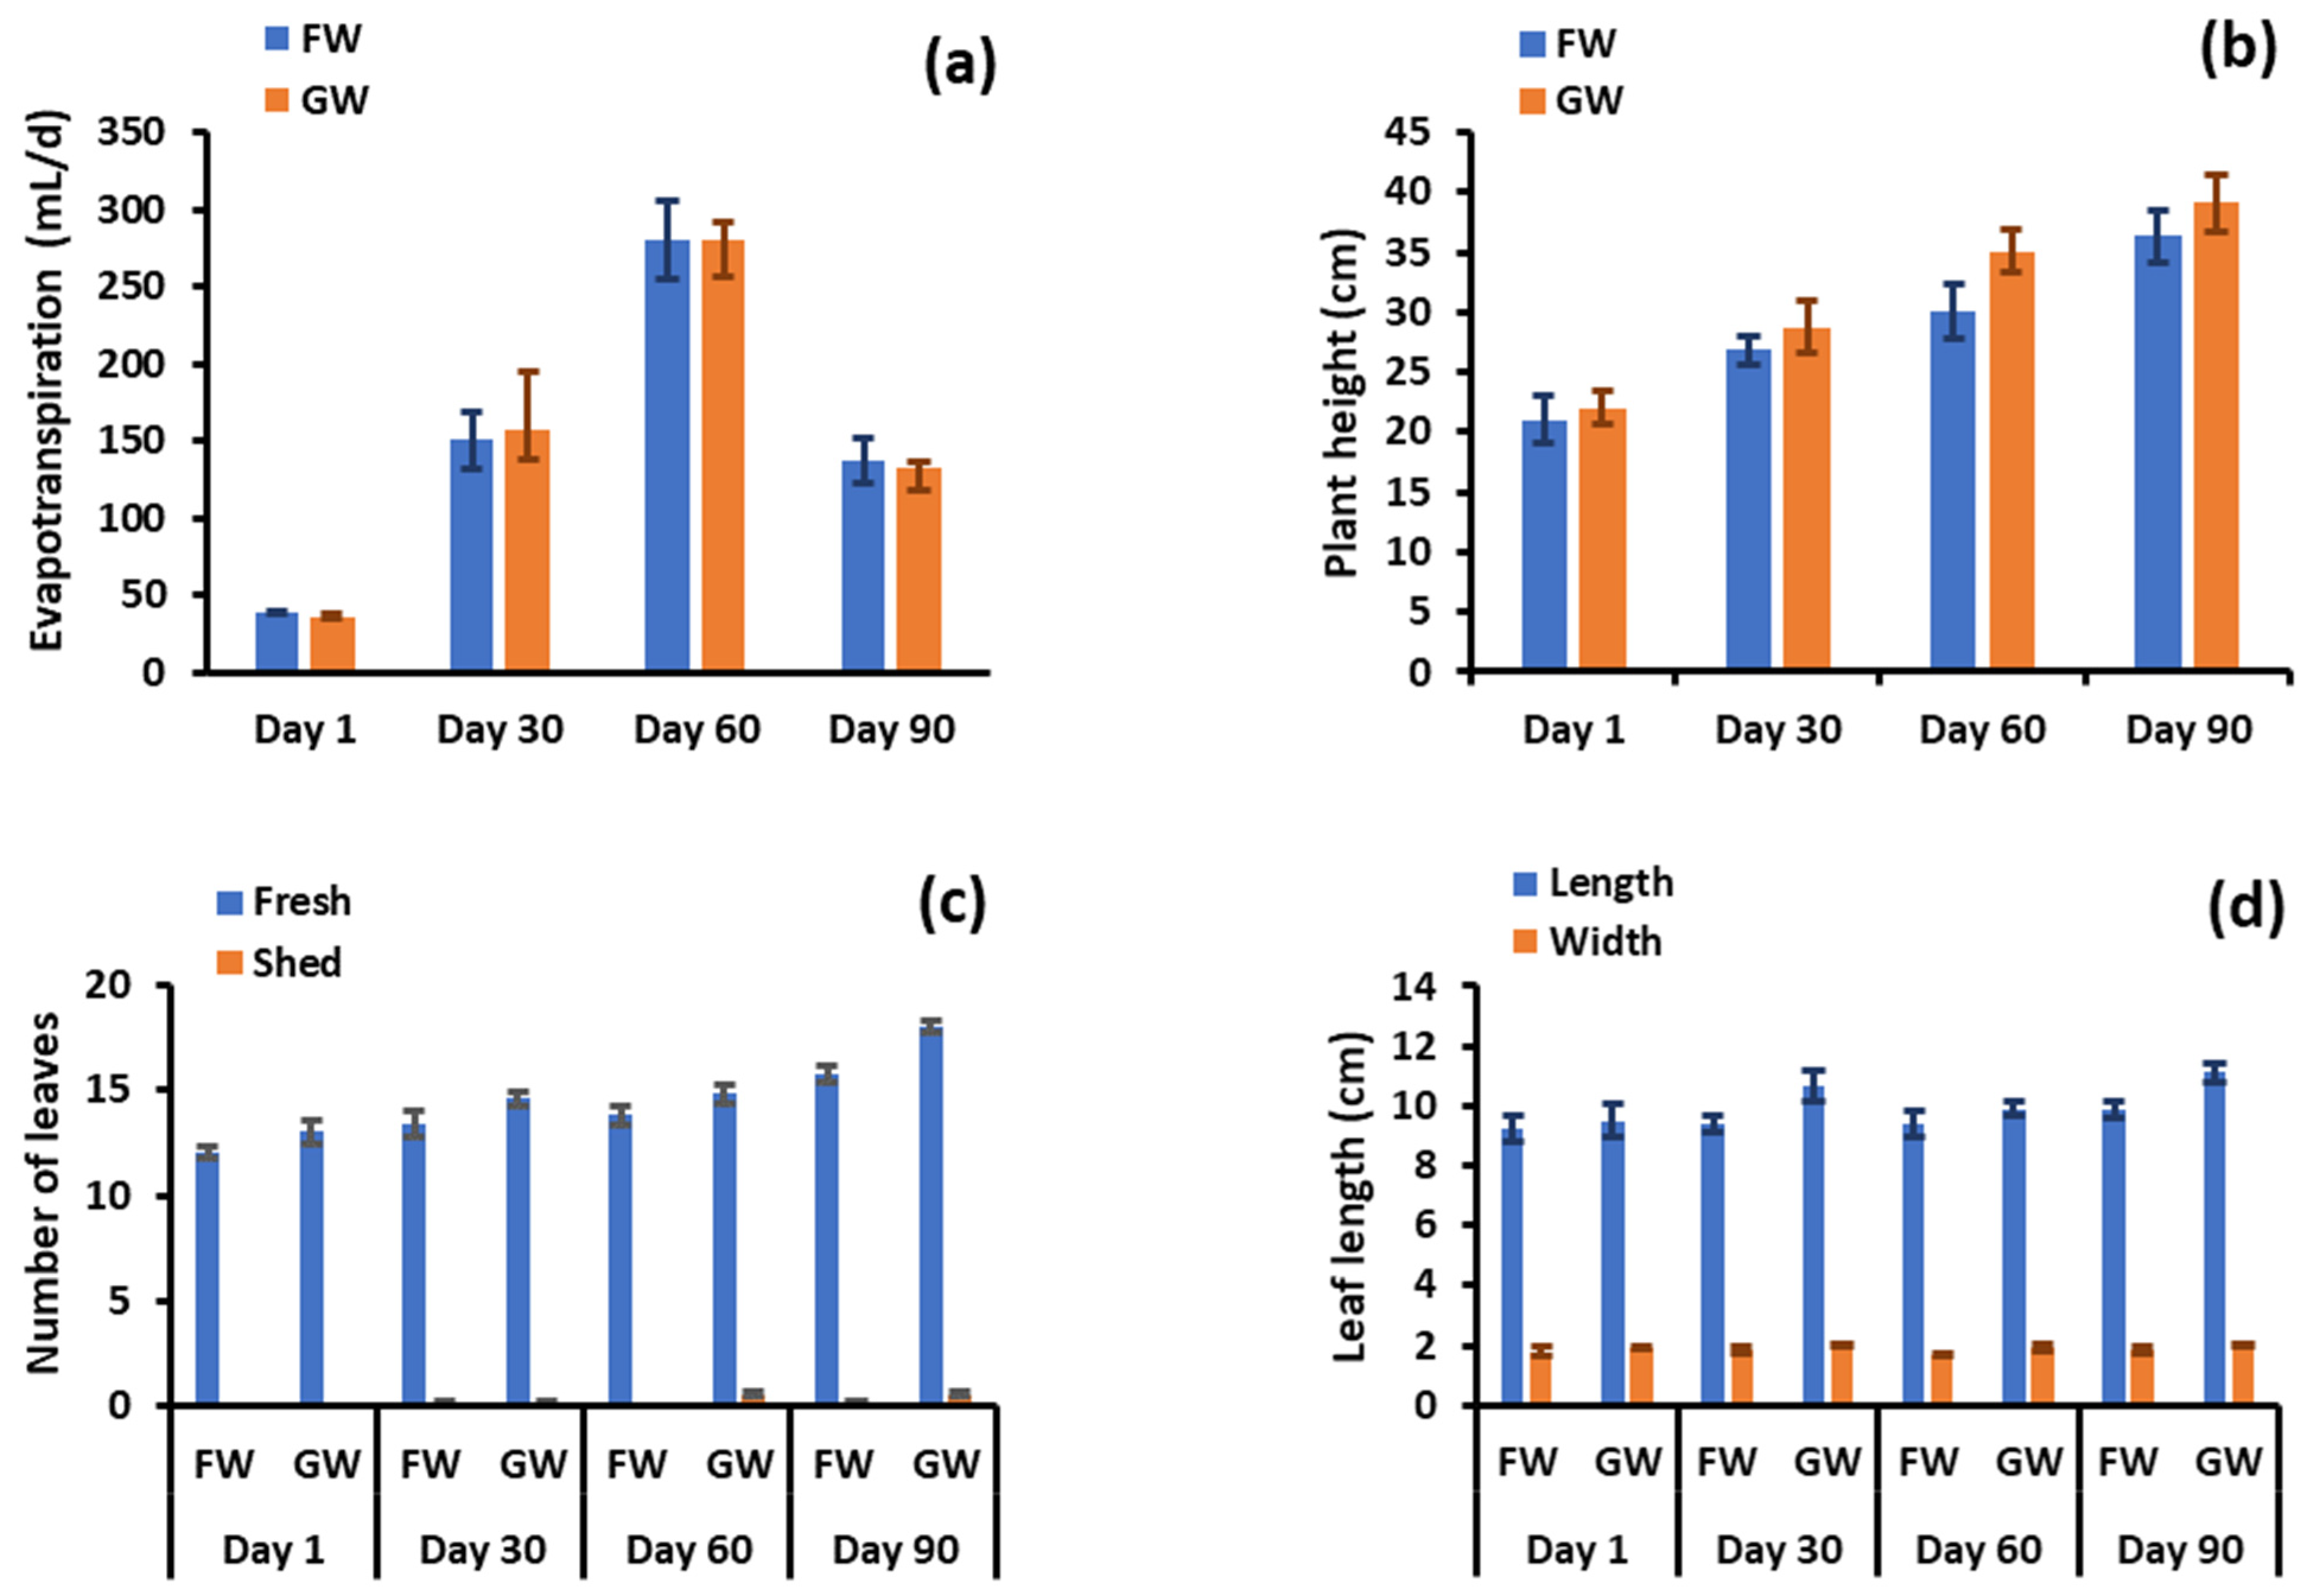
After 90 days of freshwater and greywater irrigation, each group of pots showed a similar degree of water loss by evapotranspiration (p = 0.809), as shown in Figure 2a. Greywater-irrigated pots showed greater shoot length in comparison to freshwater-irrigated pots (Figure 2b), with only one plant pair showing a greater shoot length for the freshwater-irrigated plant set. The average increase in shoot length for the greywater-irrigated plants was 15% over the freshwater irrigation and differences were statistically significant (p = 0.002). This statement contradicts the findings of the previous study, which suggests that both greywater and tap water had no major impact on the plants’ growth. This indicates that greywater can be a feasible substitute for irrigation in situations when there is a scarcity of freshwater [34]. However, in another study using greywater irrigation for food crops, a significant improvement in both plant development and agricultural productivity was found with greywater in comparison to the utilisation of tap water [36]. In all but one pair, greywater application increased the number of fresh leaves compared to the comparative freshwater supply, but the differences were not significant (p = 0.664). No significant variation was observed in the number of shed leaves (p = 0.095) between the two watering conditions (Figure 2c). However, some new sprouts from the main stems were observed in each group of planted pots under greywater irrigation, while no new sprouts were observed by irrigating with freshwater.

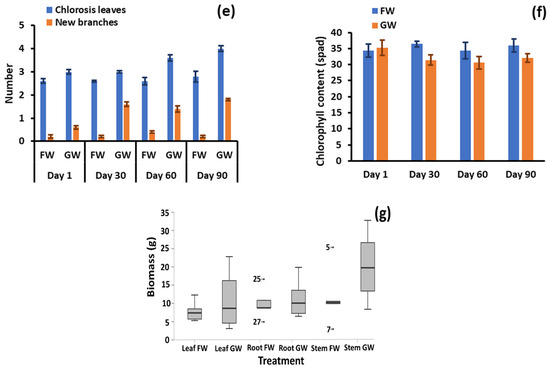
Figure 2.
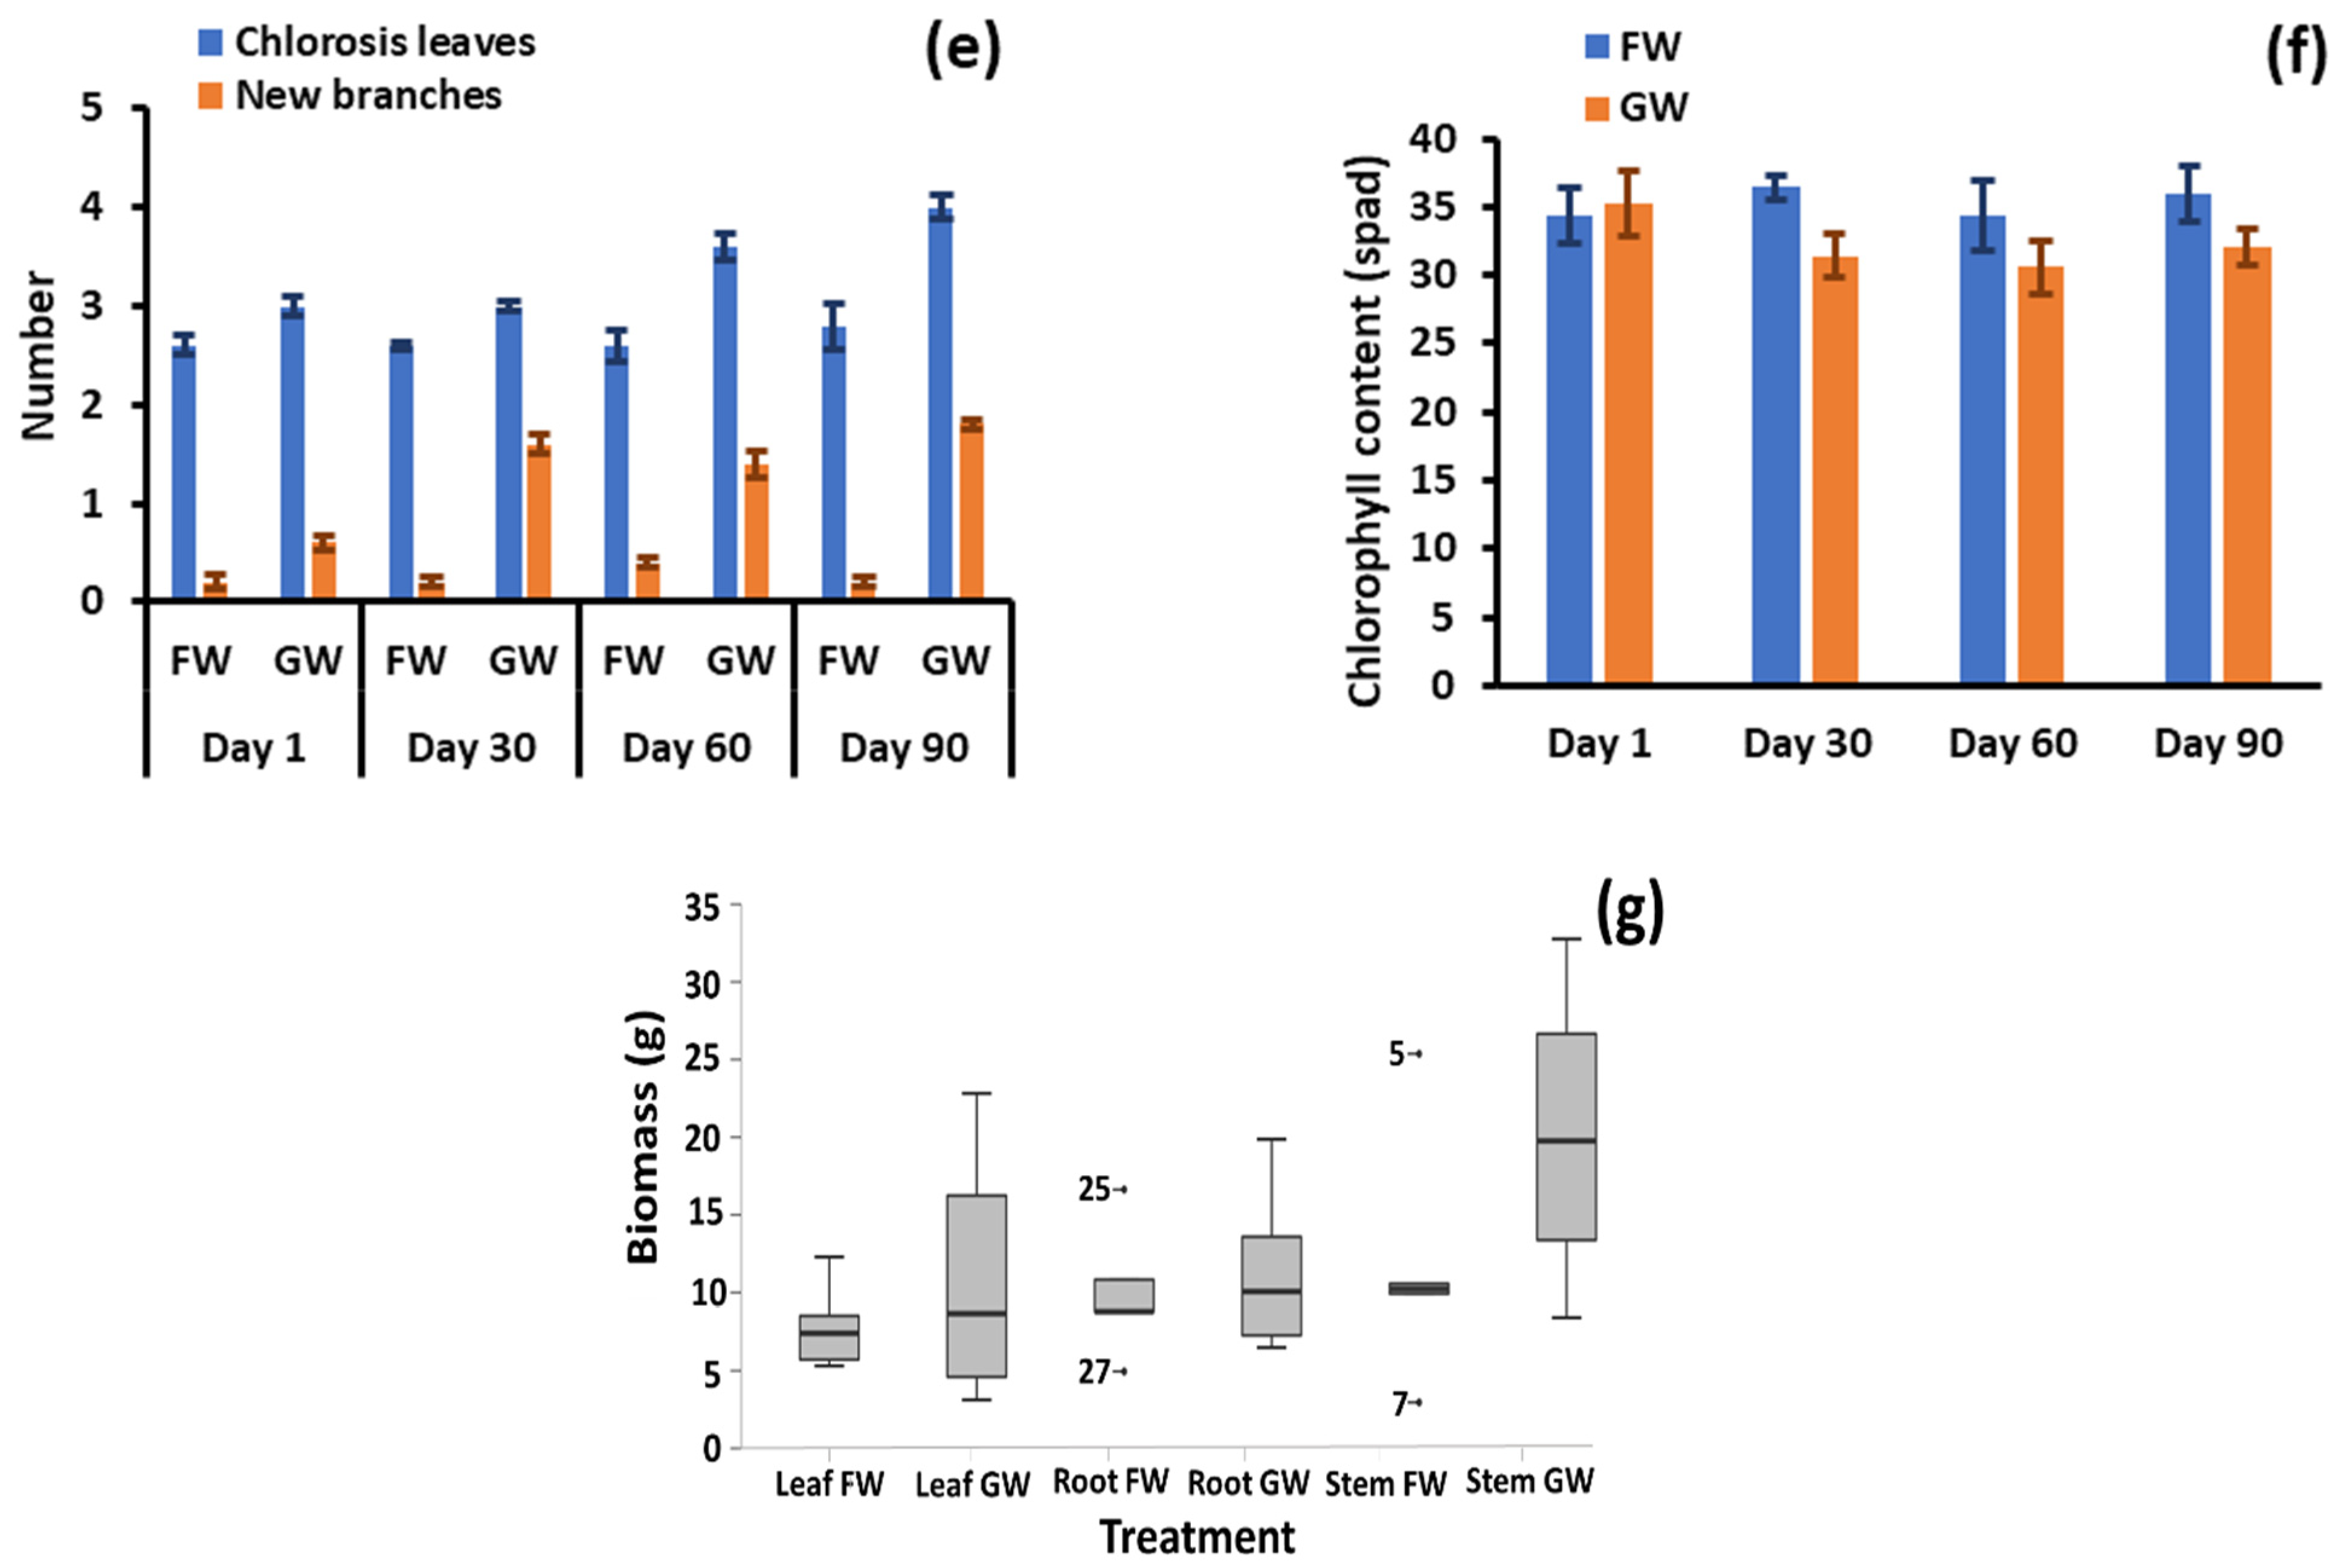
(a) Total water evapotranspiration by plant pairs, (b) shoot length, (c) number of leaves, (d) leaf length, (e) number of branches and chlorosis, (f) leaf chlorophyll content, and (g) stem, leaf, and root biomass after 90 days. GW: greywater FW: freshwater.
The reduced shoot growth, leaf development, and lack of flowering in freshwater-irrigated plants are likely due to a lack of nutrients necessary to develop plant physiology [37], since these nutrients are lacking in freshwater. However, freshwater plants may have obtained nutrients from the soil initially. In contrast, greywater fulfils the nutrient requirement. The dimensions for the largest leaf (length, width) per plant did not vary much along the experimental timeline. At the completion of the experiment the average largest leaf under greywater irrigation was 1.16 cm longer and 0.26 cm wider, respectively (p < 0.001). Most plants did not produce new branches during the observation period, with a maximum of one for a plant under freshwater irrigation and three under greywater irrigation. Differences were not significant (p = 0.130).
Chlorosis, shown in Figure 2e, was minor throughout the test, with marginal means of 1.53 and 0.143 leaves per plant for greywater and freshwater irrigation, respectively. The maximum number of leaves experiencing chlorosis was three for one greywater-irrigated plant. Although minor, the differences between irrigation conditions were significant (p = 0.003). It is therefore evident that some of the complex components constituting greywater may be detrimental to plant health. Further evidence of negative impacts was apparent with the leaf chlorophyll content, which was significantly greater (p < 0.001) at 36.1 spad for freshwater-irrigated pots compared to 32.3 spad for greywater (Figure 2f). The higher chlorophyll content in freshwater-irrigated plants may be due to stressors caused by the laundry ingredients present in greywater. This finding seems to differ from other studies reporting chlorophyll. In a study investigating the response of an ornamental plant (Calendula officinalis) and a vegetable (Capsicum frutescens) to irrigation by raw greywater, treated greywater and freshwater, Calendula officinalis showed no differences in chlorophyll content between water sources, while for Capsicum frutescens, treated greywater had the highest chlorophyll level, with raw greywater and freshwater irrigation showing no difference to each other [38]. In another study that only considered treated greywater and freshwater, the treated greywater exhibited higher chlorophyll content [39]. The former study indicates specific plants respond differently, and that there may be a balance between enhanced nutrient supply and inhibitory effects from other greywater components on plant metabolism.
The stem, leaf and root biomasses following harvesting were greater in the greywater-supplied pots than in freshwater-supplied pots (Figure 2g) by an average of 71%, 43% and 15%, respectively. For leaf and root biomass, the differences were not statistically significant (p = 0.358 and p = 0.327, respectively) due to large in-condition variance. However, the stem biomass was significantly different between the irrigation types (p = 0.024). In two of the plant pairs, the leaf biomass was higher in the freshwater-irrigated plants by nearly 13%, while all other pairs had higher leaf biomass in greywater-irrigated plants by an average of 40%. The root biomass varied by approximately 15% between the two treatments, indicating minimal stress to the plants in the soil. However, with the exception of chlorophyll and chlorosis, morphological parameters were consistently better for the greywater-irrigated plants than freshwater-irrigated plants. In particular, some plant samples for greywater irrigation had leaf and stem biomass content much higher than their freshwater counterparts. The similar to slightly improved growth of the greywater-irrigated plants is likely a result of the increased nutrient provision, which was further explored by investigating soil and biomass characteristics.
3.3. Soil Biofilm and Plant Biomass Imaging and Spectroscopy
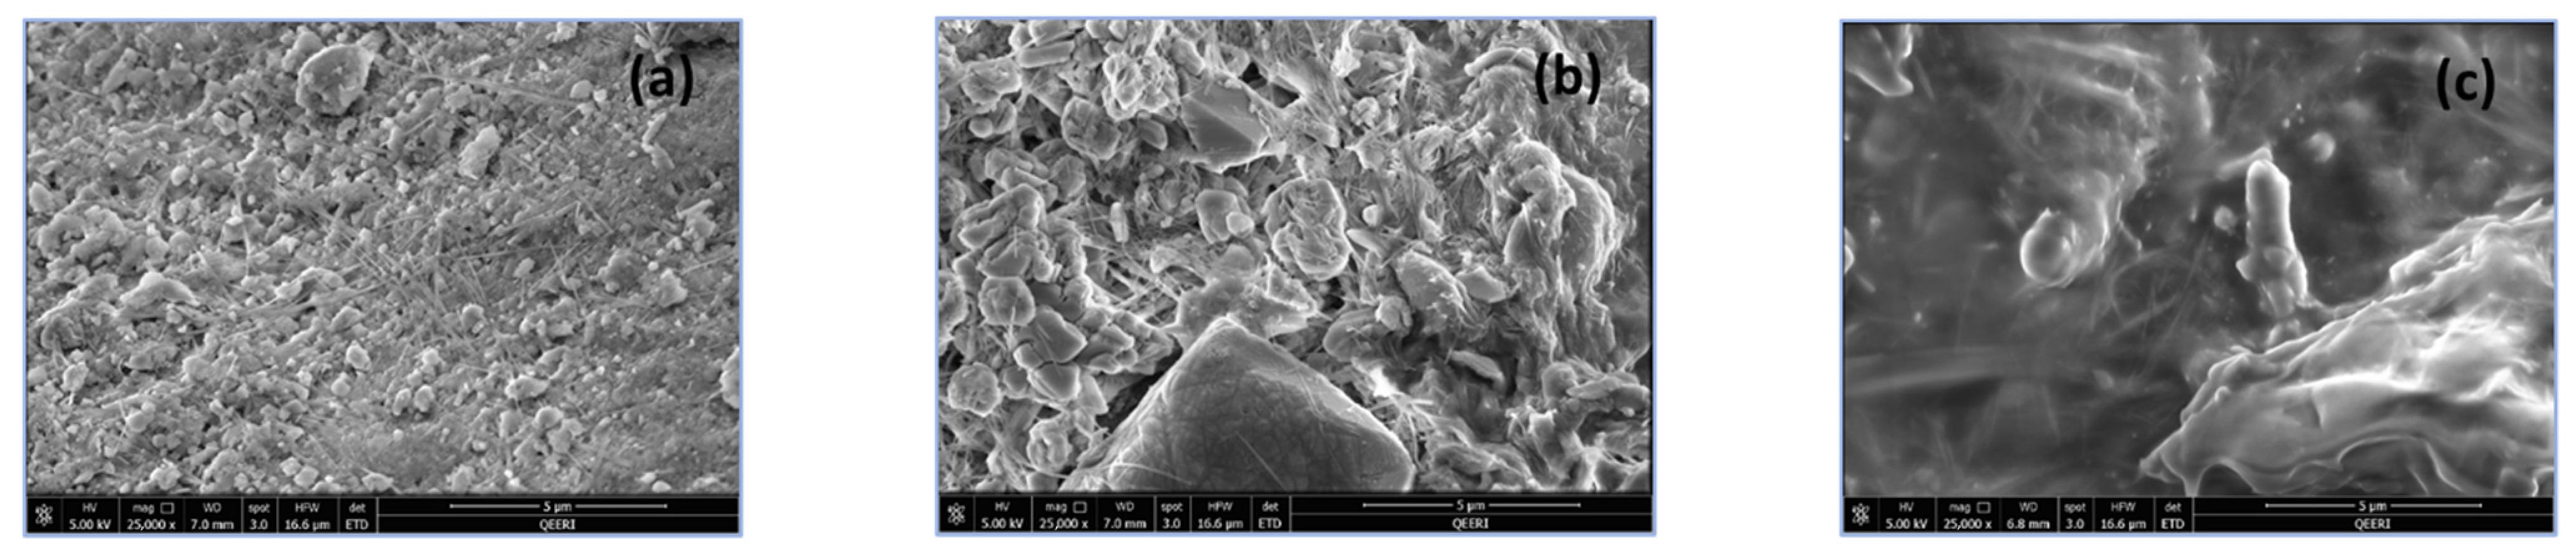
The SEM imaging before and after the water irrigation treatments indicated the differences between the soil and the plants receiving greywater and freshwater irrigation. The soil samples after SEM analysis are shown below in Figure 3. The unplanted soil before the irrigation and after oven drying at 105 °C has a compact structure with moderate roughness and aggregations, which may assist nutrient adsorption and growth of bacteria (Figure 3a). The freshwater-treated soil, which was only freeze-dried, also shows a similar structure to the original soil conditions, which indicates there is minimal biofilm observed around the freshwater soil (Figure 3b). In contrast, the greywater-irrigated soil, which was also freeze-dried, shows a smooth surface consistent with biofilm extracellular polymeric substances that would arise from high bacterial action and growth in the soil. The aggregates and fibres present in the original and freshwater-irrigated soil images can be seen faintly below this smooth covering (Figure 3c).
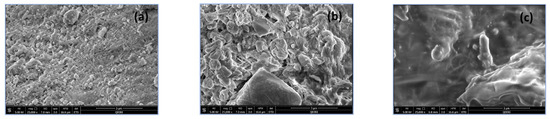
Figure 3.
SEM images of soil sample: (a) initial soil, (b) freshwater-irrigated soil, and (c) greywater-irrigated soil. Scale bar is 5 μm and horizontal frame width is 15.6 μm.
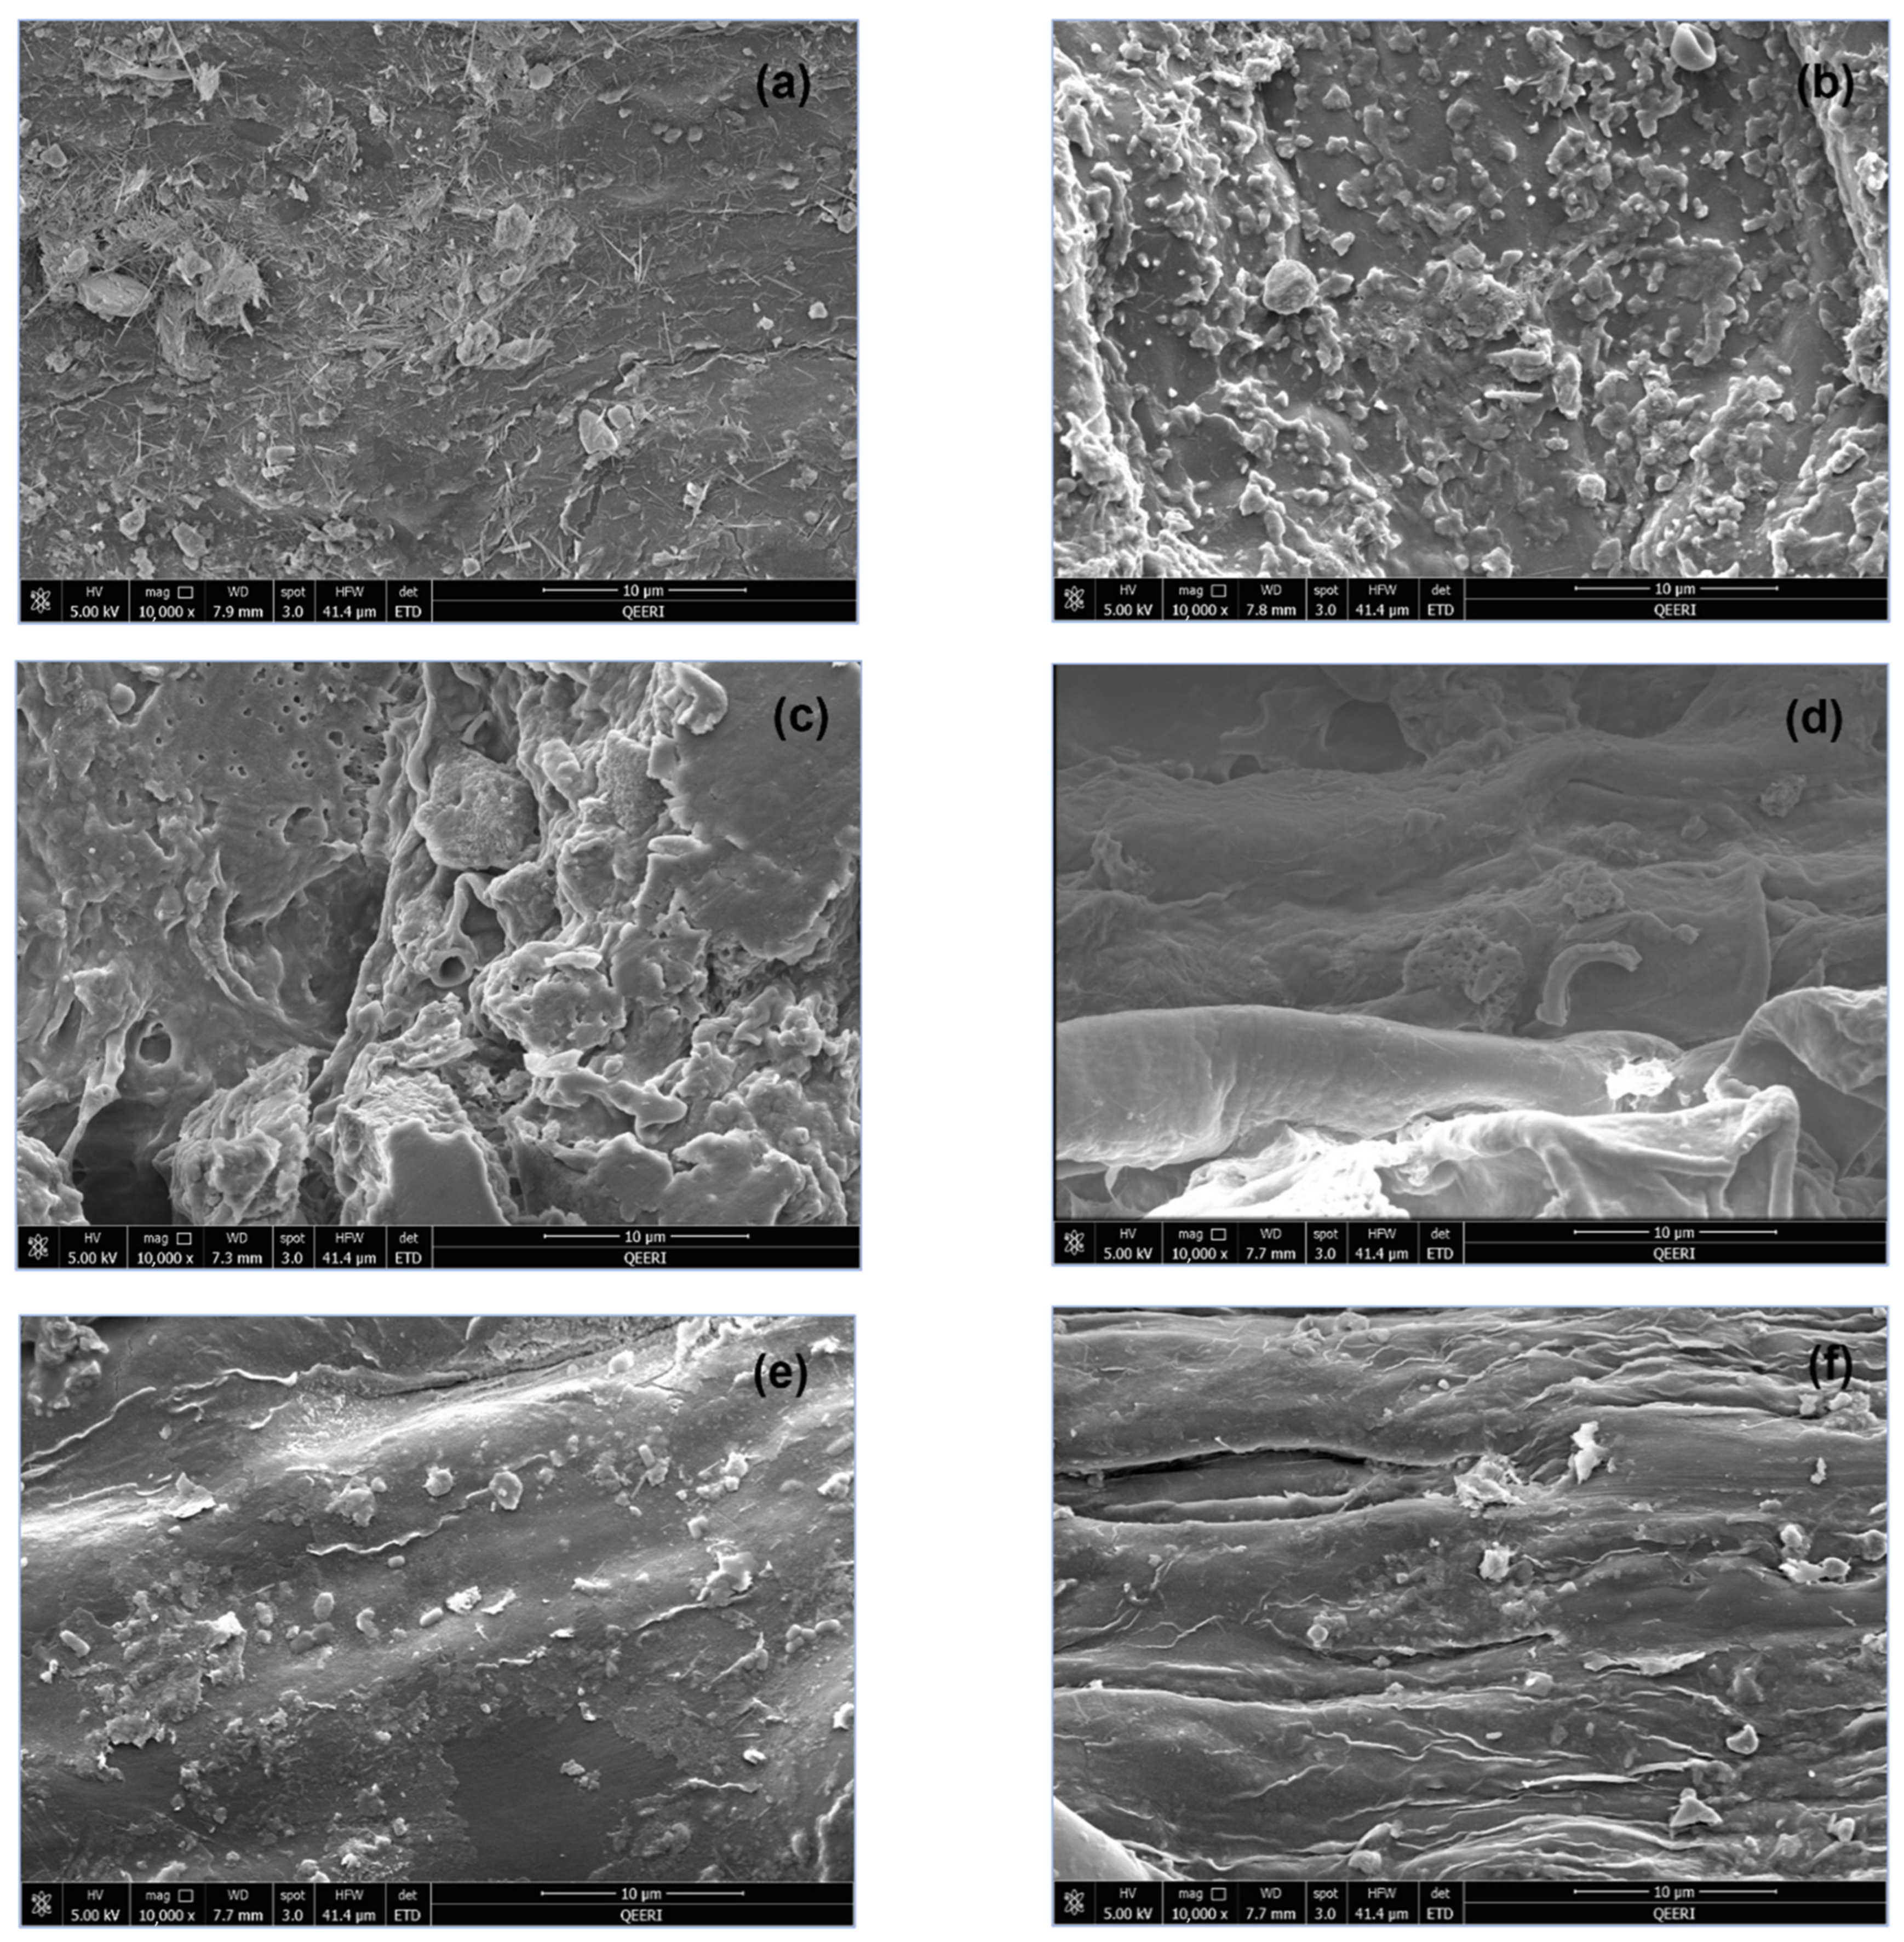
The SEM images of plant biomass are shown in Figure 4 for both freshwater-irrigated and greywater-irrigated plant parts. The SEM images of plant biomass showed little difference between the stem structures in both treatments as in Figure 4e,f. However, the root and leaf biomass have varying structures between the greywater and freshwater treatments. The leaf biomass of greywater-irrigated plants shows more deposition of minerals and nutrients, as evident by the increased number and size of structures on the leaf surface (Figure 4a,b). The root biomass was also different in morphology, with more openings and pores and a thicker, rougher surface. The smooth root structure apparent in the freshwater sample was not evident in the greywater sample due to the additional material present (Figure 4c,d). For the root differences, this is easily explained by the composition of the greywater coming into contact with the soil. Irrigation occurred as direct delivery of the water to the pot from a measuring cylinder, and it is therefore expected that depositions on the leaves are not a result of direct contact with greywater, but rather through plant excretory processes such as guttation. This is supported by the similarity of the stem SEM images between the irrigation conditions.
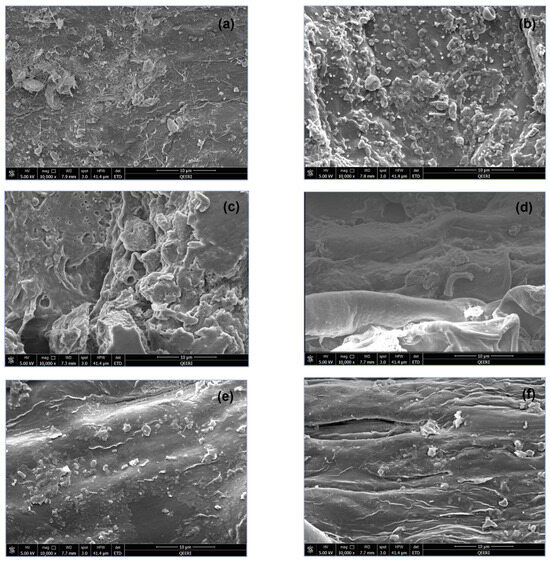
Figure 4.
SEM images of (a) freshwater leaf biomass, (b) greywater leaf biomass, (c) freshwater root biomass, (d) greywater root biomass, (e) freshwater stem biomass, and (f) greywater stem biomass.
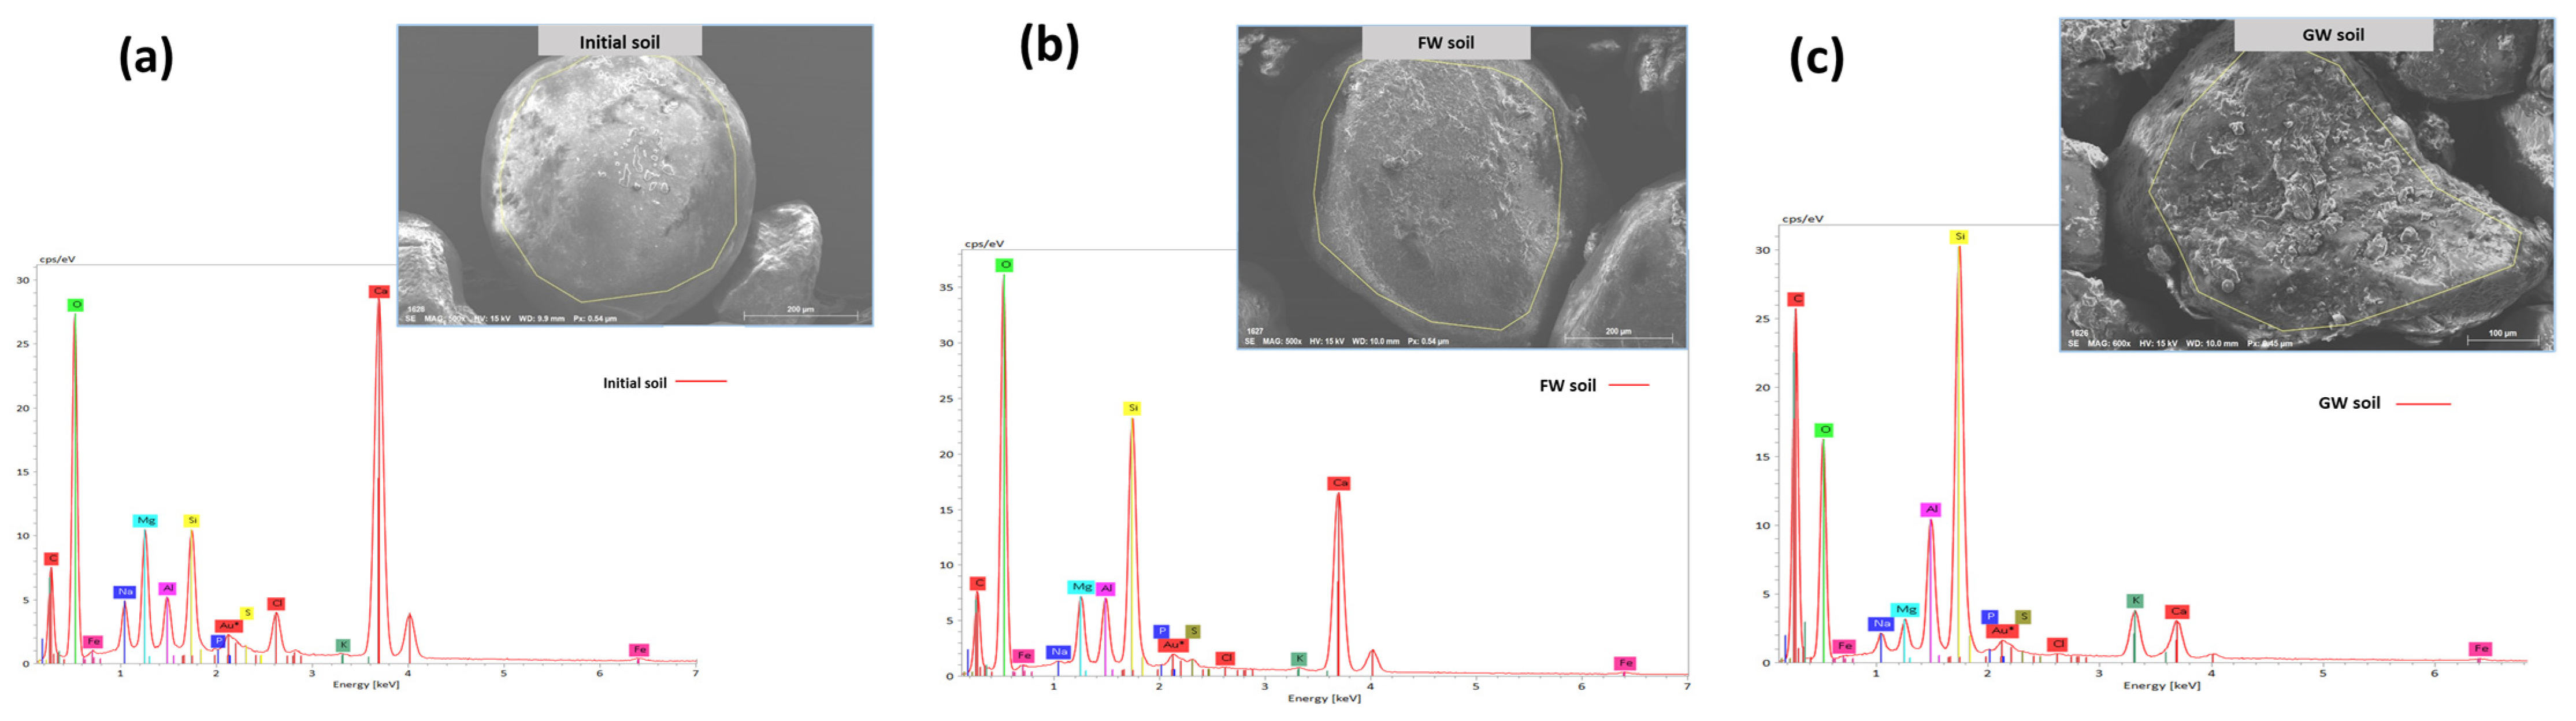
The EDS analysis was also performed along with SEM imaging to understand the elemental composition of the soil before and after the treatments. The EDS of the soil samples is shown in Figure 5. The EDS spectrometry shows that there is a smaller quantity of carbon and greater quantity of oxygen found in the original unplanted soil sample, indicating a lower proportion of organics (Figure 5a). This is supported by a high proportion of silicon (Si) and calcium (Ca), indicating the presence of inorganic compounds and consistent with the composition of sand with potting mix [40]. The freshwater sample had a similar structure to the original soil (Figure 5b). The greywater-irrigated sample had a greater amount of carbon and less oxygen present in comparison to the other samples, indicating a higher amount of organic matter present (Figure 5c). Nutrients like potassium (K) were high in greywater-irrigated soil, which are likely bound to the soil as the greywater percolates through the soil medium.
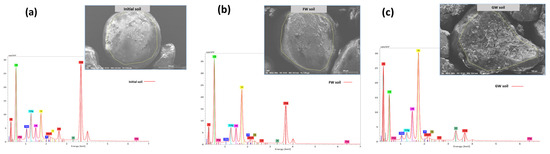
Figure 5.
EDS spectrometry of (a) mixed bare soil, (b) freshwater-irrigated soil, and (c) greywater-irrigated soil. Au* denotes the application of a gold coating during SEM analysis.
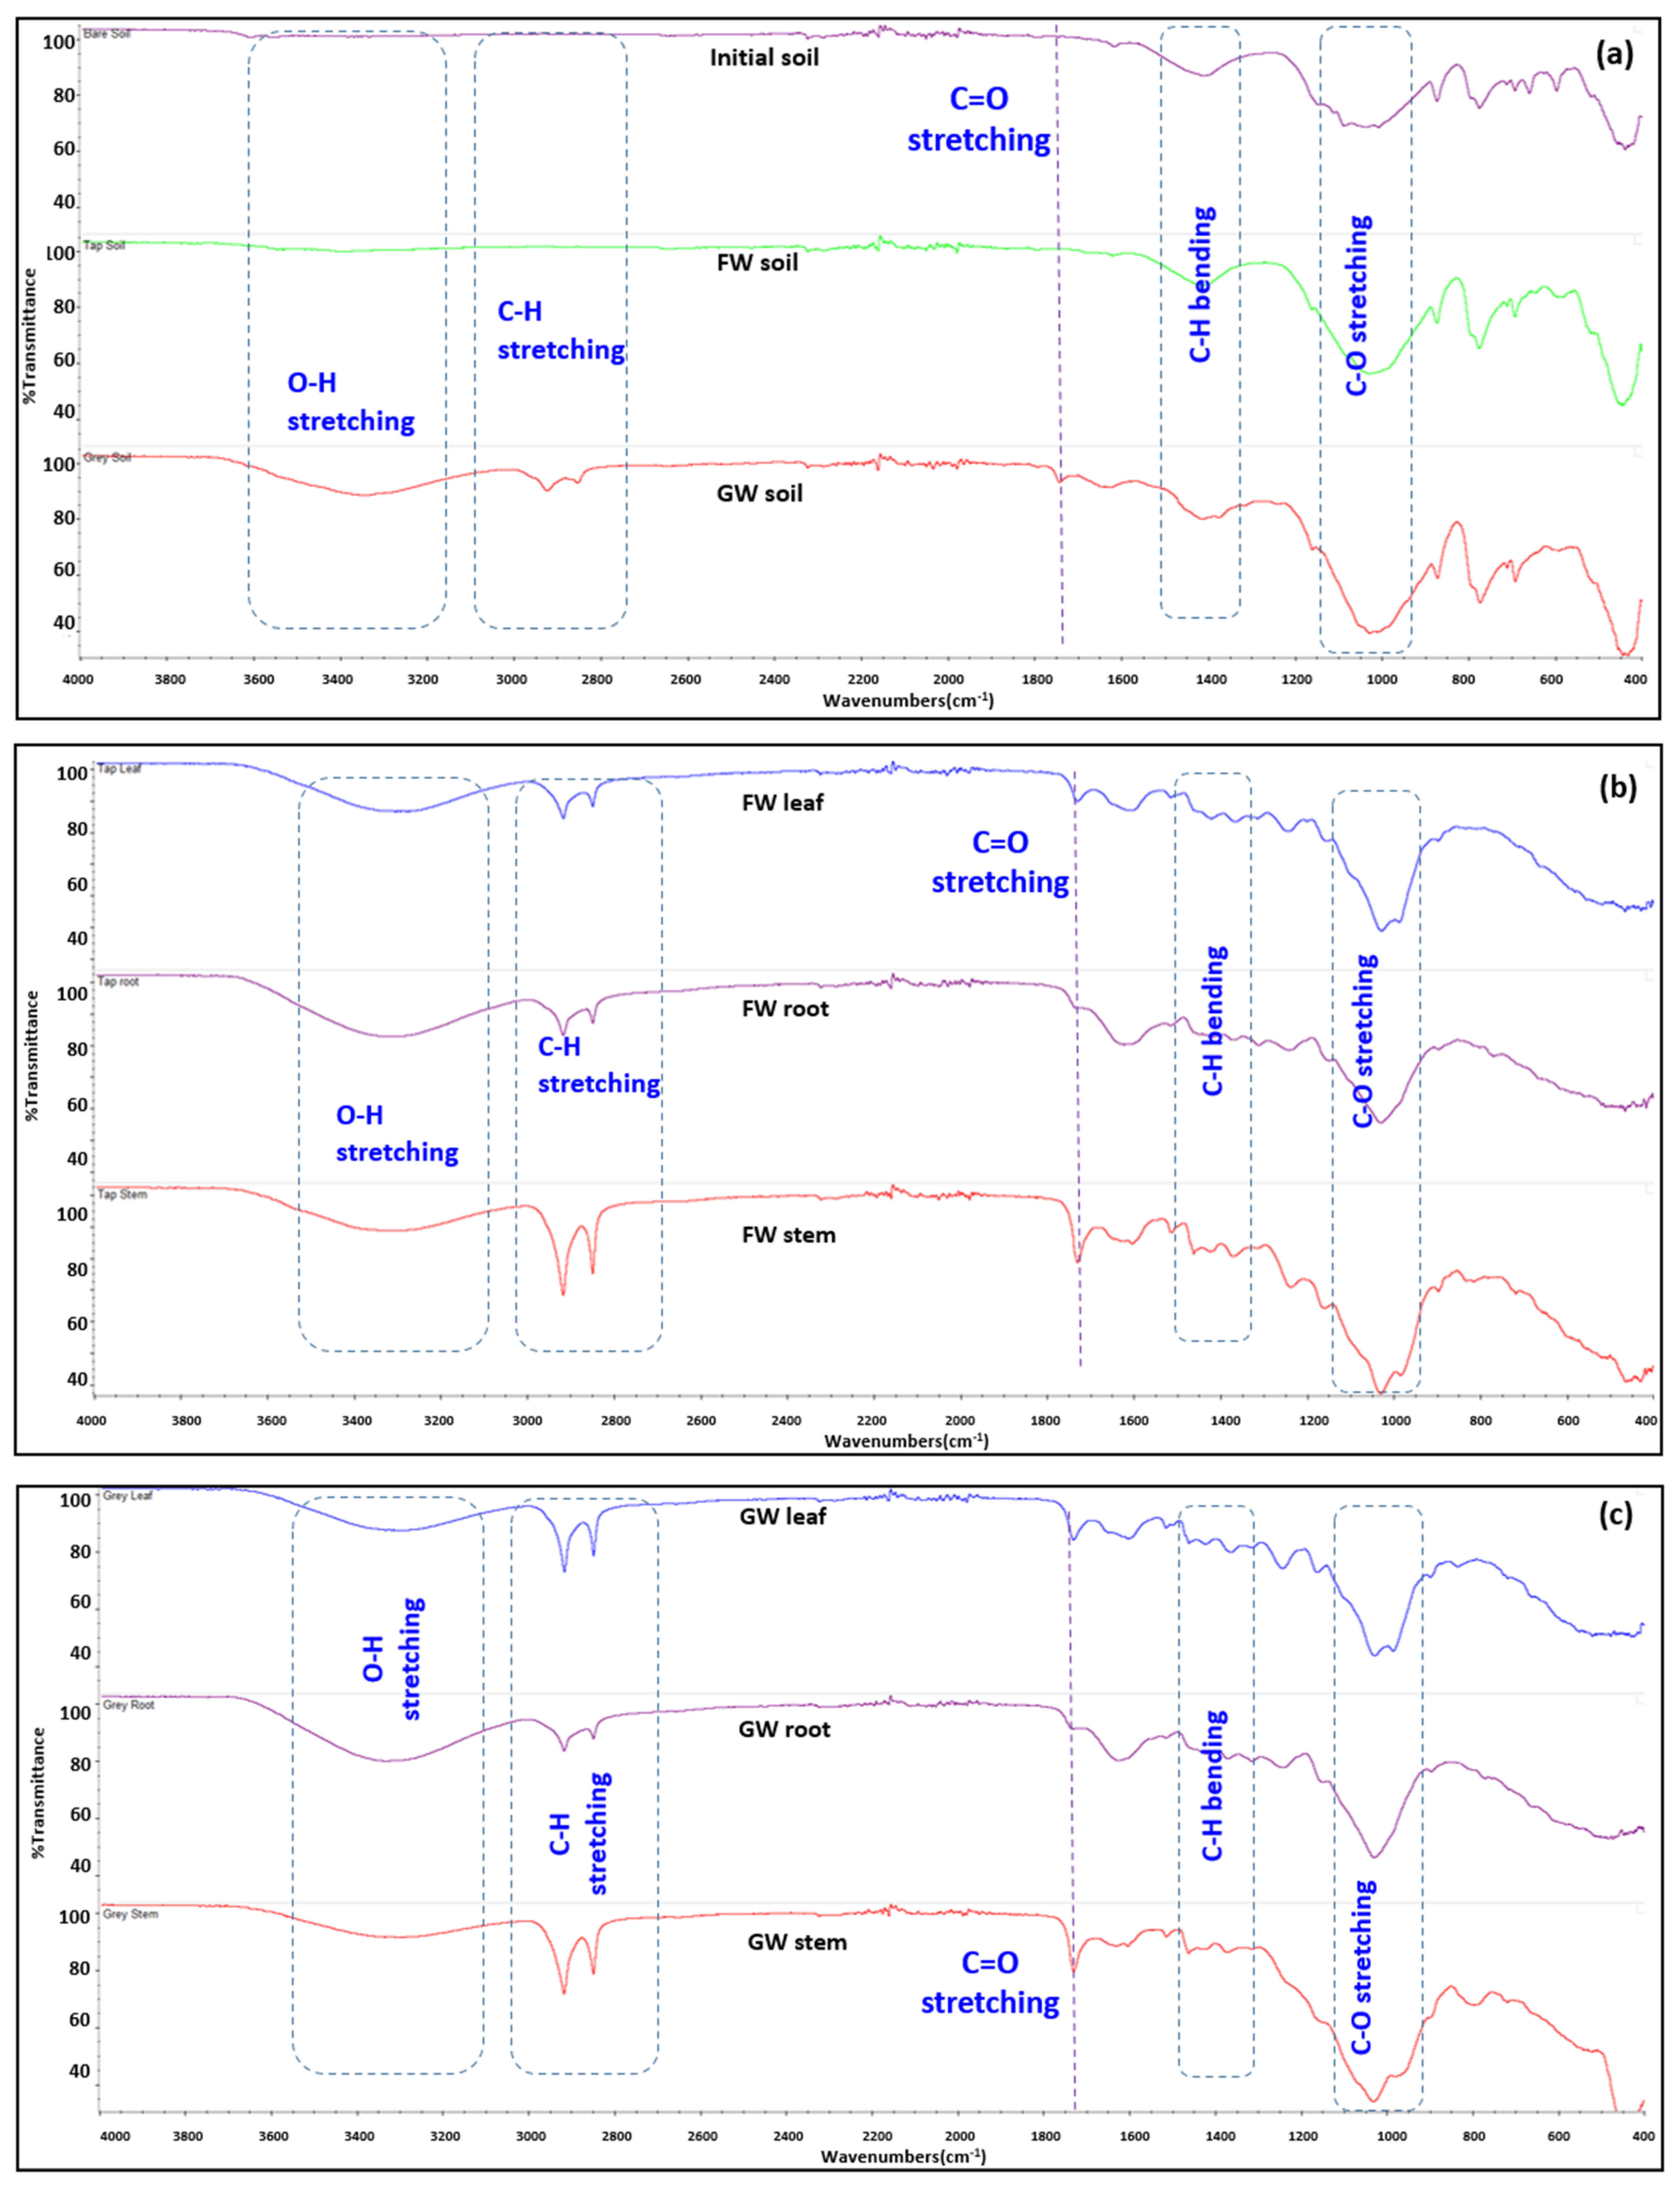
The FTIR imaging analysis for the soil samples is shown in Figure 6a. The original soil and freshwater-irrigated soil have almost similar appearances, while the greywater-irrigated soil showed clear differences in its FTIR spectra. The deep stretching of the greywater soil sample around wavenumbers 3200 to 3600 cm−1 indicates the presence of more alcohol and amine groups (O-H stretching and N-H stretching). This implies the presence of more organic matter present in the greywater-irrigated soil sample. The N-H stretching includes the organic compounds present in the form of amino acids, nucleic acids, and proteins, which most likely originate from microbial growth. The stretching vibration of aliphatic hydrocarbons is commonly linked to the FTIR spectra of soil samples at 2800 to 3100 cm−1 [41]. A doublet peak for greywater-irrigated soil at 2860 and 2940 cm−1 is closely associated with aldehyde C-H stretching [42]. It is possibly due to the breakdown of certain products like surfactants into the aldehydes and byproducts in the greywater [43]. The C-H bending around 2750 to 3100 cm−1 indicates the presence of long-chain aliphatic methyl groups [44] as shown in Figure 6. The C-O stretching around 900 to 1100 cm−1 is associated with the presence of more aliphatic alcohols [45]. It is strong in all three types of soil, with more pronounced stretching in the greywater-irrigated soil.
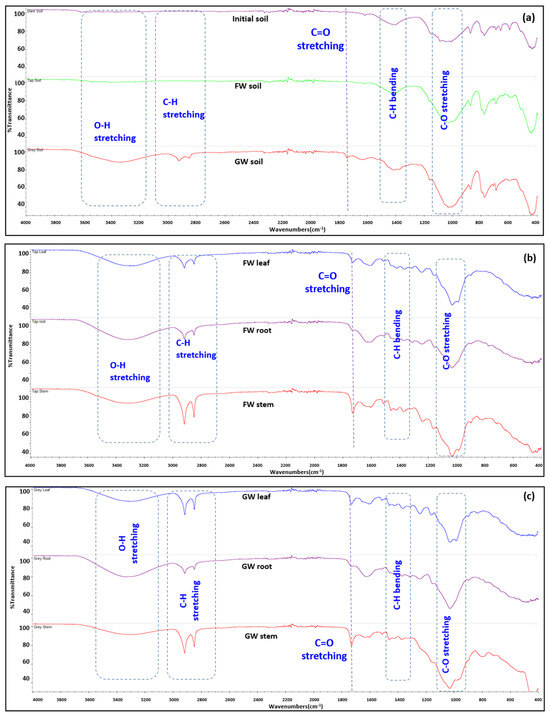
Figure 6.
The FTIR spectra of (a) the original unplanted mixed soil (purple), freshwater-irrigated soil (green), and greywater-irrigated soil (red). (b) Freshwater-irrigated plant biomass and (c) greywater-irrigated plant biomass (leaf = blue, root = purple, stem = red). FW: freshwater; GW: greywater.
Figure 6b,c shows the FTIR of plant biomass in freshwater and greywater treatment. The FTIR images show little difference between the plant biomass samples from both treatments as in Figure 6b,c, indicating these changes occurred in the soil, consistent with adsorption of chemicals within the greywater and/or growth of biofilm in the soil.
3.4. Elemental Analysis for Plant Biomass and Soil
Table 4 presents the elemental (CHNS) analysis of plant biomass from different plant parts. There was not a significant difference observed in the levels of carbon and hydrogen across the various irrigation regimes. The carbon and hydrogen content of plant biomass exhibited the highest values at 42.4 ± 1.07% and 5.7 ± 0.16% for greywater leaves and roots, respectively, which is consistent with the biomass composition of hardy perennial shrub plant species [46]. Plants predominantly acquire carbon and hydrogen through the process of photosynthesis from the atmosphere, independent of their water source. Nevertheless, it is plausible that there may be consequential impacts. Nitrogen content was consistently 0.6–0.8% greater in the greywater-irrigated biomass fractions than in the corresponding freshwater-irrigated biomass fractions. Similarly, sulphur content was also consistently higher in the greywater-irrigated biomass fractions, though differences were minimal. It is possible these higher values for the greywater-irrigated plants are a result of surface deposition of greywater components, as suggested by the SEM analysis. Shampoo and other detergents contain sulphates. As a result, plants that are irrigated with greywater may exhibit distinct variations in their sulphur composition compared to those that are irrigated with freshwater. The sulphur concentrations observed in freshwater irrigation align with previous studies indicating that plant biomass with low lignin content typically displays such levels of sulphur content [47]. The leaves necessitate nitrogen and sulphur for the synthesis of chlorophyll and for metabolic processes, respectively [48,49]. Of note, nitrogen and sulphur were not detected in the freshwater-irrigated plant stems, suggesting that the stem primarily functions as a transport organ.
Table 4.
Elemental analysis of various plant biomass components as well as soil for both greywater and freshwater irrigation.
Correlation analysis of leaf nitrogen content and leaf chlorosis showed a strong possible interaction. For both irrigation regimes, a significant positive correlation between nitrogen concentration in the leaves and leaf chlorosis was found (ρ = 0.884, p < 0.001). Excessive nitrogen concentration has previously been linked with chlorosis [50] and is consistent with the differences observed in chlorosis between the two irrigation treatments. In comparison to freshwater, greywater has a greater abundance of organic nitrogen molecules, such as urea and amino acids, which could result in overfertilisation.
The nutrient composition in the plant biomass and soil was also analysed, as shown in Table 4. The phosphorus concentration in the plant biomass shows a high build-up of phosphorus in the greywater-irrigated plants, as phosphorus is present in a number of ingredients of greywater. Phosphorus concentrations in the greywater-irrigated biomass ranged between 1.7 and 4.7 times that of the freshwater-irrigated biomass. In this study, the most notable component containing phosphorus from the ingredient list was toothpaste. The phosphorus is accumulated predominantly in the root biomass, followed by the leaf and stem.
The salt content in the plant biomass and soil determined by ICP-OES is also shown in Table 4. A high accumulation of K, boron (B), and magnesium (Mg) was evident in the greywater-irrigated plant biomass. Of note is B, which is an order of magnitude higher in all biomass components and soil. B is an essential micronutrient, but at higher concentrations can be detrimental to plants. The concentrations observed within the soil and plants for greywater irrigation fall within expected ranges for healthy plants, while freshwater-irrigated plants could be considered deficient [51]. However, other minerals like aluminium (Al), sodium (Na), barium (Ba), manganese (Mn), and zinc (Zn) have similar trends in both irrigation conditions. Notably, Na was higher in freshwater-irrigated leaves, despite the prevalent use of sodium laureth and lauryl sulfates as surfactants in household products. The soil in both treatments has fewer minerals than in the plant biomass except for the Al and iron (Fe). The minerals like K, Fe, Mg, Mn, and B are essential macro- and micronutrients that plants require for a water balance, cell division, chlorophyll production, and enzymatic actions, while Al is detrimental to plants.
4. Conclusions
Green walls offer multiple benefits to urban buildings, but a major concern with their implementation in dry climates and water-scarce areas is their high water demand. This study shows that untreated greywater is a suitable alternative to freshwater irrigation, which, overall, shows a positive impact on the growth of plants including both height and dry biomass content. Greywater-supplied soil and plant biomass contains essential nutrients such as nitrogen, phosphate, and potassium. These nutrients reduce the necessity for supplementary fertilisation. In addition to fertiliser cost savings, the utilisation of this approach also contributes to the mitigation of environmental consequences linked to the production and application of chemical fertilisers. However, some negative effects were also observed, such as an increase in chlorosis-affected leaves and reduced leaf chlorophyll content. A positive correlation was obtained for the nitrogen content and the chlorosis effect, although it is unclear if nitrogen or other greywater components are the cause of chlorosis. In any case, such impacts could potentially be managed through the partial use of greywater for irrigation. Overall, this short-term study indicates Ruellia tuberosa is a promising plant candidate under greywater irrigation, but further testing is necessary to determine long-term resilience and contribution to treatment through nutrient and organic uptake. Whether or not the plant provides complete treatment of the greywater, the system can provide partial treatment prior to sewer discharge or further onsite treatment. The application of greywater also provides increased growth, as well as a reduction in fertiliser and freshwater consumption. As such, this opens the door for driving urban production centres of biomass for energy production while avoiding energy-water nexus issues of such an approach if serviced by freshwater irrigation.
The extended utilisation of greywater for irrigation entails an intricate interaction between soil quality, plant well-being, and wider environmental and economic consequences. On one side, it has the potential to augment the nutrient content of the soil, so promoting the development of better soil conditions over a period. However, prolonged application of greywater may also result in increased soil salinity. Concerning the health of plants, greywater might enhance development, but it may also have negative consequences, such as decreased chlorophyll levels and leaf chlorosis caused by the presence of detergents. From an environmental perspective, the utilisation of greywater encourages sustainable water management and conservation, which is particularly important in dry regions. However, it requires careful and attentive management to prevent any ecological pollution. From an economic standpoint, it provides cost savings on water and fertiliser expenses, although this is counterbalanced by the requirement for greywater treatment and management. The complex situation highlights the need to thoroughly assess the composition of greywater and its overall impact to guarantee its sustainable and lasting use.
Future research should focus on additional plant species that are compatible with greywater treatment within relevant geographical contexts. Future studies should also focus on long-term impacts, such as soil salinisation, and various plant and media combinations that could increase the efficacy of greywater treatment.
Author Contributions
Conceptualisation, H.R.M. and S.M.A.; methodology, S.M.A., H.R.M. and S.P.; formal analysis, S.M.A.; data curation, S.M.A.; writing—original draft preparation, S.M.A.; writing—review and editing, H.R.M., G.M., S.P., J.S. and S.M.A.; supervision, H.R.M., G.M. and J.S.; funding acquisition, H.R.M. and J.S.; project administration, H.R.M. and J.S. All authors have read and agreed to the published version of the manuscript.
Funding
The authors would like to acknowledge funding support from the Qatar National Research Fund (grant NPRP12S-0226-190160). The authors would also like to thank Qatar National Library (QNL) for funding the open access publication of this article.
Institutional Review Board Statement
No ethical approval was required for this study.
Informed Consent Statement
Not applicable.
Data Availability Statement
The research data can be provided upon request to the corresponding author.
Acknowledgments
The authors would also like to thank the Core Labs of the Qatar Environment and Energy Research Institute (QEERI), Hamad bin Khalifa University for aiding and supporting with the imaging and spectroscopy. The contents of this article are solely the responsibility of author(s).
Conflicts of Interest
The authors have no relevant financial or nonfinancial interests to disclose.
References
- Al-Hamaiedeh, H.; Bino, M. Effect of Treated Grey Water Reuse in Irrigation on Soil and Plants. Desalination 2010, 256, 115–119. [Google Scholar] [CrossRef]
- Mohamed, R.M.S.R.; Kassim, A.H.M.; Anda, M.; Dallas, S. A Monitoring of Environmental Effects from Household Greywater Reuse for Garden Irrigation. Environ. Monit. Assess. 2013, 185, 8473–8488. [Google Scholar] [CrossRef] [PubMed]
- Hamouri, E.B.; Douch, A.A. Greywater Treatment and Recycling for Toilet Flushing: Comparison of Low and High Tech Treatment Approaches. Water Pract. Technol. 2008, 3, wpt2008041. [Google Scholar] [CrossRef]
- Friedler, E. Quality of Individual Domestic Greywater Streams and Its Implication for On-Site Treatment and Reuse Possibilities. Environ. Technol. 2004, 25, 997–1008. [Google Scholar] [CrossRef] [PubMed]
- Aboelata, A. Assessment of Green Roof Benefits on Buildings’ Energy-Saving by Cooling Outdoor Spaces in Different Urban Densities in Arid Cities. Energy 2021, 219, 119514. [Google Scholar] [CrossRef]
- Fang, Y.K.; Wang, H.C.; Fang, P.H.; Liang, B.; Zheng, K.; Sun, Q.; Li, X.Q.; Zeng, R.; Wang, A.J. Life Cycle Assessment of Integrated Bioelectrochemical-Constructed Wetland System: Environmental Sustainability and Economic Feasibility Evaluation. Resour. Conserv. Recycl. 2023, 189, 106740. [Google Scholar] [CrossRef]
- Lee, L.S.H.; Jim, C.Y. Energy Benefits of Green-Wall Shading Based on Novel-Accurate Apportionment of Short-Wave Radiation Components. Appl. Energy 2019, 238, 1506–1518. [Google Scholar] [CrossRef]
- Rahman, K.Z.; Al Saadi, S.; Al Rawahi, M.; Knappe, J.; van Afferden, M.; Moeller, L.; Bernhard, K.; Müller, R.A. A Multi-Functional Nature-Based Solution (NBS) for Greywater Treatment and Reuse at the Same Plot. Ecol. Eng. 2023, 191, 106952. [Google Scholar] [CrossRef]
- Boano, F.; Caruso, A.; Costamagna, E.; Ridolfi, L.; Fiore, S.; Demichelis, F.; Galvão, A.; Pisoeiro, J.; Rizzo, A.; Masi, F. A Review of Nature-Based Solutions for Greywater Treatment: Applications, Hydraulic Design, and Environmental Benefits. Sci. Total Environ. 2020, 711, 134731. [Google Scholar] [CrossRef]
- Brix, H.; Arias, C.A.; Del Bubba, M. Media Selection for Sustainable Phosphorus Removal in Subsurface Flow Constructed Wetlands. Water Sci. Technol. 2001, 44, 47–54. [Google Scholar] [CrossRef]
- US EPA. Guidance for Design and Construction of a Subsurface Flow Constructed Wetland; US EPA: Washington, DC, USA, 1993. [Google Scholar]
- Scholz, M.; Harrington, R.; Carroll, P.; Mustafa, A. The integrated constructed wetlands (ICW) concept. Wetlands 2007, 27, 337–354. [Google Scholar] [CrossRef]
- Mankiewicz, P.; Borsuk, A.; Ciardullo, C.; Hénaff, E.; Dyson, A. Developing Design Criteria for Active Green Wall Bioremediation Performance: Growth Media Selection Shapes Plant Physiology, Water and Air Flow Patterns. Energy Build. 2022, 260, 111913. [Google Scholar] [CrossRef]
- Pérez-Urrestarazu, L.; Fernández-Cañero, R.; Franco-Salas, A.; Egea, G. Vertical Greening Systems and Sustainable Cities. J. Urban Technol. 2016, 22, 65–85. [Google Scholar] [CrossRef]
- Prasad, R.; Sharma, D.; Yadav, K.D.; Ibrahim, H. Preliminary Study on Greywater Treatment Using Water Hyacinth. Appl. Water Sci. 2021, 11, 88. [Google Scholar] [CrossRef]
- Cameron, R.W.F.; Taylor, J.E.; Emmett, M.R. What’s “cool” in the World of Green Façades? How Plant Choice Influences the Cooling Properties of Green Walls. Build. Environ. 2014, 73, 198–207. [Google Scholar] [CrossRef]
- Vuppaladadiyam, A.K.; Merayo, N.; Prinsen, P.; Luque, R.; Blanco, A.; Zhao, M. A Review on Greywater Reuse: Quality, Risks, Barriers and Global Scenarios. Rev. Environ. Sci. Biotechnol. 2019, 18, 77–99. [Google Scholar] [CrossRef]
- Masi, F.; Bresciani, R.; Rizzo, A.; Edathoot, A.; Patwardhan, N.; Panse, D.; Langergraber, G. Green Walls for Greywater Treatment and Recycling in Dense Urban Areas: A Case-Study in Pune. J. Water Sanit. Hyg. Dev. 2016, 6, 342–347. [Google Scholar] [CrossRef]
- Pradhan, S.; Al-Ghamdi, S.G.; Mackey, H.R. Greywater Treatment by Ornamental Plants and Media for an Integrated Green Wall System. Int. Biodeterior. Biodegrad. 2019, 145, 104792. [Google Scholar] [CrossRef]
- Prodanovic, V.; Mccarthy, D.; Hatt, B.; Deletic, A. Designing Green Walls for Greywater Treatment: The Role of Plants and Operational Factors on Nutrient Removal. Ecol. Eng. 2019, 130, 184–195. [Google Scholar] [CrossRef]
- Gong, L.; Ran, Q.; He, G.; Tiyip, T. A Soil Quality Assessment under Different Land Use Types in Keriya River Basin, Southern Xinjiang, China. Soil Tillage Res. 2015, 146, 223–229. [Google Scholar] [CrossRef]
- Hong, M.; Zhang, L.; Tan, Z.; Huang, Q. Effect Mechanism of Biochar’s Zeta Potential on Farmland Soil’s Cadmium Immobilization. Environ. Sci. Pollut. Res. 2019, 26, 19738–19748. [Google Scholar] [CrossRef] [PubMed]
- Matko, V. Porosity Determination by Using Two Stochastic Signals. Sens. Actuators Phys. 2004, 112, 320–327. [Google Scholar] [CrossRef]
- Toková, L.; Igaz, D.; Horák, J.; Aydin, E. Effect of Biochar Application and Re-application on Soil Bulk Density, Porosity, Saturated Hydraulic Conductivity, Water Content and Soil Water Availability in a Silty Loam Haplic Luvisol. Agronomy 2020, 10, 1005. [Google Scholar] [CrossRef]
- Troiano, E.; Beneduce, L.; Gross, A.; Ronen, Z. Antibiotic-Resistant Bacteria in Greywater and Greywater-Irrigated Soils. Front. Microbiol. 2018, 9, 2666. [Google Scholar] [CrossRef]
- Ushijima, K.; Ito, K.; Ito, R.; Funamizu, N. Greywater Treatment by Slanted Soil System. Ecol. Eng. 2013, 50, 62–68. [Google Scholar] [CrossRef]
- Anandakumar, S.; Bakhoum, N.; Chinnadurai, C.; Malarkodi, M.; Arulmozhiselvan, K.; Karthikeyan, S.; Balachandar, D. Impact of Long-Term Nutrient Management on Sequestration and Dynamics of Soil Organic Carbon in a Semi-Arid Tropical Alfisol of India. Appl. Soil Ecol. 2022, 177, 104549. [Google Scholar] [CrossRef]
- Preethi, B.; Poorniammal, R.; Balachandar, D.; Karthikeyan, S.; Chendrayan, K.; Bhattacharyya, P.; Adhya, T.K. Long-Term Organic Nutrient Managements Foster the Biological Properties and Carbon Sequestering Capability of a Wetland Rice Soil. Arch. Agron. Soil Sci. 2013, 59, 1607–1624. [Google Scholar] [CrossRef]
- Gildemeister, R.; Drews, A.; Kraume, M. Greywater Treatment in a Submerged Membrane Sequencing Batch Reactor (SM-SBR). Environ. Prot. Eng. 2005, 31, 39–52. [Google Scholar]
- APHA. Standard Methods for the Examination of Water and Wastewater. Choice Rev. Online 2012, 49, 6910. [Google Scholar] [CrossRef]
- Prodanovic, V.; Wang, A.; Deletic, A. Assessing Water Retention and Correlation to Climate Conditions of Five Plant Species in Greywater Treating Green Walls. Water Res. 2019, 167, 115092. [Google Scholar] [CrossRef]
- Román-Sierra, J.; Muñoz-Perez, J.J.; Navarro-Pons, M. Beach Nourishment Effects on Sand Porosity Variability. Coast. Eng. 2014, 83, 221–232. [Google Scholar] [CrossRef]
- Yan, Y.; Zhang, L.; Luo, X.; Li, C.; Hu, F. A New Method for Calculating the Primary Porosity of Unconsolidated Sands Based on Packing Texture: Application to Modern Beach Sand. Mar. Pet. Geol. 2018, 98, 384–396. [Google Scholar] [CrossRef]
- Agra, H.; Solodar, A.; Bawab, O.; Levy, S.; Kadas, G.J.; Blaustein, L.; Greenbaum, N. Comparing Grey Water versus Tap Water and Coal Ash versus Perlite on Growth of Two Plant Species on Green Roofs. Sci. Total Environ. 2018, 633, 1272–1279. [Google Scholar] [CrossRef] [PubMed]
- Awan, F.U.R.; Al-Yaseri, A.; Akhondzadeh, H.; Iglauer, S.; Keshavarz, A. Influence of Mineralogy and Surfactant Concentration on Zeta Potential in Intact Sandstone at High Pressure. J. Colloid Interface Sci. 2022, 607, 401–411. [Google Scholar] [CrossRef]
- Rodda, N.; Salukazana, L.; Jackson, S.A.F.; Smith, M.T. Use of Domestic Greywater for Small-Scale Irrigation of Food Crops: Effects on Plants and Soil. Phys. Chem. Earth Parts ABC 2011, 36, 1051–1062. [Google Scholar] [CrossRef]
- Fu, Y.; Zhong, X.; Lu, C.; Liang, K.; Pan, J.; Hu, X.; Hu, R.; Li, M.; Ye, Q.; Liu, Y. Growth, Nutrient Uptake and Transcriptome Profiling of Rice Seedlings in Response to Mixed Provision of Ammonium- and Nitrate-Nitrogen. J. Plant Physiol. 2023, 284, 153976. [Google Scholar] [CrossRef]
- Disha, A.S.; Harun, M.A.Y.A.; Akter, S.; Billah, S.M.; Noman, M.A.A. Reusing Greywater for Cultivation of Capsicum Frutescens and Calendula Officinalis. J. Environ. Manag. 2020, 272, 111088. [Google Scholar] [CrossRef] [PubMed]
- Hajlaoui, H.; Akrimi, R.; Sayehi, S.; Hachicha, S. Usage of Treated Greywater as an Alternative Irrigation Source for Tomatoes Cultivation. Water Environ. J. 2022, 36, 484–493. [Google Scholar] [CrossRef]
- Peng, Y.; Zhang, S.; Tang, H.; Guo, Z.; Yu, W.; Chen, G.; Li, C.; Miao, B.; Mo, B.; He, E.; et al. Quantifying the Effects of Submicroscopic Metallic Iron on VIS–NIR Spectra of Lunar Soils. Icarus 2023, 396, 115493. [Google Scholar] [CrossRef]
- Lei, W.; Pan, Q.; Teng, P.; Yu, J.; Li, N. How Does Soil Organic Matter Stabilize with Soil and Environmental Variables along a Black Soil Belt in Northeast China? An Explanation Using FTIR Spectroscopy Data. Catena 2023, 228, 107152. [Google Scholar] [CrossRef]
- Soni, S.R.; Bhunia, B.K.; Kumari, N.; Dan, S.; Mukherjee, S.; Mandal, B.B.; Ghosh, A. Therapeutically Effective Controlled Release Formulation of Pirfenidone from Nontoxic Biocompatible Carboxymethyl Pullulan-Poly(Vinyl Alcohol) Interpenetrating Polymer Networks. ACS Omega 2018, 3, 11993–12009. [Google Scholar] [CrossRef] [PubMed]
- Sanchez, M.; Rivero, M.J.; Ortiz, I. Photocatalytic Oxidation of Grey Water over Titanium Dioxide Suspensions. Desalination 2010, 262, 141–146. [Google Scholar] [CrossRef]
- Pärnpuu, S.; Astover, A.; Tõnutare, T.; Penu, P.; Kauer, K. Soil Organic Matter Qualification with FTIR Spectroscopy under Different Soil Types in Estonia. Geoderma Reg. 2022, 28, e00483. [Google Scholar] [CrossRef]
- Lado, M.; Sayegh, J.; Gia Gadñay, A.; Ben-Hur, M.; Borisover, M. Heat-Induced Changes in Soil Water-Extractable Organic Matter Characterized Using Fluorescence and FTIR Spectroscopies Coupled with Dimensionality Reduction Methods. Geoderma 2023, 430, 116347. [Google Scholar] [CrossRef]
- Mansor, A.M.; Lim, J.S.; Ani, F.N.; Hashim, H.; Ho, W.S. Ultimate and Proximate Analysis of Malaysia Pineapple Biomass from MD2 Cultivar for Biofuel Application. Chem. Eng. Trans. 2018, 63, 127–132. [Google Scholar] [CrossRef]
- Bychkov, A.L.; Denkin, A.I.; Tikhova, V.D.; Lomovsky, O.I. Prediction of Higher Heating Values of Plant Biomass from Ultimate Analysis Data. J. Therm. Anal. Calorim. 2017, 130, 1399–1405. [Google Scholar] [CrossRef]
- Coleto, I.; de la Peña, M.; Rodríguez-Escalante, J.; Bejarano, I.; Glauser, G.; Aparicio-Tejo, P.M.; González-Moro, M.B.; Marino, D. Leaves Play a Central Role in the Adaptation of Nitrogen and Sulfur Metabolism to Ammonium Nutrition in Oilseed Rape (Brassica Napus). BMC Plant Biol. 2017, 17, 157. [Google Scholar] [CrossRef] [PubMed]
- Zhuang, J.; Zhou, L.; Wang, Y.; Chi, Y. Nitrogen Allocation Regulates the Relationship between Maximum Carboxylation Rate and Chlorophyll Content along the Vertical Gradient of Subtropical Forest Canopy. Agric. For. Meteorol. 2021, 307, 108512. [Google Scholar] [CrossRef]
- Kosegarten, H.; Englisch, G. Effect of Various Nitrogen Forms on the pH in Leaf Apoplast and on Iron Chlorosis of Glycine max L. Summary-Zusammenfassung. J. Plant Nutr. Soil Sci. 1994, 154, 401–405. [Google Scholar] [CrossRef]
- Shah, A.; Wu, X.; Ullah, A.; Fahad, S.; Muhammad, R.; Yan, L.; Jiang, C. Deficiency and Toxicity of Boron: Alterations in Growth, Oxidative Damage and Uptake by Citrange Orange Plants. Ecotoxicol. Environ. Saf. 2017, 145, 575–582. [Google Scholar] [CrossRef]
Disclaimer/Publisher’s Note: The statements, opinions and data contained in all publications are solely those of the individual author(s) and contributor(s) and not of MDPI and/or the editor(s). MDPI and/or the editor(s) disclaim responsibility for any injury to people or property resulting from any ideas, methods, instructions or products referred to in the content. |
© 2024 by the authors. Licensee MDPI, Basel, Switzerland. This article is an open access article distributed under the terms and conditions of the Creative Commons Attribution (CC BY) license (https://creativecommons.org/licenses/by/4.0/).