
Stochastic Economic–Resilience Management of Combined Cooling, Heat, and Power-Based Microgrids in a Multi-Objective Approach


Abstract
1. Introduction
- Modeling power management in hybrid MGs with capacitive banks to improve their resiliency;
- Modeling the MG energy management problem from an economic perspective, considering the respective costs;
- Modeling the problem by implementing a Pareto front-based multi-objective optimization strategy.
2. Problem Modeling
2.1. Objective Functions
2.1.1. Resilience Enhancement
2.1.2. MG Operational Cost Minimization
2.1.3. Minimization of Environmental Pollution
2.1.4. Power Loss Minimization
2.2. Final Objective Function
2.3. Constraints
2.3.1. Power Balance at Each Bus
2.3.2. Line Current Limit
2.3.3. Bus Voltage Limit
2.3.4. CCHP Generation Limit
2.3.5. AB Operation Limit
2.3.6. Reactive Power Limit of Capacitor
2.3.7. BESS
2.3.8. TESS
2.3.9. Cooling and Heating Loads
2.3.10. Sensitive Loads
2.4. Modeling of Wind and Solar Systems’ Generation
3. Problem-Solving Method
3.1. Scenario Generation
3.2. Problem-Solving Flowchart
4. Numerical Study
4.1. Problem Data
4.2. Numerical Results
4.2.1. Case 1: Optimum Management of MG Regardless of Resiliency
4.2.2. Case 2: Optimal Management of Power in an MG with a CCHP, Taking Resilience into Account
4.2.3. Case 3: Multi-Objective Optimal MG Management, Taking the Resilience into Account
4.2.4. Results Analysis
5. Conclusions
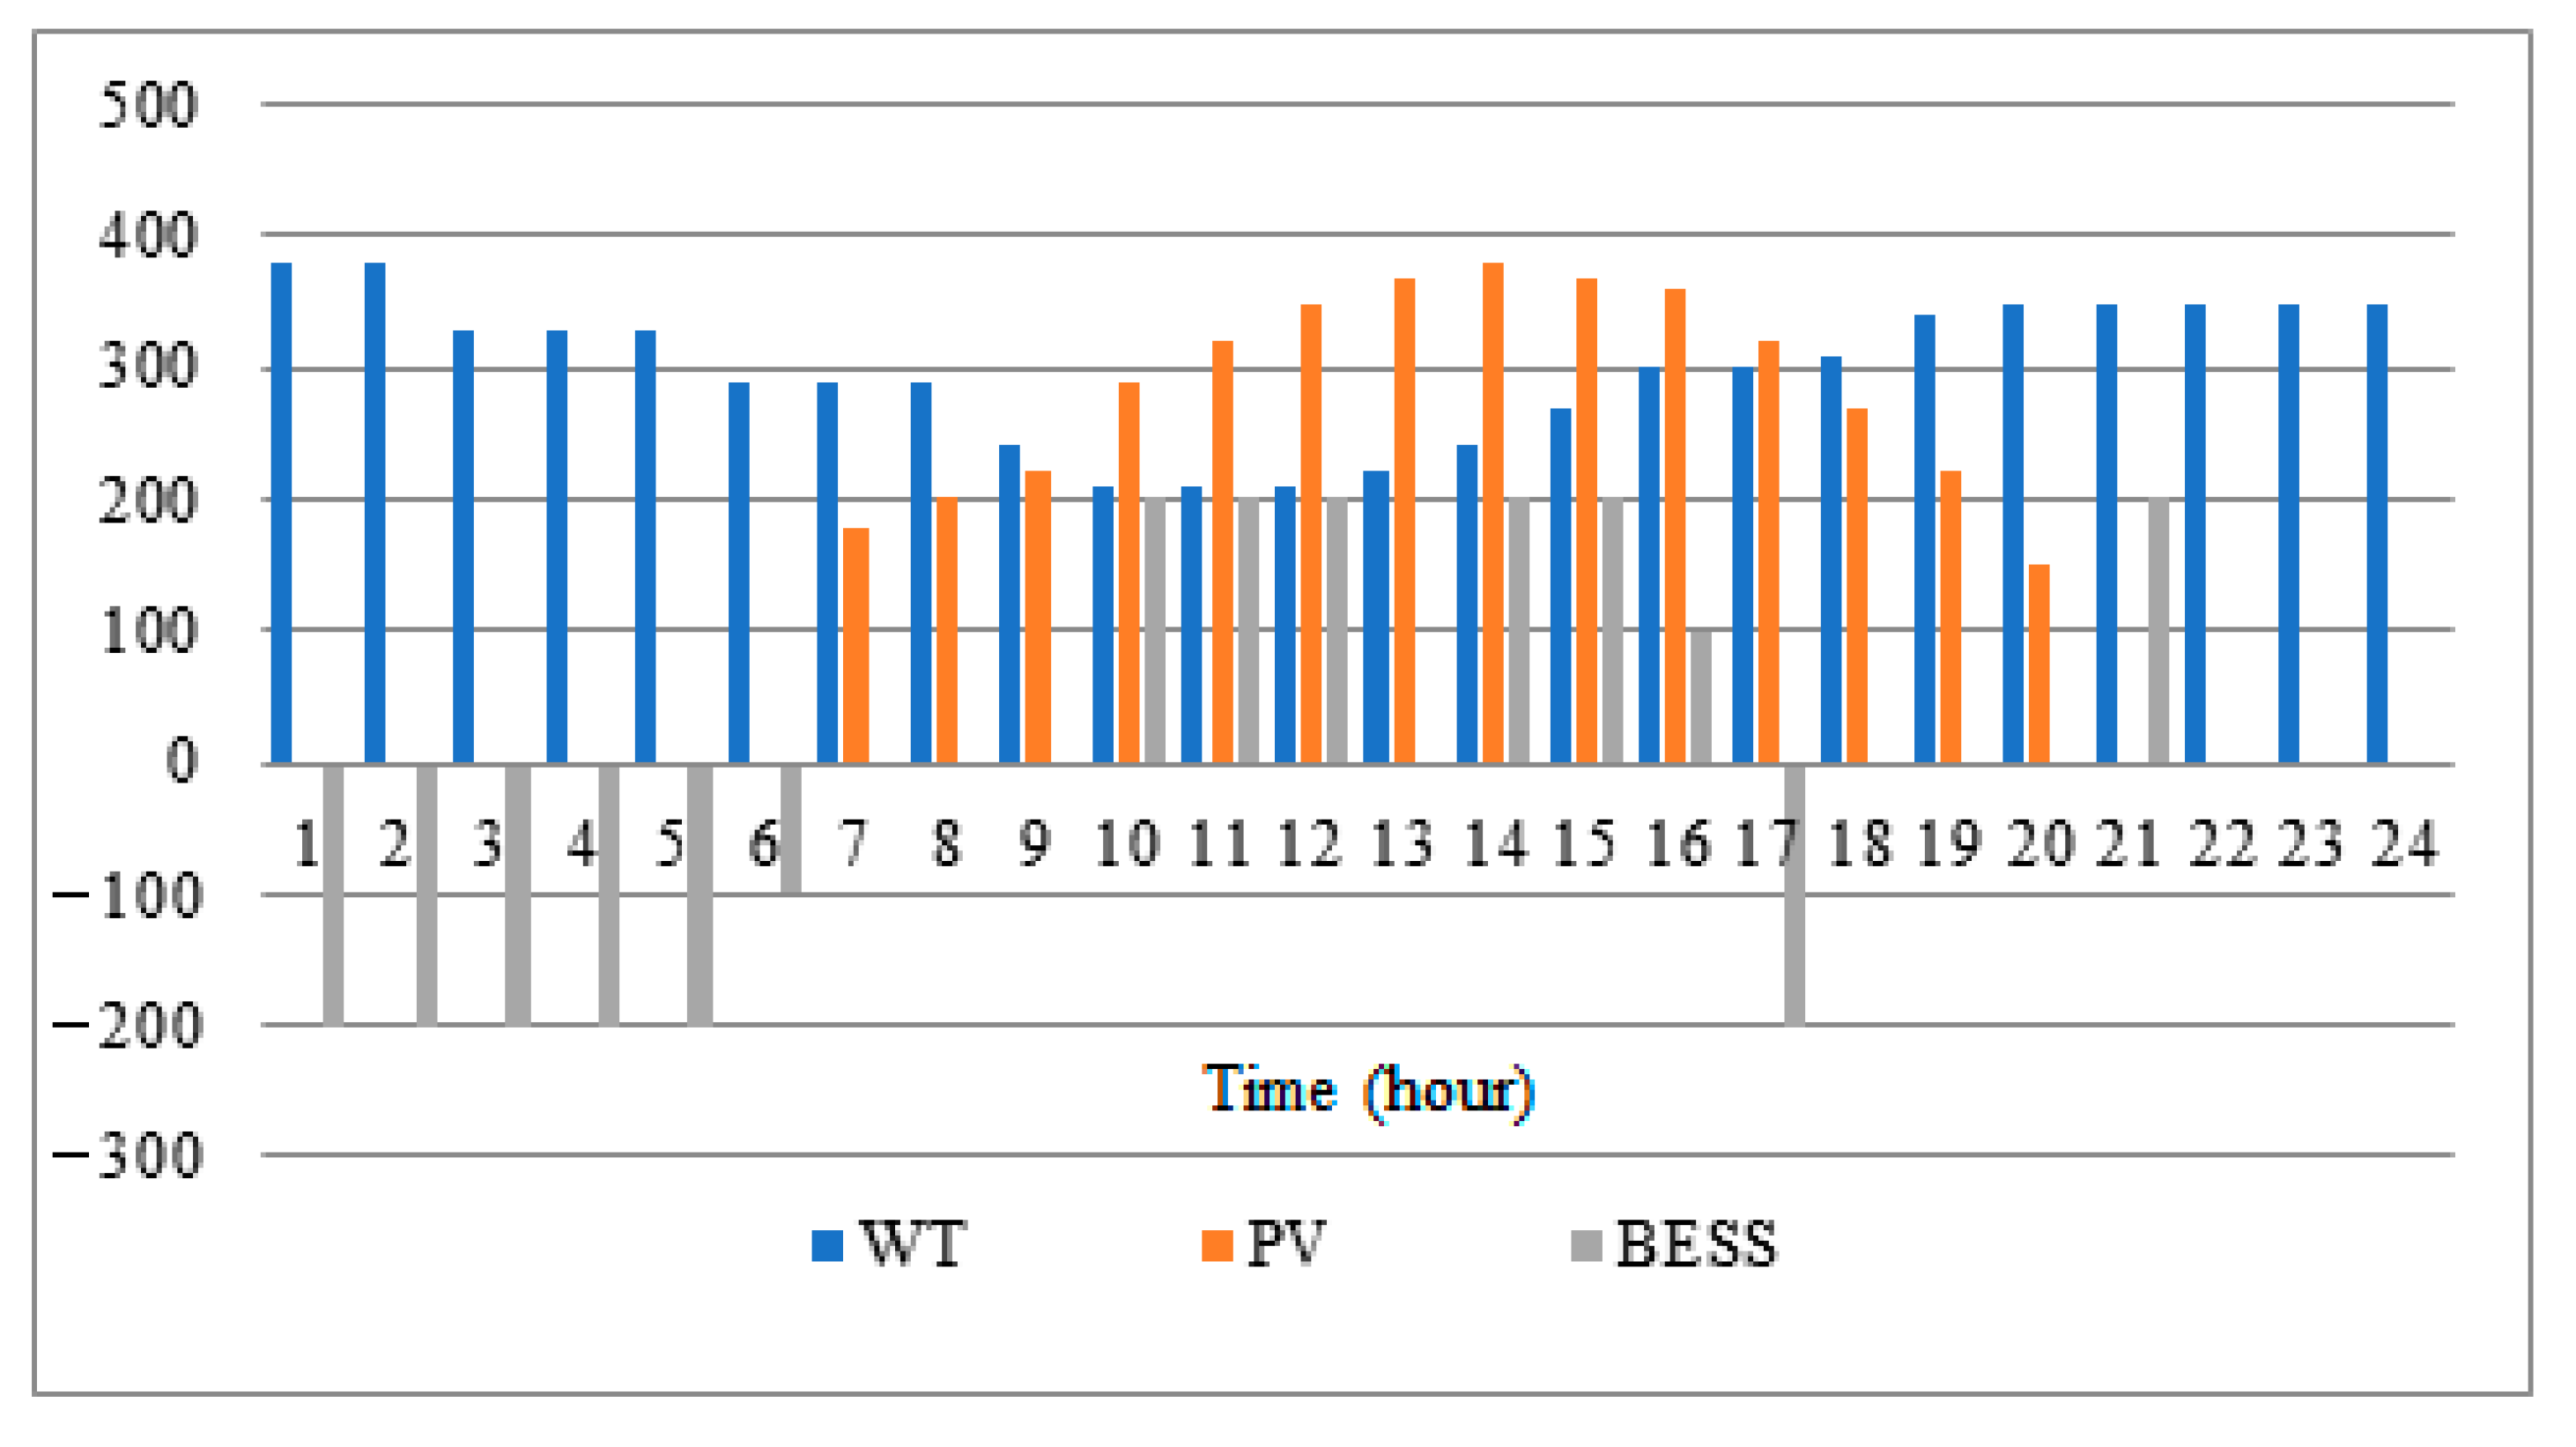
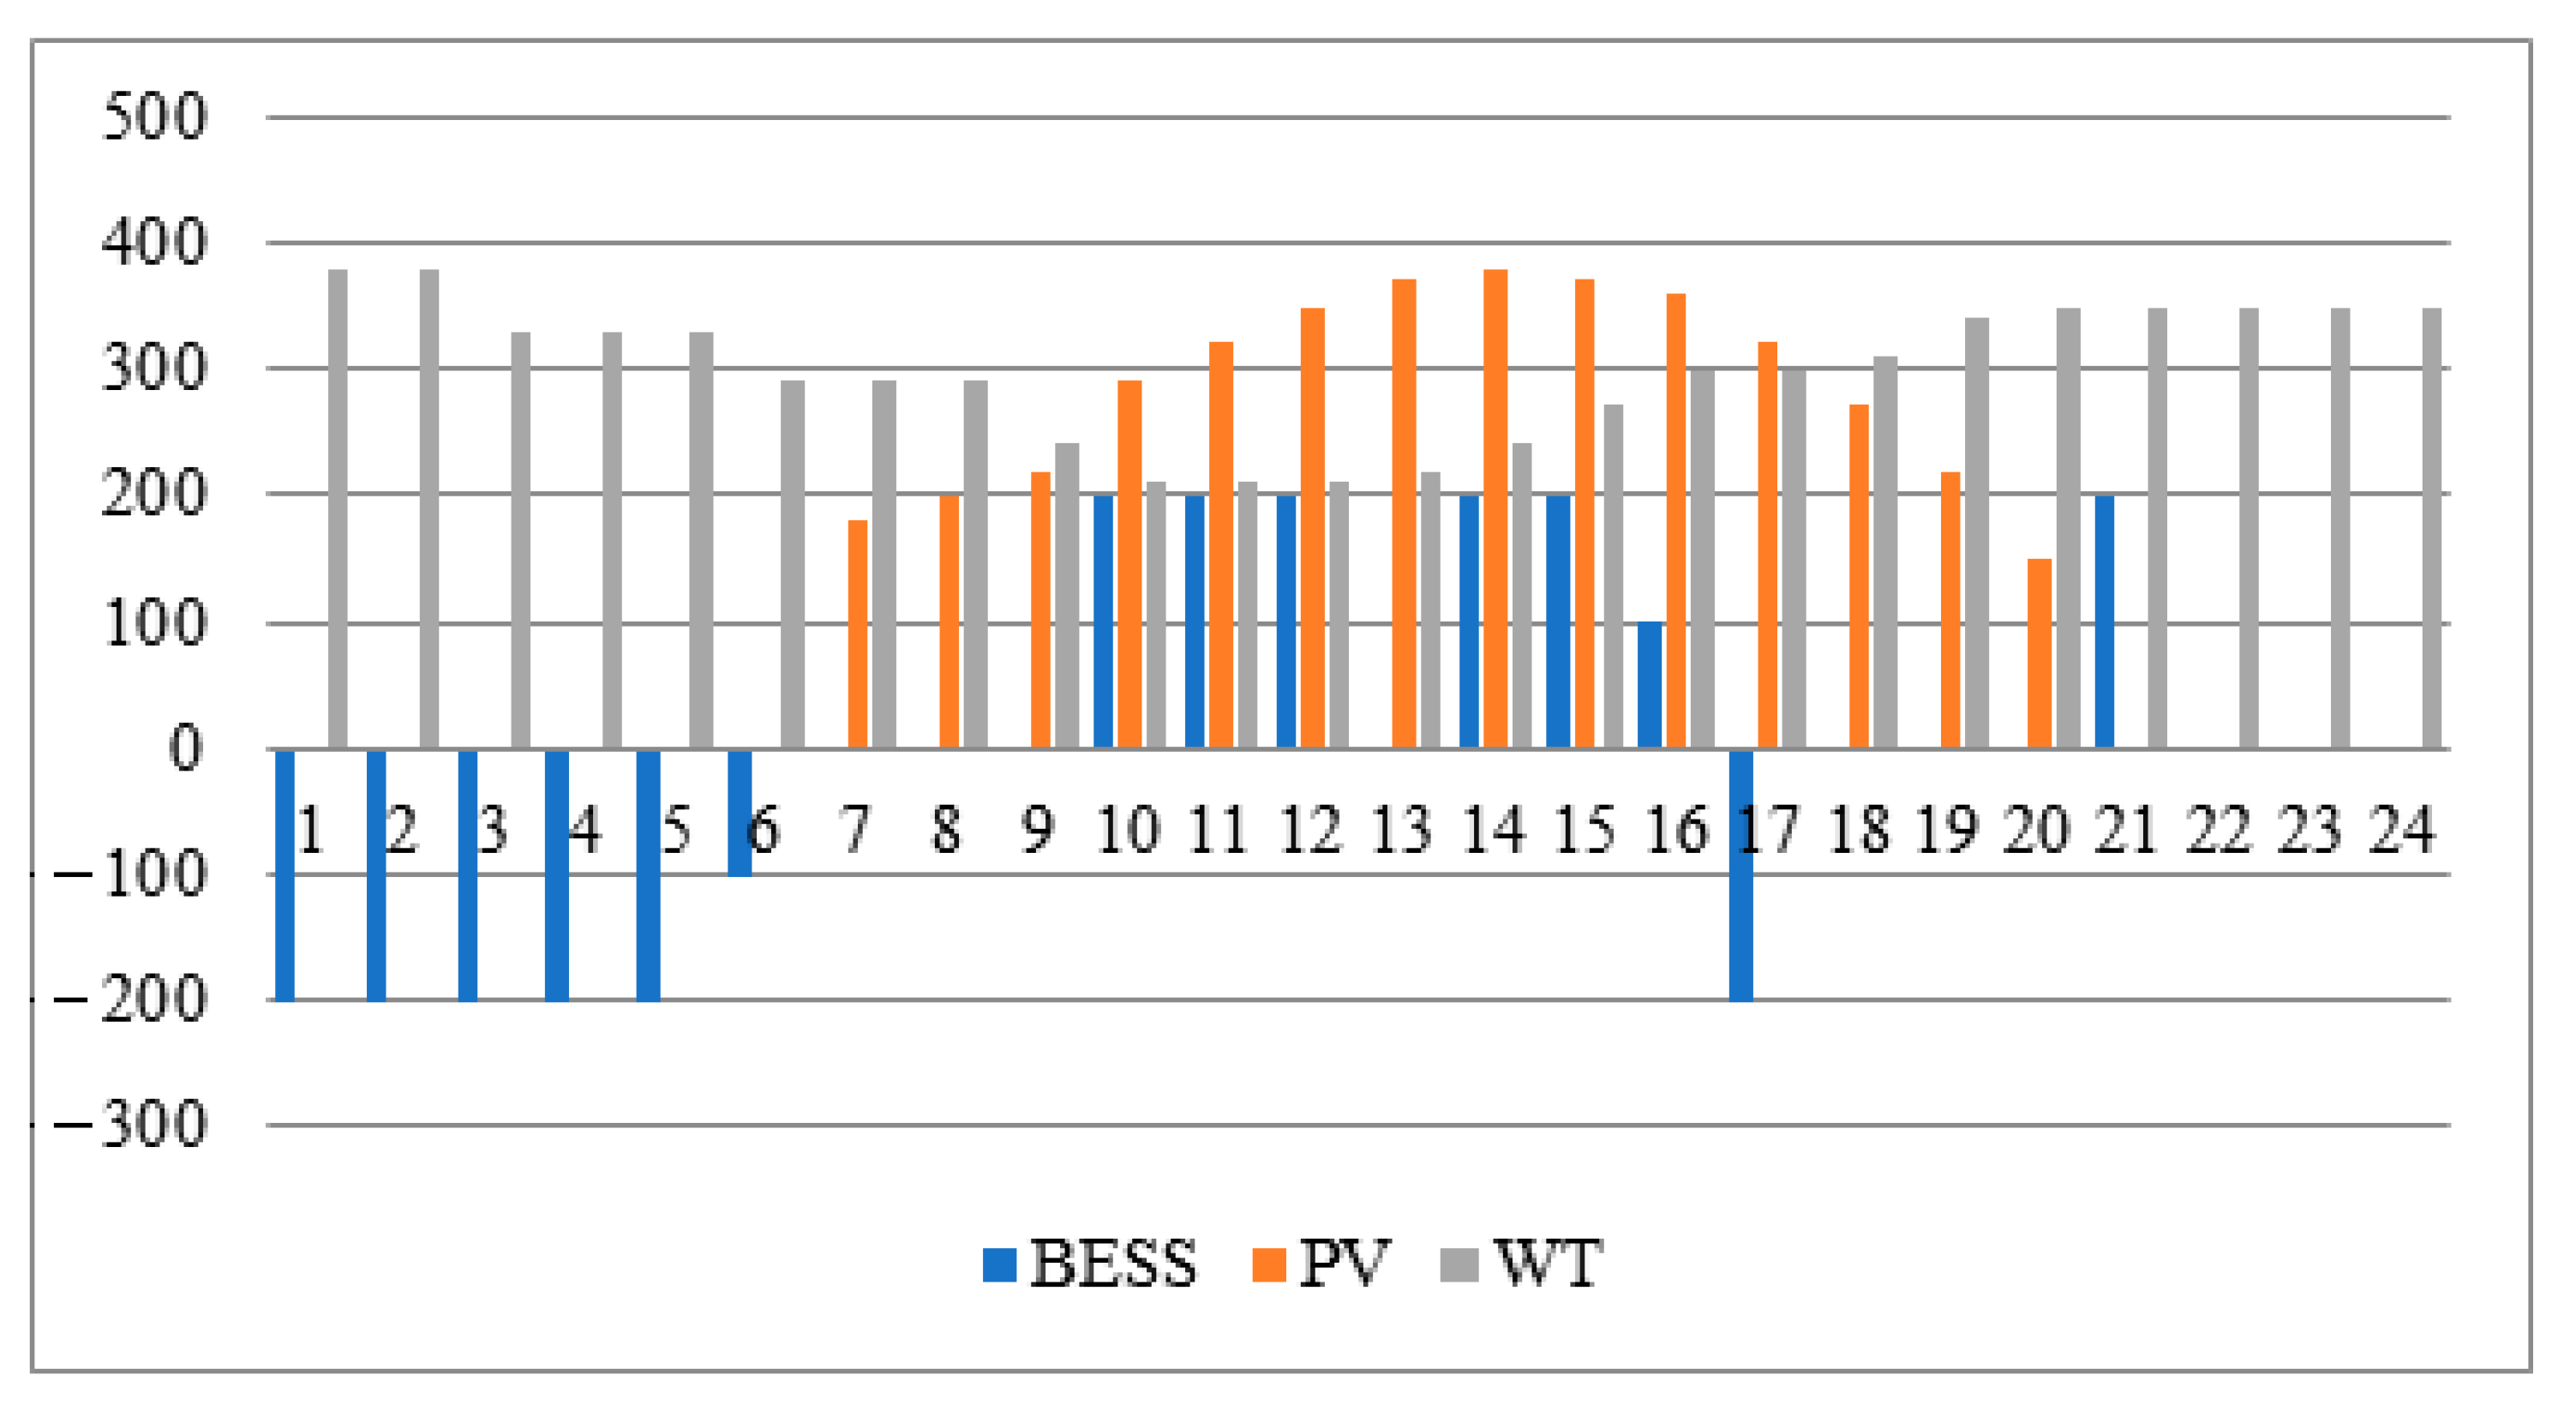
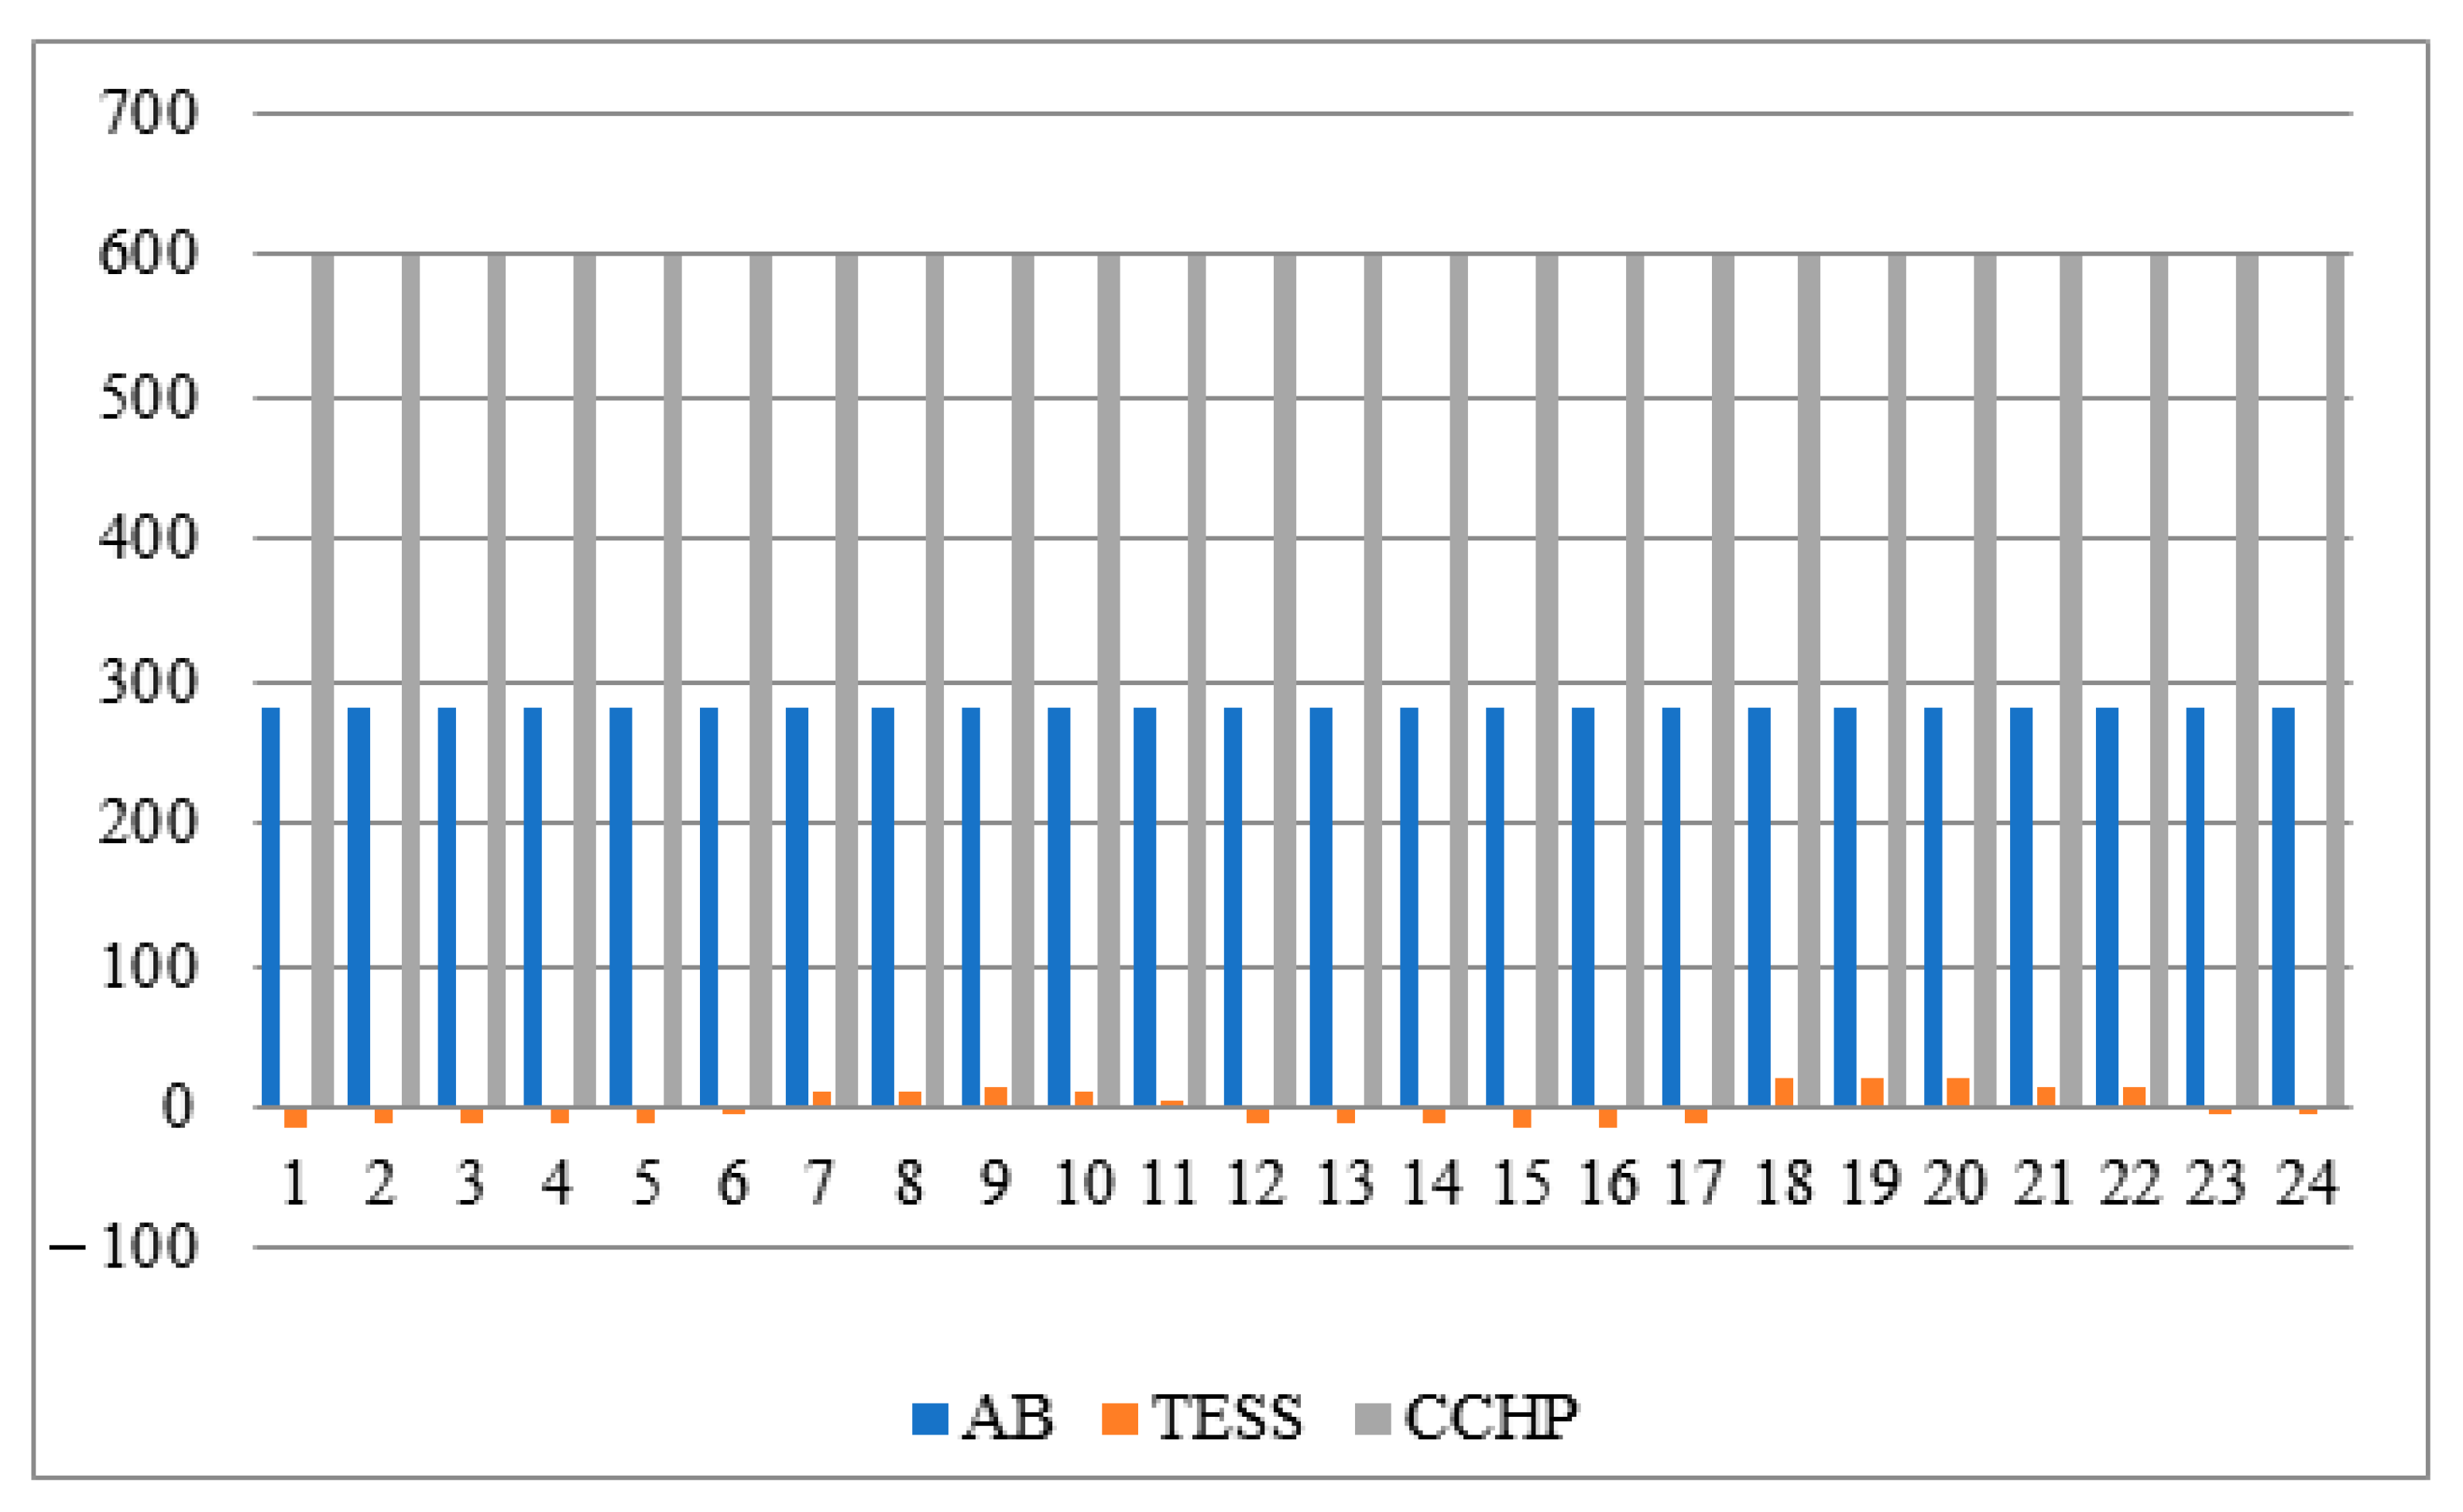
- Considering the resilience improvement approach in the MG’s operation reduced the MG operator’s reliance on the main grid. This approach led to increased CCHP generation, resulting in higher operational costs due to the resource’s higher cost compared to purchasing from the main grid. Regarding the results of this study, shown in Figure 9 and Figure 12, the amount of energy generated via CCHP doubled in the studied time, taking into account the issue of resilience in the operation of the MG. The reason for this is the desire of the MG operator to rely less on purchasing from the upstream network due to the possibility of natural disasters and the impossibility of purchasing from the upstream network,
- The increased CCHP generation resulted in fewer outages during MG emergencies, leading to a reduction in outage costs for the MG. As the reduction in outage costs outweighed the increase in operational costs, the MG operator’s final objective improved. As indicated in Table 3 and Table 5, considering the issue of resilience in MG operation, the total cost of MG operation increased by 10.38%. The reason for this increase in costs was the use of more resources at the disposal of the MG, which cost more than buying from the upstream network. On the other hand, by using the resources at the disposal of the MG, the MG suffered fewer outages during the occurrence of natural disasters and, as a result, fewer outage costs, so its resilience costs were reduced by 13.92%. Therefore, applying the approach of resilient operation of the MG reduced the total cost of operation and resilience of the MG by 6.2%,
- Solving the problem using a multi-objective optimization approach yielded better values for the objective functions. This approach improved the objective function values related to operation and outage costs, losses, and environmental pollution by 0.02%, 0.12%, and 1.16%, respectively.
- In this study, power management was conducted for a single MG. Given the numerous advantages associated with networked MGs, it is suggested that the energy management of networked MGs will be explored by considering the resilience concept.
- Another critical aspect of interest in energy management is the consideration of resource flexibility. Given its paramount importance, especially in the context of operating renewable resources, it is suggested that the problem addressed in this study should be investigated by considering resource flexibility. Considering the flexibility of resources improves generation expansion planning and resource operation. It is possible that in normal or contingency conditions, sufficient resources will be available in terms of capacity, but these resources do not have a sufficient ramp rate to increase or decrease their generation in the limited time they have. This issue will increase outages in the network and increase total costs. If the flexibility of the resources is considered in studies related to the planning, operation, and resilience of the network, the available resources will have the appropriate ramp rate at the time of need, and with the appropriate response at the considered time, network outages will be prevented and will reduce the total network costs.
- In this study, the issue of resilience is raised in a general way. In other words, the issue of resilience can be raised in order to prevent outages and crises during natural disasters such as floods, earthquakes, and storms, or during human sabotage such as cyber-attacks. Naturally, with the growth of the use of automation, telecommunications, and especially the Internet in power grids and MGs, as well as the development of digital loads, the possibility of cyber-attacks and outages and crises arising from them increases. Therefore, it is very valuable that, in the continuation of this study, the issue of energy management in MGs in order to improve resilience against cyber-attacks is also studied and measures are taken to reduce outages.
Author Contributions
Funding
Institutional Review Board Statement
Informed Consent Statement
Data Availability Statement
Conflicts of Interest
Nomenclature
| MG resilience cost at time t and scenario s (USD/h) | Objective function of MG resilience cost (USD/h) | ||
| Outage price (USD/kWh) | The possibility of an emergency | ||
| Operation cost of capacitor 1 in emergency (USD/h) | Operation cost of WT i in emergency (USD/h) | ||
| Cost of TESS i operation in emergency (USD/h) | Operational cost of PV i in emergency (USD/h) | ||
| Cost of BESS i operation in emergency (USD/h) | Operation cost of CCHP in emergency (USD/h) | ||
| Objective function of MG operation cost (USD/h) | The amount of MG outage (kW) | ||
| Operation cost of WT i (USD/h) | Cost related to exchanging power with the main grid (USD/h) | ||
| Operation cost of PV i (USD/h) | Operation cost of capacitor 1 (USD/h) | ||
| Operation cost of CCHP (USD/h) | Cost of TESS i operation (USD/h) | ||
| Power trade with upstream network (kW) | Cost of BESS i operation (USD/h) | ||
| Power generation of WT i (kw) | Price of traded power with the main grid (USD/kWh) | ||
| WT cost function coefficients (USD/h) | PV cost function coefficients (USD/h) | ||
| Number of WT units | Power generation of PV i (kW) | ||
| CCHP cost function coefficients (USD/h) | Number of PV units | ||
| Power generation of CCHP i (kW) | Heat power generation of CCHP i (kW) | ||
| Number of CCHP units | Electrical efficiency of CCHP units | ||
| Thermal efficiency of auxiliary boiler | Annual degradation rate (Percent/year) | ||
| TESS cost function coefficients (USD/h) | Useful lifetime of equipment | ||
| Thermal traded power with TESS (kW) | CCHP i capacity factor | ||
| Number of TESS | Capital cost of CCHP (USD/h) | ||
| Capital cost of BESS (USD/h) | Capacity of the CCHP (kW) | ||
| BESS capacity (kW) | Fuel cost of CCHP (USD/kWh) | ||
| BESS capacity factor | Transformation rate for gas-to-electricity (m3/kWh) | ||
| Capital cost of TESS (USD/kW) | Price of natural gas (USD/m3) | ||
| TESS capacity (kW) | WT O&M cost (USD/kWh) | ||
| TESS capacity factor | PV O&M cost (USD/kWh) | ||
| WT investment cost (USD/kW) | WT capacity (kW) | ||
| PV investment cost (USD/kW) | PV capacity (kW) | ||
| WT capacity factor (%) | PV capacity factor (%) | ||
| BESS O&M cost (USD/kWh) | Capacitor coefficients (USD/h) | ||
| TESS O&M cost (USD/kWh) | Reactive power of capacitor 1 (kVAr) | ||
| Power traded with main grid (kW) | Number of CBs | ||
| Pollution rate (kg/kWh) | CB capacity (kVAr) | ||
| Power loss (kW) | CB capital cost (USD/kVAr) | ||
| Feeder resistance (Ω) | CB 1 capacity factor | ||
| Current of feeder k (A) | BESS cost function coefficients (USD/h) | ||
| Number of feeders | Power traded with BESS i (kW) | ||
| Price of power traded with main grid (USD/h) | Number of BESSs | ||
| Pollution cost coefficient (USD/kg.h) | Power loss cost coefficient (USD/kWh) | ||
| Power loss (kW) | Pollution (kg) | ||
| Reactive load on bus z (kVAr) | Active load on bus z (kW) | ||
| Reactive generation on bus z (kVAr) | Active power generated on bus z (kVAr) | ||
| Voltage angle on bus z | Maximum current allowed on line k (A) | ||
| Voltage magnitude on bus z (p.u.) | Admittance angle (p.u.) | ||
| Voltage minimum limitation as well as maximum (p.u.) | Number of buses | ||
| Minimum thermal generation of CCHP as well as maximum (kW) | Minimum and maximum electrical generation of CCHP (kW) | ||
| Minimum reactive generation of CB as well as maximum (kVAr) | Minimum and maximum thermal generation of AB (kW) | ||
| BESS i discharged energy (kW) | BESS i charged power (kW) | ||
| Maximum discharged power of BESS i (kW) | Maximum charged power of BESS i (kW) | ||
| BESS i discharge status | BESS i charge status | ||
| BESS discharge efficiency | BESS charge efficiency | ||
| Thermal charged energy in TESS (kW) | BESS i minimum energy (kWh) | ||
| Maximum charged thermal energy in TESS i (kW) | Energy charged in BESS i (kWh) | ||
| Minimum energy possible in TESS i (kWh) | Maximum energy possible in BESS i (kWh) | ||
| TESS i thermal discharged energy (kW) | TESS i maximum discharged thermal energy (kW) | ||
| Discharge status of TESS i | Charge status of TESS i | ||
| Energy charged in TESS i (kWh) | Minimum energy of TESS i (kWh) | ||
| TESS discharge efficiency | TESS charge efficiency | ||
| CCHP i heat generation (kW) | WT power generation in wind velocity of v (kW) | ||
| Rate of heat power generation of CCHP | Cooling demand (kW) | ||
| Heating demand (kW) | Area of PV module (m2) | ||
| Solar irradiance (kW/m2) | Wind cut-in velocity (m/s) | ||
| WT rated power (kW) | Wind cut-out velocity (m/s) | ||
| PV output for irradiance of si (kW) | Wind rated velocity (m/s) | ||
| Efficiency of PV module | Wind velocity (m/s) | ||
| Percentage of MG sensitive loads |
References
- Yin, X.; Zhao, Z.; Yang, W. Ensemble prediction aided multi objective co-design optimizations of grid-connected integrated renewables for green hydrogen production. J. Clean. Prod. 2023, 425, 138585. [Google Scholar] [CrossRef]
- Seyyedi, A.Z.; Armand, M.J.; Akbari, E.; Moosanezhad, J.; Khorasani, F.; Raeisinia, M. A non-linear resilient-oriented planning of the energy hub with integration of energy storage systems and flexible loads. J. Energy Storage 2022, 51, 104397. [Google Scholar] [CrossRef]
- Rahgozar, S.; Seyyedi, A.Z.; Siano, P. A resilience-oriented planning of energy hub by considering demand response program and energy storage systems. J. Energy Storage 2022, 52, 104841. [Google Scholar] [CrossRef]
- Rashid, S.M.; Zare-Ghaleh-Seyyedi, A.; Moosanezhad, J.; Khan, A.A. Multi-objective design of the energy storage-based combined heat and power off-grid system to supply of thermal and electricity consumption energies. J. Energy Storage 2023, 73, 108675. [Google Scholar] [CrossRef]
- Seyyedi, A.Z.; Armand, M.J.; Shahmoradi, S.; Rashid, S.M.; Akbari, E.; Al-Hassanawy, A.J. Iterative optimization of a bi-level formulation to identify severe contingencies in power transmission systems. Int. J. Electr. Power Energy Syst. 2023, 145, 108670. [Google Scholar] [CrossRef]
- Yin, X.; Lei, M. Towards complementary operations of offshore wind farm and photovoltaic array: A centralized reinforcement learning enabled control approach. Int. J. Electr. Power Energy Syst. 2023, 153, 108973. [Google Scholar] [CrossRef]
- Wang, J.; Jin, C.; Tang, Q.; Xiong, N.N.; Srivastava, G. Intelligent ubiquitous network accessibility for wireless-powered MEC in UAV-assisted B5G. IEEE Trans. Netw. Sci. Eng. 2020, 8, 2801–2813. [Google Scholar] [CrossRef]
- Cao, D.; Zeng, K.; Wang, J.; Sharma, P.K.; Ma, X.; Liu, Y.; Zhou, S. BERT-based deep spatial-temporal network for taxi demand prediction. IEEE Trans. Intell. Transp. Syst. 2021, 23, 9442–9454. [Google Scholar] [CrossRef]
- Liao, Z.; Pang, X.; Zhang, J.; Xiong, B.; Wang, J. Blockchain on security and forensics management in edge computing for IoT: A comprehensive survey. IEEE Trans. Netw. Serv. Manag. 2021, 19, 1159–1175. [Google Scholar] [CrossRef]
- Li, W.; Chen, Z.; Gao, X.; Liu, W.; Wang, J. Multimodel framework for indoor localization under mobile edge computing environment. IEEE Internet Things J. 2018, 6, 4844–4853. [Google Scholar] [CrossRef]
- Li, W.; Xu, H.; Li, H.; Yang, Y.; Sharma, P.K.; Wang, J.; Singh, S. Complexity and algorithms for superposed data uploading problem in networks with smart devices. IEEE Internet Things J. 2019, 7, 5882–5891. [Google Scholar] [CrossRef]
- Seyyedi, A.Z.; Akbari, E.; Atazadegan, M.H.; Rashid, S.M.; Niazazari, A.; Shahmoradi, S. A stochastic tri-layer optimization framework for day-ahead scheduling of microgrids using cooperative game theory approach in the presence of electric vehicles. J. Energy Storage 2022, 52, 104719. [Google Scholar] [CrossRef]
- Honarmand, H.A.; Rashid, S.M. A sustainable framework for long-term planning of the smart energy hub in the presence of renewable energy sources, energy storage systems and demand response program. J. Energy Storage 2022, 52, 105009. [Google Scholar] [CrossRef]
- Janko, S.; Johnson, N.G. Reputation-based competitive pricing negotiation and power trading for grid connected microgrid networks. Appl. Energy 2020, 277, 115598. [Google Scholar] [CrossRef]
- Wu, C.; Lai, C. Data-driven diversity antenna selection for MIMO communication using machine learning. J. Internet Technol. 2022, 23, 1–9. [Google Scholar] [CrossRef]
- Zhu, Y.Q.; Cai, Y.M.; Zhang, F. Motion capture data denoising based on LSTNet autoencoder. J. Internet Technol. 2022, 23, 11–20. [Google Scholar] [CrossRef]
- Saveetha, P.; Robinson, Y.H.; Shanmuganathan, V.; Kadry, S.; Nam, Y. Hybrid Energy-based Secured clustering technique for Wireless Sensor Networks. J. Internet Technol. 2022, 23, 21–31. [Google Scholar] [CrossRef]
- Sun, Z.; Zhao, G.; Scherer, R.; Wei, W.; Woźniak, M. Overview of capsule neural networks. J. Internet Technol. 2022, 23, 33–44. [Google Scholar] [CrossRef]
- Liu, F.F.; Chu, S.C.; Wang, X.; Pan, J.S. A collaborative dragonfly algorithm with novel communication strategy and application for multi-thresholding color image segmentation. J. Internet Technol. 2022, 23, 45–62. [Google Scholar] [CrossRef]
- Seyyedi, A.Z.; Nejati, S.A.; Parsibenehkohal, R.; Hayerikhiyavi, M.; Khalafian, F.; Siano, P. Bi-level sitting and sizing of flexi-renewable virtual power plants in the active distribution networks. Int. J. Electr. Power Energy Syst. 2022, 137, 107800. [Google Scholar] [CrossRef]
- Rashid, S.M.; Ghiasi, A.R.; Ghaemi, S. An improved robust distributed H∞ control method for uncertain interconnected large-scale time-delayed systems. Energy Rep. 2023, 10, 2374–2393. [Google Scholar] [CrossRef]
- Pascual, J.; Aviles, D.A.; Ursua, A.; Sanchis, P.; Marroyo, L. Energy management for an electro-thermal renewable-based residential microgrid with energy balance forecasting and demand-side management. Appl. Energy 2021, 295, 1–22. [Google Scholar] [CrossRef]
- Li, K.; Yang, W.; Li, K. Performance analysis and optimization for SpMV on GPU using probabilistic modeling. IEEE Trans. Parallel Distrib. Syst. 2014, 26, 196–205. [Google Scholar] [CrossRef]
- Chen, J.; Li, K.; Bilal, K.; Li, K.; Philip, S.Y. A bi-layered parallel training architecture for large-scale convolutional neural networks. IEEE Trans. Parallel Distrib. Syst. 2018, 30, 965–976. [Google Scholar] [CrossRef]
- Liu, C.; Li, K.; Li, K.; Buyya, R. A new service mechanism for profit optimizations of a cloud provider and its users. IEEE Trans. Cloud Comput. 2017, 9, 14–26. [Google Scholar] [CrossRef]
- Chen, C.; Li, K.; Wei, W.; Zhou, J.T.; Zeng, Z. Hierarchical graph neural networks for few-shot learning. IEEE Trans. Circuits Syst. Video Technol. 2021, 32, 240–252. [Google Scholar] [CrossRef]
- Zare Ghaleh Seyyedi, A.; Mahmoudi Rashid, S.; Akbari, E.; Nejati, S.A.; Khalafian, F.; Siano, P. Co-planning of generation and transmission expansion planning for network resiliency improvement against extreme weather conditions and uncertainty of resiliency sources. IET Gener. Transm. Distrib. 2022, 16, 4830–4845. [Google Scholar] [CrossRef]
- Mahmoudi Rashid, S.; Akbari, E.; Khalafian, F.; Hossein Atazadegan, M.; Shahmoradi, S.; Zare Ghaleh Seyyedi, A. Robust allocation of FACTS devices in coordinated transmission and generation expansion planning considering renewable resources and demand response programs. Int. Trans. Electr. Energy Syst. 2022, 2022, 4331293. [Google Scholar] [CrossRef]
- Dzikuć, M.; Piwowar, A.; Dzikuć, M. The importance and potential of photovoltaics in the context of low-carbon development in Poland. Energy Storage Sav. 2022, 1, 162–165. [Google Scholar] [CrossRef]
- Liu, C.; Li, K.; Li, K. A game approach to multi-servers load balancing with load-dependent server availability consideration. IEEE Trans. Cloud Comput. 2018, 9, 1–13. [Google Scholar] [CrossRef]
- Xiao, G.; Li, K.; Chen, Y.; He, W.; Zomaya, A.Y.; Li, T. Caspmv: A customized and accelerative spmv framework for the sunway taihulight. IEEE Trans. Parallel Distrib. Syst. 2019, 32, 131–146. [Google Scholar] [CrossRef]
- Duan, M.; Li, K.; Li, K.; Tian, Q. A novel multi-task tensor correlation neural network for facial attribute prediction. ACM Trans. Intell. Syst. Technol. (TIST) 2020, 12, 1–22. [Google Scholar] [CrossRef]
- Akbari, E.; Seyyedi, A.Z. Power quality enhancement of distribution grid using a photovoltaic based hybrid active power filter with three level converter. Energy Rep. 2023, 9, 5432–5448. [Google Scholar] [CrossRef]
- Rashid, S.M.; Shishavan, H.K.; Ghiasi, A.R. A Fault-Tolerant Control Strategy using Virtual Actuator Approach for Flexible Robot Links with Hysteresis. In Proceedings of the 2021 7th International Conference on Control, Instrumentation and Automation (ICCIA), Tabriz, Iran, 23–24 February 2021; IEEE: Piscataway, NJ, USA, 2021. [Google Scholar] [CrossRef]
- Velik, R.; Nicolay, P. Grid-price dependent energy management in microgrids using a modified simulated annealing triple-optimizer. Appl. Energy 2014, 130, 384–395. [Google Scholar] [CrossRef]
- Niknam, T.; Abarghooee, R.A.; Narimani, M.R. An efficient scenario based stochastic programming framework for multi-objective optimal microgrid operation. Appl. Energy 2012, 99, 455–470. [Google Scholar] [CrossRef]
- Afrouzmehr, M.; Yasrebi, N.; Sheikhi, M.H. Fabrication and characterization of Ag-Decorated indium–tin-oxide nanoparticle based ethanol sensors using an enhanced electrophoretic method. Ceram. Int. 2021, 47, 30504–30513. [Google Scholar] [CrossRef]
- Mohammadi-Pouyan, S.; Afrouzmehr, M.; Abbott, D. Ultra compact bend-less Mach-Zehnder modulator based on GSST phase change material. Opt. Mater. Express 2022, 12, 2982–2994. [Google Scholar] [CrossRef]
- Mohammadi-Pouyan, S.; Afrouzmehr, M.; Abbott, D. Ultra-Compact Efficient Thermally Actuated Mach-Zehnder Modulator Based on VO2. IEEE Access 2022, 10, 85952–85959. [Google Scholar] [CrossRef]
- Akbari, E.; Seyyedi, A.Z. Multifunctional Power Quality Enhancement based on Voltage and Current in Grid-tied Microgrids with Considering Harmonics. Authorea Prepr. 2023. [Google Scholar] [CrossRef]
- Rashid, S.M.; Ghiasi, A.R.; Ghavifekr, A.A. Distributed H∞ filtering for interconnected large-scale systems with time-varying delays. In Proceedings of the 2021 7th International Conference on Control, Instrumentation and Automation (ICCIA), Tabriz, Iran, 23–24 February 2021; IEEE: Piscataway, NJ, USA, 2021. [Google Scholar] [CrossRef]
- Li, B.; Zhao, R.; Lu, J.; Xin, K.; Huang, J.; Lin, G.; Chen, J.; Pang, X. Energy management method for microgrids based on improved Stackelberg game real-time pricing model. Energy Rep. 2023, 9, 1247–1257. [Google Scholar] [CrossRef]
- Vignesh Babu, V.; Preetha Roselyn, J.; Sundaravadivel, P. Multi-objective genetic algorithm-based energy management system considering optimal utilization of grid and degradation of battery storage in microgrid. Energy Rep. 2023, 9, 5992–6005. [Google Scholar] [CrossRef]
- Rashid, S.M.; Nazmi, P.K.; Bagheri, F. Adaptive predictive controller design for nonlinear grid-connected PMSG based wind energy conversion system using dynamic matrices. In Proceedings of the 2021 7th International Conference on Control, Instrumentation and Automation (ICCIA), Tabriz, Iran, 23–24 February 2021; IEEE: Piscataway, NJ, USA, 2021. [Google Scholar] [CrossRef]
- Esmaeili, M.; Sedighizadeh, M.; Esmaili, M. Multi-objective optimal reconfiguration and DG power allocation in distribution network using big bang-big crunch algorithm considering load uncertainty. Energy 2016, 103, 86–99. [Google Scholar] [CrossRef]
- Sedighizadeh, M.; Esmaili, M.; Esmaeili, M. Allocation of the hybrid big bang-big crunch algorithm to optimal reconfiguration and distributed generation power allocation in distribution systems. Energy 2014, 76, 920–930. [Google Scholar] [CrossRef]
- Sedighizadeh, M.; Shaghaghi-shahr, G.; Esmaili, M.; Aghamohammadi, M.R. Optimal distribution feeder reconfiguration and generation scheduling for microgrid day-ahead operation in the presence of electric vehicles considering uncertainties. J. Energy Storage 2019, 21, 58–71. [Google Scholar] [CrossRef]
- Jabbari-Sabet, R.; Moghaddas Tafreshi, S.M.; Mirhosseini, S.S. Microgrid operation and management using probabilistic reconfiguration and unit commitment. Int. J. Electr. Power Energy Syst. 2018, 75, 328–336. [Google Scholar] [CrossRef]
- Hamida, I.B.; Salah, S.B.; Msahli, F.; Mimouni, M.F. Optimal network reconfiguration and renewable DG integration considering time sequence variation in load and DGs. Renew. Energy 2018, 121, 66–80. [Google Scholar] [CrossRef]
- Yuan, Z.-P.; Li, P.; Li, Z.-L.; Xia, J. Data-driven risk-adjusted robust energy management for microgrids integrating demand response aggregator and renewable energies. IEEE Trans. Smart Grid 2023, 14, 365–377. [Google Scholar] [CrossRef]
- Gao, F.; Yu, J.; Rogers, D.J. A discrete-time algorithm for real time energy management in DC microgrids. IEEE Trans. Power Electron. 2023, 38, 2896–2909. [Google Scholar] [CrossRef]
- Ahmed, H.M.A.; Sindi, H.F.; Azzouz, M.A. An energy trading framework for interconnected AC-DC hybrid smart microgrids. IEEE Trans. Smart Grid 2023, 14, 853–865. [Google Scholar] [CrossRef]
- Bai, W.; Wang, D. An online multi-level energy management system for commercial building microgrids with multiple generation and storage systems. IEEE Open Access J. Power Energy 2023, 10, 195–207. [Google Scholar] [CrossRef]
- Zou, Y.; Xu, Y.; Zhang, C. A risk-averse adaptive stochastic optimization method for transactive energy management of a multi-energy microgrid. IEEE Trans. Sustain. Energy 2023, 12, 1599–1611. [Google Scholar] [CrossRef]
- Ghazijahani, F.S.; Salehi, J. Integrated DR and reconfiguration scheduling for optimal operation of microgrids using Hongs’ point estimate method. Int. J. Electr. Power Energy Syst. 2018, 99, 481–492. [Google Scholar] [CrossRef]
- Kaveh, M.R.; Hooshmand, R.A.; Madani, S.M. Simultaneous optimization of rephrasing, reconfiguration and DG placement in distribution networks using BF-SD algorithm. Appl. Soft Comput. 2018, 62, 1044–1055. [Google Scholar] [CrossRef]
- Shukla, J.; Das, B.; Pant, V. Stability constrained optimal distribution system reconfiguration considering uncertainties in correlated loads and distributed generations. Int. J. Electr. Power Energy Syst. 2018, 99, 121–133. [Google Scholar] [CrossRef]
- Harsh, P.; Das, D. Energy management in microgrid using incentive-based demand response and reconfigured network considering uncertainties in renewable energy sources. Sustain. Energy Technol. Assess. 2021, 46, 1–20. [Google Scholar] [CrossRef]
- Kiani, M.; Salahi, J. Integrated approach of network reconfiguration with distributed generation and shunt capacitor placement for power loss minimization in radial distribution networks. Appl. Soft Comput. 2017, 52, 1262–1284. [Google Scholar] [CrossRef]
- Mohammadi, M.; Rozbahani, A.M.; Bahmanyar, S. Power loss reduction of distribution systems using BFO based optimal reconfiguration along with DG and shunt capacitor placement simultaneously in fuzzy framework. J. Cent. South Univ. 2017, 1, 90–103. [Google Scholar] [CrossRef]
- Ravadanegh, S.N.; Oskuee, M.R.J.; Karimi, M. Multi-objective planning model for simultaneous reconfiguration of power distribution network and allocation of renewable energy resources and capacitors with considering uncertainties. J. Cent. South Univ. 2017, 8, 1837–1849. [Google Scholar] [CrossRef]
- Younesi, A.; Shayeghi, H.; Siano, P.; Safari, A. A multi-objective stochastic scheduling method for microgrid. Int. J. Electr. Power Energy Syst. 2021, 131, 106974. [Google Scholar] [CrossRef]
- Wu, R.; Sansavini, G. Integrating reliability and resilience to support the transition from passive distribution grids to islanding microgrids. Appl. Energy 2020, 272, 115254. [Google Scholar] [CrossRef]
- Nelson, J.; Johnson, N.G.; Fahy, K.; Hansen, T.A. Statistical development of microgrid resilience during islanding operations. Appl. Energy 2020, 279, 115724. [Google Scholar] [CrossRef]
- Wnag, Y.; Rousis, A.O.; Strbac, G. Resilience-driven optimal sizing and pre-positioning of mobile energy storage systems in decentralized networked microgrids. Appl. Energy 2022, 305, 117921. [Google Scholar] [CrossRef]
- Yin, X.; Lei, M. Jointly improving energy efficiency and smoothing power oscillations of integrated offshore wind and photovoltaic power: A deep reinforcement learning approach. Prot. Control Mod. Power Syst. 2023, 8, 25. [Google Scholar] [CrossRef]
- Yin, X.; Jiang, Z. A novel continuously variable-speed offshore wind turbine with magnetorheological transmission for iotimal power extraction. Energy Resour. Part A Recovery Util. Environ. Eff. 2023, 45, 6869–6884. [Google Scholar] [CrossRef]
- Wang, J.; Yin, X.; Liu, Y.; Cai, W. Optimal design of combined operations of wind power-pumped storage-hydrogen energy storage based on deep learning. Electr. Power Syst. Res. 2023, 218, 109216. [Google Scholar] [CrossRef]
- Yin, X.; Zhao, Z.; Yang, W. Predictive operations of marine pumped hydro-storage towards real time offshore wind-wave power complementarity: An event-triggered MPC approach. J. Energy Storage 2023, 62, 106583. [Google Scholar] [CrossRef]
- Yin, X.; Zhao, Z.; Yang, W. Optimization cleaner productions of sustainable energies: A co-design framework for complementary operations of offshore wind and pumped hydro-storages. J. Clean. Prod. 2023, 396, 135832. [Google Scholar] [CrossRef]
- Rendroyoko, I.; Sinisuka, N.I.; Debusschere, V.; Koesrindartoto, D.P.; Yasirroni, M. Integration of solar photovoltaic plant in the eastern Sumba microgrid using unit commitment optimization. Sustainability 2024, 16, 336. [Google Scholar] [CrossRef]
- Aguilar-Mejia, O.; Minor-Popocatl, H.; Caballero-Morales, O.S.; Miranda-Perez, A.F. Effect of a storage system in a microgrid with EDR and economic dispatch considering renewable and conventional energy sources. Sustainability 2024, 16, 568. [Google Scholar] [CrossRef]
- Jiang, H.; Tjandra, R.; Soh, C.B.; Cao, S.; Soh, D.C.L.; Tan, K.T.; Tseng, K.J.; Krishnan, S.B. Digital twin of microgrid for predictive power control to buildings. Sustainability 2024, 16, 482. [Google Scholar] [CrossRef]
- Ghiasi, N.S.; Hadidi, R.; Ghiasi, S.M.; Liasi, S.G. A Hybrid Controller with Hierarchical Architecture for Microgrid to Share Power in an Islanded Mode. IEEE Trans. Ind. Appl. 2022, 59, 2202–2209. [Google Scholar] [CrossRef]
- Ghiasi, N.S.; Forouzanfar, M.; Babaei, M.; Sanjareh, M.B.; Ghiasi, S.M. Using a Multi-Functional Inverter to Connect the Distributed Generation Source to the Network with Purpose of Reducing Harmonic and Network Imbalance. In Proceedings of the 2023 8th International Conference on Technology and Energy Management (ICTEM), Babol, Iran, 8–9 February 2023; IEEE: Piscataway, NJ, USA, 2023; pp. 1–5. [Google Scholar] [CrossRef]
- Saedpanah, E.; Lahonian, M.; Abad, M.Z. Optimization of multi-source renewable energy air conditioning systems using a combination of transient simulation, response surface method, and 3E lifespan analysis. Energy 2023, 272, 127200. [Google Scholar] [CrossRef]
- Pazouki, S.; Haghifam, M.R. Optimal planning and scheduling of smart homes’ energy hubs. Int. Trans. Electr. Energy Syst. 2021, 31, e12986. [Google Scholar] [CrossRef]
- Akhavan, J.; Lyu, J.; Mahmoud, Y.; Xu, K.; Vallabh, C.K.P.; Manoochehri, S. Dataset of In-Situ Coaxial Monitoring and Print’s Cross-Section Images by Direct Energy Deposition Fabrication. Sci. Data 2023, 10, 776. [Google Scholar] [CrossRef]
- Haghifam, M.R.; Pazouki, S.; Pazouki, S. Renewables and plug in electric vehicles modeling on electricity and gas infrastructures scheduling in presence of responsive demand. In Proceedings of the 2013 3rd International Conference on Electric Power and Energy Conversion Systems, Istanbul, Turkey, 2–4 October 2013; IEEE: Piscataway, NJ, USA, 2014. [Google Scholar] [CrossRef]
- Pazouki, S.; Haghifam, M.R.; Pazouki, S. Short term economical scheduling in an energy hub by renewable and demand response. In Proceedings of the 2013 3rd International Conference on Electric Power and Energy Conversion Systems, Istanbul, Turkey, 2–4 October 2013; IEEE: Piscataway, NJ, USA, 2014. [Google Scholar] [CrossRef]
- Momeni, M.; Wu, D.C.; Razban, A.; Chen, J. Data-Driven Demand Control Ventilation Using Machine Learning CO2 Occupancy Detection Method. Available online: https://hdl.handle.net/1805/27623 (accessed on 11 October 2023).
- Mehdizadeh, G.; Nikoo, M.R.; Talebbeydokhti, N.; Vanda, S.; Nematollahi, B. Hypolimnetic aeration optimization based on reservoir thermal stratification simulation. J. Hydrol. 2023, 625, 130106. [Google Scholar] [CrossRef]
- Heidari, M.; Soleimani, A.; Dzikuć, M.; Heidari, M.; Dolatabadi, S.H.; Kuryło, P.; Khan, B. Exploring synergistic ecological and economic energy solutions for low-urbanized areas through simulation-based analysis. AIMS Energy 2024, 12, 119–151. [Google Scholar] [CrossRef]
- Moradi, M.; Weng, Y.; Lai, Y.C. Defending Smart Electrical Power Grids against Cyberattacks with Deep Q-Learning. PRX Energy 2022, 1, 033005. [Google Scholar] [CrossRef]
- Amiraslanpour, M.; Ghazanfarian, J.; Nabaei, H.; Taleghani, M.H. Evaluation of laminar airflow heating, ventilation, and air conditioning system for particle dispersion control in operating room including staffs: A non-Boussinesq Lagrangian study. J. Build. Phys. 2021, 45, 236–264. [Google Scholar] [CrossRef]
- Alinejad, M.; Rezaei, O.; Habibifar, R.; Azimian, M. A charge/discharge plan for electric vehicles in an intelligent parking lot considering destructive random decisions, and V2G and V2V energy transfer modes. Sustainability 2022, 14, 12816. [Google Scholar] [CrossRef]
- Dallali, A.; Khayat, M.; Bahadori, N. Experimental Investigation of Pool Boiling Characteristics on Microstructured Surface in the Presence of MW-CNT with Hybrid-Base Nanofluids. Int. J. Thermophys. 2021, 42, 162. [Google Scholar] [CrossRef]
- Habibifar, R.; Saber, H.; Gharigh, M.R.; Ehsan, M. Planning framework for BESSs in microgrids (MGs) using linearized AC power flow approach. In Proceedings of the 2018 Smart Grid Conference (SGC), Sanandaj, Iran, 28–29 November 2018; IEEE: Piscataway, NJ, USA, 2019; pp. 1–7. [Google Scholar] [CrossRef]
- Ghiasi, N.S.; Ghiasi, S.M.; Hadidi, R. Stochastic Seasonal Planning of DG-Based Smart Grid and Energy Hub by Considering Demand Response Program and Environmental Impacts. In Proceedings of the 2023 11th International Conference on Smart Grid (icSmartGrid), Paris, France, 4–7 June 2023; IEEE: Piscataway, NJ, USA, 2023; pp. 1–6. [Google Scholar] [CrossRef]
- Zolfaghary pour, S.; Khavasi, A.; Rejaei, B. Design and Fabrication of a Polarization-Independent Millimeter-Wave Absorber Using Circuit Theory and 3D Printing. J. Electron. Mater. 2024, 53, 525–534. [Google Scholar] [CrossRef]
- Pervukhin, D.; Davardoost, H.; Kotov, D.; Ilyukhina, Y.; Hasanov, K. A sustainable development goals-based mathematical model for selecting oil and gas investment projects under uncertainty and limited resources. Adv. Math. Models Appl. 2023, 8, 502. [Google Scholar]
- Kashani, S.A.; Soleimani, A.; Khosravi, A.; Mirsalim, M. State-of-the-art research on wireless charging of electric vehicles using solar energy. Energies 2022, 16, 282. [Google Scholar] [CrossRef]
- Zolfaghary pour, S.; Chegini, E.; Mighani, M. Design of wideband metamaterial absorber using circuit theory for X-band applications. IET Microw. Antennas. Propag. 2023, 17, 292–300. [Google Scholar] [CrossRef]
- Zandi, J.; Afooshteh, A.N.; Ghassemian, M. Implementation and analysis of a novel low power and portable energy measurement tool for wireless sensor nodes. In Proceedings of the Electrical Engineering (ICEE), Iranian Conference on, Mashhad, Iran, 8–10 May 2018; IEEE: Piscataway, NJ, USA, 2018; pp. 1517–1522. [Google Scholar] [CrossRef]
- Razmi, S.F.; Torki, L.; Razmi, S.M.; Dowlatabadi, E.M. The indirect effects of oil price on consumption through assets. Int. J. Energy Econ. Policy 2022, 12, 236. [Google Scholar] [CrossRef]
- Saghafian, M.; Seyedzadeh, H.; Moradmand, A. Numerical Simulation of Electroosmotic Flow in a Rectangular Microchannel with Use of Magnetic and Electric Fields. Sci. Iran. 2023. [Google Scholar] [CrossRef]
- Foroughi, M.; Pasban, A.; Moeini-Aghtaie, M.; Fayaz-Heidari, A. A bi-level model for optimal bidding of a multi-carrier technical virtual power plant in energy markets. Int. J. Electr. Power Energy Syst. 2021, 125, 106397. [Google Scholar] [CrossRef]
- Omidi, A.; Mohammadshahi, A.; Gianchandani, N.; King, R.; Leijser, L.; Souzas, R. Unsupervised Domain Adaptation of MRI Skull-Stripping Trained on Adult Data to Newborns. In Proceedings of the IEEE/CVF Winter Conference on Applications of Computer Vision, Waikoloa, HI, USA, 4–8 January 2024; pp. 7718–7727. [Google Scholar]
- Hosseini Dolatabadi, S.H.; Soleimani, A.; Maghanaki, M.; Ilinca, A. Enhancing Photovoltaic Farm Capacity Estimation: A Comprehensive Analysis with a Novel Approach. Energy Technol. 2023, 2301294. [Google Scholar] [CrossRef]
- Homaee, O.; Kazempour, A.; Gholami, A. Investigation of the Impacts of the Refill Valve Diameter on Prestrike Occurrence in Gas Circuit Breakers. Phys. Fluids 2021, 33, 087120. [Google Scholar] [CrossRef]
- Larijani, A.; Dehghani, F. A Computationally Efficient Method for Increasing Confidentiality in Smart Electricity Networks. Electronics 2023, 13, 170. [Google Scholar] [CrossRef]
- Zhu, Z.; Nadimi, E.; Asadollahzadeh, M.; Bahari, M.; Zare Malek Abad, M.; Aliehyaei, M. Investigation into the Effect of Multiple Line Dipoles Magnetic Field through LS-3 Parabolic Trough Solar System. Appl. Therm. Eng. 2023, 235, 121332. [Google Scholar] [CrossRef]
- Kazerouni, A.; Heydarian, A.; Soltany, M.; Mohammadshahi, A.; Omidi, A.; Ebadollahi, S. An intelligent modular real-time vision-based system for environment perception. arXiv 2023, arXiv:2303.16710. [Google Scholar]
- Bodaghi, M.; Esmailpour, K.; Refahati, N. Feasibility study and thermoeconomic analysis of cooling and heating systems using soil for a residential and greenhouse building. arXiv 2023, arXiv:2304.05507. [Google Scholar]
- Larijani, A.; Dehghani, F. An Efficient Optimization Approach for Designing Machine Models Based on Combined Algorithm. FinTech 2023, 3, 40–54. [Google Scholar] [CrossRef]
- Ghiasi, N.S.; Hadidi, R.; Ghiasi, S.M.; Liasi, S.G. A control scheme based on virtual impedance and droop control to share power in an island microgrid. In Proceedings of the 2022 IEEE/IAS 58th Industrial and Commercial Power Systems Technical Conference (I&CPS), Las Vegas, NV, USA, 2–5 May 2022; IEEE: Piscataway, NJ, USA, 2022; pp. 1–7. [Google Scholar] [CrossRef]
- Mehdizadeh Khorrami, B.; Soleimani, A.; Pinnarelli, A.; Brusco, G.; Vizza, P. Forecasting heating and cooling loads in residential buildings using machine learning: A comparative study of techniques and influential indicators. Asian J. Civ. Eng. 2023, 25, 1163–1177. [Google Scholar] [CrossRef]
- Fazlhashemi, S.S.; Sedighizadeh, M.; Khodayar, M.E. Day-ahead energy management and feeder reconfiguration for microgrids with CCHP and energy storage systems. J. Energy Storage 2020, 29, 101301. [Google Scholar] [CrossRef]


| CCHP | AB | WT | |||
|---|---|---|---|---|---|
| Size | Parameter | Size | Parameter | Size | Parameter |
| 0 | (kW) | 0 | (kW) | 1500 | (USD/kW) |
| 633 | (kW) | 350 | (kW) | 400 | (kW) |
| 0 | (kW) | 0.8 | (%) | 0.13 | (Percent/year) |
| 700 | (kW) | BESS | 0.2 | (%) | |
| 0.09 | (m3/kWh) | Size | Parameter | 20 | (year) |
| 0.15 | (USD/m3) | 1775 | (USD/kW) | 0.05 | (USD/kWh) |
| 0.3 | (%) | 1200 | (kW) | 400 | (kW) |
| 3674 | (USD/kW) | 200 | (kW) | 12 | (m/s) |
| 633 | (kW) | 200 | (kW) | 25 | (m/s) |
| 0.13 | (Percent/year) | 0.25 | (%) | 3.5 | (m/s) |
| 0.2 | (%) | 120 | (kWh) | PV panel | |
| 10 | (year) | 1200 | (kWh) | Size | Parameter |
| 0.0039 | (USD/kWh) | 0.85 | (%) | 6675 | (USD/kW) |
| 0.9 | (%) | 0.95 | (%) | 400 | (kW) |
| 14.45 | ER (kg/kWh) | 25 | (year) | 0.13 | (Percent/year) |
| TESS | 0.13 | (Percent/year) | 0.25 | (%) | |
| 0.05 | (USD/kWh) | 20 | (year) | ||
| Size | Parameter | CB | 0.05 | (USD/kWh) | |
| 1800 | (USD/kW) | Size | Parameter | 18.6 | (%) |
| 1200 | (kW) | 9 | (USD/kW) | 40 | (m2) |
| 0.95 | (%) | 400 | (kW) | Grid | |
| 0.95 | (%) | 0.13 | (Percent/year) | Size | Parameter |
| 120 | (kWh) | 0.2 | (%) | 0.95 | (v) |
| 1200 | (kWh) | 25 | (year) | 1.05 | (v) |
| 0.25 | (%) | 0.05 | (USD/kWh) | 5.46 | (kg/kWh) |
| 200 | (kW) | ||||
| 200 | (kW) | ||||
| 25 | (year) | ||||
| 0.05 | (USD/kWh) | ||||
| 0.13 | (Percent/year) | ||||
| Size | Parameter | Size | Parameter |
|---|---|---|---|
| 60 | Number of members | 1 | Probability of crossover |
| 100 | Number of iterations | 0.04 | Probability of mutation |
| Hour Mean Values of Variables | Hour | ||||
|---|---|---|---|---|---|
| Objective Function (USD) | Power Loss (kW) | Pollution (kg) | Outage Cost (USD) | Operating Cost (USD) | |
| 1482.7 | 22.46 | 1.89 | 1229.4 | 200.8 | 1 |
| 1483.83 | 23.12 | 1.85 | 1229.4 | 200.8 | 2 |
| 1516.7 | 22.12 | 1.85 | 1259.4 | 205.7 | 3 |
| 1516.7 | 22.12 | 1.85 | 1259.4 | 205.7 | 4 |
| 1788.3 | 29.63 | 1.95 | 1482.3 | 242.1 | 5 |
| 1747 | 29.87 | 1.97 | 1446.3 | 236.2 | 6 |
| 1692.4 | 34.99 | 2.32 | 1389.7 | 226.9 | 7 |
| 1678 | 34.84 | 2.30 | 1377.7 | 225 | 8 |
| 2116.9 | 45.37 | 2.65 | 1258.6 | 763.7 | 9 |
| 2448.5 | 45.37 | 2.65 | 1114.6 | 1239.3 | 10 |
| 2645.7 | 52.12 | 2.85 | 1208.1 | 1330.9 | 11 |
| 2611 | 52.65 | 2.87 | 1190.1 | 1313.2 | 12 |
| 2535.8 | 66.89 | 3.12 | 1515 | 889.3 | 13 |
| 3004 | 66.79 | 3.04 | 1377 | 1496.4 | 14 |
| 1749.9 | 39.94 | 2.33 | 919.2 | 747.5 | 15 |
| 1829.3 | 39.94 | 2.33 | 967.2 | 778.9 | 16 |
| 1470.3 | 30.10 | 2.01 | 948.3 | 456.7 | 17 |
| 1481.3 | 30.43 | 2.02 | 1002.3 | 413.1 | 18 |
| 2160.6 | 45.11 | 2.52 | 1558.6 | 509.1 | 19 |
| 1878.1 | 45.19 | 2.54 | 1234.6 | 550.3 | 20 |
| 1511.6 | 31.12 | 2.12 | 870.3 | 573.4 | 21 |
| 1533.7 | 33.87 | 2.21 | 990.3 | 470.4 | 22 |
| 1637.1 | 30.63 | 2.04 | 1350.3 | 220.5 | 23 |
| 1634.3 | 29.63 | 1.91 | 1350.3 | 220.5 | 24 |
| 300–150–220 | Capacity of Capacitors (kVAr) | ||||
| Iteration of Convergence | Objective Function | Condition Change | Sample |
|---|---|---|---|
| 44 | 45,154.4 | - | Base |
| 25 | 45,154.4 | Increase the members to 120 | 1 |
| 44 | 45,154.4 | Increase the iterations to 200 | 2 |
| 51 | 45,157.2 | Increase in mutation probability to 0.08 | 3 |
| 34 | 45,155.9 | Decrease in crossover probability to 0.9 | 4 |
| Hour Variables’ Mean Values | Hour | ||||
|---|---|---|---|---|---|
| Objective Function (USD) | Power Loss (kW) | Pollution (kg) | Outage Cost (USD) | Operating Cost (USD) | |
| 1075.5 | 22.22 | 2.34 | 749.4 | 269.4 | 1 |
| 1075.6 | 23.01 | 2.23 | 749.4 | 269.4 | 2 |
| 1112 | 22.02 | 2.53 | 779.4 | 274.3 | 3 |
| 1108.8 | 22.02 | 2.21 | 779.4 | 274.3 | 4 |
| 1377.3 | 29.43 | 2.02 | 1002.3 | 310.7 | 5 |
| 1405.4 | 29.55 | 2.02 | 1026.3 | 314.6 | 6 |
| 1423.6 | 34.67 | 2.67 | 1029.7 | 315.1 | 7 |
| 1410.2 | 34.45 | 2.76 | 1017.7 | 313.2 | 8 |
| 2117.9 | 45.21 | 2.77 | 1258.6 | 763.7 | 9 |
| 2683.7 | 45.17 | 2.44 | 1234.6 | 1356.9 | 10 |
| 2876.9 | 52.02 | 2.23 | 1328.1 | 1448.5 | 11 |
| 2841.9 | 52.43 | 2.23 | 1310.1 | 1430.8 | 12 |
| 2526.4 | 66.67 | 2.21 | 1515 | 889.3 | 13 |
| 3231.2 | 66.66 | 2.02 | 1497 | 1614 | 14 |
| 1945.8 | 39.77 | 2.11 | 1039.2 | 825.9 | 15 |
| 1926.2 | 39.76 | 2.13 | 1027.2 | 818.1 | 16 |
| 1315.9 | 30.01 | 2.51 | 828.3 | 417.5 | 17 |
| 1348.1 | 30.21 | 2.51 | 852.3 | 425.4 | 18 |
| 1829.8 | 45.02 | 2.51 | 1198.6 | 538.5 | 19 |
| 1875.9 | 45.04 | 2.34 | 1234.6 | 550.3 | 20 |
| 1696.6 | 31.01 | 2.76 | 990.3 | 632.2 | 21 |
| 1535.7 | 33.65 | 2.45 | 990.3 | 470.4 | 22 |
| 1368.9 | 30.33 | 2.44 | 990.3 | 308.7 | 23 |
| 1366.4 | 29.33 | 2.34 | 990.3 | 308.7 | 24 |
| 300–150–220 | Capacity of Capacitors (kVAr) | ||||
| Iteration of Convergence | Objective Function | Condition Change | Sample |
|---|---|---|---|
| 39 | 42,476.8 | - | Base |
| 31 | 42,476.8 | Increase the members to 120 | 1 |
| 39 | 42,476.8 | Increase the iterations to 200 | 2 |
| 47 | 42,479.2 | Increase in mutation probability to 0.08 | 3 |
| 53 | 42,481.5 | Decrease in crossover probability to 0.9 | 4 |
| Power Loss (kW) | Pollution (kg) | Operating and Outage Cost (USD) | Point Number |
|---|---|---|---|
| 898.55 | 56.93 | 40,552.34 | 1 |
| 899.08 | 56.81 | 40,554.76 | 2 |
| 899.66 | 56.78 | 40,558.12 | 3 |
| 899.98 | 56.43 | 40,561.31 | 4 |
| 900.43 | 56.12 | 40,563.22 | 5 |
Disclaimer/Publisher’s Note: The statements, opinions and data contained in all publications are solely those of the individual author(s) and contributor(s) and not of MDPI and/or the editor(s). MDPI and/or the editor(s) disclaim responsibility for any injury to people or property resulting from any ideas, methods, instructions or products referred to in the content. |
© 2024 by the authors. Licensee MDPI, Basel, Switzerland. This article is an open access article distributed under the terms and conditions of the Creative Commons Attribution (CC BY) license (https://creativecommons.org/licenses/by/4.0/).
Share and Cite
Azarinfar, H.; Khosravi, M.; Sabzevari, K.; Dzikuć, M. Stochastic Economic–Resilience Management of Combined Cooling, Heat, and Power-Based Microgrids in a Multi-Objective Approach. Sustainability 2024, 16, 1212. https://doi.org/10.3390/su16031212
Azarinfar H, Khosravi M, Sabzevari K, Dzikuć M. Stochastic Economic–Resilience Management of Combined Cooling, Heat, and Power-Based Microgrids in a Multi-Objective Approach. Sustainability. 2024; 16(3):1212. https://doi.org/10.3390/su16031212
Chicago/Turabian StyleAzarinfar, Hossein, Mohsen Khosravi, Kiomars Sabzevari, and Maciej Dzikuć. 2024. "Stochastic Economic–Resilience Management of Combined Cooling, Heat, and Power-Based Microgrids in a Multi-Objective Approach" Sustainability 16, no. 3: 1212. https://doi.org/10.3390/su16031212
APA StyleAzarinfar, H., Khosravi, M., Sabzevari, K., & Dzikuć, M. (2024). Stochastic Economic–Resilience Management of Combined Cooling, Heat, and Power-Based Microgrids in a Multi-Objective Approach. Sustainability, 16(3), 1212. https://doi.org/10.3390/su16031212