Abstract
Urban resilience provides the foundation and guarantee for the tourism economy, and the development of the tourism industry provides new opportunities and impetus for urban resilience. The coordinated development of urban resilience (UR) and the tourism economy (TE) contributes to the high-quality development of the regional economy. This study takes 27 cities in the Yangtze River Delta (YRD) urban agglomeration as an example. Various analytical techniques, including the entropy method, coupling coordination degree model (CCDM), kernel density estimation, Theil index, and obstacle degree model, are employed to investigate the spatiotemporal evolution patterns and influencing factors that affect the coupling coordination degree (CCD) between UR and TE. The findings indicate that: (1) The urban resilience and tourism economy exhibited an increasing trend denoted by “N” and “M”, respectively. (2) The coupling coordination level has undergone a development phase of “Moderate disorder–Bare coordination–Moderate disorder”. (3) The level of coordination has been enhanced, with intra-regional differences identified as the primary source of variation. (4) The number of Internet users, the number of students in institutions of higher learning, per capita public financial expenditure, science and technology expenditures as a share of fiscal expenditures, urban per capita disposable income, foreign exchange earnings from tourism, and the number of inbound tourists is the main factors affecting the CCD of urban resilience and tourism economy.
1. Introduction
Urban resilience (UR) is the manifestation of the concept of resilience in urban systems. It is used to describe the ability of complex urban systems to withstand, recover from, and adapt to disasters and other disturbances [1]. The 2015 United Nations Summit on Sustainable Development identified “inclusive, safe, resilient and sustainable cities” as a key issue for sustainable development in 2030 [2]. The “Fourteenth Five-Year Plan” for 2020 also proposes the construction of resilient cities, signifying that such cities have transitioned from being a subject of theoretical academic research to being a national strategy. Currently, China is undergoing a crucial period of transition in its development, characterized by heightened internal and external risks, as well as a significant level of complexity and vulnerability in its urban system. Enhancing UR is one of the goals of urban security, which provides a solid guarantee for the high-quality development of cities. Resilient cities have gained wide consensus as a path choice in the process of solving the problem of sustainable urban development. The investigation of UR is a markedly multi-disciplinary subject involving a range of disciplines, such as physics [3], urban planning [4], disaster science [5], and geography [6].
Contemporary research on UR focuses on theory, empirical evidence, and policy [7]. The definition of UR differs between national and international researchers. UR is a concept that is widely discussed. Despite its complexity and diversity, there exist varying definitions and understandings regarding UR among scholars of different disciplinary backgrounds and research perspectives [8]. Some researchers have defined UR as the capacity of cities to promptly adjust, recuperate, and enhance their stability and sustainability when confronted with different shocks and stresses. This perspective emphasizes the capacity of cities to effectively manage emergencies and recover swiftly from disasters [5]. Other scholars understand UR as the ability of cities to resist and adapt to a wide range of stresses, including natural disasters, climate change, economic crises, social tensions, etc., emphasizing the balance between vulnerability and adaptability of cities [9]. Some academics conceive of UR as a comprehensive attribute of urban systems, encompassing various dimensions of urban society, economy, environment, and governance. It underscores the intricate nature and interdependencies within urban systems [10]. Additionally, scholars have linked UR to sustainable development, asserting that it is a crucial element in accomplishing sustainable development goals [11,12]. Cities are intricate networks that necessitate expertise from diverse disciplines and stakeholders [13]. A comprehensive understanding and enhancement of UR can be attained through the adaptable application of diverse definitions and perspectives in research and practice [14].
Scholars have researched indicator evaluation systems and are now primarily concentrating on mitigating and preventing natural disasters [15], climate change [16], urban governance, and planning for UR [17,18]. Currently, constructing a multi-dimensional composite indicator system is the most widespread approach to gauge UR. However, due to variations in the dimensions of UR assessment, the topics of concern, and data availability in different studies, constructed indicator systems may differ. UR assessment typically focuses on a combination of social, economic, ecological, and environmental dimensions [1]. Manyena develops a holistic indicator system for community disaster resilience, incorporating elements such as social capital, economic capital, physical capital, human capital, and natural capital [19]. Cutter utilized Ecological, Social, Economic, Institutional, Infrastructure, and Community competence as indicators of community resilience. Based on these indicators, he created the Disaster Resilience of Places (DROP) model to assess community resilience to natural disasters, highlighting the correlation between vulnerability and resilience [20]. Admiraal examines the impact of underground space and its usage on the resilience of urban settings across various dimensions—health and well-being, economy and society, infrastructure and environment, and leadership and strategy [21]. Ostadtaghizadeh constructed an index system from five dimensions—social, economic, institutional, physical, and natural—to evaluate the community’s resilience to disaster [22]. Cutter created a framework of social, economic, institutional, infrastructure, and community indicators for examining the disaster resilience of counties in the southeastern region of the United States [23]. By developing an index system based on various dimensions to assess UR, we can not only gain a deeper understanding of the composition and influencing factors of UR but also provide useful references for urban decision-making and management and promote sustainable development and adaptability of cities.
In the selection of evaluation methods, the existing research mainly adopts qualitative methods, quantitative methods, or a combination of both methods. The qualitative evaluation of UR relies on the evaluator’s observations and practical experience with cities. When describing an indicator, the evaluator considers its best or worst achievable state, which helps to score the indicator’s reality from a subjective perspective [24]. The primary evaluation methods entail questionnaire surveys and case studies [25]; The quantitative methods are Entropy method [26], TOPSIS [27], AHP [28], Grey correlation degree [29], Data Envelopment Analysis [30], System Dynamics Model [31], BP neural network [32], Obstacle factor [33], Exploratory spatial data analysis [34], geographic detector [35]; The combination of qualitative and quantitative methods mainly includes Delphi method [36] and RMM model [37]. The application of these methods can provide a scientific, systematic, and objective assessment of UR, help identify UR issues and potential, guide urban planning and development, and promote the development of cities in a more resilient and sustainable direction.
Currently, scholarly research primarily centers on the interplay and coordination between UR and urbanization, capturing their intricate relationship [38], land use [39], quality development [40], transport infrastructure [41], and subsystems of urban agglomerations [42], As research on UR becomes increasingly specific, scholars are now discussing the development of tourism from a resilience perspective due to the inherent limitations of tourism itself. This includes analyzing the resilience of the tourism economy (TE) in urban agglomerations [43], assessing the resilience of tourism enterprises during disasters [44], constructing a sustainable framework for tourism destinations based on resilience principles [45], and examining the resilience of regional tourism environment systems [46]. The study on tourism resilience is gradually deepening alongside significant growth in this sector. Furthermore, research on the interaction between tourist city development and the economy is also maturing. However, current scholarly research tends to prioritize the analysis of vulnerability rather than focusing on the interconnections between UR and the TE [47]. UR provides a dependable assurance for propelling the high-quality growth of the urban tourism industry, and a resolute correlation exists between UR and TE [48]. The level of resilience of a city has a direct effect on the scale and effectiveness of tourism. Cities with high levels of resilience illustrate flexibility, adaptability and resilience with regards to economy, infrastructure, community involvement, risk management, innovation capability and sustainable advancement. Such cities can cope with and recover from different challenges and unexpected events and ensure high-quality tourism development [49]. Simultaneously, the development of tourism necessitates the provision of steadfast, secure, and superior infrastructure and services by the city. To meet the demands of tourism, urban areas will have to strengthen infrastructure construction, improve tourism support facilities, improve the level of urban services, and enhance the adaptability and resilience of the city. These initiatives can meet the needs of the tourism industry, as well as fortify the city against potential risks. In addition, the prosperity of tourism can provide the city with the power and resources for economic development. The development of tourism has promoted the city’s economic diversification and innovation ability, increased the city’s fiscal revenue and employment opportunities, and improved the city’s anti-risk ability and adaptability. This economic growth can provide assurance and resources to construct UR. Hence, researching the coupling and coordination relationship between UR and TE is not only conducive to the accumulation and development of theory, but can also guide tourism planning and urban construction in practice, and promote the sustainable development of tourism and regional coordinated development. At the same time, it can also cope with risks and challenges, improve the resilience and adaptability of cities and tourism, and achieve more sustainable and stable urban development.
Focusing on the YRD urban agglomeration as our study area, this essay develops an assessment framework for the UR and TE. We analyze the coupling of the two systems between 2007 and 2021 using the CCDM, kernel density estimation, and Theil index. Our investigation examines the spatial and temporal progression as well as spatial disparities. The obstacle degree model analyses the factors that influence the coupling and coordinated development of UR and TE. This study aims to establish a theoretical framework and offer decision-making recommendations that can facilitate the sustainable development of the urban agglomeration in the YRD.
2. Research Method and Data
2.1. Overview of the Study Area
As shown in Figure 1, the YRD urban agglomeration, as the largest and most economically developed urban agglomeration in China, stands out as one of the most comprehensive and academically significant ones in the country. The YRD city cluster spans Shanghai Municipality, Jiangsu, Zhejiang, and Anhui provinces. The region boasts a robust economy, contributing to roughly a quarter of the nation’s economic output [50]. It is situated along the eastern coastline and benefits from a favorable ecological environment. The region carries the responsibility of “one pole, three regions, and one highland”. It is worth noting that leading urban economic centers within the region are leading the way in urban disaster management across the country. By 2021, the YRD is set to boast 54 national 5A-level scenic spots, which account for 17.65% of the nation’s total. Additionally, there are 247 five-star hotels, comprising 29.23% of the country’s total. The tourism sector also attained an impressive total revenue of 2.43 trillion yuan and received 1.64 billion tourists from both domestic and foreign origins [51,52]. The YRD has favorable conditions and promising potential for the tourism industry, and its abundant tourism resources, excellent tourism infrastructure, and proactive cooperation mechanisms have laid a solid foundation for the region’s tourism industry. Promoting tourism in the YRD can improve economic diversification and reduce over-dependence on specific industries. As well as promoting resilient urban governance, it also poses challenges for urban management and planning. Enhancing UR in the YRD can improve the resilience of the tourism industry. In recent years, the YRD region has continuously promoted regional integration and strengthened interconnection, coordination, and cooperation among cities. This model of integrated development is of great significance for coordinating resilience and the TE. Examining the resilience of the urban agglomeration in the YRD and exploring its coupling and coordination with the TE can offer valuable theoretical and practical insights for regional integration and development. Additionally, the YRD urban agglomeration, known for its intense industrial activity, substantial population movement, and densely populated areas, has encountered significant obstacles in tourism development and overall urban advancement due to the unexpected outbreak of COVID-19. Hence, choosing the YRD urban agglomeration as a research subject holds significant representative importance.
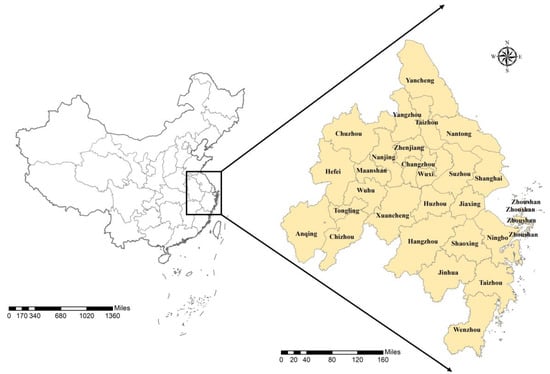
Figure 1.
Location map of the YRD urban agglomeration.
2.2. Data Sources
The research data were primarily obtained from the China Urban Statistical Yearbook, Shanghai Statistical Yearbook, Jiangsu Statistical Yearbook, Zhejiang Statistical Yearbook, Anhui Statistical Yearbook, and Statistical Yearbook of prefecture-level cities in the YRD urban agglomeration, as well as the statistical bulletin of national economic and social development from 2008 to 2022. Any missing data were completed using the linear interpolation method.
2.3. Index Construction
The establishment of a UR indicator system is derived from the understanding and essence of UR as defined both domestically and internationally. This is achieved by referring to the research results of relevant scholars [6,21,53,54]. A total of 20 indicators are screened across four dimensions: economic resilience, social resilience, environmental resilience, and infrastructure resilience.
- (1)
- Economic resilience: the PCGDP serves as an indicator of the macro-economic foundation of a city, and a higher value indicates a stronger capacity for economic resilience and resistance to external risks and disturbances. The PCPFE reflects the city’s ability to guarantee emergency resources, and a higher value means that the government will invest more in public services, infrastructure, economic incentives, and social security, which can improve the quality of life of urban residents and enhance the city’s economic resilience; The UPCDI reflects the economic prosperity of a city and its residents’ capacity for consumption. A higher value can promote economic growth, expand market demand, and increase the economic resilience of cities. The TS/GDP reflects the transformation and development direction of the urban economic structure, as well as the industrial diversity of the city. A higher value usually means that a city’s economic development is more mature and diversified and has stronger economic resilience. The STE/FE reflects a city’s focus on innovation in science and technology, as well as its commitment to industrial transformation and upgrading, along with the level of policy support. A higher value indicates a more scientific approach to economic development, stronger industrial and market competitiveness, and an enhanced ability to attract investment and withstand risks.
- (2)
- Social resilience: the NSIHL reflects the residents’ skill literacy and risk cognition ability. A higher value means that the city attaches more importance to higher education, which helps to train more high-quality talents, improve the social and cultural quality and development level of the city, and enhance its social resilience. The NPP reflects the health protection of the urban population, and a higher value means that the city has a better supply capacity and coverage of medical resources, which has a positive impact on the social resilience of the city. The URUR reflects the relationship between supply and demand in the urban job market. A lower value indicates better operation of the urban labor market, optimal utilization of labor resources, and increased social stability within the city. The IU number is indicative of the level of information technology adoption and the progress of the digital economy within a city. The higher the number, the stronger the city’s social resilience in digitization and informatization, which helps to improve the innovation ability and flexibility of the city. The PD reflects the size of the urban population and the efficiency of space utilization. A moderate PD can promote the prosperity of the urban economy and social exchanges, enhance the quality of life and happiness of urban residents, and improve the city’s resilience and adaptability in times of crisis.
- (3)
- Ecological resilience: the PAPC reflects the ecological self-purification ability, and the higher the value, the more abundant and sufficient park and green space resources in the city; The GCBUA reflects the degree of ecological coordinated development, and the higher the value, the more green space and vegetation coverage ratio in urban built-up areas; The IWD and ISO2E reflect urban environmental pollution, and the higher the value, the lower the ecological toughness of the city; The HTDW reflects urban environmental governance, which means that the city effectively manages and treats domestic waste.
- (4)
- Infrastructure resilience: the URAPC reflects urban transport infrastructure and road carrying capacity; The DDPBUA reflects the degree of urban drainage system perfection and disaster resistance; The GPR reflects the level of urban energy supply and infrastructure development; The NBP reflects the level of investment and development of the city’s public transport system; The PCDWC reflects the utilization and consumption of water resources by urban residents.
The establishment of a tourism development index system draws on the findings of Weng et al. [55] and Wang et al. [56]. The selected four index systems reflect the standard of tourism economic growth across two dimensions: tourism scale and tourism efficiency. The comprehensive index system can be viewed in Table 1.

Table 1.
Comprehensive evaluation index of UR and TE.
2.4. Methods
2.4.1. Entropy Method
The entropy method is employed to assign weights to each indicator, taking into account the varying significance of these indicators in the overall assessment. The entropy weight method calculates the entropy and weight of each index and multiplies them to give the entropy weight, which is then normalized for comparison and ranking. This method can assist decision-makers in objectively assessing the significance of each indicator and making decisions based on its importance. The calculation of the entropy weight was performed using STATA Statistics for Windows, version 17.0. The following steps were taken [57,58]:
- Standardized processing of raw data
Standardization process:
where pij represents the standardized value of the jth indicator for the ith evaluation object.
- 2.
- Calculate the information entropy of evaluation indicators
- 3.
- Calculate the entropy weight of evaluation indicators
- 4.
- Calculate the comprehensive grade of each city
2.4.2. Coupling Coordination Degree Model (CCDM)
Coupling refers to the state in which two or more entities are interconnected or mutually impact each other. The CCDM is utilized to compute the level of coordination between UR and TE, therefore indicating the extent of integration between the two. Coupling degree (C) as an indicator, the rationality of its interpretation depends on the characteristics of its distribution. With reference to existing literature [59,60], the CCDM is established as follows:
In this formula, U1 represents a comprehensive score of UR, U2 represents a comprehensive score of TE, and the coupling degree, denoted as C, is represented on a scale from 0 to 1, indicating the level of interconnection between entities. The coupling coordination degree, referred to as D, also ranges from 0 to 1 and reflects the extent of harmonious interaction among the interconnected entities; T is the comprehensive development evaluation index of UR and TE. This paper holds that UR and TE are equally important; thus, the value was selected as α = β = 1/2. According to relevant research [39,61,62], The division of C and D is shown in Table 2 and Table 3.
Table 2.
Coupling stage division table.
Table 3.
CCD division standard.
2.4.3. Kernel Density Estimation
In this study, the distribution of UR and tourism economic development level in YRD city clusters is analyzed using the kernel density estimation method. The following formula is used:
In the formula, k (▪) is the kernel function, n is the number of observations, x is the mean value, xi is the independent equally distributed observation value, and h is the bandwidth. In this study, the Gaussian kernel function is used to estimate the kernel density of space.
2.4.4. Theil Index and Decomposition
The Theil index is a measure of inequality frequently used in economics and sociology to assess the extent of inequality in the allocation of a given resource (such as income or wealth) between individuals in a society or economy. The Thiel index is utilized in this study to examine the development disparities of the coupling coordination level within and between areas of the urban agglomerations in the YRD. The research measures the overall distinctions and the intra-regional and inter-regional differences and contribution rates of the YRD urban agglomerations. The Theil index becomes smaller as the degree of difference within or between regions decreases, and its value range is [0, 1] [63]. The specific formula is presented below:
where T, Tp, Tw, and Tb, respectively, represent the overall differential index of the YRD, the overall differential index of regional p, the intra-regional differential index, and the inter-regional differential index. In this study, Shanghai and Jiangsu Province are divided into the same region by taking into account geographical factors and data availability factors [60]. Therefore, p is 3, which refers to Jiangsu region (including Shanghai), Zhejiang region, and Anhui region, respectively; n is 27 (that is, 27 prefecture-level cities included in the YRD city cluster), np represents the number of cities in region p; yc, and ypc, respectively, represent the D value of city c, the mean value of D in the YRD urban agglomeration, the D value of city c in region p, and the mean value of D in region p.
2.4.5. Obstacle Degree Model
The obstacle degree model can identify and analyze the main obstacle factors affecting the coupling and coordination of UR and TE in the YRD urban agglomeration [64], which can provide powerful decision support for policy formulation, resource allocation, development path determination, and risk management, and promote the sustainable development of the YRD urban agglomeration and the coordinated development of TE. The obstacle degree is analyzed by factor contribution degree (Aj), index deviation degree (Ij), and obstacle degree (Oj). Refer to relevant research [65]. The formula is as follows:
3. Results
3.1. Spatial and Temporal Evolution of UR and TE Development in the YRD City Cluster
Based on the comprehensive evaluation index system of UR and TE (Table 1), this paper draws the overall and sub-regional time series change trend charts (Figure 2, Figure 3 and Figure 4) accordingly to show the resilience of the YRD city and tourism economic development of the temporal and spatial evolution characteristics more intuitively.
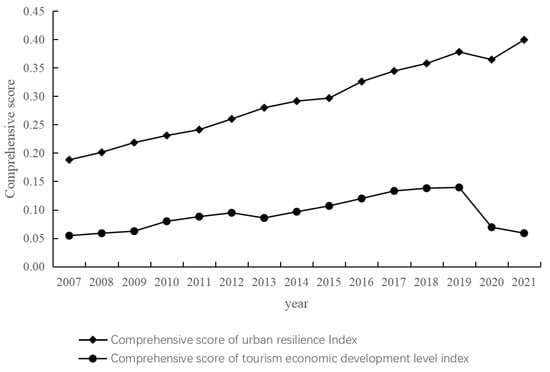
Figure 2.
Comprehensive scores of UR and TE in the YRD urban agglomeration from 2007 to 2021.

Figure 3.
Comprehensive scores of UR in each region of the YRD from 2007 to 2021.
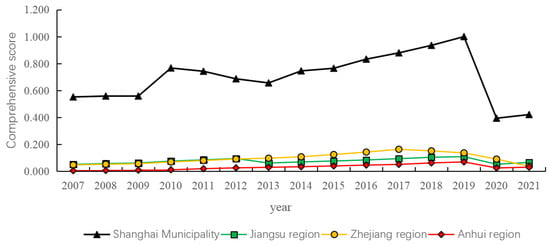
Figure 4.
Comprehensive scores of TE in each region of the YRD from 2007 to 2021.
3.1.1. Analysis of UR
As demonstrated in Figure 2, the UR of the YRD urban agglomeration displayed a consistent growth trend from 2007 until 2019, culminating in a peak. The trend took the form of a left-trailing “N” shape. The comprehensive score increased steadily from 0.188 in 2007 to 0.378 in 2019, with the largest increase in 2016, reaching 9.81%. In 2020, a notable decline occurred, but in 2021, there was a rebound, surpassing the level of UR seen in 2019. The sustainable and substantial development of the YRD region between 2007 and 2019 was primarily attributable to the backing of national policies. The State Council has released a succession of strategic papers. These include the Guiding Opinions on Further Promoting Reform and Opening Up and Economic and Social Development in the YRD Region (2008), the Regional Plan for the YRD Region (2010), the Development Plan for the YRD Urban Agglomeration (2016), and the Outline of the YRD Regional Integrated Development Plan (2019). These documents put forward the goal of cultivating a higher level of economic growth pole and building an “integrated” and “high-quality” regional urban cluster, thus promoting the UR of the YRD city cluster to steadily improve. These documents have facilitated and advanced the reform, opening up, and economic and social development of the YRD region. They have also promoted the coordinated development and connectivity of the city cluster and amplified the resilience and sustainability of the city’s development capacity. In 2016, the YRD accounted for approximately 20% of China’s total economic output. To promote the coordinated development of the YRD urban agglomeration through reform and innovation, the executive meeting of the State Council adopted the Development Plan of the YRD Urban Agglomeration. The plan encourages interconnection and coordinated industrial development among cities in the urban agglomeration. The objectives of enhancing urban infrastructure, promoting innovation, optimizing urban spatial layout, and improving urban management are proposed. The introduction of this policy has provided strong policy support for the YRD city cluster and improved the risk resistance and adaptability of the city cluster, so it has the largest growth rate this year. The rise of the integrated development of the YRD into a national strategy in 2019 further enhanced the linkage effect among urban agglomerations and cities in the YRD actively enhanced regional cooperation, promoted infrastructure construction, promoted industrial upgrading, and optimized urban planning and governance, so that UR reached its peak in 2019. The 2020 decline is largely due to the COVID-19 outbreak and subsequent global response, which triggered a public health crisis and economic recession, disrupted supply chains, and caused significant damage to the tourism industry. As a result, these factors have an adverse impact on UR. The increase in UR in 2021 and beyond, compared to that in 2019, can be primarily attributed to the accumulated experience gained from epidemic response over the course of a year, enhanced capacity for health protection, advancements in innovation and digital transformation, strengthened social security and stability measures, as well as increased international cooperation. Years of practice have proven that the YRD region possesses the capability to swiftly adapt to and recuperate from various challenges. It has made significant progress in improving its resilience to risks, which fully proves that the region has strong UR and sustained growth momentum. Furthermore, this trend indicates that the urban agglomeration of the YRD has made significant progress in terms of its economy, technology, and governance.
According to the spatial distribution pattern (Figure 3), the UR of the three provinces and one city in the YRD exhibited a fluctuating upward trend from 2007 to 2021, displaying notable regional disparities. Shanghai is far ahead in UR, while Jiangsu and Zhejiang regions have similar levels of UR development. Although Anhui’s UR showed a gradual improvement over time, it lagged behind Shanghai, Jiangsu, and Zhejiang with a relatively slower rate of enhancement, leading to an expanding gap. The spatial distribution pattern generally exhibits a gradient of high values in the eastern region and lower values in the southwest and north. From an economic resilience perspective, these cities have a diversified industrial structure and strong economies that enable them to adapt and recover from economic fluctuations. In terms of social resilience, they boast well-established social safety nets, active social organizations, and highly engaged citizens, facilitating their ability to adeptly adjust and respond to crises. With regard to ecological resilience, these cities prioritize environmental protection and sustainable development while promoting green economy initiatives and ecological restoration efforts. Simultaneously, these cities exhibit a high level of infrastructure construction with resilient transport, power, and communication networks that can sustain normal operations during emergencies. Moreover, government departments in these cities have made substantial investments in urban planning, environmental protection, disaster prevention, and emergency management, therefore fortifying urban governance and administration while bolstering the resilience of cities. The government has effectively intervened and coordinated the integration of diverse city resources, thus augmenting the city’s capacity to address risks and challenges.
3.1.2. Analysis of TE
As shown in Figure 2, The TE development level from 2007 to 2021 exhibits an “M” shaped fluctuation trend. The comprehensive score shows an increase from 0.054 in 2007 to 0.139 in 2019, reaching its pinnacle that year. Notably, the largest growth was observed in 2016, with a remarkable increase of 12.20%. However, post-2019, there has been a sharp decline in this trend, although the magnitude of the decline will be reduced by 2021. To be specific, (1) from 2007 to 2019 (excluding 2013), the tourism industry in the YRD region exhibited a consistent growth trend. This not only underscores the pivotal role of tourism in the regional economy and its positive contribution to economic development but also highlights the allure and sustainable utilization of tourism resources in this area, fostering technological innovation and market expansion. Moreover, within the context of promoting integrated development across the YRD, closer collaboration in tourism has been established among regions, facilitated by a coordinated model emphasizing extensive consultation, joint construction, and resource-sharing. This approach has effectively optimized the allocation of tourism factors between regions while enhancing mutual interests. (2) The slight decline in 2013 can be attributed to China’s economic development entering a “new normal” phase, characterized by transitioning from high-speed growth to medium-high growth and prioritizing the enhancement of development quality. Consequently, the deceleration in economic growth has exerted a certain impact on both tourism consumption demand and investment, leading to a slowdown in the pace of TE expansion. (3) The primary reason for the significant growth in 2016 is that it coincides with the first year of China’s 13th Five-Year Plan, which is a crucial period for China’s economic growth and the search for a new direction in tourism development. In 2016, China’s domestic tourism consumption experienced significant growth due to the 41 policies issued by the central government and the 54 dividend policies issued by the National Tourism Administration (NTA). The market saw new demands, the industry saw new forms, and the government introduced new initiatives. The 2016 Hangzhou Plan for the Integrated Development of YRD Regional Tourism proposes to build “a tourism destination with world competitiveness and influence”. It also promotes the transformation of YRD tourism to high-quality development. (4) The significant decline since 2019 primarily stems from the COVID-19 outbreak, which has resulted in reduced travel demand, limited travel infrastructure, heightened safety and health concerns, and decreased real travel spending due to economic instability. Despite some alleviation of the epidemic in 2021, certain restrictions and control measures persist. The Chinese government has implemented preventive and control measures to ensure public safety and health by imposing limitations on inter-provincial travel, enforcing health codes, and restricting large gatherings. Given the ongoing presence of the epidemic alongside an unstable external environment, recovery within the tourism industry is influenced by imbalances in supply and demand as well as changes in tourists’ preferences.
From the perspective of spatial distribution pattern (Figure 4), the TE exhibits a general trend of being “high in the east and low in the southwest and north”. The developmental hierarchy of the TE indicates that Shanghai > Zhejiang Province > Jiangsu Province > Anhui Province. There exists a significant regional disparity, with an expanding gap between these three provinces and one city. Among them, Shanghai, Hangzhou, and Suzhou achieved the highest overall scores with average values of 0.700, 0.281, and 0.212, respectively. Conversely, Tongling City, Chuzhou City, and Taizhou City obtained lower average scores at 0.007, 0.012, and 0.016, respectively. The untapped potential of the TE necessitates further exploration and exploitation. The main reasons are as follows: First, the disparity in economic development levels and urban scales exists among these cities. Shanghai, Hangzhou, and Suzhou are classified as megacities, megacities, and Type I megacities, respectively, with their GDP ranking among the top 10 in the country. These cities exhibit relatively robust economic strength and high per capita income levels, therefore providing a more stable foundation for tourism consumption while satisfying market demands. Consequently, city residents within these areas possess greater ability and willingness to engage in travel consumption activities, which further stimulate the growth of the TE. Second, Shanghai, Hangzhou, and Suzhou are strategically positioned in the heart of the YRD, adjacent to coastal regions. This advantageous location facilitates seamless transportation networks and fosters extensive domestic and international collaborations. Moreover, these cities boast abundant natural resources as well as a rich cultural heritage. Conversely, Tongling, Chuzhou, and Taizhou are situated further inland with comparatively limited access to both natural resources and cultural assets. Thirdly, promotion and talent team building should be emphasized. Shanghai, Hangzhou, and Suzhou can leverage the Internet and mass platforms more effectively for publicity and promotion to seize traffic opportunities and enhance visibility and image building. In contrast, Tongling, Chuzhou, and Taizhou have not fully utilized these channels, resulting in insufficient publicity of their tourism resources and characteristics, leading to limited dissemination and recognition. These cities may lack professional young talent teams specialized in tourism promotion who can adapt to the demands and trends of Internet marketing strategies. Younger teams are better equipped to engage with younger generations of visitors by providing captivating promotional content as well as immersive experiences. Considering the comprehensive spatial and temporal distribution pattern, it is evident that the development of TE in the urban agglomeration of YRD exhibits distinct spatial and temporal heterogeneity.
3.2. The Coupling and Coordination Relationship between UR and TE
Table 4 presents the C of UR and TE, along with its corresponding D. Subsequently, an investigation into the influencing factors of the CCD between UR and TE is conducted.
Table 4.
C and D index of UR and TE in the urban agglomeration of YRD from 2007 to 2021.
3.2.1. Temporal Characteristics of the CCD
The C of the YRD urban agglomeration exhibited an overall “M”-shaped growth trend from 2007 to 2021, as evident in Table 4. It increased from 0.602 in 2007 to 0.783 in 2019, reaching its peak during this period and indicating a strengthened correlation between the two systems. The overall trend in the development of CCD closely mirrors that of C, exhibiting an “M” shape with a gradual increase from 0.263 in 2007 to 0.444 in 2019, ultimately peaking in the latter year. This indicates that the degree of interconnection and coordination among the cities in the region is gradually increasing and that the cities are becoming more closely integrated into an interdependent and synergistic whole. It also indicates that the integration strategy of the YRD has yielded some results. The slight decline in both C (0.701) and D (0.352) in 2013 can primarily be attributed to China’s economic development entering a new normal period. During this phase, China’s economy has transitioned from high-speed growth to medium-high growth, with a focus on enhancing the quality and efficiency of development, reinforcing structural adjustment and innovation-driven progress, as well as achieving sustainable development. The “cliff” decline after 2019 is mainly related to the global outbreak of COVID-19. This outbreak has resulted in restrictions on tourism, disruptions in the supply chain, restricted movement of people, and increased economic uncertainty. These factors have weakened economic ties and cooperation among cities in the YRD region.
As shown in Figure 5, in terms of the coupling coordination level and development stage, the YRD urban agglomeration made significant progress in reaching a high-level coupling stage in 2019. However, due to the impact of the epidemic, it is currently in a transitional phase. The coupling coordination level has undergone a developmental progression from “Moderate disorder–Bare coordination–Moderate disorder”, with all cities emerging from a period of severe disorder since 2014.


Figure 5.
Spatial evolution pattern of UR and TE Coupling coordination in the urban agglomeration of YRD from 2007 to 2021.
3.2.2. Spatial Differentiation Characteristics of CCD
- Spatial difference state
To investigate the dynamic evolution trend of UR and tourism economic coordination level of the YRD urban agglomeration, this paper draws the kernel density map of D of the YRD as a whole, Jiangsu region (including Shanghai), Zhejiang region and Anhui region, respectively, as shown in Figure 6. The wave crest of the coupled coordination level in the YRD continues to shift towards the right, indicating a progressive annual increase in the coupled coordination level between UR and TE within this region. This finding validates the sequential nature of overall steady improvement in coordination levels across the YRD. However, the wave crest in 2021 exhibits a sharp rise and a narrowed shape, transitioning from a broad peak to a distinct peak with leftward displacement, indicating a significant impact of the global pandemic on the region during that year. The overall level of coordination has witnessed a decline. The curve exhibits a pronounced right-skew phenomenon, indicating a significant disparity in the level of coupling coordination among cities, with certain cities exhibiting much higher values than others. The estimation map of nuclear density in the Jiangsu region reveals that the peak height of the coupling coordination level exhibits fluctuations without displaying evident polarization phenomena, therefore indicating a relatively stable overall coordination level and a tendency towards high-level coordination development in this region. The estimation map of regional nuclear density in Zhejiang reveals an increasing peak and a rightward shift in the coupling coordination level, indicating sustained development in this region. Moreover, the persistence of the right tail phenomenon with its spread towards the left suggests a significant disparity in the coupling coordination level among cities, which initially widens and then narrows. In 2021, there is a narrowing gap between cities, as demonstrated by a narrower and sharper wave peak that shifts to the left, demonstrating dynamic convergence characteristics. The estimated map of nuclear density in the Anhui region reveals a rightward shift of the wave crest, predominantly exhibiting a single-peak pattern, indicative of continuous enhancement in the coupling coordination level among cities. However, an emerging phenomenon of right-trailing in 2021 suggests a widening gap between cities [66,67].
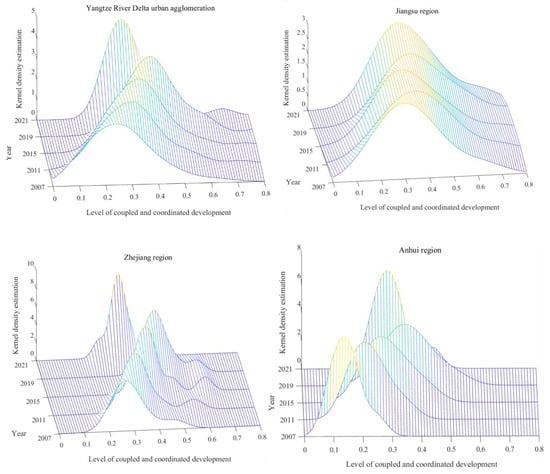
Figure 6.
Estimation of coupling coordinated horizontal kernel density in YRD and three regions.
- 2.
- Spatial difference decomposition
As shown in Table 5, first, the Thiel index of cities in the YRD region fluctuates within the range of 0.03 to 0.10. The YRD region exhibits a noticeable disparity in the level of coupled and coordinated development, yet this gap has been progressively narrowing over the years. The gap decreased from 0.101 in 2007 to 0.035 in 2021, underscoring the notable achievements of the YRD integration strategy. This strategy has infused a perpetual drive towards the formation of a cohesive regional development pattern. It also shows that it is developing towards “integration” and “high quality”. Moreover, the difference value within the group fluctuated between 0.02 and 0.05, showing a decreasing trend. However, the decrease was small, from 0.052 in 2007 to 0.026 in 2021. The data indicates a significant decrease in the difference between groups from 2007 (0.048) to 2013 (0.013), followed by a slower decrease from 2013 to 2021 (0.009). The decrease was particularly notable in 2011, with a reduction of 27.60%. This may be attributed to the issuance of the Regional Planning of the YRD Region in 2010, which highlights the importance of overall development and coordination in the region. The proposed plan emphasizes the promotion of industrial structure optimization and upgrade, the integration of key trans-regional infrastructure, the reinforcement of environmental protection and ecological construction, the establishment of a resource-saving and environmentally friendly society, and the enhancement of social undertakings. Equal access to basic public services, such as compulsory education, public health, and public culture, was promoted. Cities were encouraged to enhance their competitiveness, and integrated development among cities was promoted. Second, upon comparing the inter-group difference with the intra-group difference, it is observed that the intra-group disparity consistently surpasses the inter-group disparity, with its contribution rate remaining above 50%. Notably, in 2019, even the intra-regional difference contributed as high as 82.43%, highlighting a significant developmental gap within the YRD urban agglomeration. Although regional integration can yield maximum benefits for all relevant stakeholders and foster rapid progress, it also gives rise to issues such as uneven distribution of advantages and an increasing concentration of wealth in select regions. Consequently, addressing intra-regional disparities becomes pivotal for future endeavors by focusing on differentiation among member entities within this region. Finally, upon comparing the Theil index within the respective regions, it is evident that the average disparity between the Jiangsu region amounts to 0.06, while that between the Zhejiang region stands at 0.02 and the Anhui region at 0.03. Significantly higher Thiel index values are observed in the Jiangsu region compared to both Zhejiang and Anhui regions, with a notable intra-regional variation within Jiangsu itself. Despite experiencing a slight decline during certain periods, an overall expansionary trend is apparent. The substantial disparities between the northern and southern areas of Jiangsu Province can be attributed to geographical location, industrial layout, population distribution, and policy support. In contrast, the differences between Zhejiang and Anhui are relatively small and exhibit a gradual decreasing trend. The minimal regional disparity in Zhejiang may be attributed to its unique economic development model. Following the reform and opening up, township enterprises in Zhejiang took the lead in flourishing. There is no excessive industrial homogeneity among different counties, while cities at each level possess distinct divisions of labor and characteristics, therefore forming a relatively balanced pattern of the regional economy as a whole. Upon comparing the contribution rates of these three regions, it is evident that the Jiangsu region’s contribution rate to intra-regional differences fluctuates within the range of 34% to 60%, followed by the Zhejiang region, which gradually decreases from 15.08% in 2018. The lowest contribution rate belongs to the Anhui region, consistently maintained at around 14%, with a downward trajectory observed after 2019 (13.63%). Anhui joined the YRD later than other regions and was, therefore, less affected by the policy dividend. In 2014, the State Council released the Guiding Opinions on Promoting the Development of the Yangtze River Economic Belt through the Golden Waterway. This document, for the first time, designated Hefei as one of the sub-centers of the YRD City cluster, confirming Anhui’s important position as a member of the YRD at the national level.
Table 5.
Theil index and its contribution rate of coupling coordination level in YRD and three regions.
3.3. Analysis of the Change in Obstacle Degree of Obstacle Factors in the Coupling Coordinated Development of UR and TE
Criterion level: As shown in Figure 7, in the UR system, the obstacle factors that restrict the coupling and coordination of UR and TE in the YRD urban agglomeration are U2 > U1 > U4 > U3. The most important obstacle factor was social resilience, which increased from 39.88% to 42.27%, and its impact on UR always occupied the first place. Economic resilience ranked second, with a decrease in its obstacle degree from 39.03% to 33.6%. This indicates that during the study period, the urban agglomeration of the YRD witnessed a more diversified economic development and further optimization of its economic structure, resulting in a reduced degree of constraint on the coupling and coordination between the two systems. Infrastructure resilience and ecological resilience occupied the last two positions, exhibiting low degrees of constraint on their coupling and coordination. Notably, while there was a gradual increase in the constraint degree of infrastructure resilience, ecological resilience displayed a declining trend. After analysis, the aforementioned findings indicate that enhancing community development, public services, and social governance is imperative for augmenting citizens’ sense of security, satisfaction, and integration within the YRD urban agglomeration. Simultaneously, addressing societal issues and promoting social equity should be prioritized to foster social stability and harmonious progress. Furthermore, the resilience and sustainability of infrastructure should be further strengthened through increased investment, particularly in response to natural disasters, climate change, and other emergencies. Additionally, emphasis should be placed on leveraging innovative technologies and digital transformation to enhance infrastructure intelligence and operability. In the tourism economic system, both tourism efficiency and tourism scale are equally crucial core indicators for measurement. However, the impact of tourism benefits on the coupling and coordination of these two systems is more significant than the tourism scale. This can be attributed to several reasons: first, the focus of tourism efficiency lies in enhancing the quality and value of the tourism industry rather than solely expanding its scale. By improving services, enriching products, and enhancing experiences, the quality of tourism can be enhanced to attract high-quality tourists and drive high value-added consumption. With the extension of the industrial chain and diversified development, optimized tourism benefits can effectively promote the diversified development of the local economy. Second, improving tourism efficiency encourages enterprises to enhance product and service quality, therefore increasing market competitiveness and establishing a virtuous cycle. Thirdly, improved tourism efficiency is closely linked to sustainable development in many cases. Focusing on and enhancing environmental impact, social impact, and economic income can contribute to the achievement of sustainable development goals. Sustainable development not only prolongs the lifespan of industries but also reduces the consumption of natural and social resources, therefore increasing overall income and long-term value.
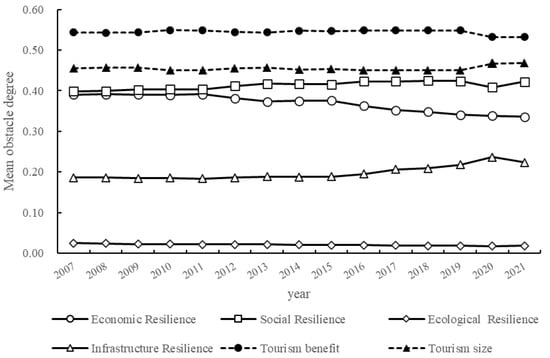
Figure 7.
Average barrier degree of the coupling coordination criteria of UR and TE.
Index level: As shown in Table 6, the barrier factors influencing the coupling coordination of UR and TE in the YRD urban agglomeration undergo constant changes throughout the study period. Among them, the number of IU (538.83%; 527.91%), NSIHL (345.59%; 438.94%), PCPFE (332.06%; 350.89%), STE/FE (214.56%; 255.60%), and UPCDI (219.33%; 99.55%) are the main influencing factors. Over the period from 2007 to 2021, these five obstacle factors collectively contribute to an average obstacle degree of 62.24%. The rise in IU can enhance the digitization and intelligence of tourism destinations, improve the quality and efficiency of tourism services, provide broader marketing channels for tourism destinations, drive and promote the development of the local tourism industry, facilitate the digital transformation of the local economy, and establish a solid foundation for the resilience of cities in the YRD region; The increase in the number of college students can provide more high-quality talent, promote economic development and industrial upgrading, improve the supply of human resources, and facilitate the development of the TE; The rise in PCPFE will aid the YRD metropolitan cluster in enhancing public services and social security, optimizing infrastructure and tourism experiences, and facilitating regional coordination and cooperation within the cluster. This will promote the overall development of the cluster and the coordinated growth of the TE. The increase in the STE/FE means that more funds are being invested in technological innovation and digital transformation. By increasing investment in science and technology, the YRD city cluster can promote the upgrading of industrial structure and innovation-driven development and improve the economic competitiveness and adaptability of the city cluster. By sharing scientific and technological resources and strengthening scientific and technological innovation cooperation, different cities can learn from each other’s experiences and accelerate the transformation and application of innovation achievements. The increase in UPCDI is likely to bolster individuals’ purchasing power and expenditure on tourism, while a higher UPCDI can also serve as a magnet for increased investment and talent attraction. As the per capita income level rises, it has the potential to narrow the income disparity among different cities, therefore fostering more balanced urban development. This finding highlights that multiple factors such as digitization popularity, education level, public service supply level, scientific and technological innovation ability, and residents’ living standards significantly impact the coupling coordination between UR and TE. Therefore, the YRD city cluster must promote the development of intelligent cities and digital transformation, establish a robust digital infrastructure and governance system, enhance the digital resilience and level of intelligent management within the city cluster. Furthermore, implementing strategies that revitalize the nation through science and education is crucial in fostering independent intellectual property rights, professional skills, and innovative achievements in the industrial structure of the city cluster, as well as nurturing innovative talents to elevate public services and enhance infrastructure resilience within urban agglomerations. In the TE system, the primary factors impeding the coupling coordination of UR and TE in the YRD are identified as follows: FEET and NIT. The cumulative degree of obstruction caused by these two factors amounts to 73.27%. It is noteworthy that both FEET and NIT exert an increasingly constraining influence on the coupling and coordination between UR and the TE in the YRD region, while the impact of domestic tourism income and domestic tourist numbers has gradually diminished. This implies that enhancing international competitiveness within the regional tourism industry, promoting industrial transformation, and achieving sustainable development have emerged as crucial considerations for future development in the YRD urban agglomeration. The city cluster in the YRD region should facilitate the structural reform of tourism supply, enhance the development of tourism resources and innovation in tourism products, establish internationally leading landmark products and brands, elevate service quality and tourist experience, as well as attract a greater number of international tourists. Furthermore, it is crucial to strengthen the integration of tourism with other industries and sectors, promotes innovative advancements in tourism, encourage intelligent technology implementation and digital services within the field of tourism, and improve economic and social benefits derived from tourism activities, ultimately enhancing overall standards and core competitiveness.
Table 6.
Sum of main obstacle factors and obstacle degree of UR and tourism economic system index layer (%).
At the regional level: As shown in Table 7, the barrier factors vary across different cities. Specifically, in 2007, social resilience posed significant constraints on the coupling and coordination of UR systems. However, in cities such as Taizhou, Wuhu, Tongling, and Chuzhou, economic resilience exhibited greater limitations compared to social resilience. This can be attributed primarily to these cities’ weak economic foundation characterized by a relatively homogeneous industrial structure, an incomplete industrial chain, and the presence of small-scale enterprises that restrict their economic development space and resilience. Compared to developed regions, these cities lack diverse economic sectors and robust economic prowess. They also encounter challenges related to limited capital and resources. Consequently, this hinders their ability to construct infrastructure, enhance public services, and effectively respond to emergencies, therefore intensifying the constraints imposed by economic factors on UR. The social resilience of all cities in the YRD cluster is more constrained than their economic resilience in 2021, primarily due to the enduring global COVID-19 pandemic, which presents a significant challenge to the city’s public health system and capacity for social governance. In comparison to economic factors, urban development places greater demands on social organization, public services, and public awareness. In 2021, compared to 2007, the ecological resilience of the YRD city cluster exhibits a general reduction in constraints on the coupling and coordination of its two systems. This signifies a gradual realization of the drawbacks associated with extensive development mode in the YRD region, prompting an active shift towards strengthening ecological environmental protection and promoting sustainable development. Urban planning and construction now place greater emphasis on integrating ecological factors to drive green development and foster a low-carbon economy. Guided by governmental initiatives, enterprises have increasingly prioritized environmental protection and resource utilization efficiency through enhanced environmental management practices and technological innovation. In 2021, the level of infrastructure resilience restricting the coupling and coordination of the two systems increased significantly, especially in economically developed cities such as Shanghai and Nanjing. This development arises from three main factors. First, in the past decade, both cities have undergone substantial expansion in size and population alongside accelerated economic activity that has generated a heightened demand for infrastructure. To cater to the needs of burgeoning populations and expanding economies, cities must continually enhance and develop their infrastructure. Additionally, as major Chinese metropolises, Shanghai and Nanjing have experienced swift urbanization. In this process, activities like land-use conversion, industrialization, and transport expansion have surged, placing significant strain on the existing infrastructure. With the progression of urbanization, infrastructure maintenance, and quality are becoming increasingly challenging. Moreover, cities are facing significant challenges due to the global COVID-19 outbreak. The demand for medical facilities and prevention and control resources has dramatically increased, while transport and logistics have been constrained. Public facilities have been closed, and economic activity has been curtailed, all of which have impacted the resilience of infrastructure. In terms of the tourism economic system, the CCD between the two systems of the YRD urban agglomeration in 2021 is less constrained by the TE compared to that in 2007, which may be attributed to the significant impact of COVID-19 on this industry. The pandemic has resulted in travel restrictions and a sharp decline in demand for domestic and international travel, leading to severe losses across various sectors within the TE, such as tourist attractions, hotels, and airlines.
Table 7.
City resilience and criterion level barrier degree of tourism economic system (%).
4. Discussion
Currently, scholars primarily focus on studying the coupled and coordinated relationship between UR and subsystems, new urbanization, high-quality development, and land use [38,39,40,42]. Although there are fewer studies on the coupled and coordinated relationship between UR and TE, scholars have already begun to explore the issue of tourism development from the perspective of resilience [43,44,45,46], and there are scholars who have started to study the issue of tourism city’s economic development from the perspective of vulnerability [47].
First, the aforementioned studies indicate that the resilience of cities in the YRD exhibits a fluctuating upward trend, displaying distinct regional disparities in spatial distribution. This pattern reveals a spatial distribution characterized by high levels in the eastern region and comparatively lower levels in the southwest and north, aligning with findings from studies by Refs. [40,49]. The TE also exhibits a fluctuating upward trend, with spatial disparities gradually widening, indicating imbalanced regional development, which aligns with the findings of the study (Bao et al., 2022) [68]. Based on this, the paper analyses the UR and tourism development levels of three provinces and one city by region. Sub-regional analysis is used to gain a deeper understanding of the characteristics, advantages, and disadvantages of each region due to varying conditions such as economy, geographical location, and natural resources. This analysis can further optimize the urban development strategy. Our goal is to enhance the resilience and tourism development of the YRD city cluster. The analysis will reflect the differences between regions, identify contradictions and discordant points among the YRD urban agglomerations, and provide an entry point for establishing a more coordinated urban development model.
Second, the coupling coordination level has experienced the development stage of Moderate disorder–Bare coordination–Moderate disorder. During the study period, the coordination level has improved, but due to the influence of the external environment, the overall coordination level will decline in 2021. The overall difference is obvious, and the main source of difference is the difference within the region. The internal difference in the Jiangsu region is significantly greater than that in the Zhejiang and Anhui regions. Comparative studies have shown that intra-group differences are greater than inter-group differences in the YRD [55]. In contrast, inter-group differences are greater than intra-group differences in the Beijing-Tianjin-Hebei region. This suggests that policies and plans for the integration of the YRD city clusters have been successful in pushing the integration process forward and achieving significant results. It also indicates that a relatively clear division of labor in industries and synergistic development has been formed among cities in the YRD region. Furthermore, there is closer cooperation and linkages among cities, resulting in a relatively high level of coordinated development. This indicates that the policy has a certain impact on the development of cities and tourism. The YRD regional integration policy can promote the coordinated development of cities and tourism by strengthening economic ties, promoting industrial structure upgrading, and upgrading the level of innovation.
Third, the IU, NSIHL, PCPFE, STE/FE, UPCDI, FEET, and NIT are the main factors affecting the coupling and coordination of UR and TE. This shows that the coupling coordination between UR and TE in the YRD urban agglomerations is affected by multiple factors such as digital popularization, education level, public service supply level, scientific and technological innovation ability, and residents’ living standards. The YRD city cluster should steer towards diversification, eco-friendly sustainability, digitalization, and intelligent development for the future.
5. Conclusions and Recommendations
5.1. Conclusions
Studying the coordinated development of UR and TE is significant for promoting urban sustainable development. In this study, the entropy method and CCD model were employed to accurately assess the comprehensive development index of UR and TE, as well as the CCD, based on panel data from 27 cities in the YRD urban agglomeration spanning from 2007 to 2021. Additionally, techniques such as kernel density estimation, Theil index and decomposition, and obstacle degree model were introduced to gain precise insights into the coordinated development status of the YRD region and analyze its influencing factors. The research aims to provide theoretical underpinnings and decision-making recommendations for the integrated, coordinated, and sustainable development of the YRD. The key findings are as follows:
- (1)
- Comprehensive development level: the UR and TE development levels of the YRD urban agglomerations require further improvement. From 2007 to 2021, the UR of the YRD urban agglomerations shows an N-shaped upward trend, while the TE shows an M-shaped upward trend. When it comes to UR, there are distinct regional variations in the spatial distribution of the two systems, with Shanghai taking the lead. The levels of UR in Jiangsu and Zhejiang are similar. The UR of Anhui showed a gradually increasing trend, but compared with Shanghai, Jiangsu, and Zhejiang, the improvement rate was small, resulting in a gradually widening gap. The level of tourism economic development shows that Shanghai is larger than Zhejiang Province, Jiangsu Province, and Anhui Province. Shanghai, Hangzhou, Suzhou, and Nanjing show a strong trend of tourism economic development and stand out from other cities, forming a circle development pattern with Shanghai, Hangzhou, Suzhou, and Nanjing as the center, showing a spatial distribution pattern of “high in the east and low in the southwest and north”.
- (2)
- The coupling coordination level of UR and TE: The coupling coordination level of UR and TE is generally on the rise and has been on the decline since 2019. The YRD urban agglomeration has developed towards a high-level coupling stage in 2019. However, as a result of the epidemic, it remains in the running-in stage. The coupling coordination level has traversed the development phases of “Moderate disorder–Bare coordination–Moderate disorder”. Since 2014, all cities have emerged from a period of severe disorder. Since 2014, all cities have emerged from a period of severe disorder. The cities can be classified into three categories: the first category comprises cities that have achieved coordinated development, such as Shanghai, Nanjing, Suzhou, and Hangzhou; The second category comprises cities that are currently in the phase of uncoordinated development. Examples of such cities include Nantong, Yancheng, Yangzhou, Zhenjiang, Taizhou, Zhoushan, Maanshan, Tongling, Anqing, Chuzhou, and Xuancheng. The third category encompasses cities that have progressed from the uncoordinated to coordinated development stages, excluding those falling within the first two categories.
- (3)
- Spatial differences. The nuclear density curve indicates an improvement in coordination during the study period; however, overall coordination decreased in 2021 due to external factors. The level of coordination in the Jiangsu region remains relatively consistent, with a tendency towards high-level coordinated development. The overall level of coupling coordination in the Zhejiang region continues to exhibit positive development; however, there exists a significant disparity in the coupling coordination levels among its cities, with an initial increase followed by a subsequent decrease. The overall coupling coordination level of the Anhui region has been consistently enhanced while witnessing an increasing disparity among its cities in 2021. The Theil index indicates a significant overall difference in the level of coupling coordination within the YRD region, mainly stemming from differences within the region. Additionally, the internal difference within the Jiangsu region is notably greater than that within the Zhejiang and Anhui regions. Significant disparities exist in the Jiangsu region, with some minor fluctuations observed during a specific period; however, an overall expansionary trend is evident. In contrast, the variations in Zhejiang and Anhui regions are relatively insignificant and demonstrate a declining pattern.
- (4)
- Influence factors. At the criterion level, the ranking of obstacle factors restricting the coupling and coordination of UR and TE in the YRD urban agglomeration is relatively stable. In the UR system, the order from high to low is social resilience > Economic resilience > Infrastructure resilience > Ecological resilience. In the TE system, the degree of coupling and coordination between the two systems is more significantly constrained by tourism efficiency than by tourism scale. At the index level, during the study period, obstacle factors that affected the coupling and coordination of the two systems underwent continuous change. The main obstacles were IU, NSIHL, PCPFE, STE/FE, UPCDI, FEET, and NIT.
5.2. Recommendations
Due to the limited availability of data on UR and tourism economic indicators, the selection of these indicators is not comprehensive. Future research could enhance the assessment of the coupling coordination between UR and TE by incorporating field studies and obtaining primary data. Moreover, institutional factors exert a certain influence on the coupling and coordination of UR and the TE. Therefore, future research should aim to strengthen our comprehensive understanding of their interaction, exploring additional factors that affect their coupling coordination, particularly institutional factors, as human subjective initiative plays a significant role in their coordination. Additionally, it is crucial to foster cross-sectoral and interdisciplinary collaborative research to investigate how the coupled development of UR and the TE contributes to sustainable urban development. Based on our findings, this paper proposes the following recommendations.
- (1)
- UR and tourism development are being coordinated in high-value areas, such as Shanghai, Hangzhou, Suzhou, and Nanjing, as the core of the YRD region. Vigorously promote the diffusion and spillover of regional central city resources, harnessing their driving force and trickle-down effect while actively leveraging Shanghai’s financial resources, Hangzhou’s network economy, Suzhou’s industrial innovation, Nanjing’s scientific and technological talents, and other urban advantages to facilitate cascading development. Integrate new development concepts and resilience thinking into urban construction to enhance social resilience in education, healthcare, social security, and other fields. Seek more active and effective cooperation mechanisms in the public sector while capitalizing on geographical advantages to foster overseas tourism market growth. Enhance the urban tourism industry system by collaboratively building Shanghai and Hangzhou into international tourist destinations. Jointly advance sustainable development in the YRD.
- (2)
- UR and tourism development, along with coordination of middle-value areas such as Wuxi, Ningbo, Jiaxing, and Hefei, as provincial capitals or cities close to the core area of the YRD, need to strengthen exchanges and cooperation with the core area, promote the integrated development of the cross-provincial region, break down administrative barriers and take advantage of the positive spillover effects of the Shanghai core area. Simultaneously, it is imperative to reinforce regional collaboration and construct an inter-provincial metropolitan area for resource-sharing and complementary advantages. This will promote coordinated regional economic development. Additionally, it is crucial to leverage its role as a connector between the eastern and western portions of the YRD region and stimulate growth for nearby cities with limited integration. There is a need to enhance the momentum of tourism development and increase the indigenous strength of cities through active promotion of tourism reforms and innovations. The implementation of promotional and marketing campaigns targeting domestic and international markets will aid in attracting more tourists. Simultaneously, enhance the tourism public service system and upgrade the amenities and level of service at tourist sites to promote economic prosperity and bolster the city’s inherent capabilities by offering exceptional tourism experiences.
- (3)
- Low-value areas in the coupling coordination of UR and tourism development, such as Tongling, Chuzhou, Maanshan, and Xucheng, are considered peripheral regions within the YRD urban agglomeration and have joined relatively late. Consequently, they have not fully capitalized on the financial resources, human capital, and advanced technologies provided by policies. As a result, these areas struggle to reap the benefits of integrated and coordinated development within the YRD. Therefore, it is imperative to establish and enhance a collaborative mechanism for promoting regional integration in the YRD. This entails encouraging established members to drive progress in new member cities while expediting their overall integrated development. Additionally, local economies should be developed based on contextual factors through adjustments in regional industrial structures that bolster UR. Furthermore, it is crucial to break free from reliance on “ticket economy” and “scenic spot tourism” paradigms by creating distinctive niche tourist attractions while effectively utilizing new media platforms and Internet technologies for efficient marketing strategies that elevate city visibility and appeal. The tourism development team must include young professionals who can effectively engage with younger generations of tourists by providing captivating promotional content that enhances their experiential journey, thus fostering profound growth in low-value areas.
Author Contributions
Conceptualization, H.P., Y.Y. and W.Z.; methodology, H.P., Y.Y. and W.Z.; software, Y.Y.; validation, H.P. and W.Z.; formal analysis, H.P. and W.Z.; resources, Y.Y. and M.X; data curation, Y.Y.; writing—original draft preparation, H.P. and Y.Y.; writing—review and editing, Y.Y., H.P., W.Z. and M.X.; visualization, Y.Y. All authors have read and agreed to the published version of the manuscript.
Funding
This research was funded by Optimization path of ecotourism corridor spatial layout in Yellow River Basin (23BGL173); Research on integration and innovation of supply and demand platform of health care industry from the perspective of sharing Economy (23BGLJ07); Impact Mechanism and Management Strategy of ecotourism in the Yellow River Delta from the Perspective of High-quality Development (22CJJJ37).
Institutional Review Board Statement
Not applicable.
Informed Consent Statement
Not applicable.
Data Availability Statement
The data resource is publicly available from the Chinese urban Statistical Yearbook, Shanghai Statistical Yearbook, Jiangsu Statistical Yearbook, Zhejiang Statistical Yearbook, Anhui Statistical Yearbook (2008–2022), available online: http://www.stats.gov.cn/tjsj/ndsj/ (accessed on 10 May 2023), https://tjj.sh.gov.cn/tjnj (accessed on 10 May 2023), https://www.jiangsu.gov.cn/ (accessed on 10 May 2023), https://tjj.zj.gov.cn/ (accessed on 10 May 2023), http://tjj.ah.gov.cn/ (accessed on 10 May 2023).
Conflicts of Interest
The authors declare no conflict of interest. The funders had no role in the design of the study, in the collection, analyses, or interpretation of data, in the writing of the manuscript, or in the decision to publish the results.
References
- Shi, C.; Zhu, X.; Wang, C.; Wu, F. A review of resilient cities: Based on the perspective of urban complex systems. Acta Ecol. Sin. 2023, 43, 1726–1737. [Google Scholar]
- Yang, X.; Wang, L.; Li, Y.; Hou, Y.; Niu, J. Review and prospect of resilient city research. Geogr. Geo-Inf. Sci. 2021, 37, 78–84. [Google Scholar]
- Zhang, N.; Huang, H. Resilience Analysis of Countries under Disasters Based on Multisource Data. Risk Anal. 2018, 38, 31–42. [Google Scholar] [CrossRef]
- Kiss, T.; Kiss, V.M. Ecology-Related Resilience in Urban Planning—A Complex Approach for Pécs (Hungary). Ecol. Econ. 2018, 144, 160–170. [Google Scholar] [CrossRef]
- Godschalk, D.R. Urban Hazard Mitigation: Creating Resilient Cities. Nat. Hazards Rev. 2003, 4, 136–143. [Google Scholar] [CrossRef]
- Shi, T.; Qiao, Y.; Zhou, Q. Spatiotemporal Evolution and Spatial Relevance of Urban Resilience: Evidence from Cities of China. Growth Change 2021, 52, 2364–2390. [Google Scholar] [CrossRef]
- Han, S.; Wang, B.; Ao, Y.; Bahmani, H.; Chai, B. The Coupling and Coordination Degree of Urban Resilience System: A Case Study of the Chengdu–Chongqing Urban Agglomeration. Environ. Impact Assess. Rev. 2023, 101, 107145. [Google Scholar] [CrossRef]
- Yin, D.; Ying, L.; Chen, G. The construction of “resilient city”: Theoretical logic, evaluation mechanism and practical path. J. Guangzhou Univ. (Soc. Sci. Ed.) 2023, 22, 113–121. [Google Scholar]
- Wardekker, J.A. Operationalising a Resilience Approach to Adapting an Urban Delta to Uncertain Climate Changes. Technol. Forecast. 2010, 77, 987–998. [Google Scholar] [CrossRef]
- Wagner, I.; Breil, P. The Role of Ecohydrology in Creating More Resilient Cities. Ecohydrol. Hydrobiol. 2013, 13, 113–134. [Google Scholar] [CrossRef]
- Brand, F.S.; Jax, K. Focusing the Meaning(s) of Resilience: Resilience as a Descriptive Concept and a Boundary Object. Ecol. Soc. 2007, 12, art23. [Google Scholar] [CrossRef]
- Chelleri, L.; Waters, J.J.; Olazabal, M.; Minucci, G. Resilience Trade-Offs: Addressing Multiple Scales and Temporal Aspects of Urban Resilience. Environ. Urban. 2015, 27, 181–198. [Google Scholar] [CrossRef]
- Meerow, S.; Newell, J.P.; Stults, M. Defining Urban Resilience: A Review. Landsc. Urban Plan. 2016, 147, 38–49. [Google Scholar] [CrossRef]
- Harris, L.M.; Chu, E.K.; Ziervogel, G. Negotiated Resilience. Resilience 2017, 6, 1–19. [Google Scholar] [CrossRef]
- Tumini, I.; Villagra-Islas, P.; Herrmann-Lunecke, G. Evaluating Reconstruction Effects on Urban Resilience: A Comparison between Two Chilean Tsunami-Prone Cities. Nat Hazards 2017, 85, 1363–1392. [Google Scholar] [CrossRef]
- Hunter, L.M. Migration and Environmental Hazards. Popul. Environ. 2005, 26, 273–302. [Google Scholar] [CrossRef]
- Roberts, D.; Douwes, J.; Sutherland, C.; Sim, V. Durban’s 100 Resilient Cities Journey: Governing Resilience from Within. Environ. Urban. 2020, 32, 547–568. [Google Scholar] [CrossRef]
- Rodríguez-Izquierdo, E.; Cid, A.; García-Meneses, P.M.; Peña-Sanabria, K.A.; Lerner, A.M.; Matus-Kramer, A.; Escalante, A.E. From Resilience Attributes to City Resilience. Landsc. Urban Plan. 2022, 226, 104485. [Google Scholar] [CrossRef]
- Manyena, S.B. The Concept of Resilience Revisited: The Concept of Resilience Revisited. Disasters 2006, 30, 434–450. [Google Scholar] [CrossRef]
- Cutter, S.L.; Barnes, L.; Berry, M.; Burton, C.; Evans, E.; Tate, E.; Webb, J. A Place-Based Model for Understanding Community Resilience to Natural Disasters. Glob. Environ. Chang. 2008, 18, 598–606. [Google Scholar] [CrossRef]
- Admiraal, H.; Cornaro, A. Future Cities, Resilient Cities—The Role of Underground Space in Achieving Urban Resilience. Undergr. Space 2020, 5, 223–228. [Google Scholar] [CrossRef]
- Ostadtaghizadeh, A.; Ardalan, A.; Paton, D.; Jabbari, H.; Khankeh, H.R. Community Disaster Resilience: A Systematic Review on Assessment Models and Tools. PLoS Curr. 2015, 7, 2157–3999. [Google Scholar] [CrossRef]
- Cutter, S.L.; Burton, C.G.; Emrich, C.T. Disaster Resilience Indicators for Benchmarking Baseline Conditions. J. Homel. Secur. Emerg. Manag. 2010, 7, 1–22. [Google Scholar] [CrossRef]
- Quan, M.; Chen, Y. A brief analysis of the evaluation system of foreign resilient cities. Hous. Sci. 2019, 39, 1–6. [Google Scholar] [CrossRef]
- Fastenrath, S.; Coenen, L.; Davidson, K. Urban Resilience in Action: The Resilient Melbourne Strategy as Transformative Urban Innovation Policy? Sustainability 2019, 11, 693. [Google Scholar] [CrossRef]
- Chen, N.; Guo, H.; Xiang, H. Evaluation of Urban Resilience Level and Analysis of Obstacle Factors: A Case Study of Hunan Province, China. Front. Earth Sci. 2023, 10, 1033441. [Google Scholar] [CrossRef]
- Moghadas, M.; Asadzadeh, A.; Vafeidis, A.; Fekete, A.; Kötter, T. A Multi-Criteria Approach for Assessing Urban Flood Resilience in Tehran, Iran. Int. J. Disaster Risk Reduct. 2019, 35, 101069. [Google Scholar] [CrossRef]
- Zhu, S.; Li, D.; Feng, H. Is Smart City Resilient? Evidence from China. Sustain. Cities Soc. 2019, 50, 101636. [Google Scholar] [CrossRef]
- Xiong, Y.; Li, C.; Zou, M.; Xu, Q. Investigating into the Coupling and Coordination Relationship between Urban Resilience and Urbanization: A Case Study of Hunan Province, China. Sustainability 2022, 14, 5889. [Google Scholar] [CrossRef]
- Cheng, H.-T.; Chang, H.-S. A Spatial DEA-Based Framework for Analyzing the Effectiveness of Disaster Risk Reduction Policy Implementation: A Case Study of Earthquake-Oriented Urban Renewal Policy in Yongkang, Taiwan. Sustainability 2018, 10, 1751. [Google Scholar] [CrossRef]
- Datola, G.; Bottero, M.; De Angelis, E.; Romagnoli, F. Operationalising Resilience: A Methodological Framework for Assessing Urban Resilience through System Dynamics Model. Ecol. Model. 2022, 465, 109851. [Google Scholar] [CrossRef]
- Lu, H.; Zhang, C.; Jiao, L.; Wei, Y.; Zhang, Y. Analysis on the Spatial-Temporal Evolution of Urban Agglomeration Resilience: A Case Study in Chengdu-Chongqing Urban Agglomeration, China. Int. J. Disaster Risk Reduct. 2022, 79, 103167. [Google Scholar] [CrossRef]
- Chen, X.; Jiang, S.; Xu, L.; Xu, H.; Guan, N. Resilience Assessment and Obstacle Factor Analysis of Urban Areas Facing Waterlogging Disasters: A Case Study of Shanghai, China. Environ. Sci. Pollut. Res. 2023, 30, 65455–65469. [Google Scholar] [CrossRef]
- Ye, C.; Hu, M.; Lu, L.; Dong, Q.; Gu, M. Spatio-Temporal Evolution and Factor Explanatory Power Analysis of Urban Resilience in the Yangtze River Economic Belt. Geogr. Sustain. 2022, 3, 299–311. [Google Scholar] [CrossRef]
- Huang, J.; Sun, Z.; Du, M. Differences and Drivers of Urban Resilience in Eight Major Urban Agglomerations: Evidence from China. Land 2022, 11, 1470. [Google Scholar] [CrossRef]
- Zhang, X.; Song, J.; Peng, J.; Wu, J. Landslides-Oriented Urban Disaster Resilience Assessment—A Case Study in ShenZhen, China. Sci. Total Environ. 2019, 661, 95–106. [Google Scholar] [CrossRef] [PubMed]
- Hernantes, J.; Maraña, P.; Gimenez, R.; Sarriegi, J.M.; Labaka, L. Towards Resilient Cities: A Maturity Model for Operationalizing Resilience. Cities 2019, 84, 96–103. [Google Scholar] [CrossRef]
- Liu, N.; Wang, S.; Su, F.; Ye, J. Research on Coupling Coordination of China’s New-Type Urbanization and Urban Resilience—Taking Yangtze River Economic Belt as an Example. Sustainability 2022, 15, 456. [Google Scholar] [CrossRef]
- Luo, X.; Cheng, C.; Pan, Y.; Yang, T. Coupling Coordination and Influencing Factors of Land Development Intensity and Urban Resilience of the Yangtze River Delta Urban Agglomeration. Water 2022, 14, 1083. [Google Scholar] [CrossRef]
- Zhang, J.; Yuan, J.; Wang, Y. Spatio-Temporal Evolution and Influencing Factors of Coupling Coordination between Urban Resilience and High-Quality Development in Yangtze River Delta Area, China. Front. Environ. Sci. 2023, 11, 1174875. [Google Scholar] [CrossRef]
- Wang, J.; Deng, Y.; Qalati, S.A.; Qureshi, N.A. Urban Resilience and Transportation Infrastructure Level in the Yangtze River Delta. Front. Environ. Sci. 2022, 10, 893964. [Google Scholar] [CrossRef]
- Sun, J.; Zhai, N.; Mu, H.; Miao, J.; Li, W.; Li, M. Assessment of Urban Resilience and Subsystem Coupling Coordination in the Beijing-Tianjin-Hebei Urban Agglomeration. Sustain. Cities Soc. 2024, 100, 105058. [Google Scholar] [CrossRef]
- Yang, S.; Lu, Y.; Wang, S. Quantitative Simulation and Verification of the Tourism Economic Resilience in Urban Agglomerations. Sci. Rep. 2023, 13, 18879. [Google Scholar] [CrossRef]
- Ntounis, N.; Parker, C.; Skinner, H.; Steadman, C.; Warnaby, G. Tourism and Hospitality Industry Resilience during the COVID-19 Pandemic: Evidence from England. Curr. Issues Tour. 2022, 25, 46–59. [Google Scholar] [CrossRef]
- Calgaro, E.; Lloyd, K.; Dominey-Howes, D. From Vulnerability to Transformation: A Framework for Assessing the Vulnerability and Resilience of Tourism Destinations. J. Sustain. Tour. 2014, 22, 341–360. [Google Scholar] [CrossRef]
- Yang, X.; Zhang, D.; Liu, L.; Niu, J.; Zhang, X.; Wang, X. Development Trajectory for the Temporal and Spatial Evolution of the Resilience of Regional Tourism Environmental Systems in 14 Cities of Gansu Province, China. Environ. Sci. Pollut. Res. 2021, 28, 65094–65115. [Google Scholar] [CrossRef]
- Scott, D.; Hall, C.M.; Gössling, S. Global Tourism Vulnerability to Climate Change. Ann. Tour. Res. 2019, 77, 49–61. [Google Scholar] [CrossRef]
- Zhou, Q.; Liu, D. A study on the coupling and coordinated development of urban resilience and urbanization in the Yangtze River Delta urban agglomerations. Res. Soil Water Conserv. 2020, 27, 286–292. [Google Scholar] [CrossRef]
- Cheng, H.; You, S. The coordination relationship between urban resilience and tourism development in the Yangtze River Delta city cluster. J. Shaanxi Norm. Univ. (Nat. Sci. Ed.) 2023, 51, 59–69. [Google Scholar] [CrossRef]
- Li, H.; Zhang, Z. Research on tourism synergy strategy of Beijing-Tianjin-Hebei Region—Based on the experience of Yangtze River Delta. Nor. Econ. 2023, 4, 44–47. [Google Scholar]
- National 5A Tourist Attraction. Available online: https://sjfw.mct.gov.cn/site/dataservice/rural?type=10 (accessed on 15 July 2022).
- 2021 National Star Hotel Statistical Survey Report. Available online: https://sjfw.mct.gov.cn/site/dataservice/details?id=27169 (accessed on 1 September 2022).
- Xu, X.; Wang, M.; Wang, M.; Yang, Y.; Wang, Y. The Coupling Coordination Degree of Economic, Social and Ecological Resilience of Urban Agglomerations in China. Int. J. Environ. Res. Public Health 2022, 20, 413. [Google Scholar] [CrossRef]
- Zhang, Y.; Cai, X.; Jiao, L.; Mao, Y.; Huo, X.; Wu, Y. Using Eco-efficiency and Eco-wellbeing Performance as Indicators for Urban Sustainable Development: A Two-stage Network Analysis. Sustain. Dev. 2023, 1, sd.2750. [Google Scholar] [CrossRef]
- Weng, G.; Tang, Y.; Pan, Y.; Mao, Y. Spatio-temporal evolution and spatial differences of coupled coordination of tourism-ecology-urbanization in Beijing-Tianjin-Hebei. Econ. Geogr. 2021, 41, 196–204. [Google Scholar] [CrossRef]
- Wang, Z.; Li, J. The coupling and coordination of tourism development and ecological environment in the Yellow River Basin and their interaction stress relationship. Resour. Environ. Yangtze Basin 2022, 31, 447–460. [Google Scholar]
- Ma, H.; Chu, J.; Li, J. Study on the coupling and coordination state of urban resilience and urbanization in Anhui Province. World Surv. Res. 2023, 7, 28–37. [Google Scholar] [CrossRef]
- Pei, W. Comprehensive evaluation of high-quality urban development based on entropy method. Stat. Decis. 2020, 36, 119–122. [Google Scholar] [CrossRef]
- Wang, D.; Long, H.; Wang, J.; Wang, H.; Cha, H.; Gao, J. Coupling and coordination analysis of urbanization intensity and ecological resilience in Beijing-Tianjin-Hebei city cluster. Acta Ecol. Sin. 2023, 43, 6321–6331. [Google Scholar]
- Ma, L.; Jin, F.; Liu, Y. Analysis of coupling degree pattern and industrial structure of economic and environmental pollution in China. J. Geogr. Sci. 2012, 67, 1299–1307. [Google Scholar]
- Yin, P.; Liu, J.; Chen, C. Research on the coordination of the Four Modernizations development of Jilin Province since the revitalization of Northeast China. Geogr. Sci. 2015, 35, 1101–1108. [Google Scholar] [CrossRef]
- Liao, C. Quantitative evaluation and classification system of coordinated development of environment and economy: A case study of the Pearl River Delta urban Agglomeration. Trop. Geogr. 1999, 2, 76–82. [Google Scholar]
- Liu, Y.; Wang, Y.; Zhu, L. Spatial and temporal characteristics and influencing factors of carbon emission change in construction industry in Yangtze River Delta region. China Environ. Sci. 2023, 43, 1–13. [Google Scholar] [CrossRef]
- Wei, C.; Zhang, M.; Wu, Z.; Xing, J.; Yang, S. Characteristics and obstacle factors of urban and rural coordinated development of urban agglomerations in the middle reaches of the Yangtze River from a functional perspective. Resour. Environ. Yangtze Basin 2023, 32, 2032–2044. [Google Scholar]
- Zhao, R.; Fang, C.; Liu, J.; Zhang, L. The Evaluation and Obstacle Analysis of Urban Resilience from the Multidimensional Perspective in Chinese Cities. Sustain. Cities Soc. 2022, 86, 104160. [Google Scholar] [CrossRef]
- Li, C.; Huang, X. Study on integrated measurement and collaborative governance of Yangtze River Delta. East China Econ. Manag. 2023, 37, 35–46. [Google Scholar] [CrossRef]
- Yang, M.; Tang, X. Evaluation of coupling and coordination degree between digital finance and high-quality economic development. Stat. Decis. 2023, 39, 126–130. [Google Scholar] [CrossRef]
- Bao, J.; Zhang, D. Study on the coupling coordination degree of tourism industry and regional economy: A case study of Yangtze River Delta urban agglomeration. J. Guangxi Norm. Univ. (Nat. Sci. Ed.) 2020, 38, 117–127. [Google Scholar] [CrossRef]


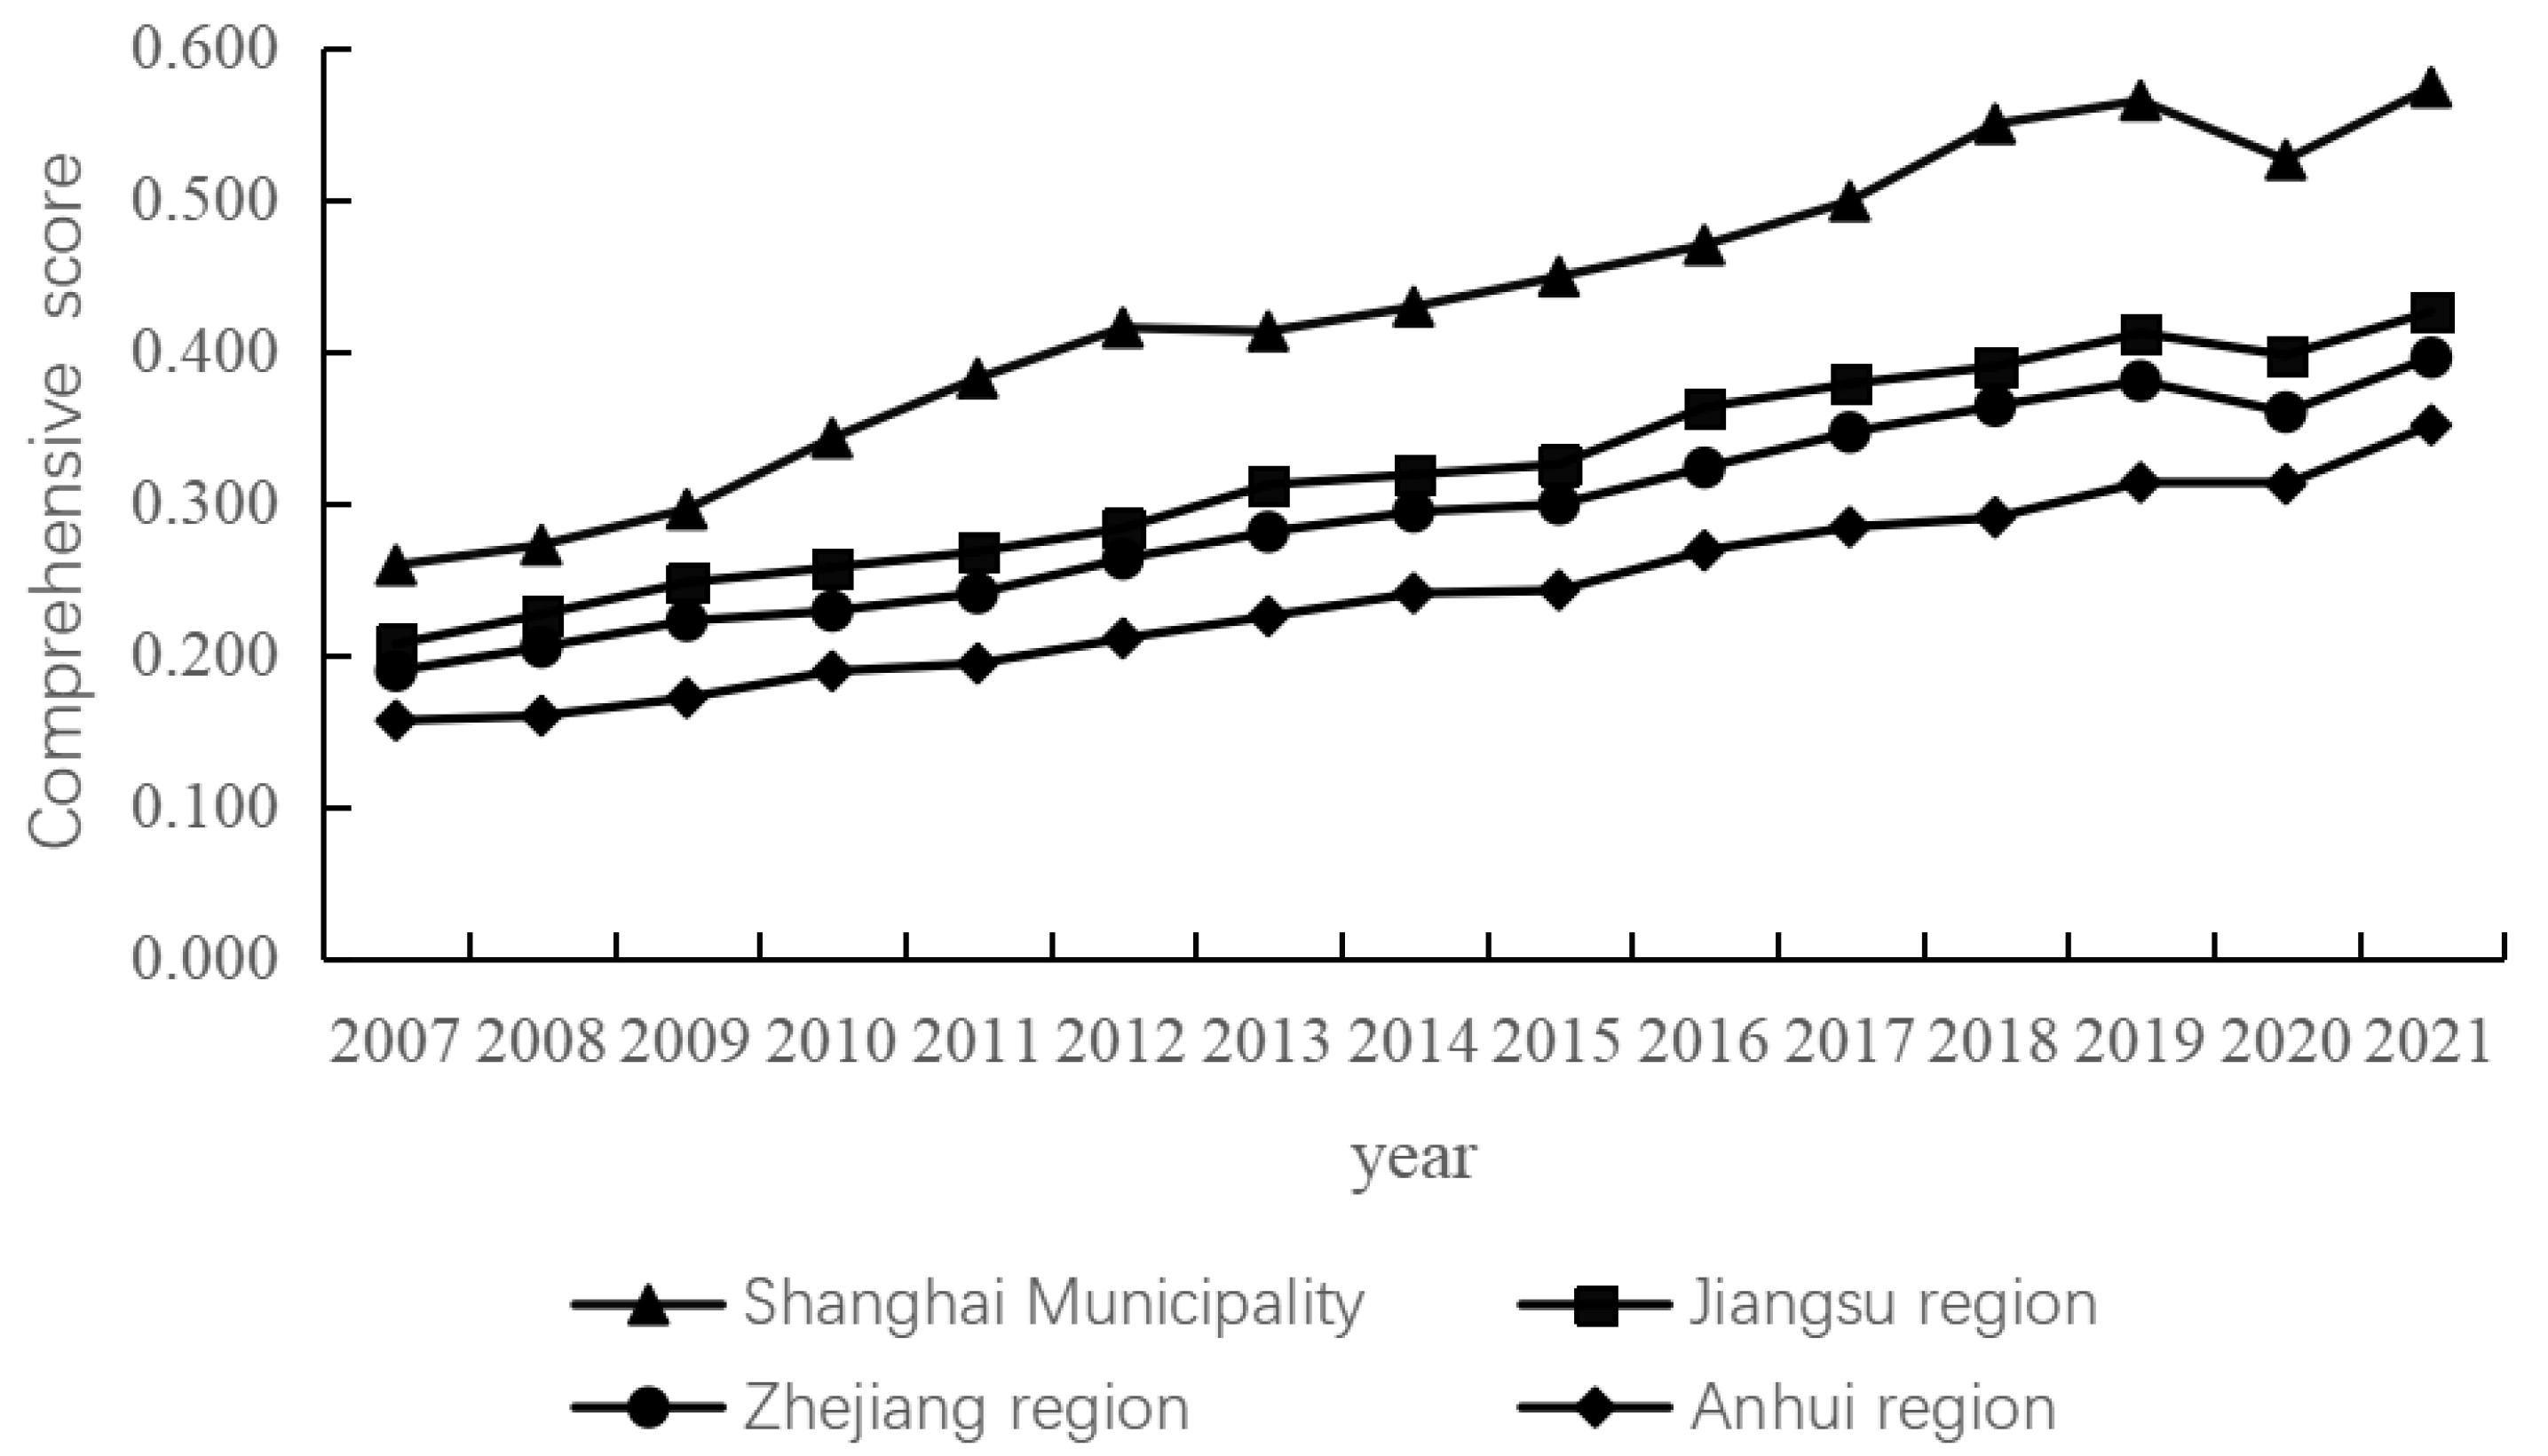
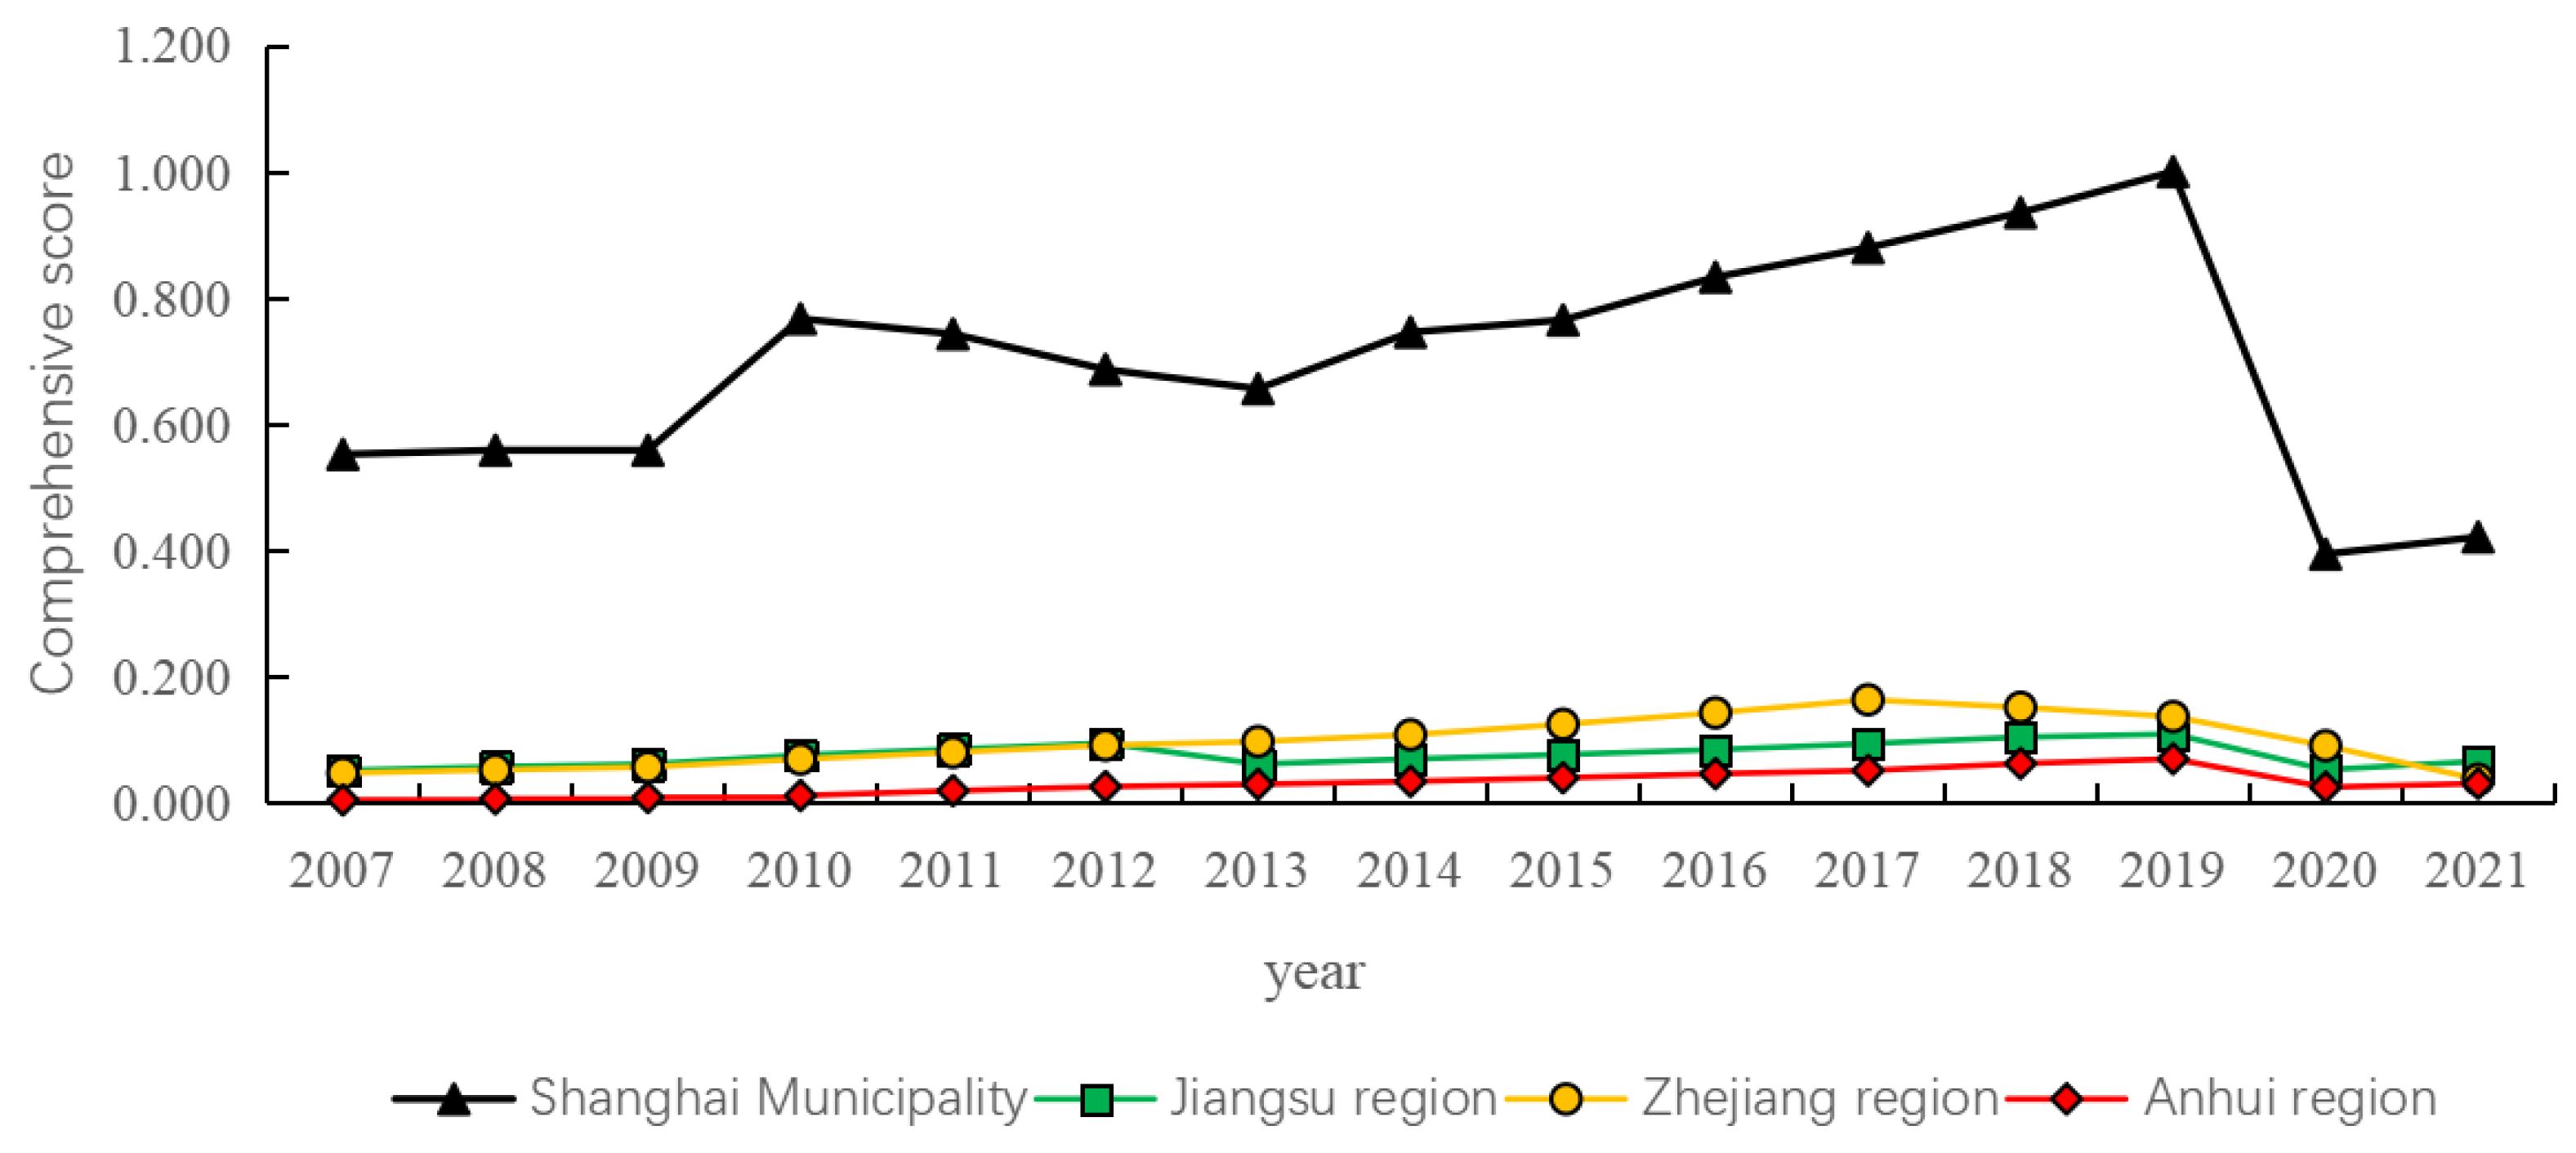
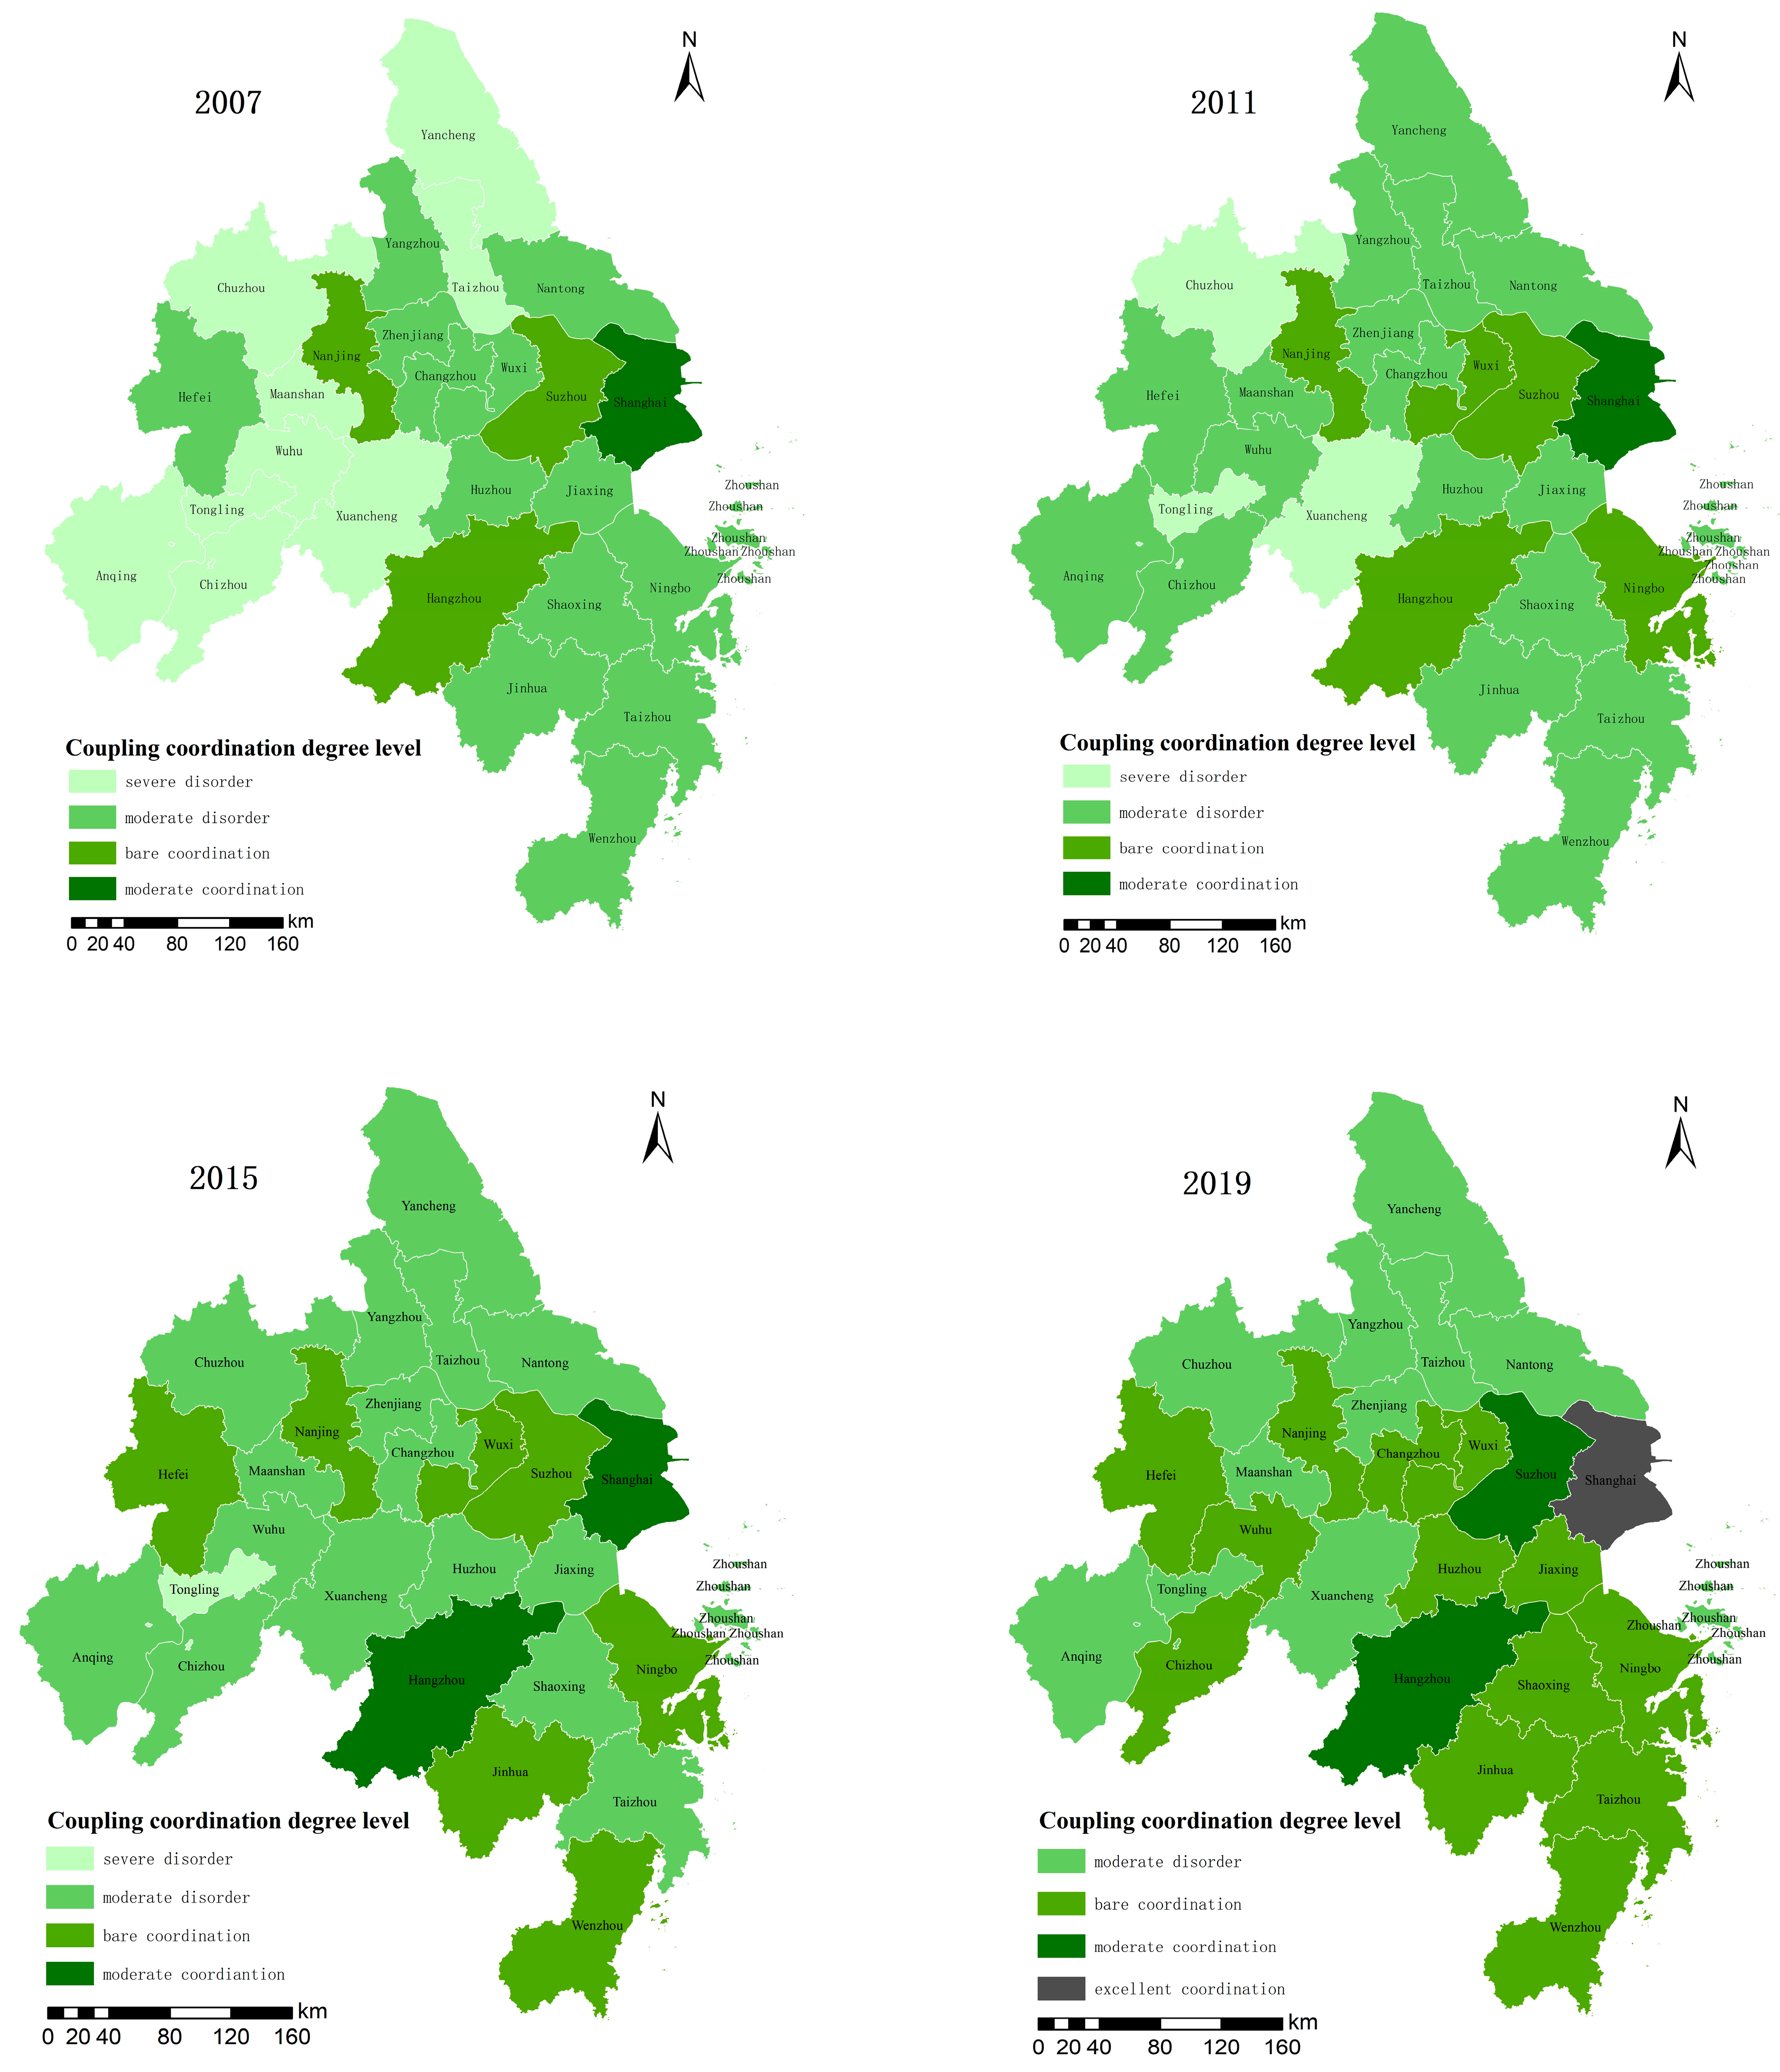
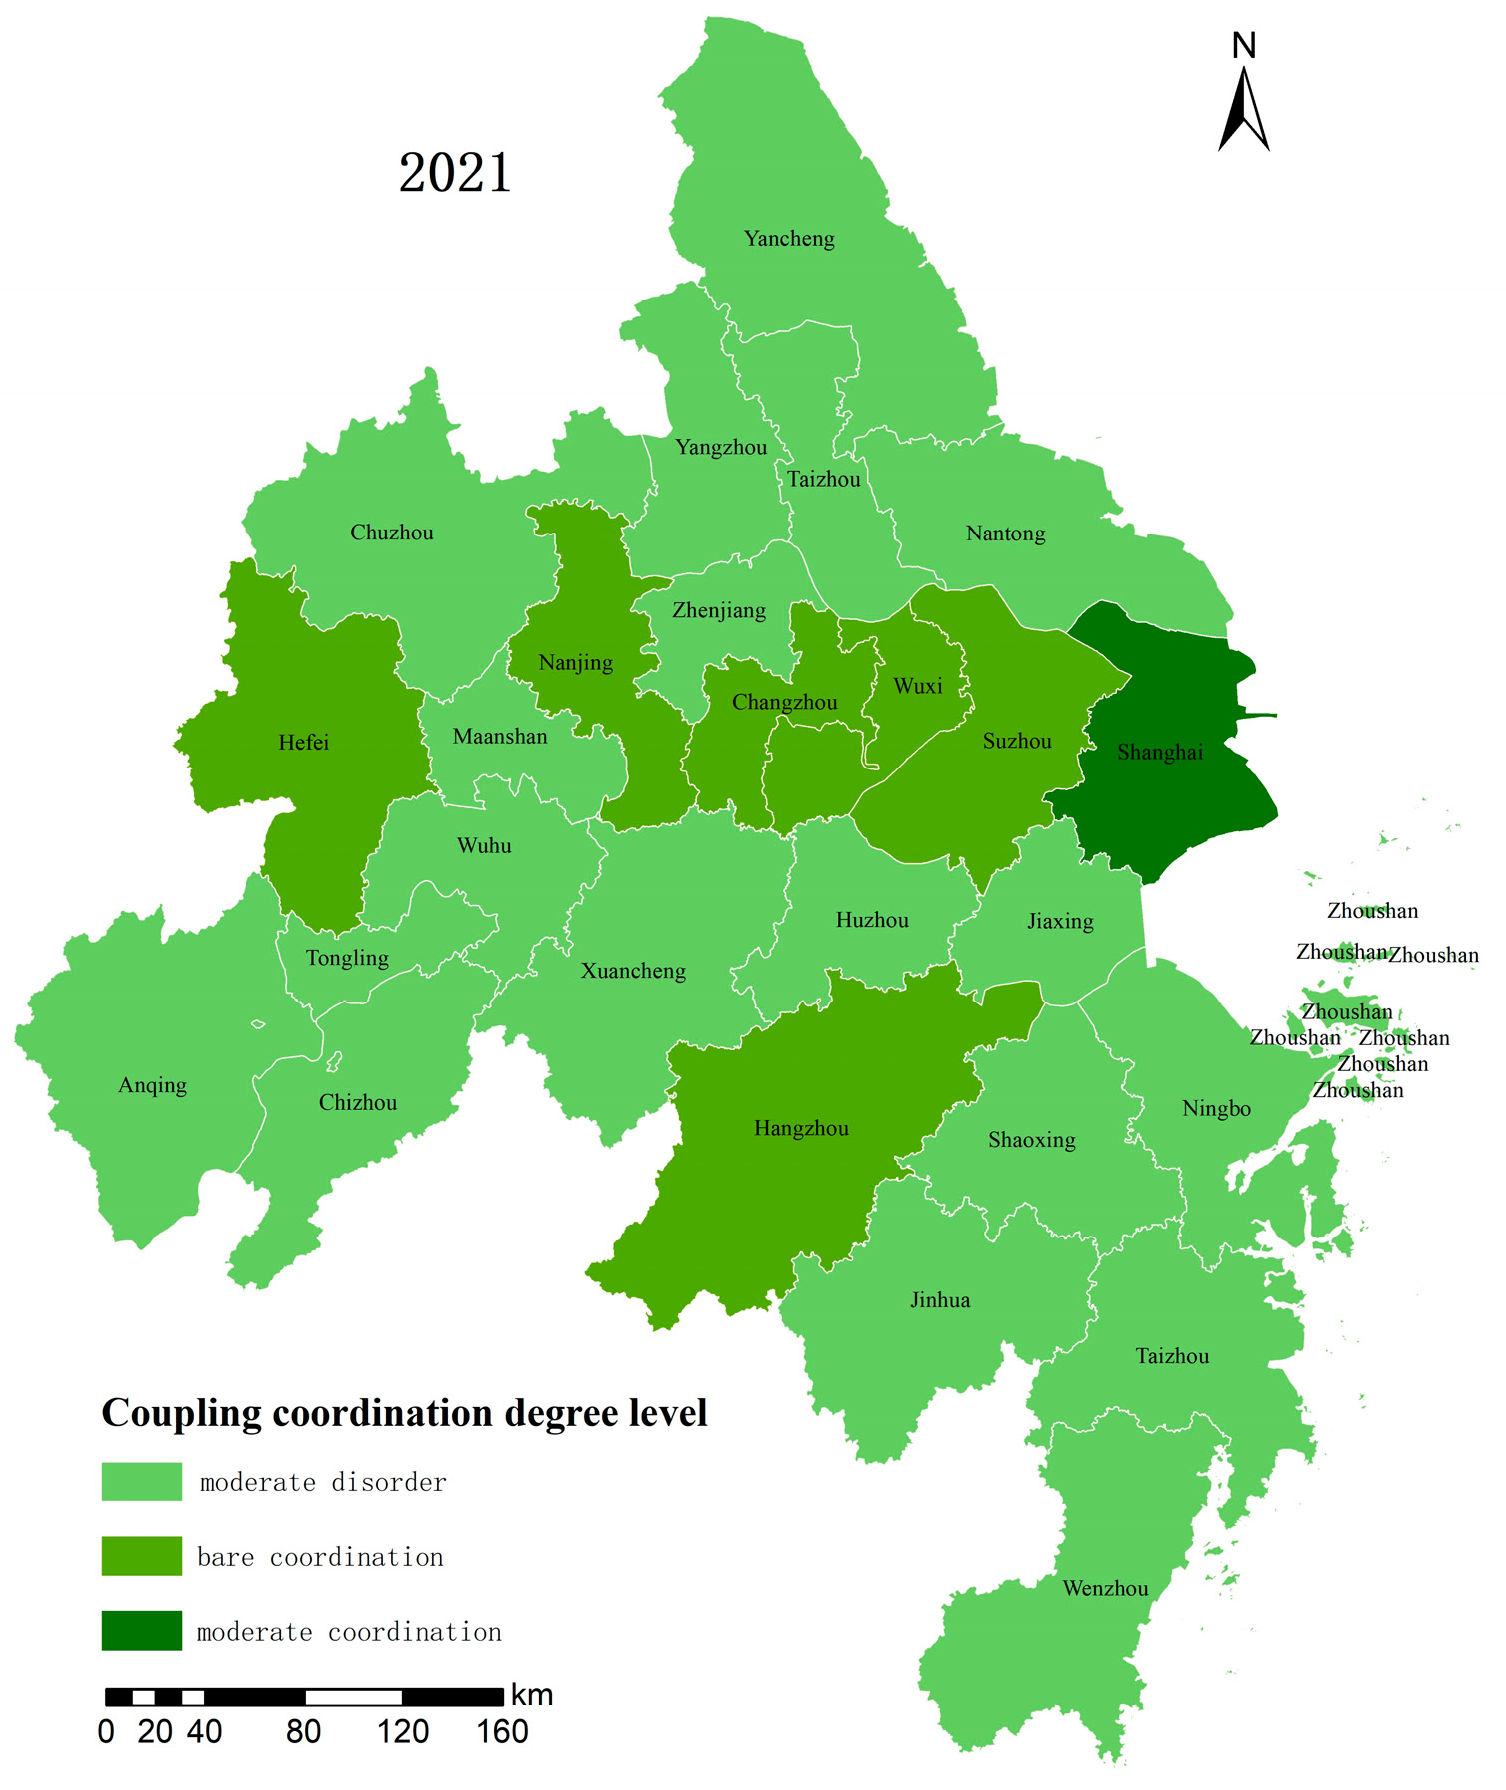
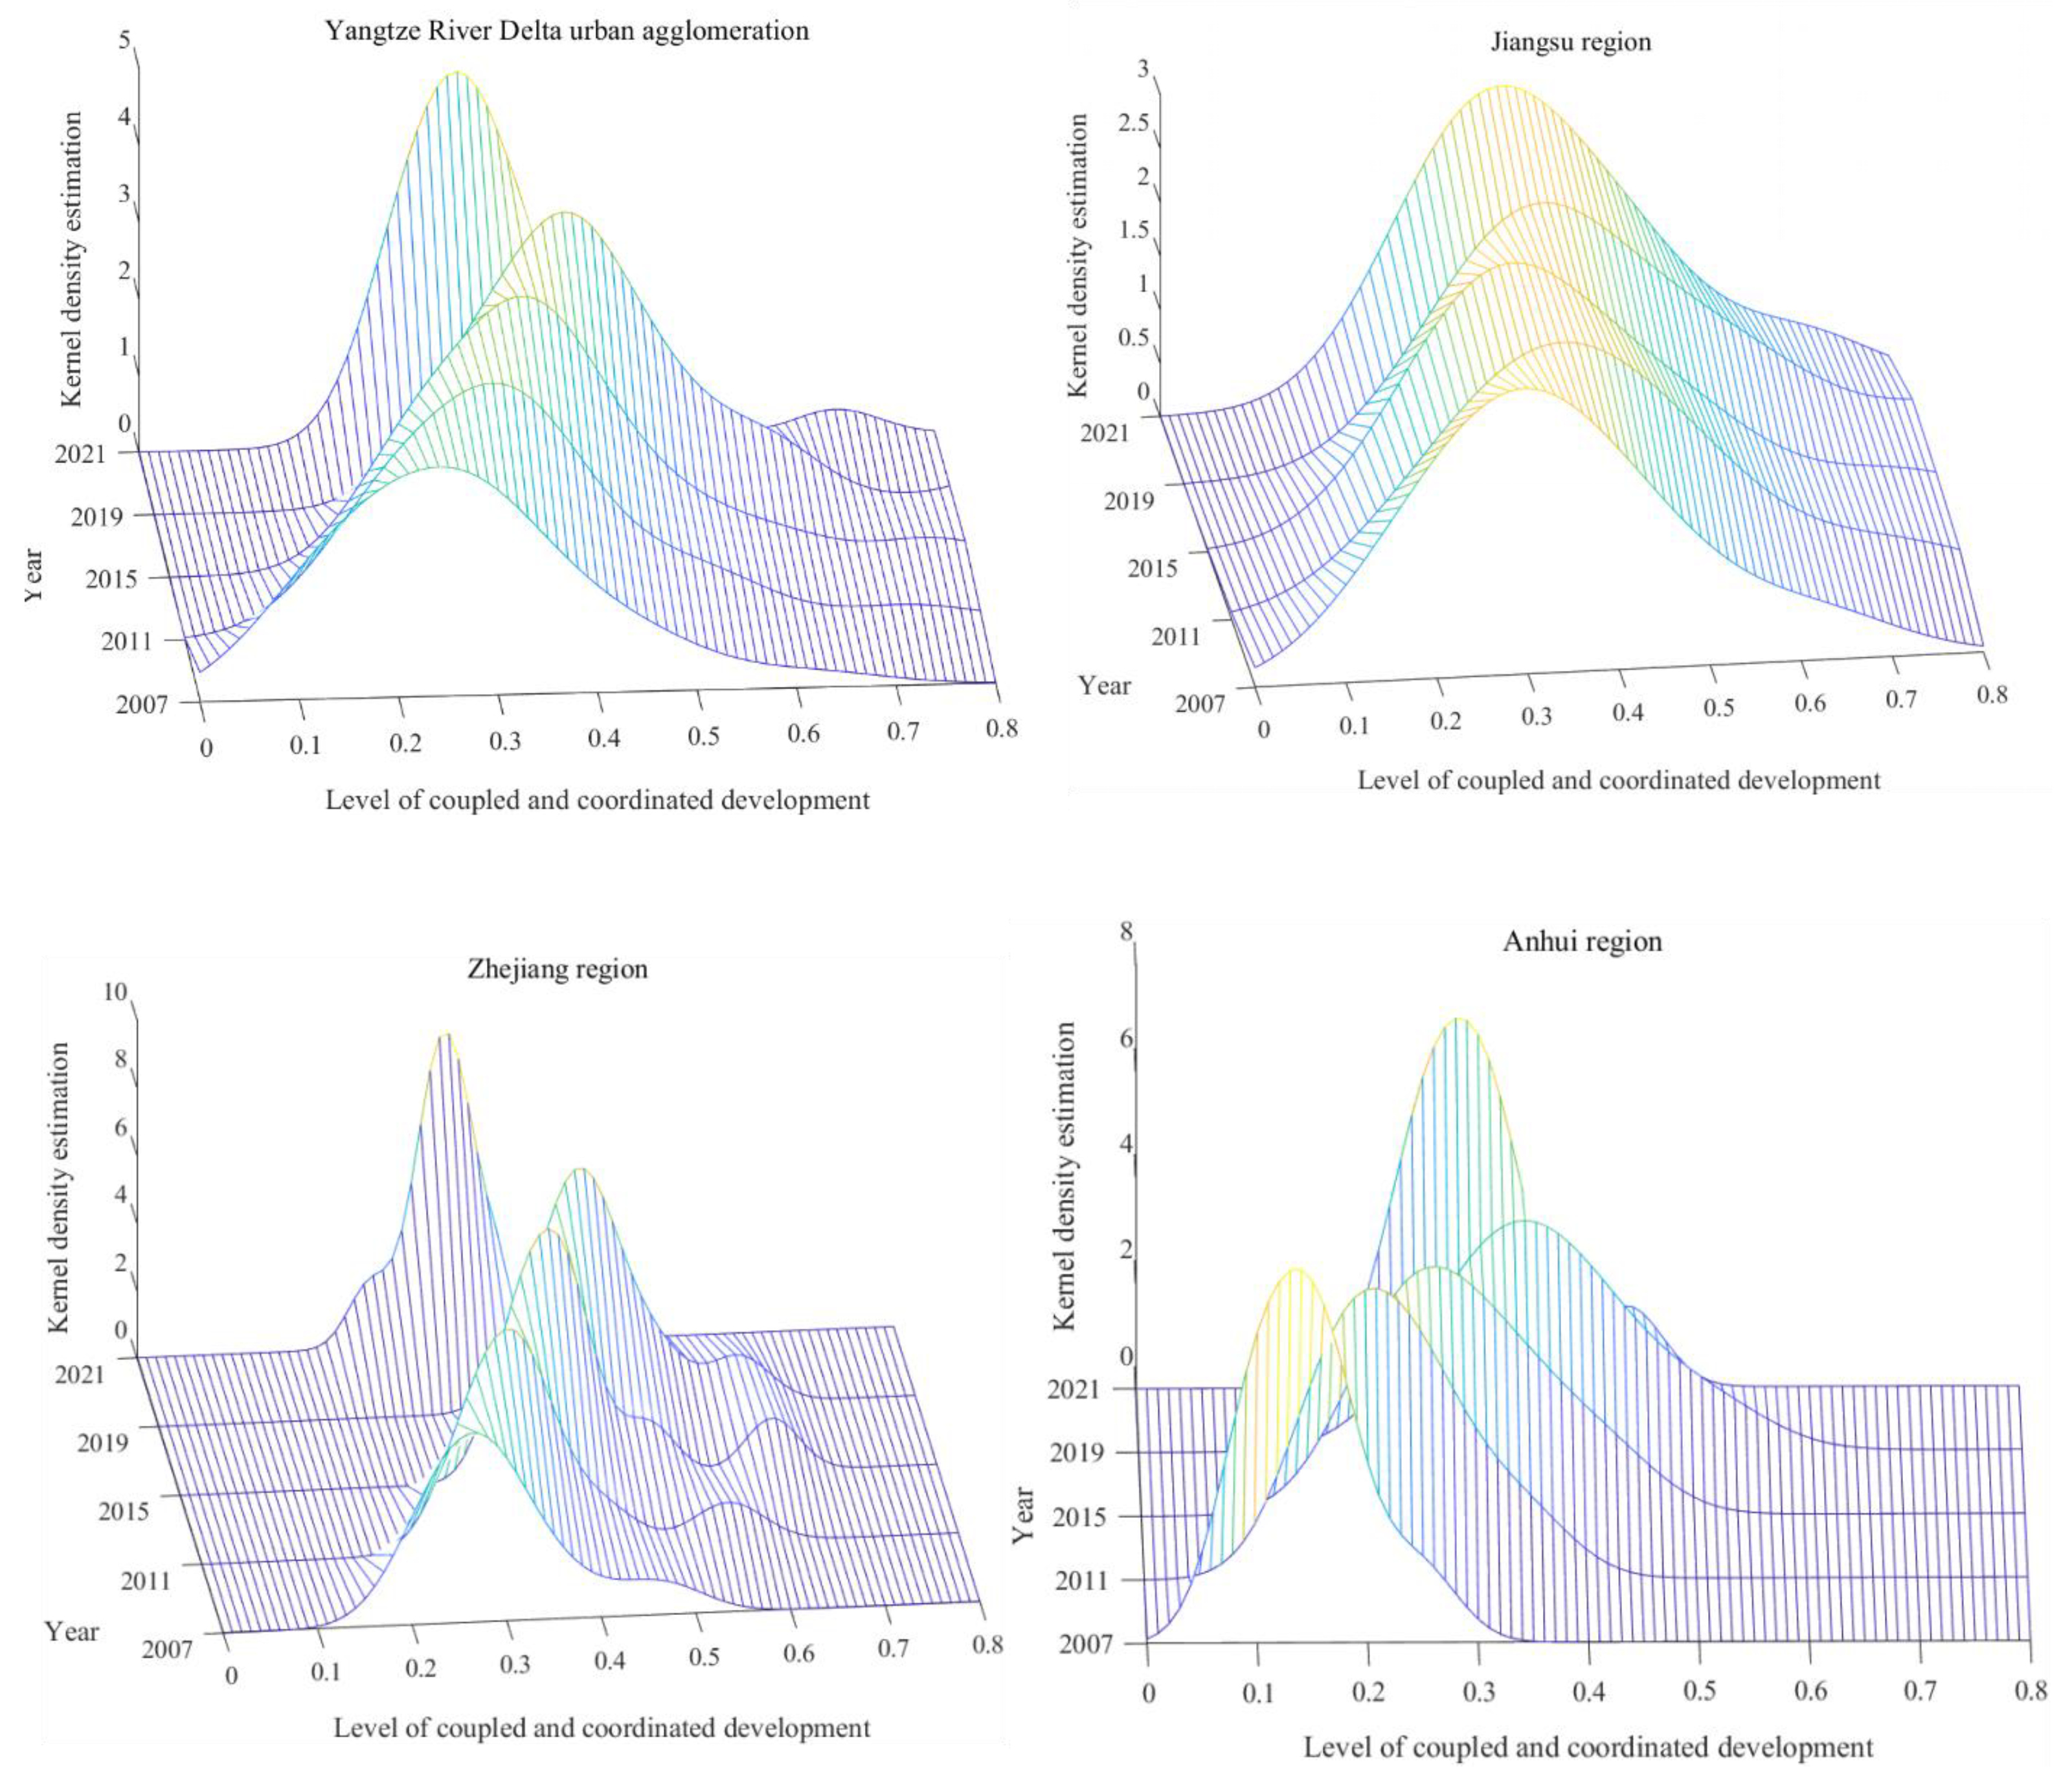
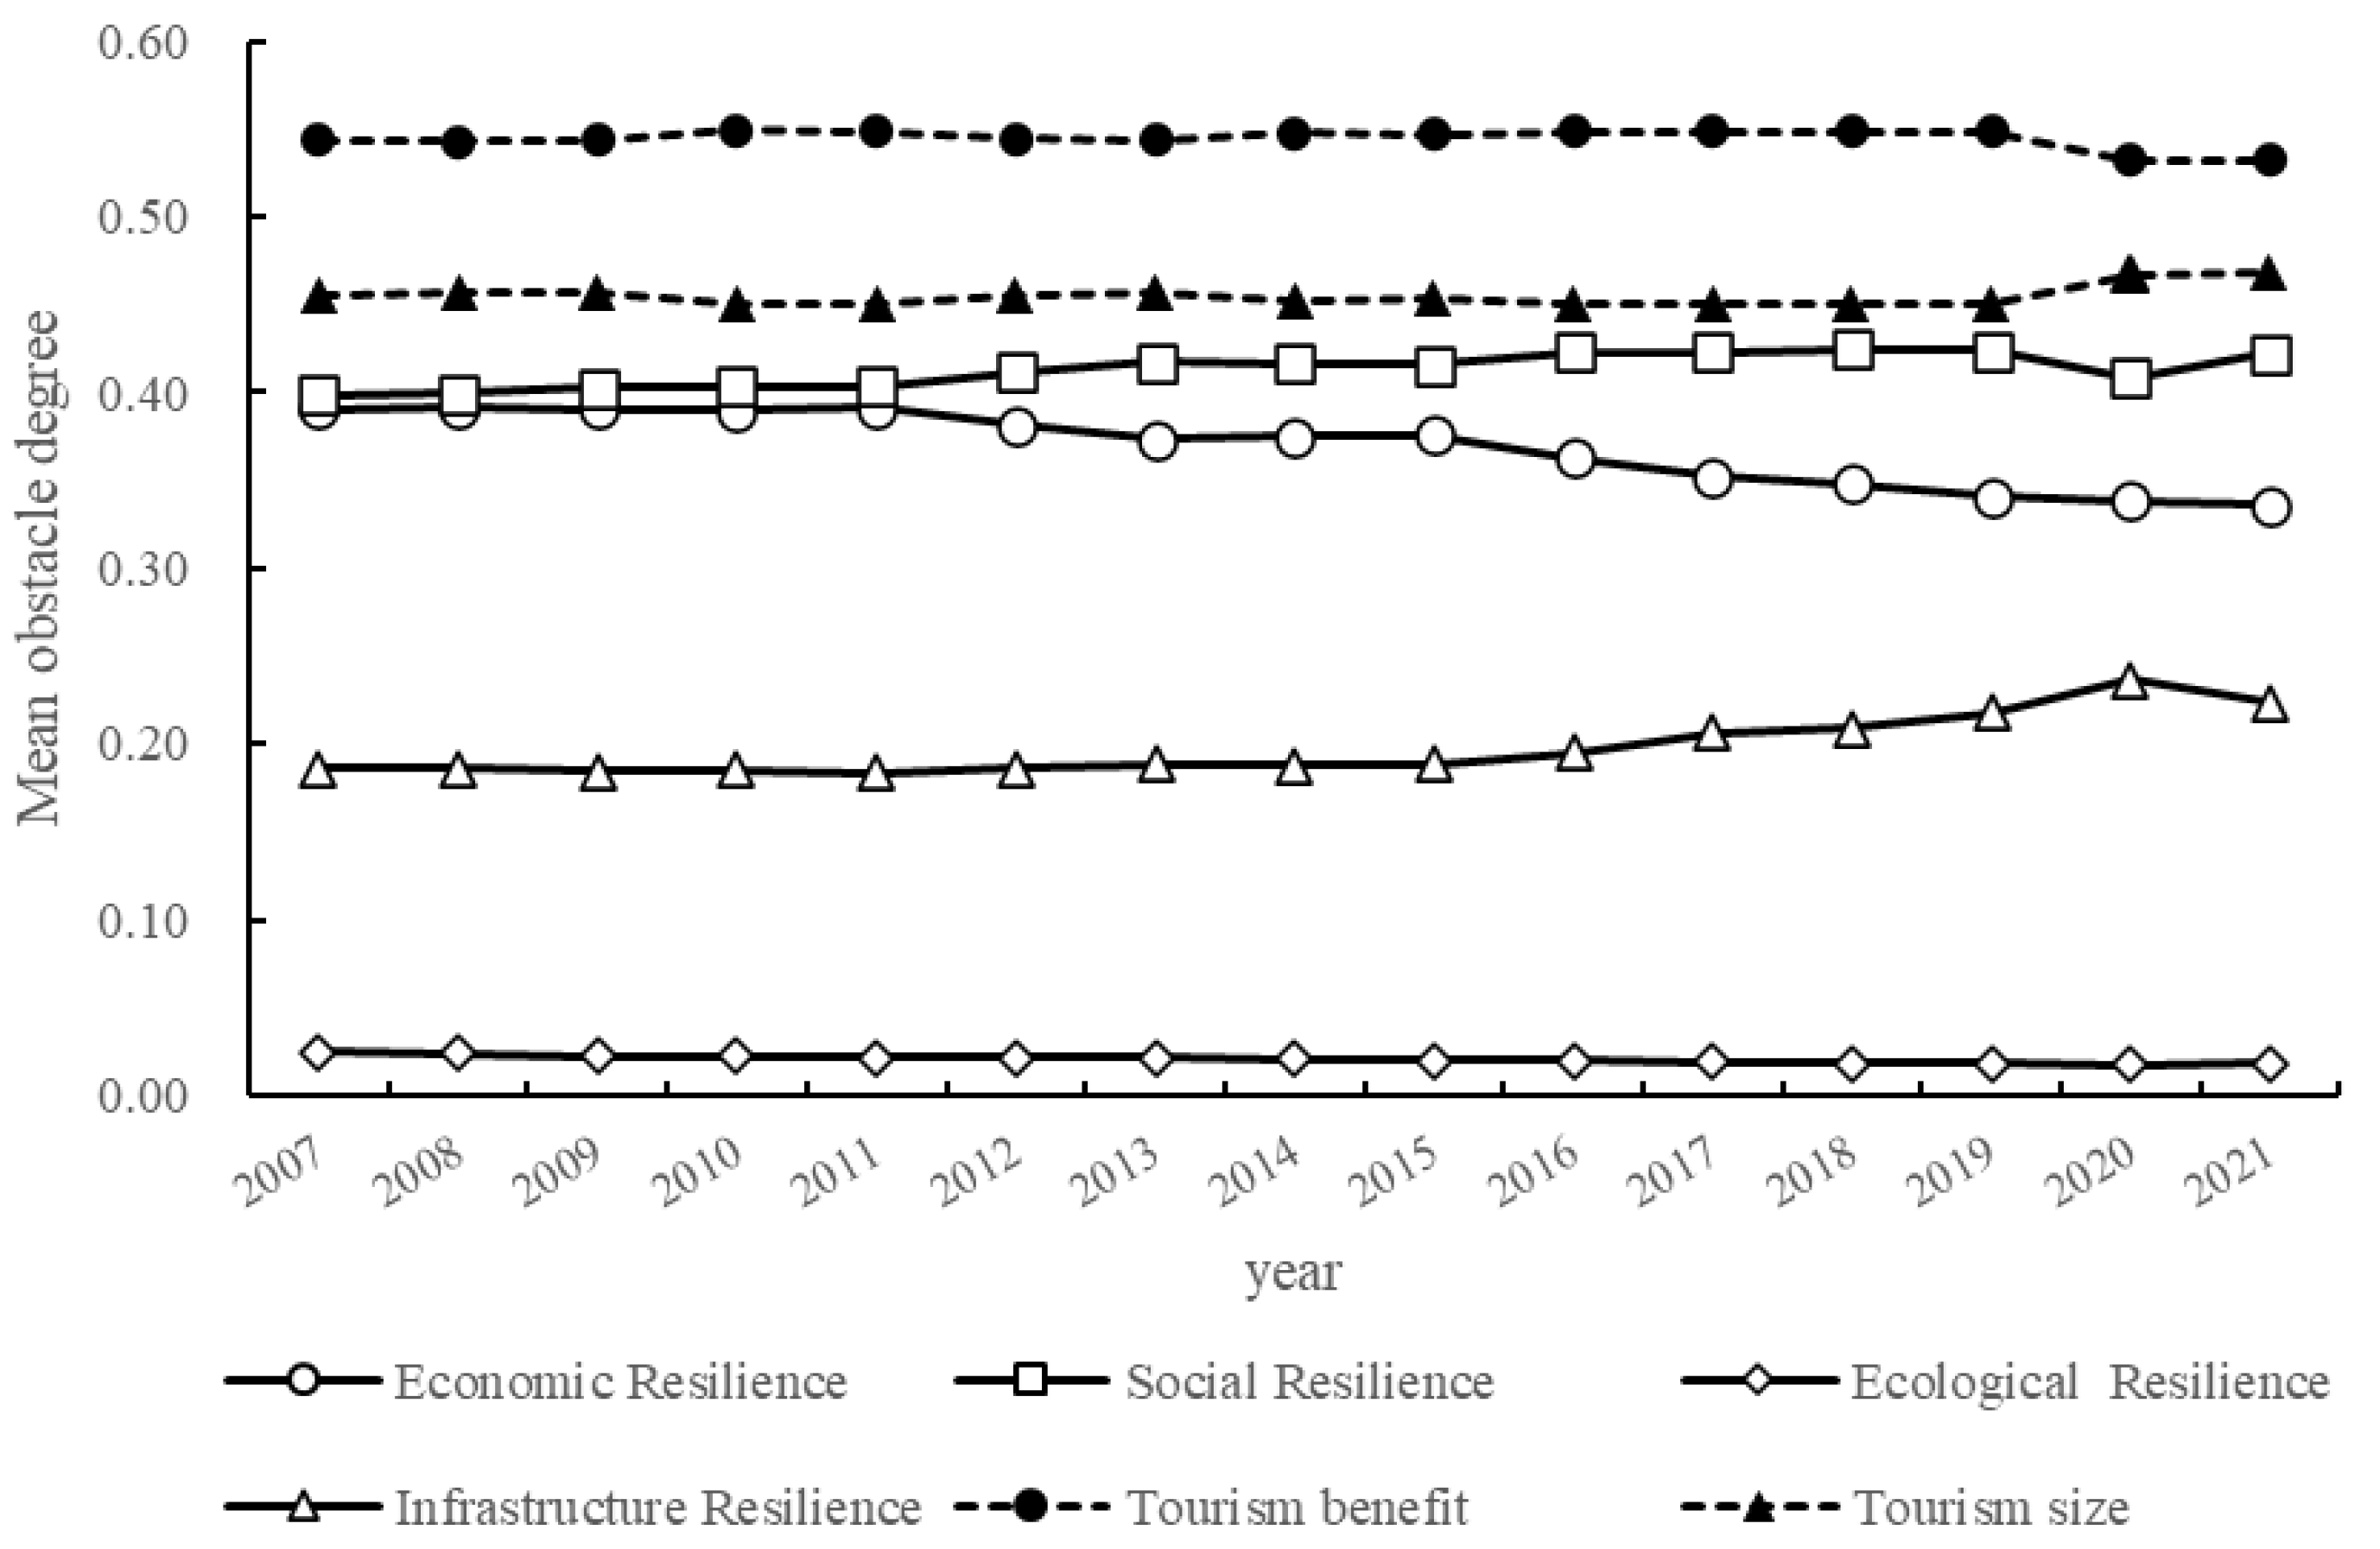
Disclaimer/Publisher’s Note: The statements, opinions and data contained in all publications are solely those of the individual author(s) and contributor(s) and not of MDPI and/or the editor(s). MDPI and/or the editor(s) disclaim responsibility for any injury to people or property resulting from any ideas, methods, instructions or products referred to in the content. |
© 2024 by the authors. Licensee MDPI, Basel, Switzerland. This article is an open access article distributed under the terms and conditions of the Creative Commons Attribution (CC BY) license (https://creativecommons.org/licenses/by/4.0/).