Article

Analysis of a Multiple Traffic Flow Network’s Spatial Organization Pattern Recognition Based on a Network Map

The Academy of Digital China (Fujian), Fuzhou University, Fuzhou 350002, China
*
Author to whom correspondence should be addressed.
Sustainability 2024, 16(3), 1300; https://doi.org/10.3390/su16031300
Submission received: 19 December 2023 / Revised: 23 January 2024 / Accepted: 1 February 2024 / Published: 3 February 2024

Abstract

:
Detecting the spatial organization patterns of urban networks with multiple traffic flows from the perspective of complex networks and traffic behavior will help to optimize the urban spatial structure and thereby promote the sustainable development of the city. However, there are notable differences in regional spatial patterns among the different modes of transportation. Based on the road, railway, and air frequency data, this article investigates the spatial distribution and accessibility patterns of multiple transportation flows in the Yangtze River Economic Belt. Next, we use the TCD (Transportation Cluster Detection) community discovery algorithm and integrate it with the Baidu Maps API to obtain real-time time cost data to construct a community detection model of a multiple traffic flow network. We integrate the geographical network and topological network to perform feature extraction and rule mining on the spatial organization model of the urban network in the Yangtze River Economic Belt. The results show that: (1) The multiple traffic flow network of the Yangtze River Economic Belt has significant spatial differentiation. The spatial differentiation of aviation and railway networks is mainly concentrated between regions and within provinces, while the imbalance of highway networks is manifested as an imbalance within regions and between provinces. (2) The accessibility pattern of the highway network in the Yangtze River Economic Belt presents a “core–edge” spatial pattern. The accessibility pattern of the railway network generally presents a spatial pattern of “strong in the east and weak in the west”. Compared with sparse road and railway networks, the accessibility pattern of the aviation network shows a spatial pattern of “time and space compression in western cities”. (3) A total of 24 communities were identified through the TCD algorithm, mainly encompassing six major “urban economic communities” located in Guizhou, Yunnan, Anhui, Sichuan–Chongqing, Hubei–Hunan–Jiangxi, and Jiangsu–Zhejiang–Shanghai. (4) The urban network space organization model of the Yangtze River Economic Belt can be roughly divided into three models: the “single-core” model, with Guizhou, Kunming, and Hefei as the core, the “dual-core” model, constructed by Chengdu–Chongqing, and the “multi-core” model, constructed by Changsha–Wuhan–Nanchang and Shanghai–Nanjing–Hangzhou. This model of urban network spatial organization holds indicative significance in revealing the spatial correlation pattern among prefecture-level city units.

1. Introduction

In the context of economic globalization and regional integration, China’s “14th Five-Year Plan” explicitly states the need to “accelerate the construction of a transportation powerhouse, improve comprehensive transportation systems, and expedite the networked development of transportation infrastructure within urban clusters and metropolitan areas” [1]. The importance of building a modern, comprehensive, three-dimensional transportation network has become increasingly prominent. As an important indicator of the “flow space” network, traffic flow is not only a new medium for the identification of regional development patterns [2], but also an important evaluation dimension under the concept of sustainable development. It can characterize the real-world transportation infrastructure’s service capacity in terms of space and population. Therefore, detecting spatial organization patterns based on residents’ actual travel conditions is of great significance for transportation planning and regional sustainable development patterns.
Existing research on the urban network structure from the perspective of traffic flow, focusing on internal street units, is primarily based on spatial interaction networks, which rely on data from sources such as mobile phone signaling [3], GPS trajectories [4], subways [5], and bus card swipes [6]. However, the findings are subject to certain limitations. Outside the city, urban networks are mainly constructed separately using highway [7,8], railway [9,10,11,12], aviation [13,14,15], and flight data. Due to differences in efficiency and experience among different modes of transportation, their spatial patterns and spatial organization models are diverse. As a result, some scholars have comparatively analyzed the hierarchical structure and organizational models of urban networks based on the railway flow and aviation flow [16], or the highway flow and railway flow [17], but, overall, they still focus on the analysis of a single transportation network and lack a comprehensive, weighted analysis of multiple transportation networks. In terms of the research methodology, the approaches commonly used include the agglomerative subgraph algorithm [18], community detection models [19], and others to achieve the segmentation of regional sub-networks. Among them, community detection models can more effectively and accurately reveal the grouping effect in urban networks, including Girvan–Newman [20], Walktrap [21], Label Propagation [22], Infomap [23], etc. However, these models only consider the network topological relationship, failing to consider the impact of the geographical distance on the connection strength [24]. For this reason, Chen et al. [25] introduced the geographical distance into the calculation of modularity, i.e., geographical modularity. The measurement of the community geographical distance can use the shortest distance or the average distance between all connected edges. For example, the Netwalk algorithm proposed by Zhou [26] uses the average distance to define the proximity index. However, in large-scale transportation networks, due to the real-time road conditions, train and flight travel costs, and other characteristics that affect travelers’ choices [27], most people prefer to choose the optimal route and may also choose other, sub-optimal routes. In addition, some scholars have introduced the hierarchical clustering method [28] when detecting network communities and constructed a bottom-up tree to represent the clustering hierarchy based on the connection strength level. For example, Wan et al. [29] employed the DASSCAN algorithm based on density clustering to merge spatially adjacent nodes with similar structures into communities, but this method was only used for homogeneous spatial networks within partitions. To address the aforementioned issues, Yue et al. [24] proposed the Transportation Cluster Detection (TCD) community detection algorithm based on K-shortest paths and hierarchical clustering. The algorithm utilizes K-shortest paths to reflect real travel behaviors, employs a bottom-up hierarchical clustering approach to explore node-merging processes, and incorporates geographical modularity to identify the optimal communities. However, the potential influence of the intracity travel time on spatial organization patterns is currently disregarded in research. For actual travel, it is also necessary to consider the total travel time within and outside the city using a combination of transportation modes, such as walking, cycling, or car travel [30]. Introducing a network community structure detection model that takes into account the network topology and geographical distance could help to effectively mine the community structure of urban networks and identify the organizational patterns of its spatial correlation structure.
The transportation system within the Yangtze River Economic Belt holds a distinctive position in China for its ability to coordinate the northern and southern regions, while also connecting the eastern and western areas. At present, the urban network in this region is mainly concentrated in the Yangtze River Delta [9,31,32], the middle reaches of the Yangtze River [33,34,35], and the Chengdu–Chongqing [36,37] urban agglomeration, and a comparative analysis of the three has been performed [38,39]. There are few studies that specifically delineate the spatial organization patterns and explore the comprehensive transportation network in the Yangtze River Economic Belt. In view of this, based on the highway, railway, and air flight data of 130 cities in the Yangtze River Economic Belt, this paper employs the Theil index and weighted average travel time to analyze the spatial differentiation characteristics and accessibility pattern of the multiple traffic flow network, and uses the TCD community discovery algorithm to integrate Baidu Maps’ time cost data to build a community detection model of a multiple traffic flow network. We also comprehensively integrate the geographical network and topological network to explore in depth the urban network spatial organization model from the perspective of multiple traffic flows in the Yangtze River Economic Belt. The purpose of this article is to explore the spatial pattern of the urban network of the Yangtze River Economic Belt from the perspective of multiple traffic flow connections, and to further reveal the integrated transportation integration effect of the urban agglomeration. It will provide a scientific reference for the optimization of the urban spatial structure and regional sustainable development strategy.

2. Research Methodology

2.1. Study Area and Data
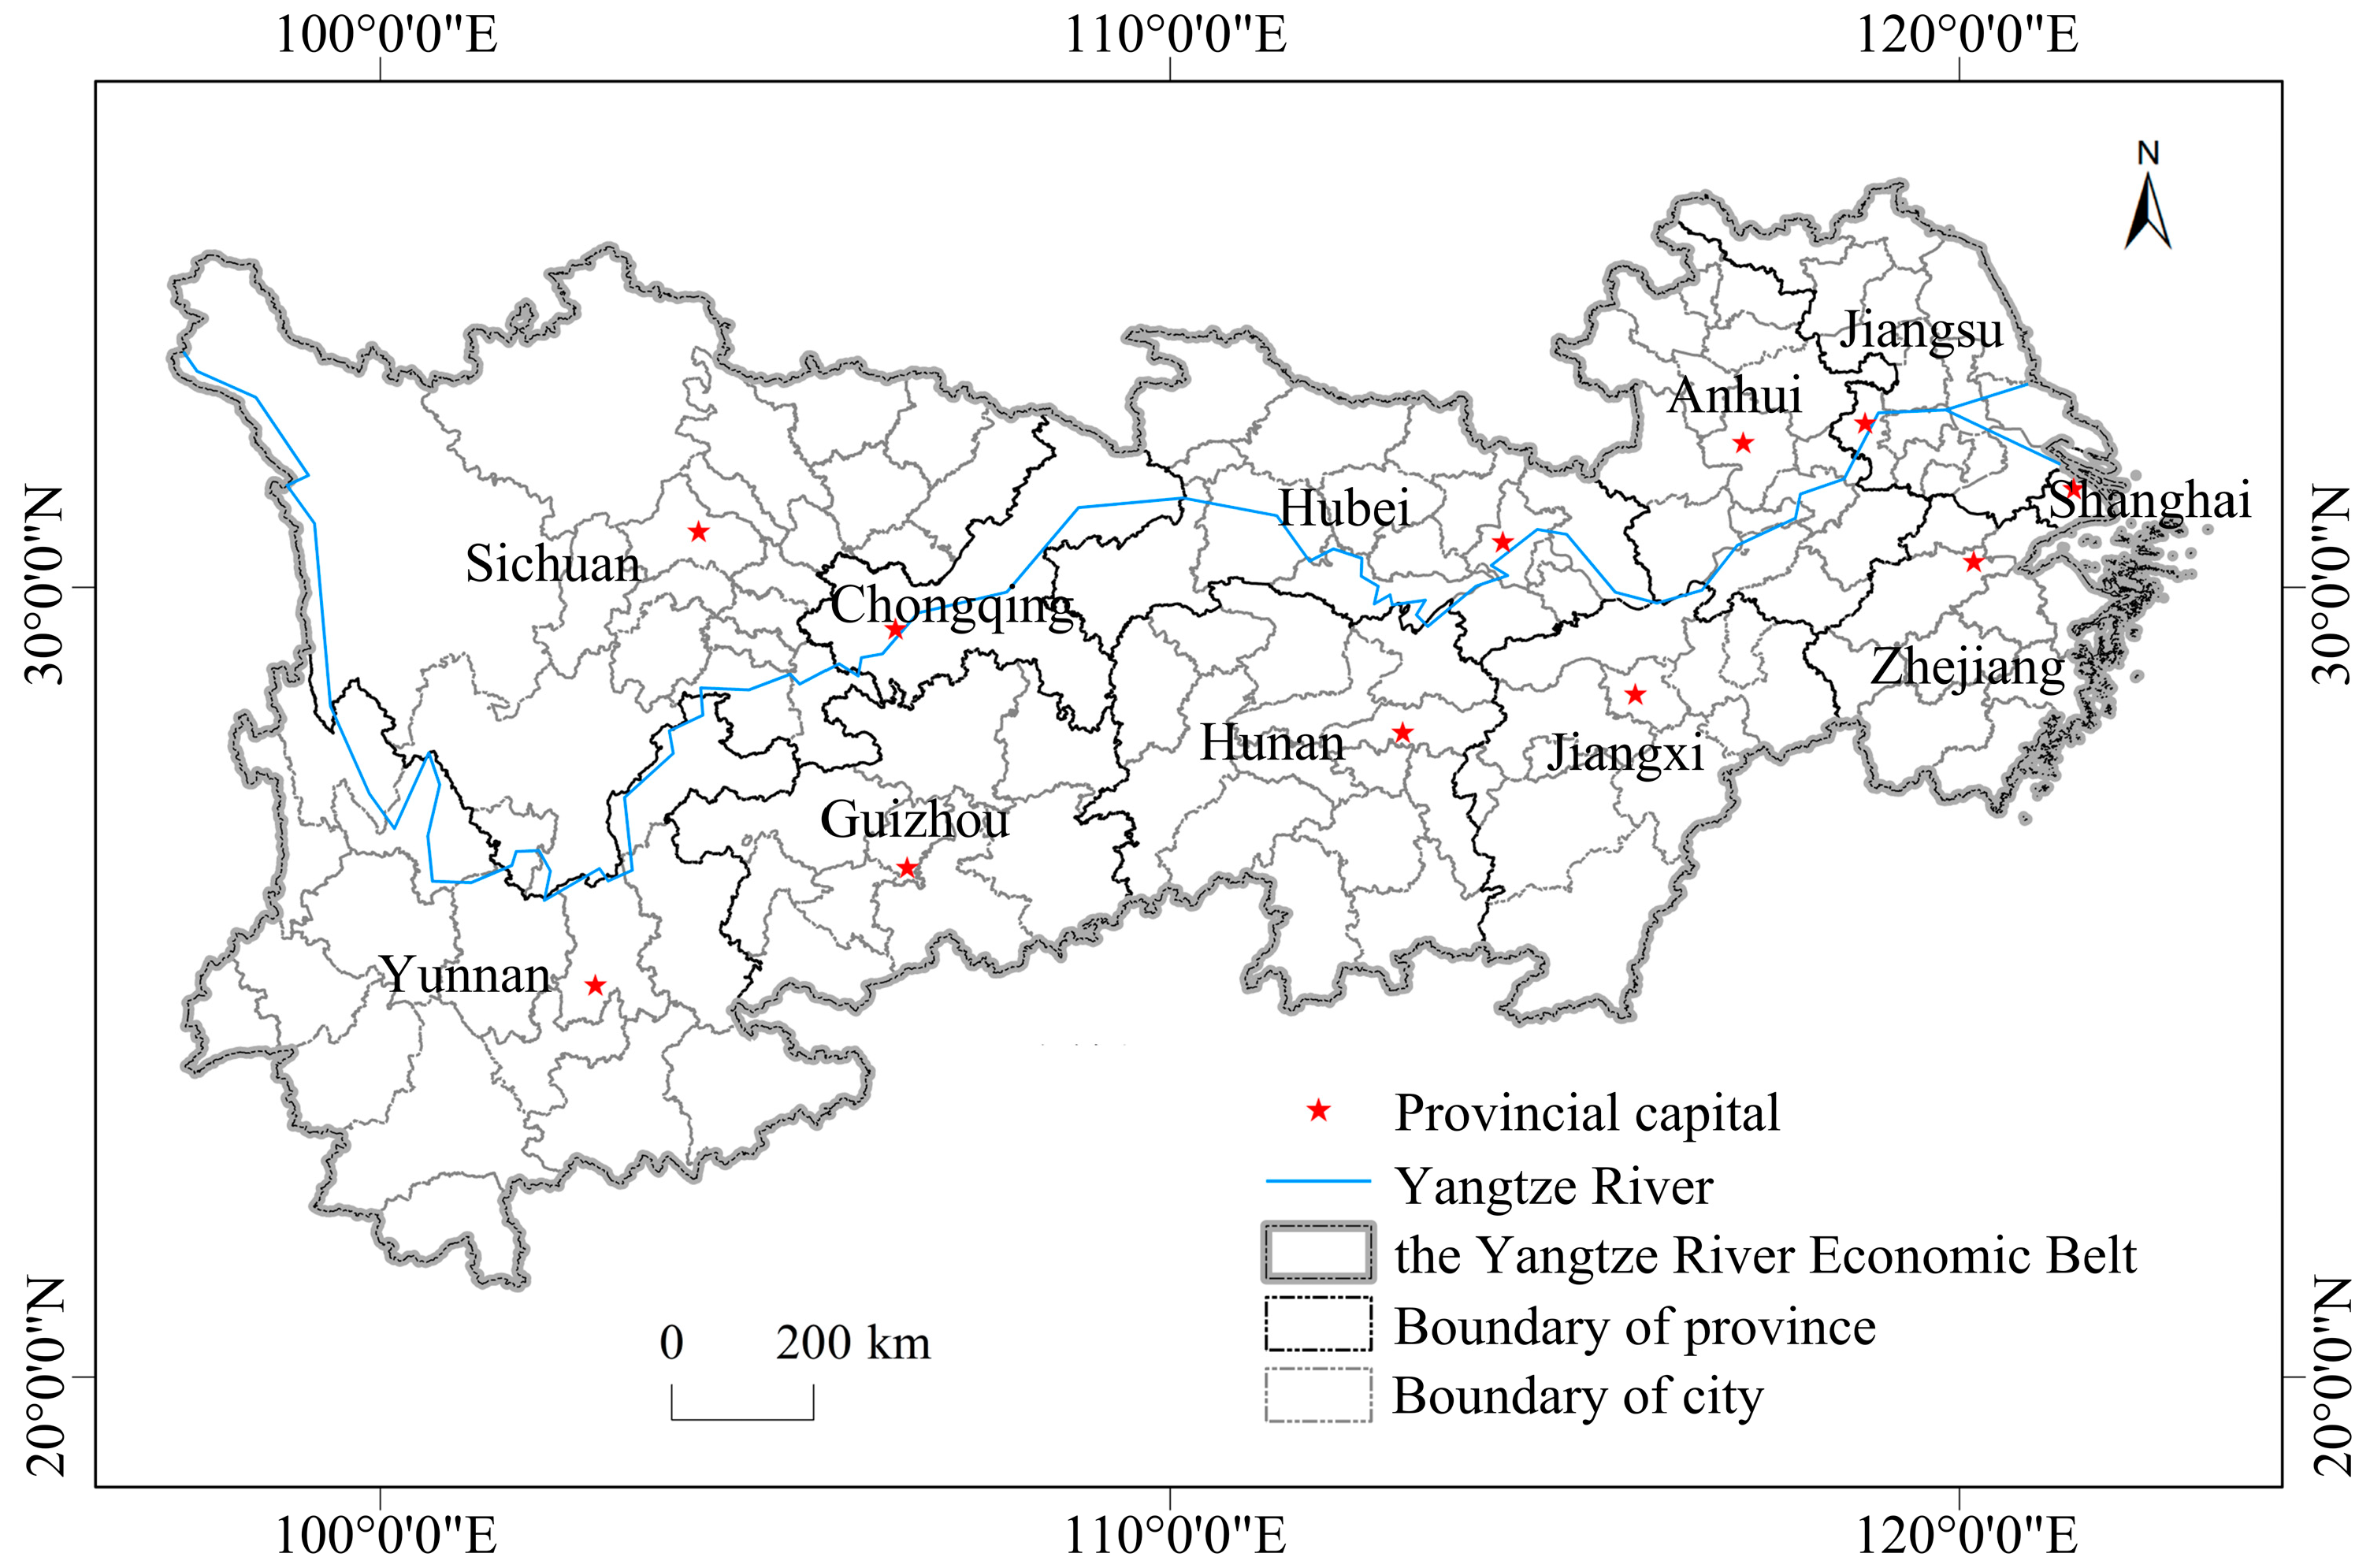
2.1.1. Study Area

The Yangtze River Economic Belt possesses the advantage of being a bi-directional, open, and comprehensive land–sea development axis. It includes 11 provinces and municipalities, including Shanghai, Zhejiang, Jiangsu, Anhui, Hubei, Hunan, Guizhou, Sichuan, Chongqing, and Yunnan. It covers approximately 22% of China’s land area (2.05 million km2). Furthermore, the region’s combined population and GDP account for over 40% of the country’s total figures [40]. As shown in Figure 1, this study selected 130 cities in the region as the study area based on the existing administrative regions, including 108 prefecture-level cities, 16 autonomous prefectures, 5 municipalities, and 1 forest area (Hubei’s Shennongjia Forestry District is a county under provincial jurisdiction).

2.1.2. Data

In this study, Python was utilized to extract railway, road, and aviation flight data for 130 cities in the Yangtze River Economic Belt during the month of March 2022 from Ctrip.com. A 130 × 130 relationship matrix was constructed to depict the degree of spatial connectivity in the urban network of the Yangtze River Economic Belt. In order to ensure data integrity, we collected Qunar.com and railway network-related data, and merged and supplemented the results. Subsequently, data cleaning and manual checks were performed to ensure the accuracy of the data. Since highway and railway timetables have relatively fixed schedules, only one day worth of data was used as a representative. In contrast, flights are impacted by factors such as seasonal changes and economic activities, resulting in some variations. Therefore, one week worth of data was used and averaged as a representative for flights. At the same time, we used the Baidu Map API route planning interface to obtain the travel time cost of highway, railway, and aviation from the 130 starting city government centers to the destination city government centers in the Yangtze River Economic Belt. To avoid the influence of real-time traffic conditions, various traffic travel time data were collected for a continuous week and the average value was finally used as the actual travel time. The information obtained is all publicly visible data and is only used for academic research, and the use of the data is legal.

2.2. Construction of Networks

Based on the principle of complex network graph theory, we used the 130 cities in the Yangtze River Economic Belt as nodes, the intercity transportation links as edges, and the shift intensity as weights to construct a weighted asymmetric relationship matrix (Equation (1)) of the urban network in the Yangtze River Economic Belt. In this study, three types of urban networks in the Yangtze River Economic Belt were constructed from the perspective of highways, railways, and aviation, in order to comprehensively understand the current pattern of intercity transportation links in the Yangtze River Economic Belt:
R i j = 0 R 12 R 1 ( n 1 ) R 1 n R 21 0 R 2 ( n 1 ) R 2 n R ( n 1 ) 1 R ( n 1 ) 2 0 R ( n 1 ) n R n 1 R n 2 R n ( n 1 ) 0 , R = R i j
where R i j is the traffic flow intensity of the city.
The overall correlation statistics of the highway, railway, and aviation networks of the Yangtze River Economic Belt are shown in Table 1. Among them, the intra-provincial connections by highway are relatively balanced, while most of the railway and aviation connections are between urban agglomerations and provinces and cities. There are 121 cities in the Economic Belt with railway stations and high-speed rail stations, and there are 5949 pairs of intercity connections, of which 64% of intra-regional connections are concentrated in the eastern region. There are 70 cities with opened airport routes and a total of 946 intercity air routes.

2.3. Theil Index

This study used the Theil index to measure the difference in the connection intensity of intercity multiple traffic flow networks. This index can accurately measure the gaps within and between groups. Based on 130 cities as the basic research unit, the spatial distribution pattern differences of the multiple traffic flow networks in the Yangtze River Economic Belt were revealed from the four perspectives of inter-regional (inter-provincial) differences and intra-regional (intra-provincial) differences. The Theil index can be calculated with Equations (2)–(5):
T = i n X i X ln X i j / X N i j / N
T = T w + T b
T w = i X i X T p i = i X i X j X i j X i ln X i j / X i 1 / N i
T b = i Y i j Y ln Y i / Y N i / N
where T is the total difference within and between groups, T w and T b represent inter-regional (inter-provincial) differences and intra-regional (intra-provincial) differences, respectively, and X i j represents the schedule linkage frequency in the j-th city of the i-th region (province) in the economic belt. X represents the schedule linkage frequency in all cities, X i represents the schedule linkage frequency of all cities in the i-th region (province), N i is the number of cities in the region (province), and N is the total number of cities in the Economic Belt.

2.4. Use of Baidu Maps API to Obtain Time Distance

The travel cost is an important factor affecting the strength of transportation network connections. Residents prioritize time over distance when traveling. Existing studies have used train travel times between cities as the geographical distance, ignoring the intracity travel times. In particular, train stations and airports in first-tier cities are far away from the city center, resulting in a higher proportion of intracity travel time within the total travel time, which directly affects the utilization of the transportation infrastructure and in turn affects the community discovery results of the transportation network. In this study, we utilized the time cost information for multiple transportation modes obtained from the Baidu Maps API’s route planning interface as the geographical distance in the community detection model. We traversed 130 city pairs in the Yangtze River Economic Belt to obtain the transportation times between city center points. We adopted a “door-to-door” travel approach that took into account real-time traffic conditions for various modes of transportation and transfer combinations (Figure 2). This approach offers a more accurate representation of residents’ actual travel patterns and is a reasonable way to express travel times that consider residents’ travel choices. The total travel time between the central points of the two cities includes the total travel time inside and outside the city, t ( T , C , A ) (Equation (6)), under the three travel modes of road, railway, and air. t ( T , C , A ) is divided into 4 stages: (1) the time, t o s , taken for residents to travel from the government center of city i to nearby train stations, bus stations, and airports via public transportation; (2) the time, t t r a n s f e r , required to transfer between two stations, including ticket collection, waiting times, and station entry and exit times, etc.; (3) the running time, t s s , between the two sites, and (4) the time, t s d , taken to travel from the station to the government center of city j via public transportation:
t ( T , C , A ) = t o s + t t r a n s f e r + t s s + t s d
where T , C , and A represent the three modes of transportation: train, car, and aviation, respectively.

2.5. Weighted Average Travel Time

The weighted average travel time is obtained by calculating the average travel time and adding the weights of node influencing factors to measure the impact of the city level, socioeconomic level, population size, infrastructure, etc., on the accessibility spatial pattern [41]. This accessibility index considers the differences in development between the node cities. The calculation methods are shown in Equations (7) and (8):
W A T T i = j 1 n ( T i j M j ) j = 1 n M j
M j = G j P j
where W A T T i is the weighted average travel time/h of city i . The smaller the value, the higher the accessibility of city nodes. T i j represents the shortest travel time/h from the government center of city i to the government center of city j , which is divided into T i j ( highway ) , T i j ( railway ) , and T i j ( a v i a t i o n ) according to different transportation modes. M j is the urban economic development quality of city j . P j represents the population size of city j , based on data from China’s seventh national census on urban permanent population. G j represents the gross regional product of city j .

2.6. Community Detection Model of a Multiple Traffic Flow Network

The implementation process of the community detection model of a multiple traffic flow network based on the TCD algorithm (Figure 3) was as follows: (1) Using the city center as a network node, the ratio of the number of schedule of multi-traffic mode to the time cost obtained using the Baidu Maps API was used as the link weight of the edges in the network to build a comprehensive transportation network. (2) We calculated the K-shortest path between nodes using the Yen algorithm [42], to measure the proximity between cities. (3) The comprehensive weighting of proximity indicators was performed, using the hierarchical clustering method to obtain a clustering tree to reveal the hierarchical structure of the multiple traffic flow network. (4) In the process of clustering, the time cost was introduced as the geographical distance in geographical modularity to obtain optimal community segmentation.

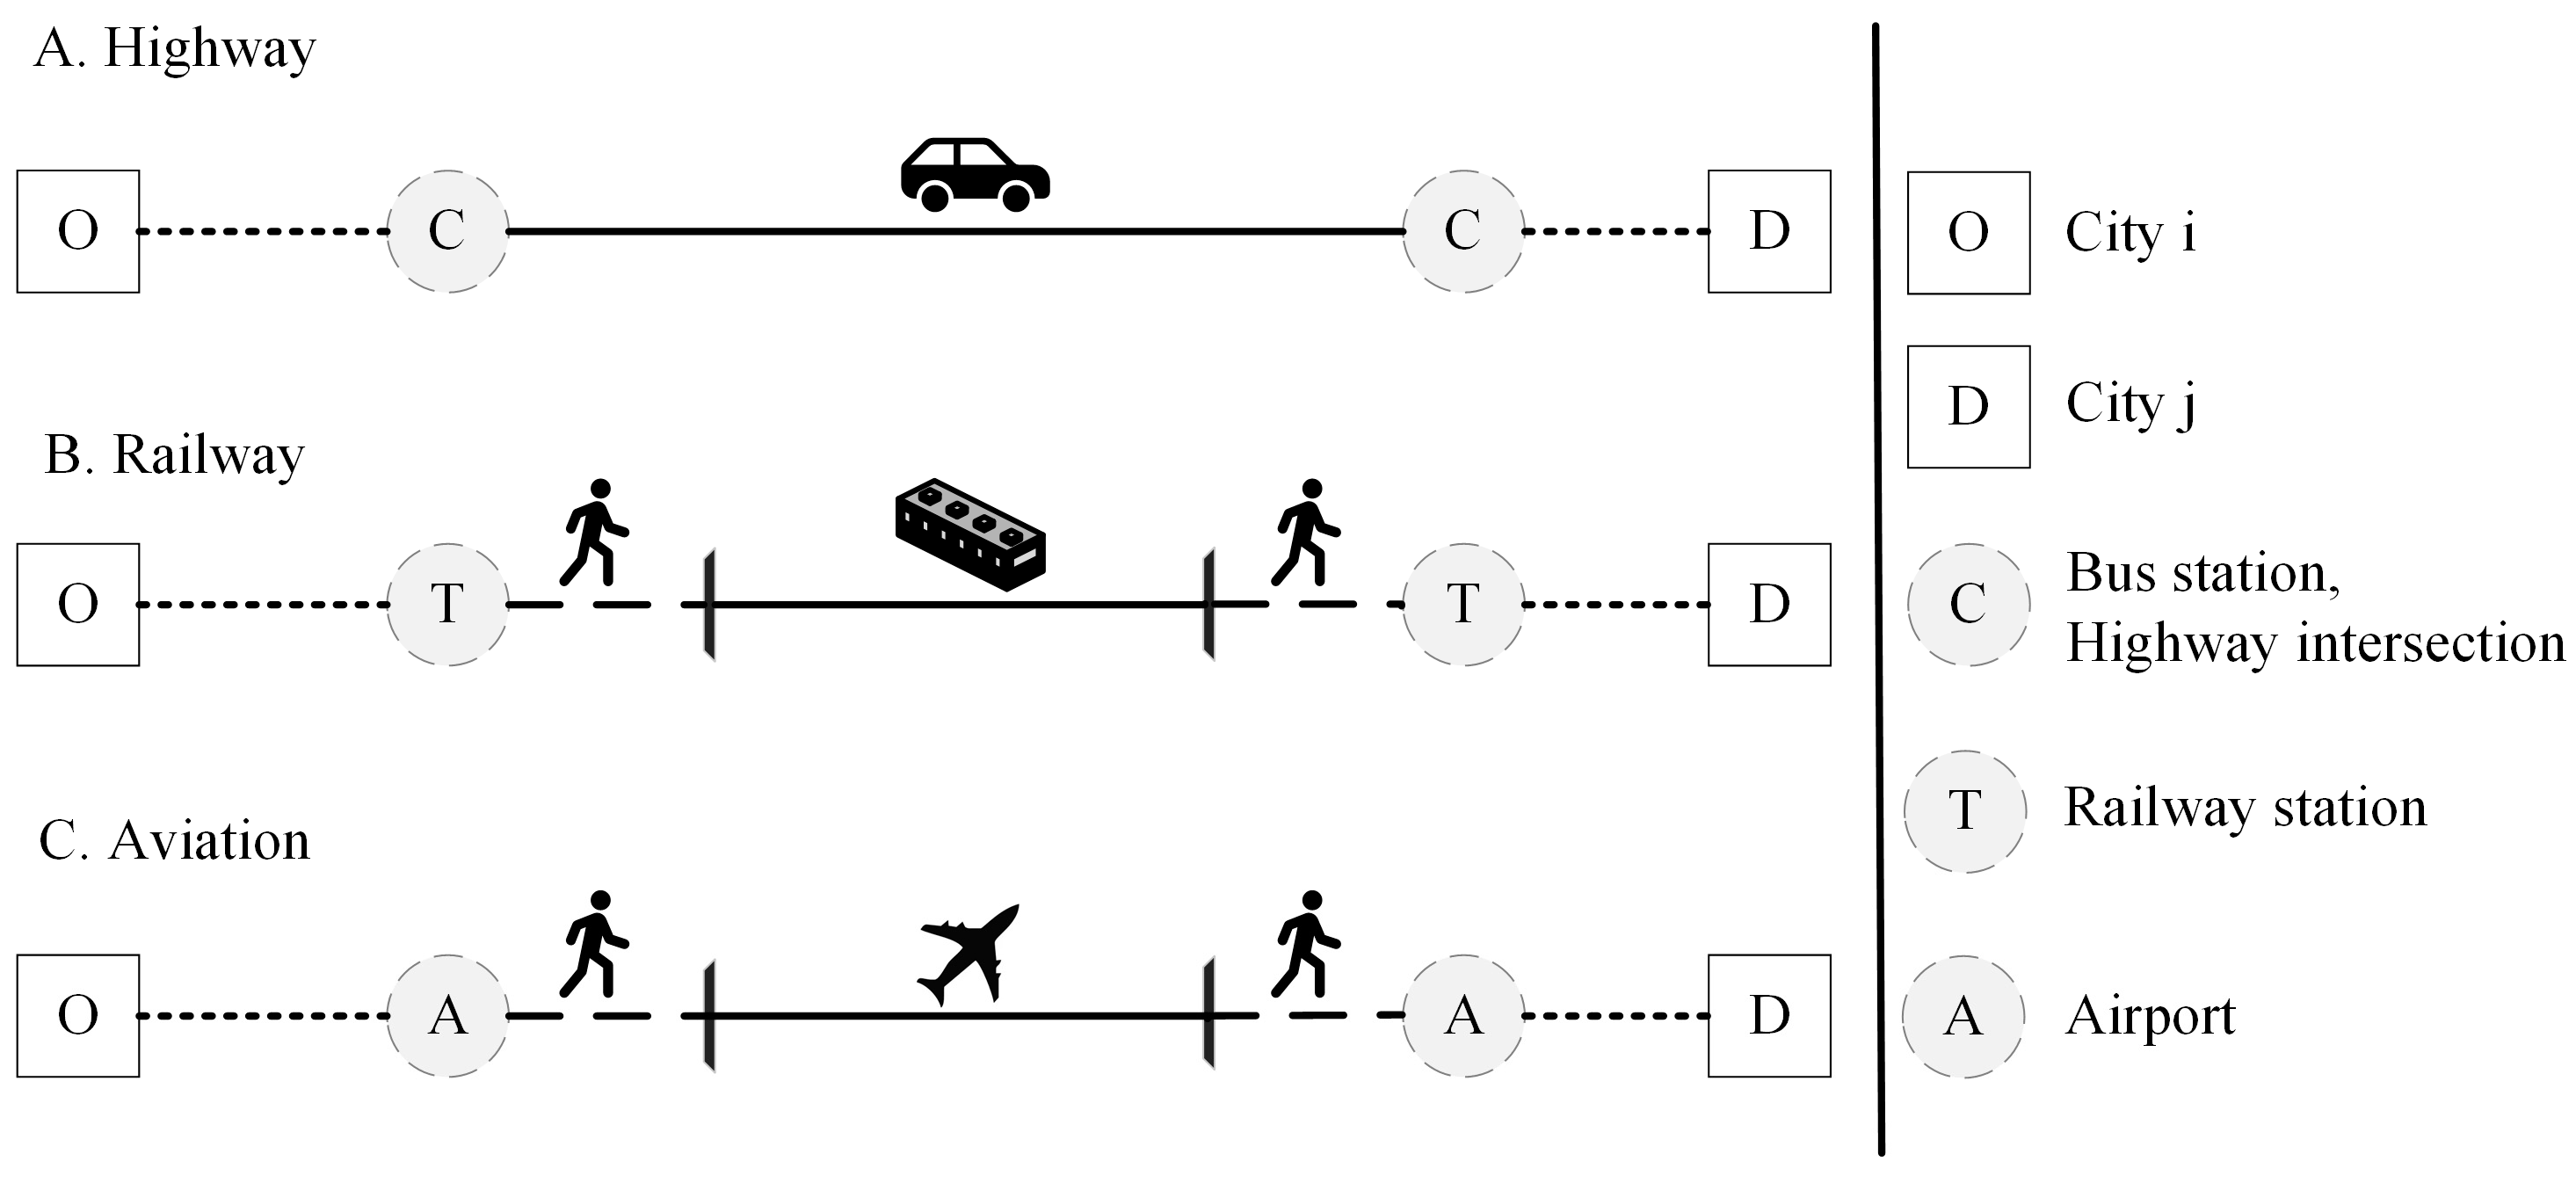
2.6.1. Construction of Multiple Traffic Flow Networks

When constructing a railway network, for cities with multiple train stations, the stations in the original railway lines are replaced with city names and merged into one city node. The original railway network dataset contains high-speed and low-speed trains, so the differences in travel costs for different trains need to be considered. The weight of each type of train link is directly proportional to the number of trips ( m ) between the two cities and inversely proportional to the nth power of the geographical distance (as shown in Equation (9)). In other words, the more trips there are, the shorter the travel time, and the stronger the connection between the two cities. The final link weight, W T , between two city nodes is the sum of the weights of high-speed trains, W G , and slow-speed trains, W K , that pass through them, as shown in Equation (10). In the same way, the ratio of the number of highway and aviation lines to the nth power of the total travel time is used as the edge weight to construct the highway network ( W B ) and the aviation network ( W A ), respectively. The calculation formula of the urban node edge link weight, W C , is shown in Equation (11).
W G = m G t G n , W K = m K t K n
W T = W G + W K
where the travel time t is the geographical distance between the two cities, which is the real-time total travel time between the cities obtained through the Baidu Map route planning API, and n is the distance friction coefficient in the gravity model [42]. In this article, n = 2 [25].
W C = μ W B + ν W T + W A
where μ and ν are the weights of the highway and railway networks, respectively. This study calculated the weight of the comprehensive transportation network based on the proportion of passenger flow. Based on the proportion of passenger traffic data of different transportation modes in the 2022 Transportation Bulletin, the proportion of highway, railway, and air passenger traffic is 16.5:5.27:1. Therefore, the μ value in this article was set to 16.5 and the ν value was 5.27.

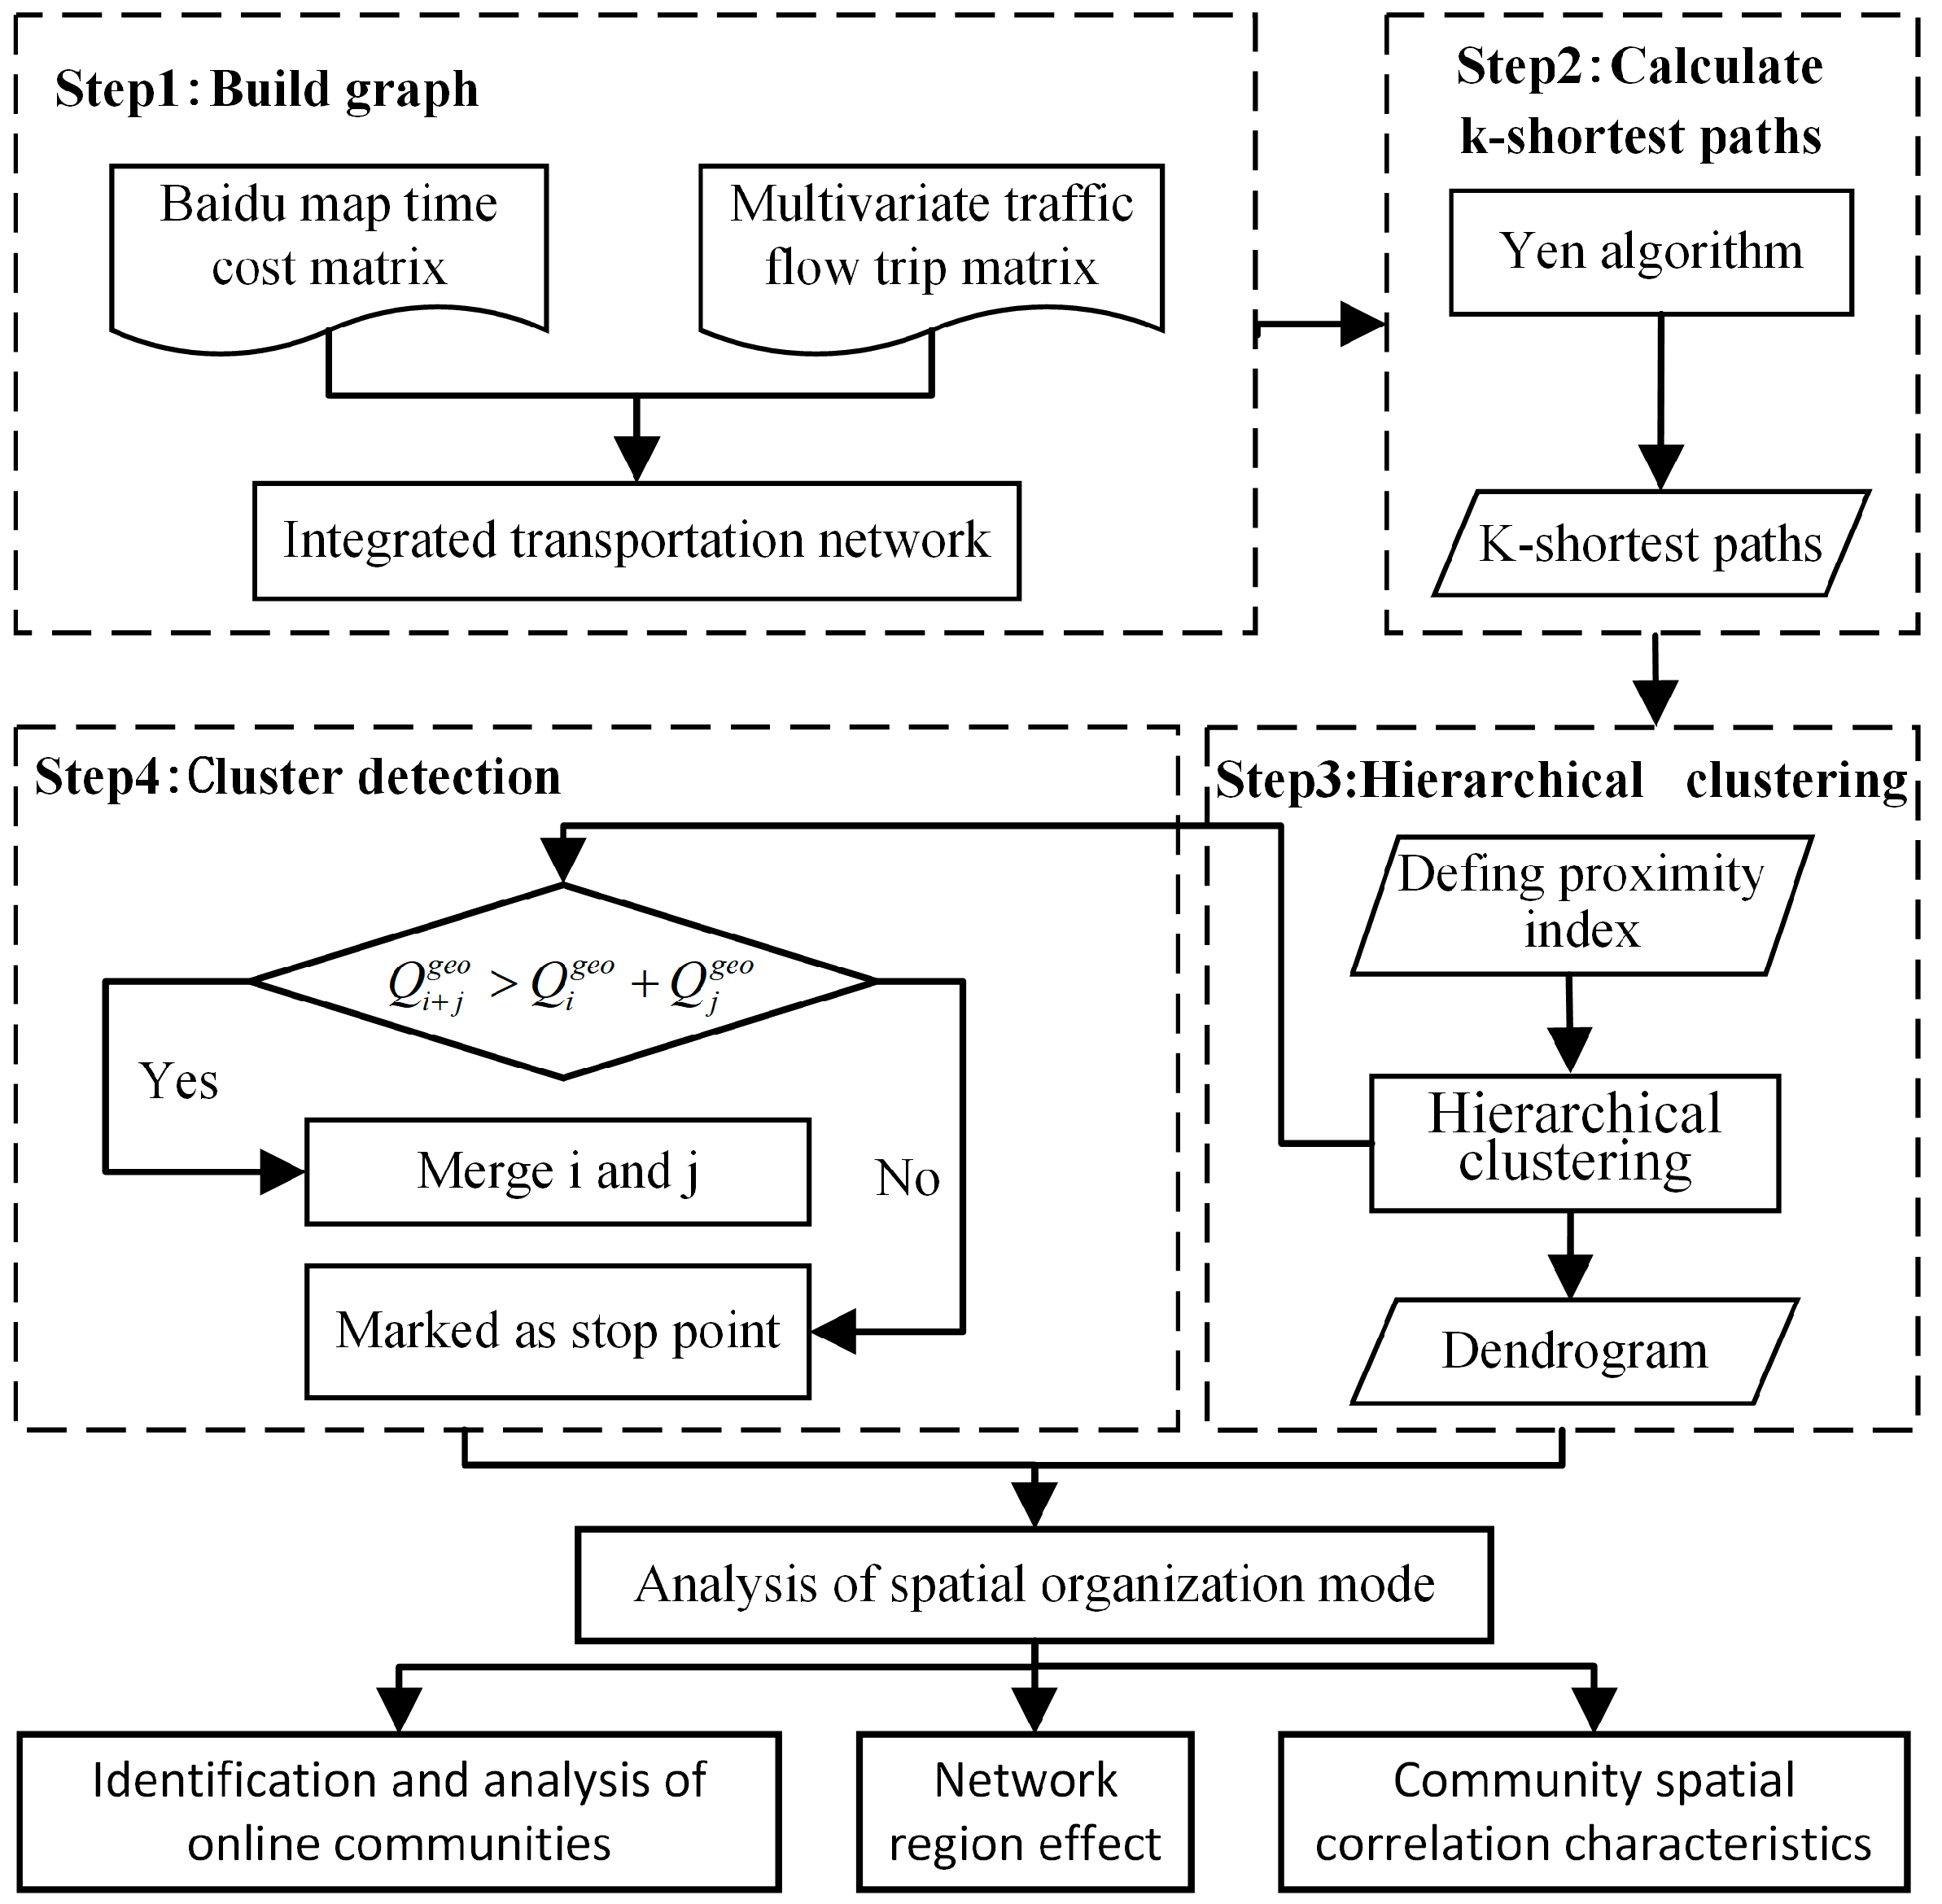
2.6.2. Community Detection Model

Most community detection algorithms based on modularity can take into account topological attributes, including edge weights and connection directions. They can identify similar group structures within the network, but they do not take into account the weakening of the schedule linkage frequency caused by the distance attenuation effect. Based on the actual travel behavior of residents, the Yen algorithm [43] can be used to calculate the K-shortest path between nodes in order to obtain multiple alternative paths with different travel costs to comprehensively reflect residents’ selection of different paths. Therefore, this study used the improved TCD algorithm based on K-shortest paths, hierarchical clustering, and geographical modularity to detect the community structure of the multiple traffic flow network of the Yangtze River Economic Belt. The specific process was as follows: (1) Regarding the K-shortest path and proximity between urban nodes in the multi-modal transportation network in the Yangtze Economic Belt, the reciprocal of the weight W C was used to represent the link strength between two city nodes. The proximity index, Φ ( i , j ) , between city nodes i and j was the weighted combination of K-shortest paths (Equation (12)). (2) In order to obtain the optimal K value and the K-shortest path weight, ω k , we set K to 1~3, with a step size of 1, and ω k to 0~1, with a step size of 0.01. We used hierarchical clustering iteration, merged nodes from the bottom up, and continuously updated the proximity index between communities α and β (Equation (13)). In each iteration, hierarchical clustering was used to merge the community with the smallest proximity index into a single community, and we then updated the proximity index between this new community and all remaining communities. We finally formed a dendrogram to reveal the hierarchy of nodes merged from bottom to top. When clusters α and β merged into α + β , the calculation formula of the proximity index between clusters α + β and γ was as shown in Equation (14). (3) In each iteration of the hierarchical clustering algorithm, the geographical modularity ( Q g e o ) of each community was calculated. The relevant equation can be found in the literature [25]. If communities C 1 and C 2 satisfied Q m e r g e   g e o   > Q c 1 g e o + Q c 2 g e o , then we merged communities C 1 and C 2 . Otherwise, communities C 1 and C 2 were marked as “stop points”. After forming a hierarchical clustering dendrogram, we traced back each branch of the dendrogram from the top. When a “stop point” was encountered, it was divided into two communities. Finally, the multiple traffic flow network nodes were divided into community sets α 1 ,   α 2 ,   ,   α n , and it is guaranteed that the final geographical modularity Q g e o = α i Q α i g e o can obtain the global maximum value.
Φ ( i , j ) = k = 1 K ω k L k
Φ ( α , β ) = 1 n α , β ( i , j ) : i α , j β Φ ( i , j )
Φ ( α + β , γ ) = Φ ( 1 , 5 ) + Φ ( 2 , 5 ) + Φ ( 3 , 5 ) + Φ ( 4 , 5 ) 4
where n α , β is the number of node pairs between clusters α and β .

3. Results and Analysis

3.1. Overall Spatial Differentiation Characteristics of the Network

The traffic flow network within the Yangtze River Economic Belt exhibits significant spatial differentiation. Specifically, the spatial variation at the provincial level exceeds that at the regional level.
At the provincial scale, the spatial differentiation of highway networks is mainly caused by the distance attenuation effect, which makes the inter-provincial gap larger than the intra-provincial gap. In contrast, the railway and aviation networks are mainly responsible for inter-provincial long-distance connections within the Economic Belt, and their intra-provincial passenger transport connections have an obvious uneven distribution. Overall, it can be seen from Figure 4 that the degree of spatial differentiation at the provincial level is the largest for aviation flow, followed by railway flow, while the degree of spatial differentiation for highway flow is the smallest. The gap within provinces is larger for aviation and railway transportation in comparison to the gap between provinces, whereas, for roads, the situation is reversed. Further analysis of prefecture-level cities based on spatial differences within the province (excluding Shanghai and Chongqing) found that the intensity of passenger transport connections between cities under various transportation modes is extremely unevenly distributed within the province, following the sequence of aviation > railway > highway (Figure 5). Among them, Guizhou has established an airport cluster throughout the province in order to overcome its challenging terrain and transport difficulties. The aviation connectivity provinces have the smallest difference in the Theil index, indicating that the internal aviation network in Guizhou Province is developing with high quality. Yunnan has the largest discrepancy in railroad development levels. This can be attributed to the majority of railroads being in mountainous and plateau regions, making railroad construction difficult and time-consuming. Consequently, Dehong, Diqing, Nujiang, Honghe, Wenshan, and other regions have yet to see railways established. The highway network is easily restricted by factors such as terrain undulations and speed restrictions, so western provinces and cities such as Yunnan and Sichuan also have less highway passenger throughput.
At the regional scale, the intra-regional gap in the highway network is larger than the inter-regional gap, while the intra-regional gap in the railway and aviation networks is smaller than the inter-regional gap. In general, highway flow has the largest spatial differentiation at the regional scale, followed by aviation flow, and railway flow has the smallest spatial differentiation (Figure 4). From the perspective of total regional differences, it was found that the inter-regional differences for aviation and railways are greater than within regions, while the opposite is true for highways. Specifically, the differences within the economic zone are decomposed into the eastern, central, and western regions (Figure 6). Due to the large distance gap in ground transportation in the western region, the spatial differentiation within the highway and railway regions is large. The intra-regional differences in the highway, railway, and aviation transportation networks in the central region are all low, indicating that the levels of comprehensive intercity transportation connections in the three provinces of Hubei, Hunan, and Jiangxi are relatively similar. The passenger transportation capacity varies greatly between cities in the eastern region’s aviation network. Only core cities such as Shanghai, Hangzhou, and Nanjing provide a large number of aviation transportation services.

3.2. Accessibility Pattern of Multiple Traffic Flow Networks

Based on the Baidu Maps route planning API interface, the real-time shortest travel time costs between cities in the three transportation modes were obtained, and the weighted average travel time was used to calculate the traffic accessibility values of 130 cities, as shown in Figure 7, using the inverse distance weighting method (IDW). The figure visually displays the accessibility pattern of the Yangtze River Economic Belt under three scenarios: the highway network, railway network, and aviation network:
(1)
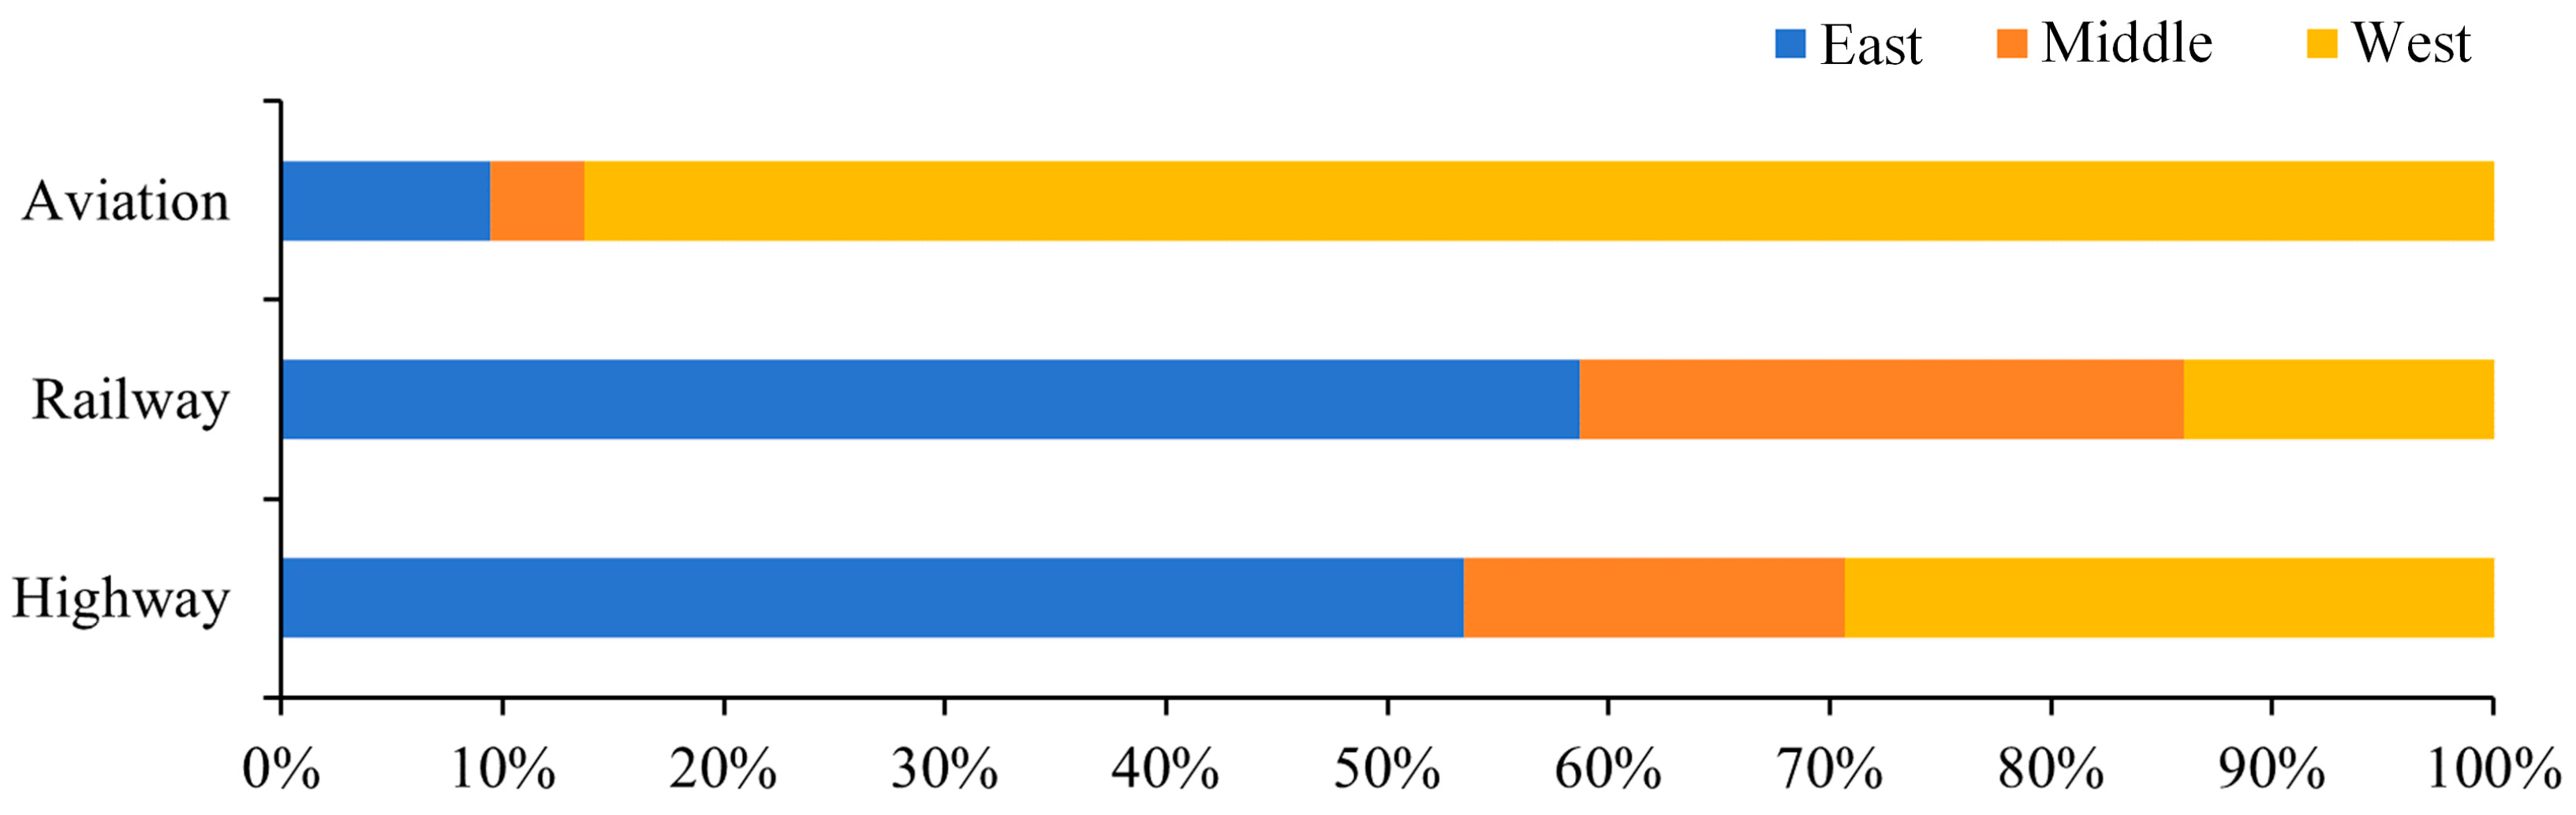
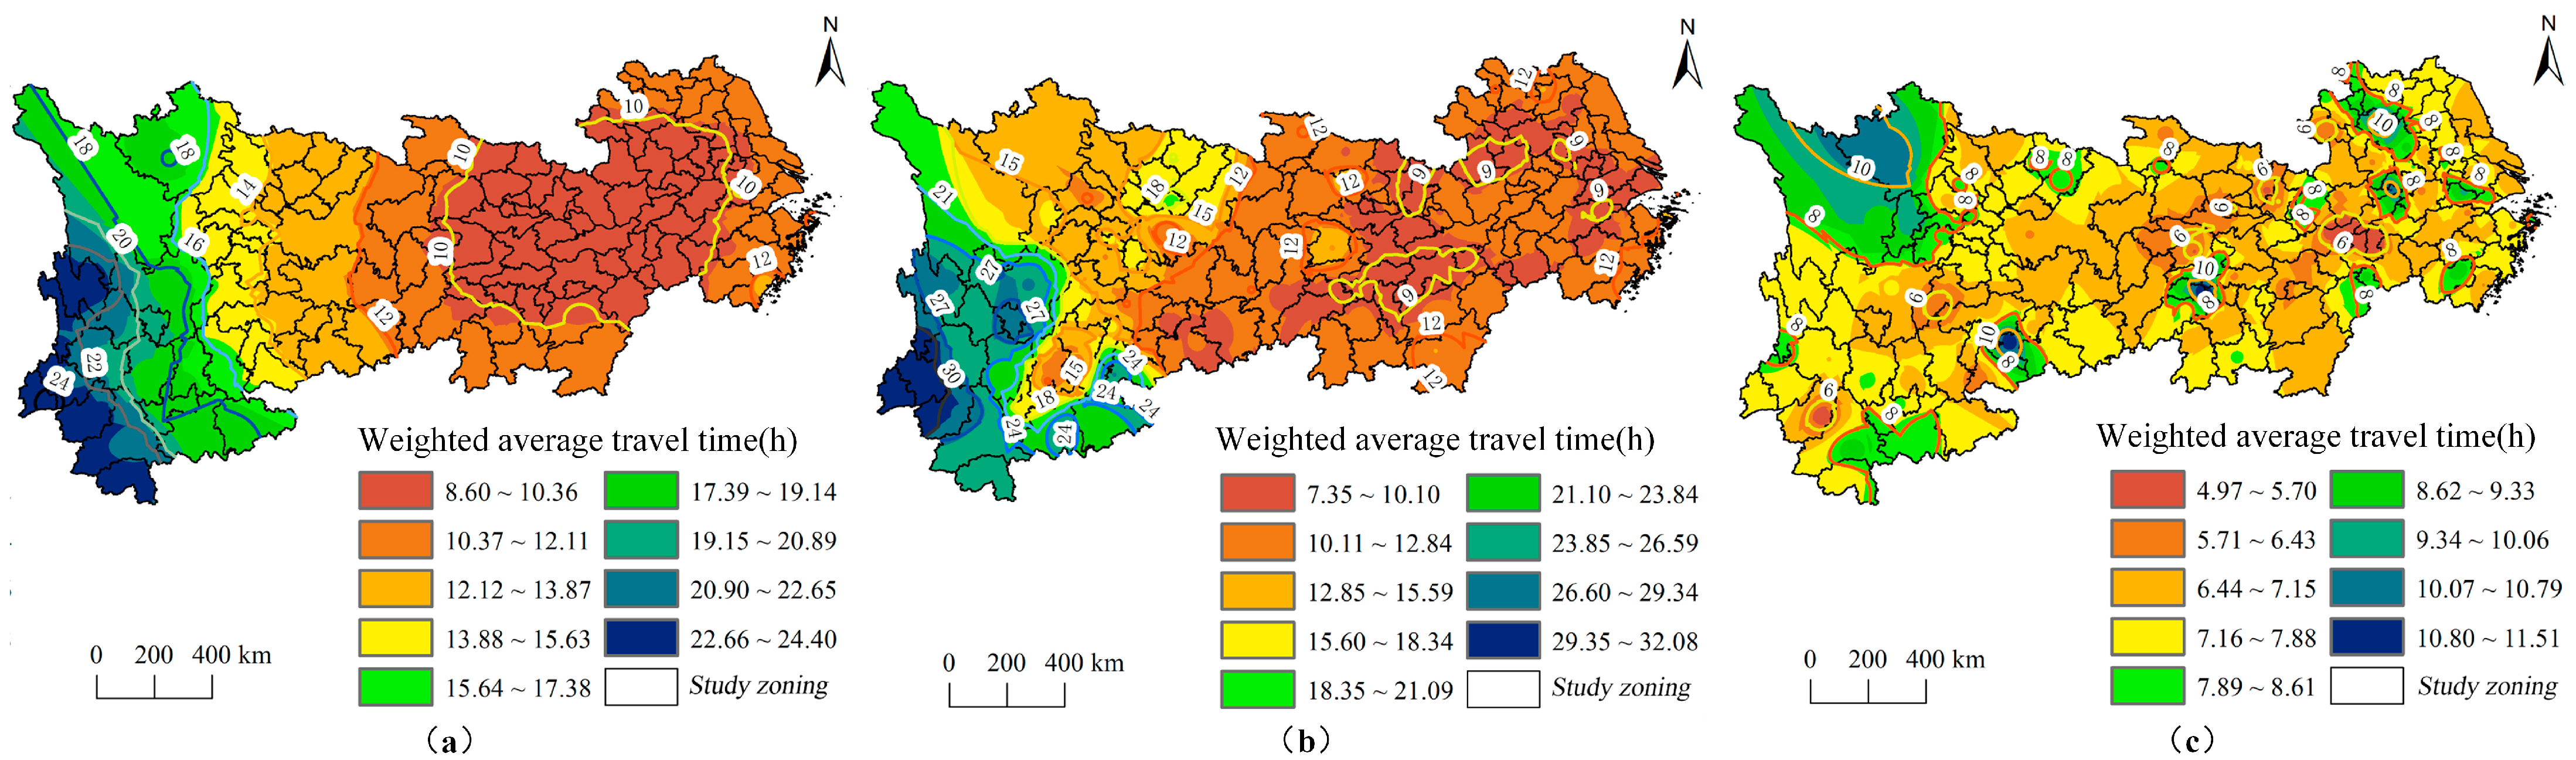
The accessibility pattern based on the highway network presents a “core–edge” spatial pattern in space, and the average weighted travel time is 12.31 h. In general, the high-accessibility core area (8.60~10.08 h) is mainly concentrated in the “Two Lakes” and Hangzhou areas, radiating to the east and west wings. The medium-accessibility area (10.26~14.79 h) is mainly concentrated in the Chengdu–Chongqing metropolitan area. Due to the special topography of the Hengduan Mountains and the Yunnan-Guizhou Plateau in the western part of the Economic Belt, the low-accessibility area (18.05~24.04 h) is mainly concentrated in the Diqing Tibetan Autonomous Prefecture, Nujiang Lisu Autonomous Prefecture, and Xishuangbanna Dai Autonomous Prefecture in western Yunnan.
(2)
The accessibility pattern based on the railway network generally presents a spatial pattern of “strong in the east and weak in the west”, and the average weighted travel time is 13.09 h. With the advent of high-speed rail, the travel time cost between the core cities in the Yangtze River Economic Belt and the surrounding small- and medium-sized cities has been significantly reduced, dividing it into two parts: the eastern and western parts. The eastern region has a clear radiation trend to the Yangtze River Delta region, while the western region is centered on Chongqing and Guiyang and extends along the east and west sides. In general, the core areas of high accessibility (7.35~10.97 h) are mainly concentrated in the central and eastern provincial capitals, such as Wuhan, Changsha, Hefei, and Nanjing. The areas of medium accessibility (11.12~17.40 h) are mainly concentrated in the middle reaches of the Yangtze River and the urban agglomeration of Chengdu and Chongqing. Due to the special topography of the Hengduan Mountains and Yunnan-Guizhou Plateau in the western part of the Economic Belt, the railway network is relatively sparse, and the areas of low accessibility (18.04~32.08 h) are mainly concentrated in Diqing Tibetan Autonomous Prefecture, Nujiang Lisu Autonomous Prefecture, and Baoshan in western Yunnan.
(3)
The accessibility pattern based on the aviation network presents a spatial pattern of “time and space compression in western cities”. Compared with the sparse road and rail network, the average weighted travel time is improved to 7.4 h. In general, the high-accessibility core area (4.97~5.99 h) is mainly concentrated in provincial capitals and ethnic minority autonomous prefectures with tourist attractions. The medium-accessibility area (6.08~8.80 h) is mainly concentrated in the Yunnan-Guizhou region, of which Guizhou is affected by natural factors such as topography and landforms, it is the only province in the country where every city (state) has an airport, forming a provincial airport cluster. The low-accessibility area (9.04~11.51 h) is mainly concentrated in Tongling, Anshun City, Suzhou City, and Bengbu City in Anhui Province in the eastern region, as well as Aba Tibetan, Qiang Autonomous Prefecture, and Garze Tibetan Autonomous Prefecture in western Sichuan.

3.3. Hierarchical Structure and Effects of Network Communities

3.3.1. Hierarchical Structures of Clusters

For multiple traffic flow networks, the real-time traffic cost data obtained by the Baidu Maps API were integrated into the TCD community discovery algorithm and, based on the weighted combination of the shortest path algorithms, the proximity index, Φ, between any two city nodes was calculated. A dendrogram with a hierarchical structure was generated through hierarchical clustering to reveal the community structure of the multiple traffic flow network.
At different proximity index levels, urban node agglomerations are divided into different numbers of communities, and as the proximity between communities continues to increase, smaller communities are gradually merged into larger community structures. After conducting multiple experiments, when K = 2, ω 1 = 0.98, and ω 2 = 0.02, the geographical modularity (Q = 0.728) of the multiple traffic flow network reached a high value. In order to observe the trend of urban node mergers as the proximity index increases, the number of communities and the corresponding proximity index were fitted to a curve (Figure 8). It can be seen that the two conformed to a power law distribution. When the proximity index between communities was less than 10, the curve rapidly declined, and most cities were clustered within this community. However, there was also a small number of cities that did not gather into a community structure with a multiple traffic flow network until the proximity index between communities was greater than 30, such as Baoshan City, Zhaotong City, Panzhihua City, Liangshan, Garze, and Nujiang. It also indicated that the strength of transport connections between these cities and other cities is weak.

3.3.2. Regional Effects of City Networks

The constructed TCD community structure detection model was utilized to acquire 24 communities within the Yangtze River Economic Belt (Figure 9). Of these, six communities exhibited relatively strong internal connectivity. They are called “Urban Economic Zones” and named the Guizhou community, Yunnan community, Anhui community, Sichuan–Chongqing community, Hubei–Hunan–Jiangxi community, and Jiangsu–Zhejiang–Shanghai community, respectively. The term “Urban Economic Zone” indicates that the functional connections between cities rely on the agglomeration and expansion capabilities of the flow of production factors. At the same time, there are also some edge cities that have not been well integrated into the community structure, such as communities 1 to 18 in Figure 9. These mainly include Dazhou and Bazhong in the Chengdu–Chongqing urban agglomeration; Lishui, Wenzhou, and Taizhou in Zhejiang Province; Haozhou and Fuyang in Anhui Province; Shiyan and Suizhou in the northeastern part of Hubei Province; Zhangjiajie and Changde City in Hunan Province; Ji’an and Ganzhou in Jiangxi Province; Liangshan and Panzhihua in Sichuan Province, and Pu’er, Xishuangbanna, and Baoshan in Yunnan Province. The proximity index in these areas was large, limiting the radiation effect of the main center. The improvement of the transportation infrastructure in the sub-network area and the construction of major railway and highway networks are necessary to promote coordinated regional economic development. Additionally, the expansion of the regional connections between core and peripheral cities is recommended.

3.4. Urban Cyberspace Organization Pattern

Further analysis of the geospatial correlation pattern and topological network of internal spatial connections in the six “Urban Economic Zones” revealed that the urban networks within different regional systems present sub-network systems and diversified spatial forms with spatial dependence. The regional spatial organization model based on the perspective of multiple traffic flow connections can be roughly divided into three development patterns: single-core, dual-core, and multi-core.
In a single-core area system, the central city takes the dominant position, and the surrounding medium and small cities exhibit centripetal tendencies, forming a hierarchical “core–edge” spatial organizational pattern with vertical links from bottom to top, also known as the “independent type”. In terms of spatial morphology, the diverse transportation flow network of the Yangtze River Economic Belt is condensed into three single-core community structures, namely, the Guizhou community, Yunnan community, and Anhui community, with a predominant single-core developmental pattern. Within these communities, the node geographic networks and topological networks exhibit significant hierarchical features and spatial distance dependencies, mainly manifesting in ring-shaped and radial spatial configurations (Figure 10). The Guizhou community is composed of the cities within Guizhou Province, except for Tongren City and the Qianxinan Buyi and Miao Autonomous Prefecture (Figure 10a). It is relatively smaller in scale and exhibits a ring-shaped spatial connectivity pattern, radiating outward from Guiyang as the core. Guiyang’s comprehensive traffic flow accounts for approximately 35.9% of the total traffic in this community, with the strongest connections being Guizhou–Zunyi, Guizhou–Anshun, and Guizhou–Qiandongnan Miao and Dong Autonomous Prefecture, playing a key role in connecting the “regional community”. The gap in connections between other surrounding cities is smaller. The Yunnan community forms a regional system with Kunming as the absolute core (Figure 10b), representing 37.8% of the total traffic. The connections between cities in this region are generally weak. The strength of low-level urban connections is limited by the geographical distance and has a distance attenuation effect. The largest connections occur in the directions of Kunming–Dali and Kunming–Yuxi. The internal connections within the Yunnan community are significantly influenced by the tourism industry. The rapid growth of the tourism sector has led to economic advancement, with the core city radiating toward the surrounding cities. This pattern promotes the growth of nodes within the region. The Anhui community comprises 11 cities within Anhui Province (Figure 10c). The entire community has essentially developed a radial spatial connectivity pattern with Hefei as the core city, expanding toward the areas of Wuhu and Bengbu. From a spatial hierarchy perspective, the regional connectivity intensity exceeds 200 times between Bengbu and Xuzhou, as well as between Hefei and Huainan. The connectivity strength between Hefei and Wuhu, as well as between Hefei and Lu’an, exceeds 150 times. Hefei’s connections with other neighboring cities account for 20.6% of the total flow. Due to the close connections with some neighboring cities in Jiangsu, cities in the northeastern part of Anhui Province are “drawn” into the Yangtze River Delta city cluster.
The dual-core structure is a “regional community” dominated by two central cities and closely connected with other surrounding small- and medium-sized cities. It constitutes a multi-level, networked urban system and a spatial connection driving mechanism for “double-wing” regional development. Compared with the single-core structure, the two central cities in the dual-core development pattern form their own systems within their respective hinterlands. At the same time, the two regional systems also overlap, and the elements flowing between higher-level cities frequently interact. Ultimately, a dual-core spatial organization model that takes into account the hierarchical structure and network connections is formed, also known as the “point-axis type”. The Sichuan–Chongqing region presents a dual-core development pattern. Each city node builds a subnet system, and the subnets are closely connected (Figure 11). The Chengdu–Chongqing Economic Circle is the most densely populated and economically developed region in Western China. The Sichuan–Chongqing community mainly consists of Chengdu and Chongqing as its core skeleton, and it is closely connected with surrounding small- and medium-sized cities to form a hierarchical regional spatial network system. From the perspective of the spatial geographical network structure, Chengdu is closely connected with Mianyang, Deyang, Leshan, Meishan, and other cities to form a sub-network system, while Chongqing and neighboring cities, such as Guang’an, Luzhou, and Neijiang, also form a regional sub-network system. Moreover, there are close connections between the two system nodes. For example, cities such as Nanchong, Luzhou, and Zigong overlap with the two core cities. Other cities with strong correlations include Chengdu–Yibin, Mianyang–Guangyuan, Neijiang–Zigong, etc. From the topological network of the comprehensive traffic flow, Chengdu has the strongest connection strength with surrounding small- and medium-sized cities, accounting for 20.9% of the total traffic, followed by Chongqing and Mianyang, accounting for 12.8% and 7.7%, respectively. The link strength is not significantly different from that in other cities.
As the populations and industries in big cities continue to spread to edge cities and gather in new peripheral centers, a new form of poly-center development has been promoted. Therefore, the spatial organization pattern of urban networks has gradually shifted from a single-core or dual-core model to a multi-core pattern, forming a new pattern of “multi-center, group-based” regional economic development, also known as the “overflow type”. The community detection model based on the TCD algorithm has, to some extent, divided the Hubei, Hunan, and Jiangxi communities and the Jiangsu, Zhejiang, and Shanghai communities, revealing a regional spatial organizational pattern with a multi-core structure. The Hubei, Hunan, and Jiangxi communities are centered on Changsha, Wuhan, and Nanchang and expand to surrounding cities to form a multi-center regional sub-network system with the characteristics of a compact space and close flow of elements. The community is mainly based in Hunan Province and absorbs Huangshi City, Huanggang City, Xiaogan City, Ezhou City, and Xiangxi Autonomous Prefecture in Eastern Hubei Province, with Wuhan as the core, as well as Pingxiang City, Fuzhou City, Yichun City, and Jiujiang City, etc., in the northwest of Jiangxi Province, with Nanchang as the core (Figure 12a). From the perspective of the topological network, the four cities with the closest external connections in the community structure are Changsha, Wuhan, Nanchang, and Hengyang, and their total volume reaches 39.8% of the regional total. The traffic of Changsha City alone exceeds 15% of the regional subnet system. In addition, cities with strong connections include Yueyang, Xiangtan, Loudi, Huaihua, Chenzhou, etc. From the perspective of the spatial geographical network, the three core cities of Changsha, Wuhan, and Nanchang are the most closely connected in this community structure, forming the iron triangle skeleton of the regional subnet system. The link frequencies of Changsha–Wuhan, Changsha–Hengyang, Changsha–Xiangtan, and Hengyang–Chenzhou are all more than 200. It can be seen that the comprehensive transportation hubs in the southern part of the Hubei, Hunan, and Jiangxi communities are Hengyang and Chenzhou. At the same time, Wuhan also has relatively close connections with surrounding cities. For example, Wuhan–Yueyang, Wuhan–Hengyang, and Wuhan–Huangshi have more than 150 intercity connections, revealing that Wuhan plays an important leading role as the core city of the Hubei, Hunan, and Jiangxi communities. However, in this region, the rate of decline in the link frequency between urban nodes accelerates as the proximity index between cities increases. Connection frequencies of less than 50 account for over 60% of the total in the region, highlighting that edge cities in the region have limited comprehensive three-dimensional transportation network connectivity, and their development is relatively slow. The Jiangsu–Zhejiang–Shanghai community mainly includes Shanghai, Jiangsu Province, and Zhejiang Province in the eastern region, and absorbs Ma’anshan and Huai’an in Anhui Province, showing significant regional integration and networked multi-center urban agglomeration (Figure 12c). From the topological network perspective, the top four cities in terms of the total regional connections are Shanghai, Nanjing, Hangzhou, and Suzhou, accounting for 35.3%, followed by Changzhou, Wuxi, Jiaxing, etc., and the spatial interaction frequency gap between other cities within the region is small. From the perspective of the spatial geographical network, Shanghai, Nanjing, Hangzhou, and Suzhou present an obvious multi-center development model, forming an urban spatial interaction network with each as its core. As the distance increases, Shanghai and cities such as Hangzhou, Suzhou, Jiaxing, Nantong, and Wuxi form a fan-shaped structure with high-frequency connections in the comprehensive transportation network, which has significant spatial distance dependence and hierarchical characteristics. Hangzhou is a hub city in the Economic Belt, forming a radial radiation pattern with cities in the province, Southern Jiangsu, and Shanghai, and the frequency of intercity interactions with the northern part of the province is significantly stronger than that of southern cities. Nanjing radiates toward the Northern Jiangsu region and forms a sub-network of regional connections with surrounding cities. From the perspective of hierarchical characteristics, a high-density network pattern is formed with Shanghai, Nanjing, Hangzhou, Suzhou, and Changzhou as the core. Among them, the structures with the strongest interactions within the community include Shanghai–Suzhou, Shanghai–Nanjing, and Shanghai–Hangzhou. In the Jiangsu, Zhejiang, and Shanghai communities, the connection intensity of Shanghai–Jiaxing, Hangzhou–Jiaxing, Hangzhou–Zhoushan, and Shanghai–Nantong exceeds 400 times, while the external connections of cities such as Suqian, Taizhou, Ezhou, Fuzhou, and Huangshi do not exceed 40.

4. Conclusions and Implications

Based on the multiple traffic flow data of highways, railways, and aviation for 130 cities in the Yangtze River Economic Belt, this paper used the Theil index and weighted average travel time to analyze the spatial differentiation characteristics and accessibility pattern of the multiple traffic flow network. Furthermore, we utilized the TCD community detection algorithm, combined with time cost data from Baidu Maps, to construct a community detection model of a multiple traffic flow network, and integrated both geographical and topological networks to examine the level of integration in comprehensive transportation among urban clusters from the perspective of multiple traffic flow connections. The main findings are summarized as follows: (1) The diverse traffic flow network of the Yangtze River Economic Belt showed obvious spatial differentiation. Within the regional scope, the spatial differentiation appeared as follows: highway > aviation > railway, while within the provincial scope, the spatial differentiation appeared as follows: aviation > railway > highway. The spatial differentiation of aviation and railway networks was mainly concentrated between regions and within provinces, while the imbalance of highway networks was manifested as an imbalance within regions and between provinces. (2) The accessibility pattern of the highway network in the Yangtze River Economic Belt presented a “core–edge” spatial pattern, with the average weighted travel time being 12.31 h. The accessibility pattern of the railway network generally presented a spatial pattern of “strong in the east and weak in the west”, with an average weighted travel time of 13.09 h. Compared with sparse road and railway networks, the accessibility pattern of the aviation network showed a spatial pattern of “time and space compression in western cities”, with the average weighted travel time increasing to 7.4 h. (3) When integrating the real-time time cost data obtained by the Baidu Maps API into the TCD community discovery algorithm and spatially segmenting the multiple traffic flow network of the economic zone, the number of communities and the proximity indexes of urban nodes conformed to a power law distribution, and a total of 24 communities were identified. This mainly included six “urban economic communities” that are closely connected in space and have clear boundaries, namely, the Guizhou community, Yunnan community, Anhui community, Sichuan–Chongqing community, Hubei–Hunan–Jiangxi community, and Jiangsu–Zhejiang–Shanghai community. The spatial structures mainly include the independent type, point axis type, overflow type, etc. (4) Based on the perspective of multiple traffic flows, the urban network space organization model of the Yangtze River Economic Belt can be roughly divided into three models: the “single-core” model with Guizhou, Kunming, and Hefei as the core, the “dual-core” model, constructed from Chengdu–Chongqing, and the “multi-core” model, constructed from Changsha–Wuhan–Nanchang and Shanghai–Nanjing–Hangzhou. The “single-core” development model was predominant, mainly concentrated in the western region. In terms of spatial form, it mainly exhibited regional association patterns, such as ring-shaped and radiating.
Existing research ignores traffic congestion time within cities when identifying spatial organization patterns, and only focuses on the analysis of a single transportation network, lacking a comprehensive weighted analysis of multiple transportation networks. To address this, this article was based on the TCD community discovery algorithm, introduced the network map API to obtain real-time traffic cost data of multiple travel modes, and comprehensively considered the real-time time cost of residents’ travel and frequency data to construct a community structure detection model of multiple traffic flow networks, aiming to identify the spatial organization patterns of urban networks from a more comprehensive perspective. This paper combined highway, railway, and aviation data to construct the spatial correlation structure of the multi-traffic flow network and condensed the three spatial organization models of single-core, dual-core, and multi-core, which have certain differences from the scope of existing urban agglomerations. From the perspective of urban sustainable development, this study can provide some recommendations for the construction of a comprehensive transportation network in the Yangtze River Economic Belt: (1) Pay attention to the spatial layout, use the geographical spatial distance and actual travel behavior characteristics as infrastructure layout conditions, accelerate the continuous diffusion of populations and industries from core cities to peripheral cities to gather in new peripheral centers, and alleviate the pressure on land and transportation in core cities. Focus on promoting the process of building the western region, with Chongqing and Chengdu as core transportation hubs, and improving the comprehensive accessibility of the western part of the Yangtze River Economic Belt. (2) Properly plan the intercity transportation network within the economic zone and improve the coordinated operation efficiency of the comprehensive transportation system, thereby eliminating the impact of the geographical isolation of low-level urban groups, such as Western Sichuan, Central Guizhou, and Southern Jiangxi, which are mainly located in underdeveloped or peripheral areas.
Constrained by data availability, this paper only examined three modes of transportation: highway, railway, and aviation. In the future, it will be necessary to incorporate more transportation modes, such as shipping and freight, while integrating data on passenger flow, population, GDP, and others for a systematic evaluation of comprehensive transportation infrastructure services. Additionally, supplementing with more diverse virtual data, such as industry flow and information flow, will enable a more comprehensive and accurate assessment of the actual relationships between cities.

Author Contributions

Conceptualization, J.L., S.X. and J.B.; methodology, J.L., S.X. and J.B.; software, S.X. and J.B.; validation, J.L. and S.X.; resources, J.B.; data curation, S.X. and J.B.; writing—original draft preparation, J.L. and S.X.; writing—review and editing, J.L. and S.X.; visualization, J.B.; supervision, J.L.; project administration, J.L. All authors have read and agreed to the published version of the manuscript.

Funding

This research was supported by the Natural Science Foundation of China (Grant number 42301523).

Institutional Review Board Statement

Not applicable.

Informed Consent Statement

Not applicable.

Data Availability Statement

The data presented in this study are available on request from the corresponding author.

Acknowledgments

We acknowledge any support not covered by the authors’ contributions or funding sections, including administrative and technical support that is not covered and data materials for experiments.

Conflicts of Interest

The authors declare no conflicts of interest.

References

  1. Council, S. Notice of the State Council on Issuing the Development Plan for the Modern Comprehensive Transportation System during the “14th Five-Year Plan”. In China’s Foreign Economic and Trade Announcement. 2022. Available online: https://www.gov.cn/zhengce/zhengceku/2022-01/18/content_5669049.htm (accessed on 18 December 2023).
  2. Wang, J.; Du, D.; Jin, F. Comparison of spatial structure and linkage systems and geographic constraints: A perspective of multiple traffic flows. Acta Geogr. Sin. 2019, 74, 2482–2494. [Google Scholar]
  3. Liu, J.; Meng, B.; Shi, C. A multi-activity view of intra-urban travel networks: A case study of Beijing. Cities 2023, 143, 104634. [Google Scholar] [CrossRef]
  4. Ma, S.; Long, Y. Functional urban area delineations of cities on the Chinese mainland using massive Didi ride-hailing records. Cities 2020, 97, 102532. [Google Scholar] [CrossRef]
  5. Wang, J.; Xiong, M.; Huang, J. Subway accessibility under space-time constraints: A case study of Beijing. Sci. Geogr. Sin. 2022, 42, 83–94. [Google Scholar]
  6. Liu, X.; Liu, L.; Zou, J. Spatial and temporal analysis of urban commuting based on smart bus card data. Comput. Appl. Softw. 2021, 38, 69–74+105. [Google Scholar]
  7. Li, Y.; Wu, Q.; Zhang, Y.; Zhang, H.; Fang, S.; Jin, S. Spatial structure and formation mechanism of expressway traffic flow network based on space of flows: A case study of Guangdong province. Geogr. Res. 2021, 40, 2204–2219. [Google Scholar]
  8. Gan, D.; Guo, X.; Pan, D. Spatial coupling analysis on the county transportation accessibility and tourism economic connection in Chongqing-Hubei border areas. Geogr. Geo-Inf. Sci. 2022, 38, 137–144. [Google Scholar]
  9. Chen, W.; Liu, W.; Duan, X. Spatial organization evolution of railway passenger transportation in the perspective of “space of flow”: A case study of the Yangtze River Delta urban agglomeration. Geogr. Res. 2020, 39, 2330–2344. [Google Scholar]
  10. Fan, J.; Li, Y.; Zhang, Y.; Luo, X.; Ma, C. Connectivity and Accessibility of the Railway Network in China: Guidance for Spatial Balanced Development. Sustainability 2019, 11, 7099. [Google Scholar] [CrossRef]
  11. Liu, W.; Guo, J.; Wu, W.; Cao, Y. The evolution of regional spatial structure influenced by passenger rail service: A case study of the Yangtze River Delta. Growth Change 2022, 53, 651–679. [Google Scholar] [CrossRef]
  12. He, D.; Chen, Z.; Pei, T.; Zhou, J. The Regional and Local Scale Evolution of the Spatial Structure of High-Speed Railway Networks—A Case Study Focused on Beijing-Tianjin-Hebei Urban Agglomeration. ISPRS Int. J. Geo-Inf. 2021, 10, 543. [Google Scholar] [CrossRef]
  13. Li, E.; Lu, Y.; Yang, X.; Chen, Y. Spatio-temporal evolution on connection strength of global city network based on passenger flight data from 2014 to 2018. Sci. Geogr. Sin. 2020, 40, 32–39. [Google Scholar]
  14. Zhang, F.; Ning, Y.; Lou, X. The evolutionary mechanism of China’s urban network from 1997 to 2015: An analysis of air passenger flows. Cities 2021, 109, 103005. [Google Scholar] [CrossRef]
  15. Dong, Y.; Lu, Z.; Zhang, Y.; Feng, F.; Yan, Y. Deconstruction of air traffic flow network and dynamic allocation of airspace resources: A case study of Beijing-Chengdu corridor-in-the-Sky. Geogr. Geo-Inf. Sci. 2022, 38, 116–123+132. [Google Scholar]
  16. Yang, H.; Dobruszkes, F.; Wang, J.; Dijst, M.; Witte, P. Comparing China’s urban systems in high-speed railway and airline networks. J. Transp. Geogr. 2018, 68, 233–244. [Google Scholar] [CrossRef]
  17. Chen, Z.; Liang, Y.; Jin, F. Simulation of city network accessibility and its influence on regional development pattern in China based on integrated land transport system. Prog. Geogr. 2021, 40, 183–193. [Google Scholar] [CrossRef]
  18. Ke, W.; Xiao, B.; Xu, K.; Zeng, C. Fujian city networks spatial organization patterns based on railway passenger flow. J. Fujian Norm. Univ. (Nat. Sci. Ed.) 2021, 37, 87–98. [Google Scholar]
  19. Ke, w.; Chen, W.; Yang, Q. Uncovering spatial organization patterns of regional city networks from expressway traffic flow data: A case study of Jiangsu province, China. Geogr. Res. 2018, 37, 1832–1847. [Google Scholar]
  20. Girvan, M.; Newman, M.E.J. Community structure in social and biological networks. Proc. Natl. Acad. Sci. USA 2002, 99, 7821–7826. [Google Scholar] [CrossRef] [PubMed]
  21. Pons, P.; Latapy, M. Computing Communities in Large Networks Using Random Walks. Int. Symp. Comput. Inf. Sci. 2005, 3733, 284–293. [Google Scholar]
  22. Raghavan, U.N.; Albert, R.; Kumara, S. Near linear time algorithm to detect community structures in large-scale networks. Phys. Rev. E Stat. Nonlin. Soft Matter Phys. 2007, 76, 036106. [Google Scholar] [CrossRef] [PubMed]
  23. Rosvall, M.; Bergstrom, C.T. Maps of random walks on complex networks reveal community structure. Proc. Natl. Acad. Sci. USA 2008, 105, 1118–1123. [Google Scholar] [CrossRef]
  24. Yue, H.; Guan, Q.; Pan, Y.; Chen, L.; Lv, J.; Yao, Y. Detecting clusters over intercity transportation networks using K-shortest paths and hierarchical clustering: A case study of mainland China. Int. J. Geogr. Inf. Sci. 2019, 33, 1082–1105. [Google Scholar] [CrossRef]
  25. Chen, Y.; Xu, J.; Xu, M. Finding community structure in spatially constrained complex networks. Int. J. Geogr. Inf. Sci. 2015, 29, 889–911. [Google Scholar] [CrossRef]
  26. Zhou, H.J.; Lipowsky, R. Network Brownian Motion: A New Method to Measure Vertex-Vertex Proximity and to Identify Communities and Subcommunities. Int. Conf. Comput. Sci. 2004, 3038, 1062–1069. [Google Scholar]
  27. Fan, Y.; Zhan, Q.; Zhang, H.; Wu, J. A Comprehensive Regional Accessibility Model Based on Actual Routes-of-Travel: A Proposal with Multiple Online Data. Comput. Urban Plan. Manag. Smart Cities 2019, 16, 463–482. [Google Scholar]
  28. Wan, Y.; Liu, Y. Community detection algorithm based on geographical weighted central node distance. Geomat. Inf. Sci. Wuhan Univ. 2019, 44, 1545–1552. [Google Scholar]
  29. Wan, Y.; Liu, Y. DASSCAN: A Density and Adjacency Expansion-Based Spatial Structural Community Detection Algorithm for Networks. ISPRS Int. J. Geo-Inf. 2018, 7, 159. [Google Scholar] [CrossRef]
  30. Zhao, Y.; Yu, H. A door-to-door travel time approach for evaluating modal competition of intercity travel: A focus on the proposed Dallas-Houston HSR route. J. Transp. Geogr. 2018, 72, 13–22. [Google Scholar] [CrossRef]
  31. Gao, P.; Ning, Y.; He, D. Spatial Evolution and Interaction Effects of Multi-scalar UrbanNetworks in the Yangtze River Delta. Sci. Geogr. Sin. 2022, 42, 1767–1777. [Google Scholar]
  32. Sheng, Y.; Gou, Q.; Song, J. Innovation Linkage Network Structure and Innovation Efficiency in Urban Agglomeration: A Case of the Beijing-Tianjin-Hebei, the Yangtze River Delta and the Pearl River Delta. Sci. Geogr. Sin. 2020, 40, 1831–1839. [Google Scholar]
  33. Wu, S.; Zhonh, Y.; WU, Q.; MAO, W. Multi-outward connection networks of urban agglomeration: An empirical study from middle reaches of Yangtze River to Yangtze River Economic Belt. Resour. Environ. Yangtze Basin 2021, 30, 2360–2372. [Google Scholar]
  34. Zheng, W.; Xiong, Y.; Wang, X. Evolutionary Characteristics of Railway Flow Network Urban Agglomerations in the Middle Reaches of Yangtze River: Based on Game Overlapping Community Model. Econ. Geogr. 2022, 42, 9–18. [Google Scholar]
  35. Zhou, J.; Ling, C. Study on Temporal Variations of Network Connectivity and Degree Centrality in the Middle of the Yangtze River (2001–2016). Resour. Environ. Yangtze Basin 2021, 30, 544–553. [Google Scholar]
  36. Xiao, H.; Wang, Q.; Zhang, J. Analysis of the characteristics and influencing factors of the Inter-locked network of Chengdu-Chongqing urban agglomeration: A perspective of highway passenger transport. Shanghai Urban Plan. Rev. 2021, 2, 128–135. [Google Scholar] [CrossRef]
  37. Zong, H.; Huang, Y.; Hu, Y. Characteristics of Urban Networks of Chengdu-Chongqing Urban Agglomeration Based on the Passengers Flow. Areal Res. Dev. 2018, 37, 60–65+82. [Google Scholar]
  38. Tu, J.; Mao, K.; Kuang, R.; Li, N. A comparative analysis of the intercity passenger transport network structure of three urban agglomerations in the Yangtze River Economic Belt. World Reg. Stud. 2021, 30, 69–79. [Google Scholar]
  39. Wang, Q.; Cheng, Y. Characteristics and Performance of City Network from the Perspective of High- way Freight—The Case of Three Major Urban Agglomerations in China. Urban Plan. Forum 2020, 32–39. [Google Scholar] [CrossRef]
  40. Jin, X.; Hu, G.; Ding, H.; Ye, S.; Lu, Y.; Lin, J. Evolution of spatial structure patterns of city networks in the Yangtze River Economic Belt from the perspective of corporate pledge linkage. Growth Change 2020, 51, 833–851. [Google Scholar] [CrossRef]
  41. Zhao, D.; Zhang, J. Research into spatial pattern changes of Yangtze River Delta’s accessibility under the impact of high-speed railway. Resour. Environ. Yangtze Basin 2012, 21, 391–398. [Google Scholar]
  42. Liu, Y.; Wang, F.; Kang, C.; Gao, Y.; Lu, Y. Analyzing relatedness by toponym co-occurrences on web pages. Trans. GIS 2014, 18, 89–107. [Google Scholar] [CrossRef]
  43. Yen, J.Y. Finding the K Shortest Loopless Paths in a Network. Manag. Sci. 1971, 17, 712–716. [Google Scholar] [CrossRef]
Figure 1. Location of the Yangtze River Economic Belt.
Sustainability 16 01300 g001
Figure 2. Intercity accessibility “door-to-door” calculation model.
Sustainability 16 01300 g002
Figure 3. Community structure detection framework based on the TCD algorithm.
Sustainability 16 01300 g003
Figure 4. Theil index result chart of the multiple traffic flow network.
Sustainability 16 01300 g004
Figure 5. The result chart of Theil index difference within a province in the multiple traffic flow network.
Sustainability 16 01300 g005
Figure 6. Difference result map within the multiple traffic flow network area.
Sustainability 16 01300 g006
Figure 7. Accessibility pattern of the comprehensive transportation network: (a) highway network, (b) rail network, and (c) aviation network.
Sustainability 16 01300 g007
Figure 8. Fitted curve of the proximity index and the corresponding number of communities.
Sustainability 16 01300 g008
Figure 9. Community structure division based on the multiple traffic flow network.
Sustainability 16 01300 g009
Figure 10. Spatial organization of regional urban networks with a single-core structure. (a) Guizhou community geographic network, (b) Yunnan community geographic network, (c) Anhui community geographic network, (d) Guizhou community topology network, (e) Yunnan community topology network, and (f) Anhui community topology network.
Sustainability 16 01300 g010
Figure 11. Spatial organization pattern of regional urban networks with a dual-core structure. (a) Sichuan–Chongqing community geographic network and (b) Sichuan–Chongqing community topology network.
Sustainability 16 01300 g011
Figure 12. Spatial organization pattern of regional urban networks with a multi-core structure. (a) Hubei–Hunan–Jiangxi community geographic network, (b) Hubei–Hunan–Jiangxi community topology network, (c) Jiangsu–Zhejiang–Shanghai community geographic network, and (d) Jiangsu–Zhejiang–Shanghai community topology network.
Sustainability 16 01300 g012
Table 1. Basic statistical characteristics of three transportation networks.
NodesTotal LinksIntra-Provincial LinksInter-Provincial LinksIntra-Regional LinksInter-Regional Links
Highway1283022123117912136886
Railway12159491097485228383111
Aviation7094666880236710
Disclaimer/Publisher’s Note: The statements, opinions and data contained in all publications are solely those of the individual author(s) and contributor(s) and not of MDPI and/or the editor(s). MDPI and/or the editor(s) disclaim responsibility for any injury to people or property resulting from any ideas, methods, instructions or products referred to in the content.

