Abstract
The aim of this paper is to apply the concept of marginal vertical income convergence to analyze the influence of the two last economic downturns (2007 and 2020) on the sustainability of the equalization of income levels within the European Union. The methodology used enables us to avoid some restrictions of the classical analysis of income convergence. Income convergence models were estimated using data from the period 1993–2022, excluding the impact of outliers. The results confirm that we can observe the progressive process of the absolute income convergence for EU members, but there are significant differences between countries’ contributions to the process. These differences are caused by different paths of economic growth, and different mean resilience to economic crises, as well as different patterns of income inequalities. Their proper recognition allows us to develop efficient policies aimed at social cohesion, reducing income inequalities (the 10th Sustainable Development Goal), and sustainable economic development. Additionally, the estimated models indicated a definite different impact of the last two economic shocks on the European process of income convergence. The first shock significantly slowed down the income convergence process, while the second one was practically neutral in this context.
1. Introduction
The global economic crises observed over the past decade have various causes and are characterized by specific effects in addition to a fall in gross domestic products. The first of these, which originated in the United States, was triggered by a failure to comply with basic credit risk assessment principles, and its effects in the form of a huge increase in debt are still being felt today. The second was caused by the SARS-CoV-2 virus in 2020. In addition to the economic recession induced on a larger scale than the previous one, it caused a break in supply chains and a huge disruption in the labor market in the form of a shortage of workers. The last one, which we are currently observing due to the hostilities in Ukraine, in addition to exacerbating the negative effects already observed, will have significant effects on the food economy and in the short term is responsible for a dynamic increase in inflation.
The economies of the European Union are currently facing another challenge, which will be a decline in investment and a consequent long-lasting economic slowdown. A return to the previous sustainable growth path will also be hampered by a huge decline in the confidence of societies in their leaders and a massive undermining of principles that until recently seemed self-evident. One example is the anti-vaccine movement, which is causing huge costs of a social and financial nature. All these developments are changing the sustainable trajectory of income convergence in the European Union, which has always been a core issue in the EU [1] and holds high relevance economically, socially, and politically, as upwards convergence is a key policy objective [2].
The subject of income equalization has been present in the broader economic literature since the Solow and Swan works on economic growth were published in 1956, followed by the Romer and Lucas studies in the 1980s. There was a significant increase in publications on this issue in the late 1990s, and strong attention is still given to the construction and implementation of economic policy, e.g., the study of real convergence is relevant for answering the question of whether the country should adopt a common currency [3], especially when monetary union members do not have recourse to fiscal transfer mechanisms or currency adjustments [4].
European countries have taken major steps toward economic integration in recent decades, including the liberalization of capital and labor markets, harmonization of tax policy, and the foundation of the European economic and monetary union [5]. A higher level of economic integration and a similarity of economic cycles should foster a process of income convergence [6,7]. Better institutional quality and growth in total factor productivity can also lead to avoiding falling into the nonconvergence trap [8]. The equalization of income levels between Member States can be crucial in shaping social cohesion and reducing excessive migration within the European Union.
Although an assessment of income convergence represents a key relevance for policy makers, there is still a lack of sufficient studies examining whether and how real convergence is affected by economic crises [9]. Even less attention has been paid to analyzing the impact of macroeconomic shocks on the contribution of particular countries to the general income convergence process. In this context, an important research question is whether changes in the convergence process that are homogeneous in direction and speed are observed during periods of economic recession, the characteristics of which are so different from each other.
This study contributes to the literature in several ways. First, its goal is to present the new idea of marginal vertical real convergence. The term “vertical” refers to the consideration of convergence in spatial terms (countries, regions), as opposed to horizontal analyses of this phenomenon, which make it possible to determine the impact of time on its direction and strength. This new proposition allows us to determine an individual (marginal) contribution of European Union countries to the overall European process of real convergence during the last three decades, especially during the last two economic downturns. Second, this research is also aimed at an identification of the impact of outliers on income convergence modeling. This paper is a follow-up study to the earlier analyses on the same subject [10], but it significantly extends the discussion and brings new results based on updated statistical data covering the period 1993–2022. Third, such a long research period makes it possible to compare the impact of heterogeneity of economic growth within the EU during the last two economic crises on the observed sustainable income convergence process. Fourth, the analysis of income convergence carried out makes it possible to assess the current level of income inequality that characterizes EU Member States and to estimate the horizon over which this inequality may disappear, if certain conditions are met.
According to many theories of economic development, reducing the degree of income inequality between countries and regions is one of the necessary conditions for sustainable economic growth. However, the nature of the relationship between economic growth and income inequality depends on the assumptions of the growth theories being formulated. It is a relatively common view that in countries with a low level of GDP per capita, income inequality has a negative impact on growth by reducing the level of consumption, while in countries with a high level of development, income inequality may be neutral with respect to economic growth. At the same time, it is noted that growth dynamics do not depend directly on the unequal distribution of income, but primarily on the share of people with incomes below a certain level [10].
This article is structured in the following way: the presentation of up-to-date research on income convergence, especially in the context of the observed economic downturns and pandemic, the description of the standard approach to the analysis of β-convergence, followed by an idea of marginal vertical convergence, the empirical results, and conclusions.
2. Materials and Methods
2.1. Income Convergence: Current Tendencies
2.1.1. Real Convergence during the Great Recession (2007–2009)
Morales-Zumaquero and Sosvilla-Rivero [9] investigated real convergence, considering the influence of financial crises (i.e., banking, currency, and debt crises) in 1970–2011 for 163 countries. They found evidence in favor of σ-convergence only for high-income countries, absolute and conditional β-convergence present in each of the four income groups of countries under study, and proved that financial crises have a negative and significant impact on GDP growth and consequently on income convergence independently of the level of income of countries.
A majority of research showed the existence of income convergence within the EU [11] and indicated the most important determinants of this process. Forgó and Jevčák [12] did not find a significant heterogeneity in the speed of income convergence in selected CEE countries in 2004–2014 having fixed or floating exchange rate regimes. However, they indicated that the real convergence path was smoother for the latter. Grela et al. [13] and Siljak [14] found that, during the last two decades, the CEE countries have been converging towards the income level characterizing the old State Members, while relatively rapid convergence in 2001–2008 was disturbed by the Great Recession of 2009 due to the decrease of investment in the post-crisis period [12]. Some authors underlined other causes in the form of diverse demographic trends, including migration, and different evolution of real exchange rates and price levels [15], as well as no sustainability of real convergence within the EU even before the Great Recession due to institutional frames that did not assist innovation and productivity growth [1,16].
The analysis of absolute economic convergence provided by Šikić [17] among the group of 10 new members that entered the European Union in 2004 was conducted using a test for panel unit root in GDP per capita series and standard cross-section equations for different time intervals, 1997–2007 and 2007–2012, which allowed us to capture the impact of the global economic crisis of 2007–2009 on long-term convergence performance. The observed results showed that these countries formed a homogenous convergence club during the entire observed period and achieved high convergence rates in the period before the crisis (β-convergence rate equal to 7.7% in 1997–2007 in comparison to 6.1% in 1997–2012), while the level of homogeneity in this group was significantly diminished after the beginning of the crisis. A similar pattern of income convergence—rapid convergence up to 2007, divergence from 2007, and ongoing convergence during the post-crisis period—was observed for Eastern European countries [18].
Dapena et al. [1] proposed a multilevel and spatial effects modification of the Solow–Swan growth model for the EU, which allowed us to find separate intercepts and slopes for each country. They found significant differences between speeds of convergence (slopes) and economic potentials (intercepts) for individual countries and for the full sample. They also indicated that the overall income convergence observed in the EU in 2000–2014 coexisted with divergence in the cases of France, Ireland, and Slovenia, and significant convergence in the cases of Spain, Greece, and Portugal. Their results also validated that the economic crisis enhanced the fragility of EU convergence. Dvoroková [19], using data for 2001–2012, found evidence that there exists income convergence within EU members (β estimate was equal to −0.027). She also demonstrated a heterogeneous pattern of this phenomenon in terms of GDP per capita changes in comparison to the EU28 average, indicating that some economies are even diverging, such as Austria, Germany, Luxembourg, Sweden, Greece, and Spain—the latter two due to their serious economic downturns.
The negative impact of financial and economic crisis initiated in the United States, which was even called “convergence crisis”, was observed by Halmai and Vásáry [6]. They suggested that divergence might occur in the cases of Greece, Spain, Cyprus, and Portugal, little or no convergence in Hungary, Romania, and Slovenia, and moderate convergence in Bulgaria, Czechia, Estonia, Latvia, Lithuania, Malta, and Slovakia, while somewhat more favorable but limited convergence in the long-run in Poland. Matkowski et al. [15] investigated 11 countries in Central and Eastern Europe (EU11) and 15 countries in Western Europe (EU15) in 1993–2015 and confirmed the results of other authors, that the subprime economic crisis and its consequence in the form of debt crisis have distorted the previous patterns of economic growth in the EU, slowing down the convergence process and leading to some divergence tendencies. The most significant progress in income convergence towards the EU15 in the 2007–2015 subperiod was reached by Poland, Lithuania, Romania, and Slovakia, while Slovenia and Croatia, due to deeper recession, widened the income gap.
This crisis also caused disturbances in regional convergence processes [1,20,21]. The study of income convergence at the regional level during the crisis made by Merler [22] underlined the important role played by funds that are provided to the more disadvantaged regions. Although a slower pace of real convergence was observed during the crisis for the EU as a whole (β-convergence speed diminished from 2.75% in 2000–2007 to 1.77% in 2007–2014), for regions in the old EU members, and especially in the euro area, this process was stopped or even switched to a divergence path.
2.1.2. Real Convergence during the SARS-CoV-2 Time
Halmai [23] argued that the development of income divergences caused by the COVID-19 crisis could disrupt the functioning of the European market due to a decrease in investments and labor market hysteresis and long-lasting negative effects on potential growth and productivity. He pointed out that, unlike the financial crisis, the COVID-19 crisis immediately caused a shock in the real sector: a fall in production and income, and the variation in its strength depended on, among other things, pre-existing economic conditions. According to Bodnar et al. [24], several reasons may have persistent effects on potential output during the COVID-19 pandemic. The most important of these are a collapse of the supply chain, a long time to replace companies that failed with new entrants, a deterioration of workers’ skills, and high corporate debt. They also indicated that the full extent of permanent output and labor market losses due to the pandemic crisis are difficult to predict. The complex and varied economic effects of COVID-19, also generated by causes of a political nature, were also pointed out by other authors [25,26,27].
Since the COVID-19 pandemic struck, the depth of the downturn and the speed of recovery have been very different across members of the euro area because of a number of factors, such as the length and stringency of lockdown measures dictated by health conditions, differences in the underlying economic structures and the specialization in activities restricted by the pandemic, the trade openness of the country, and the extent and type of policy responses and anti-epidemic strategies [2,28,29,30,31]. Fedajev et al. [32], applying hierarchical agglomerative clustering, derived five clusters according to their converging behavior and found that differences in GDP growth rates among EU economies were slightly smaller in 2020 than in 2008. Their results were consistent with those obtained by Bisciari et al. [33] and Alcidi et al. [34], suggesting that the divergence process in the CEE economies was characterized by greater resilience to the COVID-19 crisis than for the old Member States.
Changes in the convergence process are also influenced by the level of socioeconomic development. Verianto et al. [35] found a decrease in income inequality in East Java regions during the pandemic because rich regions were affected more than poor regions. Similar results were obtained by Choudhary et al. [36] for 147 Pakistani districts through real-time data and machine learning between 2012 and 2021. Urban districts with high prepandemic income experienced stronger negative growth during the pandemic. Similar results at the national level were obtained by Ghecham [37]. He provided evidence that countries with lower income inequality were more sensitive to the COVID-19 pandemic.
2.2. Methods
2.2.1. The Concept of Absolute Income β-Convergence
Four basic approaches can be distinguished under the classical methods of income convergence analysis. They are based on cross-sectional data, panel data, time series data, and distributional data [38]. In samples consisting of a homogenous group of objects, cross-sectional data are most commonly used, allowing the construction of a classic model describing the presence or absence of absolute β-convergence derived from the Solow–Swan growth model [39,40].
The basic Solow–Swan model assumes the absence of foreign trade and government spending and the same levels of saving and investment. It is also assumed that the saving rate, which is an exogenous variable in the model, is equal to the investment rate and is at a constant level. An additional constraint is that the labor force is equal to the population and that, at constant levels of labor and technology, the change in the stock of physical capital depends on investment and the rate of capital depreciation. This leads to a decline in the growth rate of product per capita as it approaches the equilibrium point. As a result, countries with low initial values of product per capita are characterized by higher growth rates of this variable, leading to the convergence of the levels of development of poor and rich countries. This type of convergence is referred to as absolute convergence because it assumes that, given constant rates of saving, depreciation of physical capital, and population growth, and an identical form of the production function, there is a single equilibrium point (steady state) common to all countries that depends only on their initial levels of product per capita [41].
The process of absolute convergence is then described by Equation (1).
where:
—annual growth rate of real GDP per capita in country i;
—constant;
—convergence speed;
research period;
—initial level of real GDP per capita in country i;
—random error.
To estimate the model given by Equation (1), it is rearranged into Equation (2).
where:
.
Currently, information on the existence of income convergence in a given sample of countries from the point of view of conducting economic policy is not sufficient. The classical approach can only measure a general speed of income convergence, while there exist significant differences among growth trajectories of particular countries [14,42]. When the speed of convergence is determined by the club convergence pattern, then a classical measurement of convergence is not able to identify this kind of heterogeneity [43,44]. If the sample includes countries with convergence and divergence, then Equation (2) could lead to unreliable conclusions [45].
It is necessary to identify the groups of countries with similar characteristics and define proper measures to overcome emerging crises, speed up recovery, and come to a satisfactory convergence level within the EU [32]. Significant dissimilarities between the growth patterns for individual countries, confirmed by Monfort et al. [46], Borsi and Metiu [5], and Gros [47], can distort the previous patterns of economic growth in the EU and create convergence clubs [14]. Baldwin [48] showed the countries that have gained from globalization in 1990–2010—Australia, Brazil, China, India, Indonesia, Korea, Mexico, Nigeria, Poland, Thailand, Turkey, and Venezuela—and indicated that the main determinants of their success were an increase in competitiveness, exports, and industrial agglomeration involving innovations. The cross-country differences in individual contributions to the overall convergence process in the EU were evidenced by Güreşçi and Utkulu [49], by means of a specific unconditional convergence approach that allows us to point out country-specific behavior. The calculated half-times were from 21 to 60 years. A different tool uses quartile regression or an analysis of distributions of variables describing the economic development [50] or stochastic convergence approach with a reference object. The latter method was applied to test real convergence among OECD countries by Nahar and Inder [51].
2.2.2. The Proposition of Marginal Vertical Absolute Income β-Convergence
To overcome the weaknesses of the classical approach to -convergence analysis, an idea of marginal vertical income convergence was developed. Its essence lies in the estimation of Equation (2) for the whole set of examined countries and additional models without specific countries. The correction for country i consists of eliminating this country from the dataset used in the estimation procedure. Such an approach is used, inter alia, by financial institutions to calculate the level of marginal credit risk [52]. The value of marginal vertical -convergence can be calculated according to Equations (3) and (4) [10].
where:
marginal vertical convergence for country i;
—convergence speed for the whole sample;
—convergence speed for objects (without country i);
and the value of parameter (and ) is calculated using Equation (4).
where:
research period.
A positive value of indicates that country i positively contributes to the total real convergence. A similar formula can be used to derive the half-time convergence—Equation (5).
where:
and .
The negative value of shows to what extent the presence of country i in the sample diminish the half-time of income convergence.
2.2.3. Outlier Identification
Atypical observations called outliers may be the result of erroneous measurement, misidentification of the population under study, heterogeneity of the statistical sample, the presence of extreme or random events, incorrect assumptions about the distributions of the data generated, and purposive activities [53]. They often change the shape of the relationships between the variables under study as a result of model specification errors. At the same time, they can provide information about the disruption of the specific process under investigation, allowing, for example, the detection of fraud, the support of clinical treatment, or the prediction of weather anomalies [54,55,56,57].
The methods used to identify abnormal observations depend on the nature of those observations. Extensive descriptions of the classification of these methods can be found in the following works: Belsley et al. [58], Williams et al. [59], Ben-Gal [60], and Ampanthong [61].
The current study used an outlier identification method based on Cook’s distance, which allows the impact of a given observation on all structural parameter values to be assessed simultaneously—Equation (6).
where:
;
k—number of independent variables;
s—standard error of estimation;
n—number of observations.
If the inequality is satisfied for observation i, it is considered an outlier.
3. Results
The source of the data was The Conference Board Total Economy Database (TED), published in April 2023. The database contains real values of GDP per capita in 2022 international dollars converted using Purchasing Power Parities for EU27 Member States, excluding Great Britain. In all calculations, the STATISTICA 13 package was used.
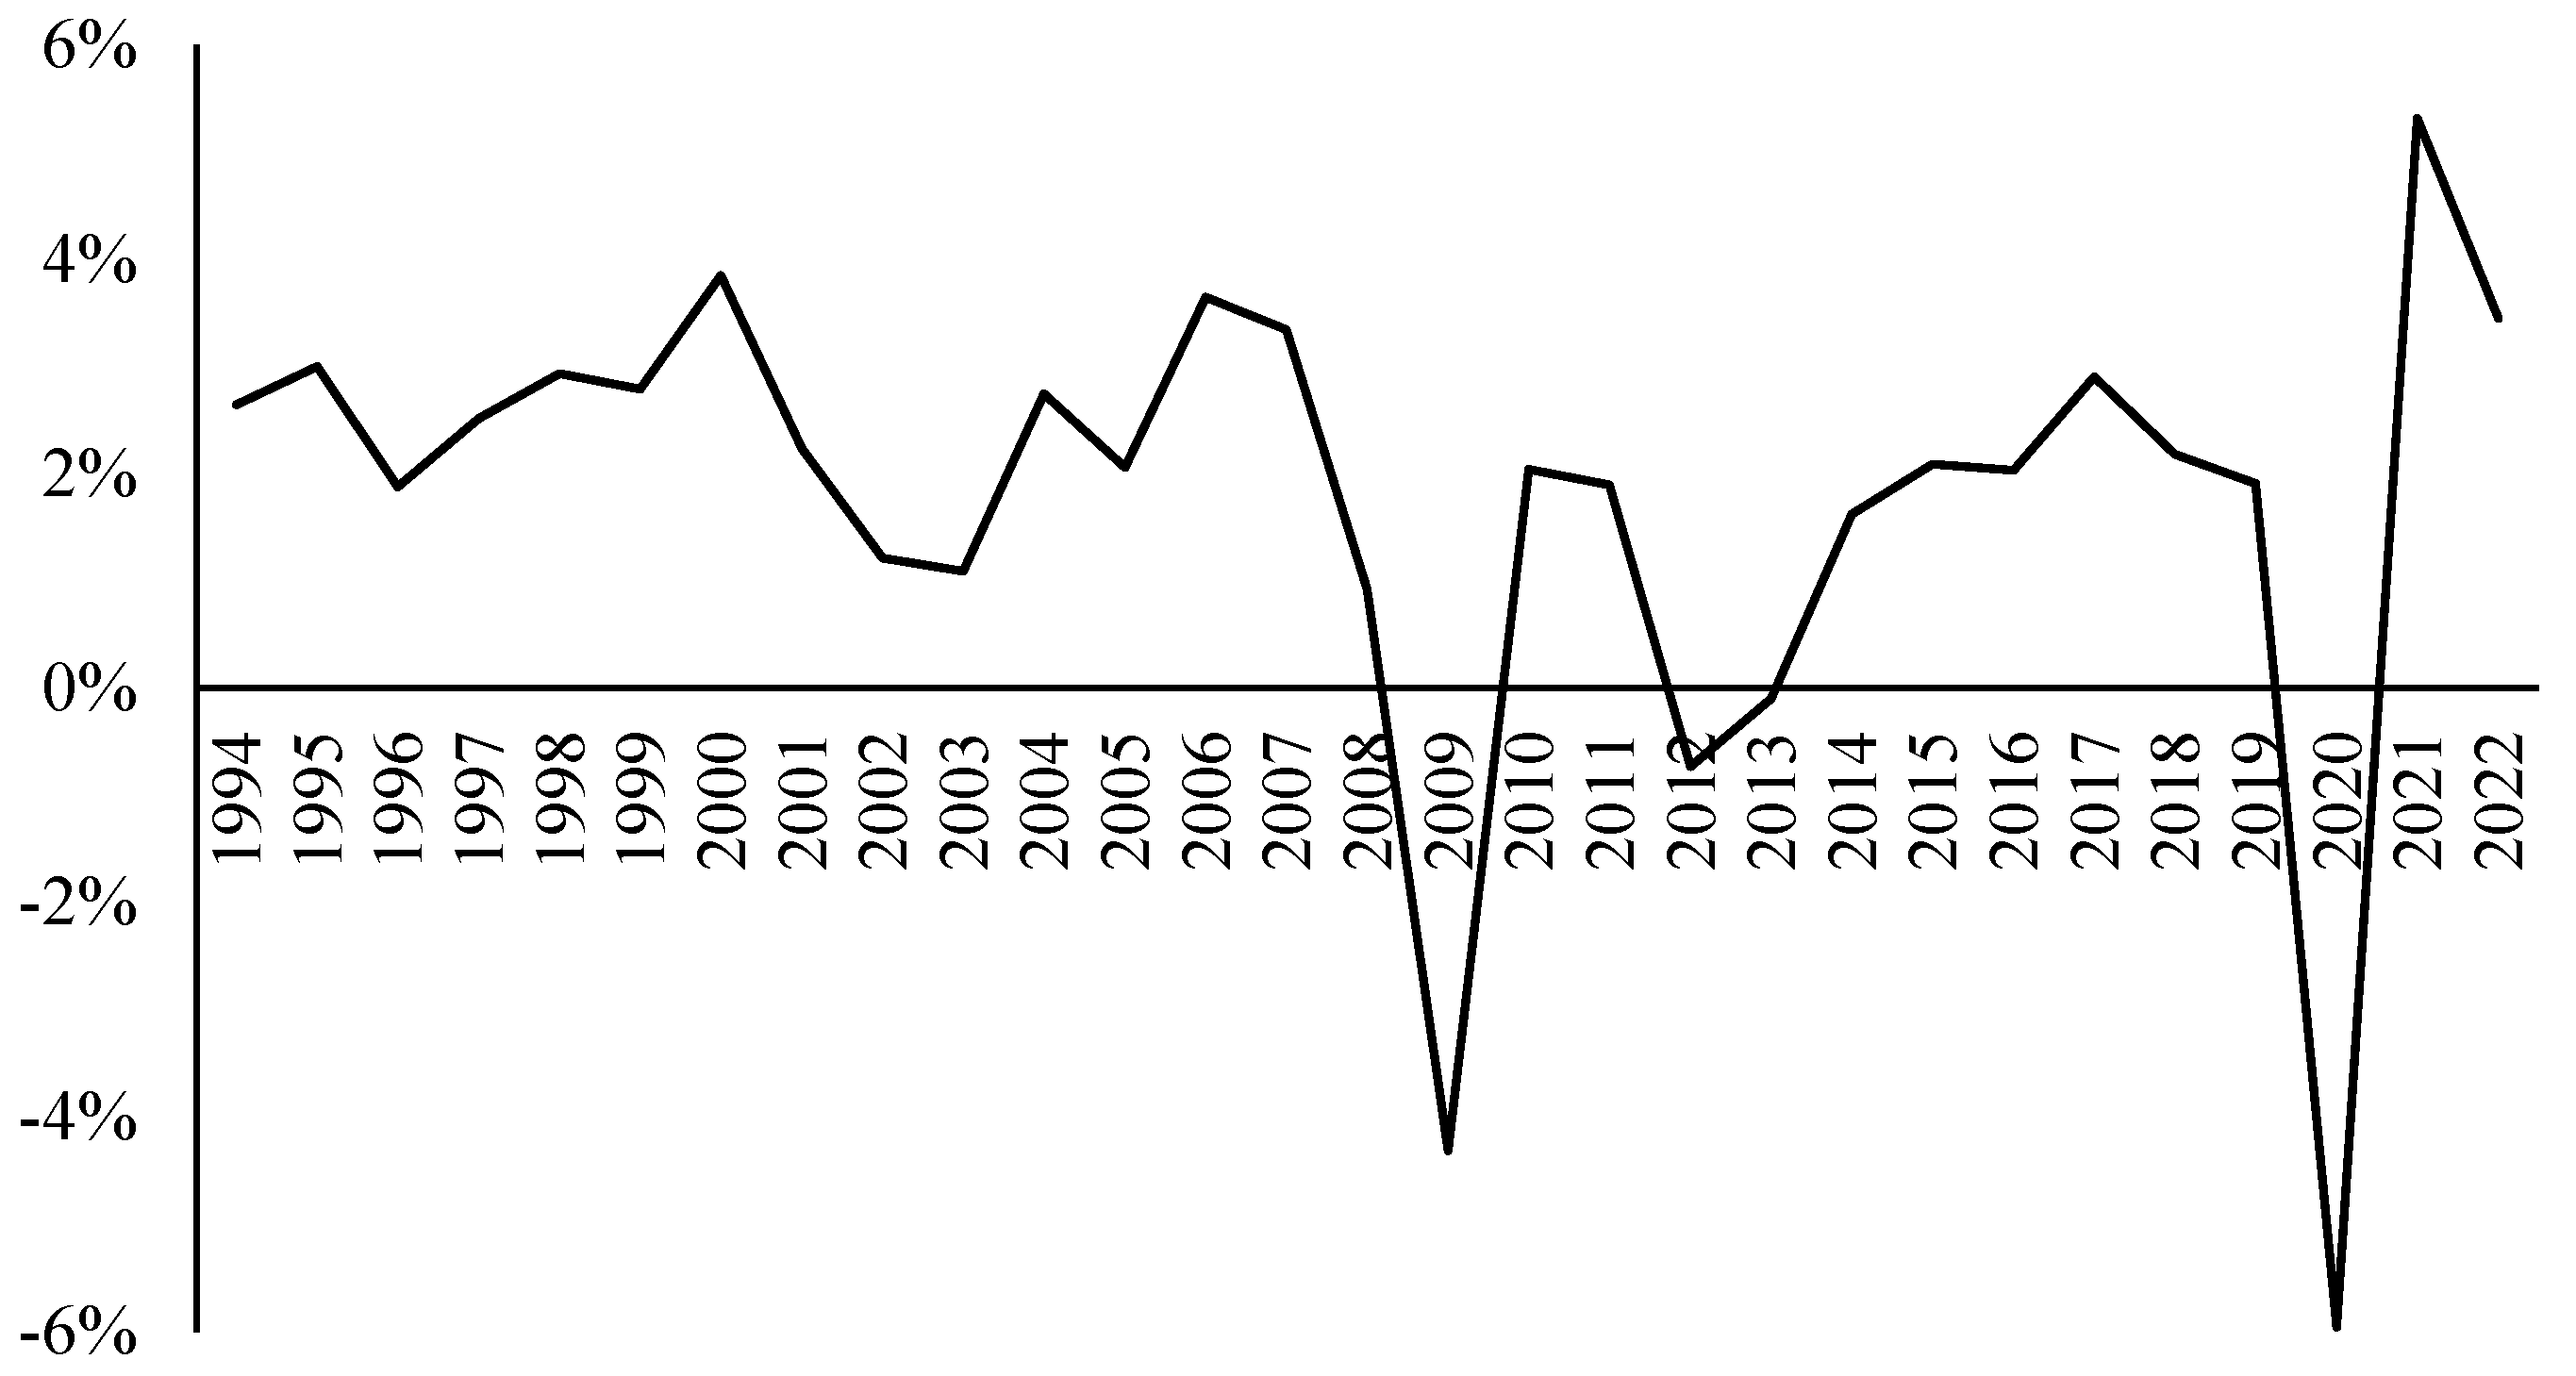
The path of economic growth in the European Union in 1994–2022 is presented in Figure 1.

Figure 1.
Average growth of real GDP for EU members in 1994–2022. Source: own study based on The Conference Board TED, April 2023, http://www.conference-board.org/data/economydatabase/ (accessed on 14 December 2023).
In the first 14 years, a relatively stable annual GDP growth rate was observed in the European Union, oscillating around 3%. There was only one moderate negative disturbance, as a result of the economic downturn occurring between 2001 and 2003. The following years have seen two significant declines in economic growth triggered by the crises occurring in 2008–2009 and 2020. The first one, triggered in the real estate market and transmitted to the financial sector and the real sphere, caused a lower contribution of labor and capital formation to growth and resulted in unfavorable TFP [6]. The largest decreases in GDP occurred in Estonia (−14.46%), Lithuania (−13.89%), and Latvia (−12.83%). Malta and Poland were the most resilient to the crisis, recording a fall in GDP of 1.87% and an increase of 1.85%, respectively.
The second crisis was triggered by the COVID-19 coronavirus pandemic. It was not structural and was characterized not only by other channels of impact on economic growth, but also by a stronger decline in GDP. However, due to policy intervention, the impact of this crisis was not as disruptive as expected [62]. This crisis was felt most strongly in Spain and Malta (11.79% and 10.59% falls in GDP) and Greece, Italy, Portugal, Croatia, and Ireland, where the recession reached approximately 8%. The smallest decreases in GDP occurred in the Baltic countries and Poland, ranging from −0.05% to −1.94%.
In the period between these crises, relative stability in economic growth was observed, with the exception of a decline in the average GDP growth rate in the European Union in 2012. Excessive public and private sector indebtedness, as well as increased uncertainty about the future direction of the economy, resulting in significant declines in consumption and investment, are cited as the primary causes of this economic slowdown. Greece and Cyprus (−6.58% and −4.91% falls in GDP) were the most exposed to the negative effects of the recession. Despite the short-term downturn, two countries recorded significant economic growth: Latvia (8.37%) and Lithuania (5.25%). Exceptional was the year 2021, which saw a significant economic recovery, resulting in the greatest GDP growth in the examined period.
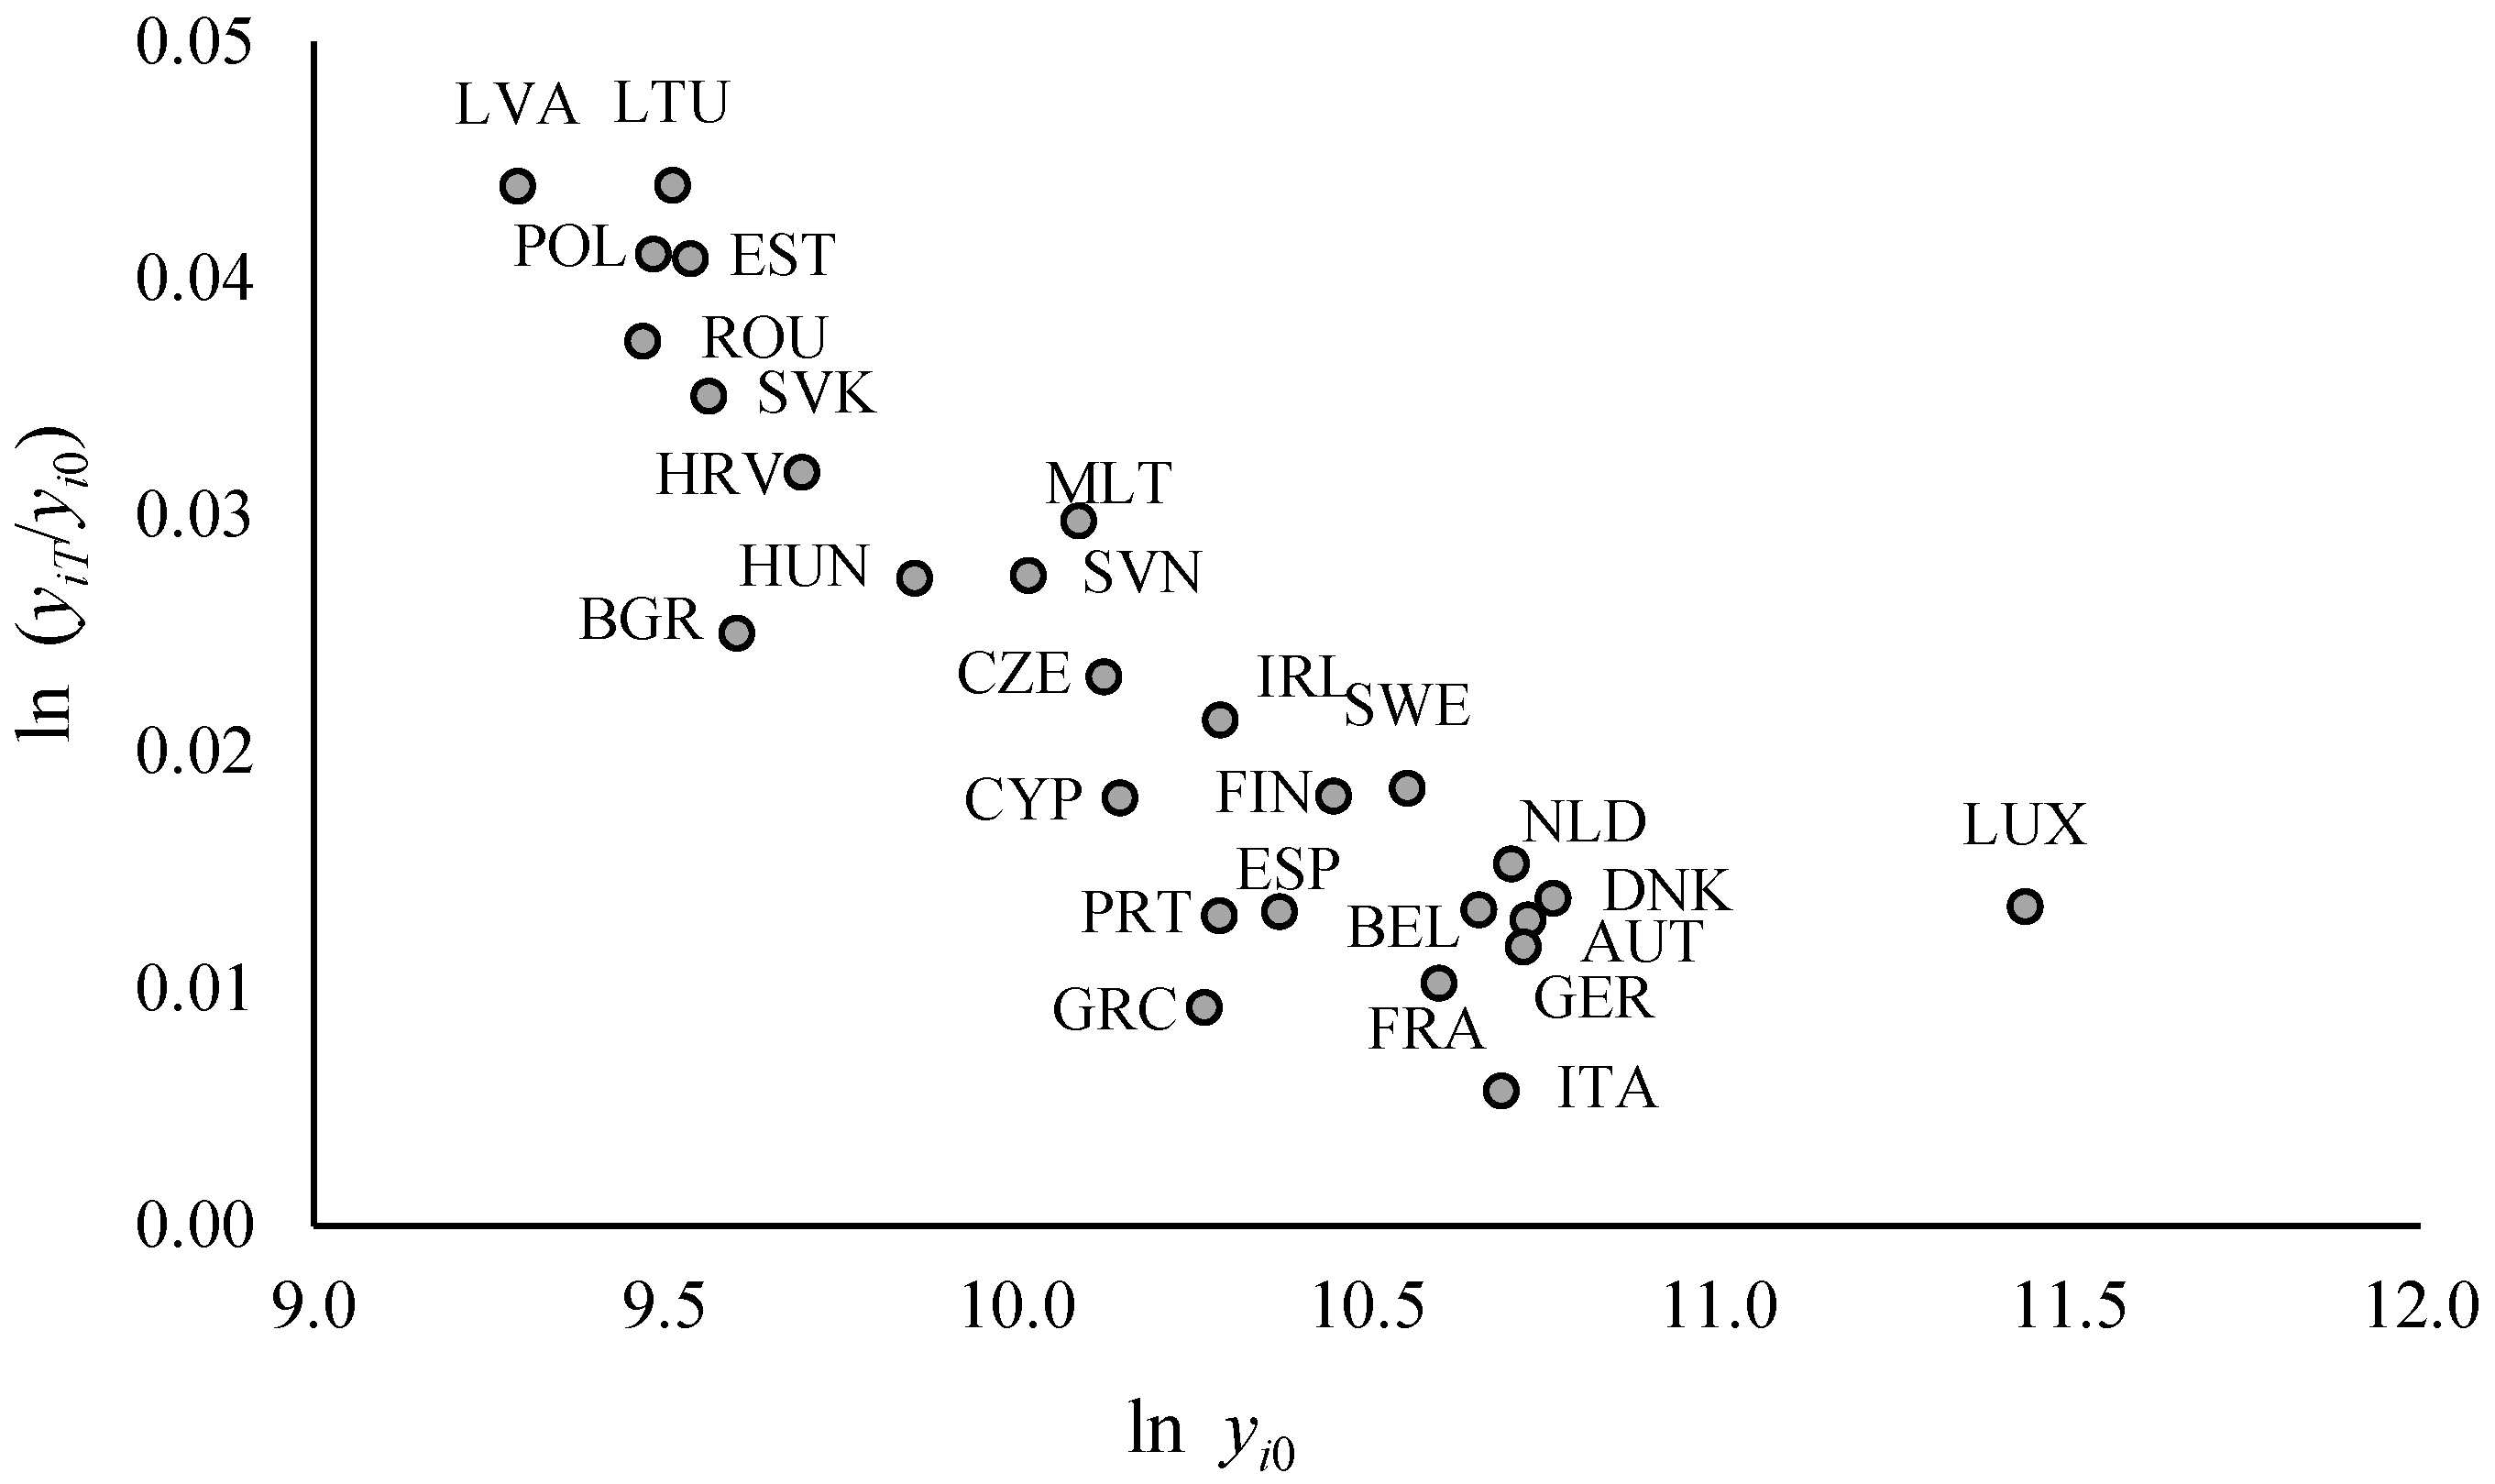
The relationship between the initial levels of real GDP for EU members in 1993 and their average economic growth rates in 1993–2022 is presented in Figure 2.

Figure 2.
Relationship between the initial levels of real GDP for EU members in 1993 [] and their average economic growth rates in 1993–2022 []. Source: own study based on The Conference Board TED, April 2023, http://www.conference-board.org/data/economydatabase/ (accessed on 14 December 2023).
The relationship observed in Figure 2 suggests a linear negative dependency that means the existence of absolute income convergence. The parameters of Equation (2) were estimated using ordinary least squares (OLS). Some studies suggest that these parameters may be estimated using a nonlinear least squares method because OLS does not ensure the negative value of the estimate of parameter , and consequently the determination of convergence speed β [63]. Durlauf et al. [64] found that the OLS estimate of the parameter β may describe only statistical and not economic convergence, and may cause an overestimation of the convergence speed.
Table 1 presents the parameter estimation results for the six models with different data selection criteria. The first two are for the full period, with the second model eliminating an outlier observation in the form of Luxembourg (see Figure 2), distinguished by the highest value of Cook’s distance (). The difference in results obtained by including this country in the sample is also confirmed by other authors [5].

Table 1.
Results of estimation of -convergence in the European Union.
Models (3) and (4) show the evolution of income convergence in the first subperiod covering 1993–2007 and 1993–2009, respectively. Two outlier observations were identified in this case according to the highest values of Cook’s distance: Bulgaria (; ) and Luxembourg (; ).
A comparison of the estimation results of the coefficients of these models allows us to assess the impact of the first crisis on the change in the speed of income convergence. The last two models, (5) and (6), were estimated for the second subperiod and cover the years 2010–2019 and 2010–2020, respectively. In that case, two outlier observations were also eliminated: Greece (; ) and Luxembourg (; ). The differences found in the values of the parameters of these models make it possible to assess the impact of the second crisis on the development of income convergence in European Union countries.
The first four models have a fairly strong goodness of fit, and removing outlier observations improves this fit significantly, although for the last two models, we observe a slightly lower level of fit to empirical data. The parameters of all models are statistically significant, and the tests performed confirm the high quality of the models estimated. The obtained results for the entire period 1993–2022 (model 1) confirmed the occurrence of sustainable convergence in the EU. The overall speed of convergence for all Member States was equal to 2.74%, while the half-time of convergence was equal to 25.29 years. The results of estimation for the same period but for the reduced sample (model 2, without Luxembourg) evidence a higher quality of the model and a much faster real convergence within the EU, with and years.
Model 3, without Bulgaria and Luxembourg, shows that in the precrisis years 1993–2007, the speed of convergence of income levels was faster than over the full time span of the sample, with and years. However, the emergence of the negative effects of the first crisis slowed down this process quite significantly (model 4, without Bulgaria and Luxembourg). The rate of convergence under its influence was below the level observed in model 2, with and years.
Reducing the study period again and limiting it to 2010–2019 (model 5, without Greece and Luxembourg), i.e., those years occurring immediately before the second crisis, made it possible to conclude again that this contributes to a significant increase in the income convergence speed ( and years). However, the result of modeling the impact of the second crisis on real convergence by including the crisis year 2020 (model 6, without Greece and Luxembourg) is interesting—the rate of income equalization has not only not decreased but has even increased slightly ( and years). The most likely reason for this is the much less-differentiated impact of the pandemic downturn compared to the first crisis. At the same time, the Baltic countries, which had the highest GDP growth in the earlier period, were most affected during the 2008–2009 crisis.
Figure 3 presents the marginal vertical convergence for EU countries () received for the full period (model 2, without Luxembourg) and their tolerance areas in the form of the control card with the average and the standard deviation as the reference levels for . Two groups of countries could be distinguished. The first group, characterized by a negative contribution to the general income convergence, includes, among others, Bulgaria (the highest negative contribution), Denmark, Netherlands, Sweden, and Austria. The second one, that positively contribute to the general income convergence, includes Lithuania (the highest positive contribution), Italy, Estonia, Poland, and Latvia.
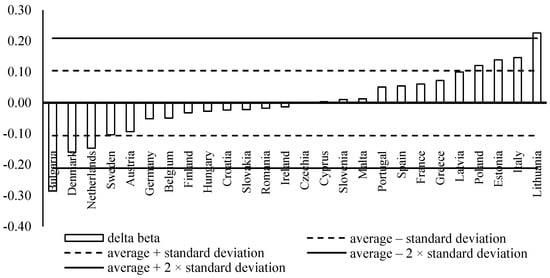
Figure 3.
Values of (1993–2022, based on model 2, without Luxembourg, in percentage points). Source: own study based on The Conference Board TED, April 2023, http://www.conference-board.org/data/economydatabase/ (accessed on 14 December 2023).
The results obtained confirm the existence of club convergence among EU Member States. These clubs are formed mainly on the basis of geographic region and a clear separation between the CEE countries and the old members of the EU [5]. This phenomenon is probably also the result of the occurrence of differences in the sectoral structure of economies, which are also largely historical and geographical in nature [65]. However, it is worth noting an exception to this trend, which is represented by two countries: Bulgaria and Italy.
Table 2 presents the countries’ individual contributions to the overall real convergence received for models (3)–(6).
Table 2.
Values of for chosen subperiods (in percentage points).
In the first subperiod, 1993–2007 (model 3), a positive contribution to the overall income convergence in the case of Latvia and Estonia and, to some extent, Lithuania could be observed. The main determinant behind this phenomenon was the high growth of GDP evidenced for the aforementioned Baltic countries. These contributions were significantly reduced by the first crisis in 2008–2009 (model 4). In the subperiod 1993–2007, negative values of characterized Romania, Poland, and Hungary. It is worth noting, however, that the emergence of the first crisis contributed to an improvement (increase) in these values, unlike the change that occurred for the previous three countries. For Poland, there was even a positive value of this measure, which shows the high resilience of this country to the impact of the first crisis.
In the second subperiod, 2010–2019, the countries with positive contributions to the real convergence process were Lithuania, Latvia, and Romania. In contrast, the largest negative contribution was for Bulgaria. These contributions have remained virtually unchanged during the pandemic period observed, not only for these countries but also for the others. This is evidenced by the very high rank correlation value, calculated for the values obtained for the 2010–2019 and 2010–2020 subperiods, equal to 0.981. However, the 2020 crisis has resulted in a negative trend in marginal income convergence for Denmark and Croatia and an increase in the positive contribution for Italy.
Table 3 presents differences in the half-times of the convergence for all analyzed subperiods.
Table 3.
Values of for chosen subperiods (in years).
A significant shortening of the convergence period in the first subperiod, 1993–2007 (model 3), occurred for Latvia and Estonia, while its significant lengthening was characterized by Romania and Poland. For the latter country, the relationship was even reversed. A negative impact of the first crisis was recorded by the Netherlands, and a positive impact was recorded by Italy (model 4). Positive contributions to European real convergence in the second subperiod, 2010–2019 (model 5), were identified for Latvia, Lithuania, and Romania.
By contrast, Bulgaria has significantly slowed down this convergence process, including during the pandemic. During the second crisis, favorable changes in the length of the convergence period were seen for Italy and Estonia and negative changes were seen for Croatia and Denmark.
4. Discussion and Conclusions
Changes in sustainability of the European real convergence process may have a significant effect on economic policies supporting future economic growth. The new members of the EU are still showing dissimilarities from old members in terms of innovation, institutional environment, and productivity. Filling this gap determines the catch-up process in the long run [66]. The convergence of income levels per capita has an impact on many other processes, not only of an economic nature, such as the equalization of labor costs, but also on phenomena such as international migration.
Sustainable economic convergence is important not only for the individual countries that benefit from it, but also for the smooth functioning of the European Union [8,67]. However, modelling this phenomenon is often difficult because of the incomparability of the datasets used and the time periods considered. The occurrence of structural shocks, caused mainly by emerging regional and global economic crises, is also a limitation. The variability of the results obtained is also a consequence of the use of different research approaches and model hypotheses. Different results are also due to the use of different definitions (types) of income convergence. Observation of the changes taking place in terms of real convergence in the European Union over the last three decades allows us to conclude that the speed of the convergence exceeds the 2% most commonly indicated in previous studies, and this process is accelerating. The results obtained for the period 1993–2009 show that the half-time of the convergence was 21.32 years, while it decreased to 17.22 years for the period 2010–2020. This trend is not stopped by emerging economic crises, which do not reduce potential GDP, especially in highly developed countries [68]. This study also shows how important the identification of nonnormal observations is in modeling income convergence. The removal of such observations significantly improves the quality of the models estimated and makes it possible to better visualize existing relationships.
The contribution to the general income convergence within the EU is different for individual countries. Different marginal vertical income convergence values are caused by the heterogeneity of economic growth of Member States, resilience to economic downturns, distribution of income, and structure of economies [69,70]. Identification of the differences in economic growth paths is the important condition to develop policies targeted at diminishing existing income inequalities and achieving macroeconomic stability through efficient fiscal policy and the flexibility of labor markets.
In further studies, it is worth including spatial relationships in convergence models and identifying the countries’ specific features responsible for accelerating or slowing down the general process of income convergence. An analysis of the impact of another crisis triggered by the war in Ukraine may also provide interesting conclusions. In particular, there is a different cause in this case compared to the last two economic downturns, which have been global in nature, while the impact of the crisis caused by the war in Ukraine is being felt first and foremost in Europe.
Author Contributions
Conceptualization, J.B. and B.B.; methodology, J.B. and B.B.; validation, J.B. and B.B.; formal analysis, J.B. and B.B.; investigation, J.B. and B.B.; resources, J.B. and B.B.; data curation, J.B. and B.B.; writing—original draft preparation, J.B. and B.B.; writing—review and editing, J.B. and B.B.; visualization, J.B. and B.B.; supervision, J.B. and B.B. All authors have read and agreed to the published version of the manuscript.
Funding
This research received no external funding.
Institutional Review Board Statement
Not applicable.
Informed Consent Statement
Not applicable.
Data Availability Statement
We used statistics available from international databases.
Conflicts of Interest
The authors declare no conflicts of interest.
References
- Dapena, A.D.; Rubiera-Morollon, F.; Paredes, D. New Approach to Economic Convergence in the EU: A Multilevel Analysis from the Spatial Effects Perspective. Int. Reg. Sci. Rev. 2018, 42, 335–367. [Google Scholar] [CrossRef]
- Economic Convergence in the Euro Area: The COVID-19 Pandemic, Disruptor or Accelerator of Convergence? Technical Note for the Eurogroup European Commission, Directorate General, Economic and Financial Affairs 2021. Available online: https://www.consilium.europa.eu/media/51835/eg-20210910-item-2-commission-note-convergence.pdf (accessed on 14 December 2023).
- Dvoroková, K.; Kovářová, J.; Šulganová, M. Impact of the Financial Crisis on the Convergence of the Czech Economy with the Euro Area Economy. In Lessons Learned from the Financial Crisis; Polouček, S., Stavárek, D., Eds.; Silesian University, School of Business Administration: Karviná, Czechia, 2012; pp. 136–149. [Google Scholar]
- Uctum, M.; Uctum, R.; Vijverberg, C.-P.C. The Eurozone Convergence through Crises and Structural Changes; Working Paper; CNRS, Université de Paris Ouest Nanterre La Défense: Paris, France, 2017; pp. 2017–2038. [Google Scholar]
- Borsi, M.T.; Metiu, N. The Evolution of Economic Convergence in the European Union. Empir. Econ. 2015, 48, 657–681. [Google Scholar] [CrossRef]
- Halmai, P.; Vásáry, V. Convergence Crisis: Economic Crisis and Convergence in the European Union. Int. Econ. Econ. Policy 2012, 9, 297–322. [Google Scholar] [CrossRef]
- Greta, M.; Lewandowski, K. The Impact of The Global Financial and Economic Crisis on The Convergence Process in OECD Countries. Comp. Econ. Res. 2015, 18, 81–96. [Google Scholar] [CrossRef]
- Dorrucci, E. Sustainable Economic Growth in the Euro Area: The Need for a “Long View” and “Going Granular”. In Getting Globalization Right; Paganetto, L., Ed.; Springer Nature: Cham, Switzerland, 2018; pp. 175–195. [Google Scholar] [CrossRef]
- Morales-Zumaquero, A.; Sosvilla-Rivero, S. A Contribution to the Empirics of Convergence in Real GDP Growth: The Role of Financial Crises and Exchange Rate Regimes; Working Papers on International Economics and Finance; Asociación Española de Economía y Finanzas Internacionales: Granada, Spain, 2014; p. DEFI 14-06. [Google Scholar]
- Batóg, J. Konwergencja Dochodowa w Krajach Unii Europejskiej. Analiza ekonometryczna (Income Convergence in the European Countries. Econometric Analysis); Rozprawy i Studia T. DCCCLIV 780; Wydawnictwo Naukowe Uniwersytetu Szczecińskiego: Szczecin, Poland, 2010. [Google Scholar]
- Młynarzewska-Borowiec, I. Determinants of the Real Convergence Process in the European Union—A Panel Analysis for 2004–2015. Argum. Oecon. 2018, 1, 345–363. [Google Scholar] [CrossRef]
- Forgó, B.; Jevčák, A. Economic Convergence of Central and Eastern European EU Member States over the Last Decade 2004–2014; European Economy Discussion Paper; European Commission, Directorate-General for Economic and Fi-nancial Affairs: Brussel, Belgium, 2015; p. 001. [Google Scholar]
- Grela, M.; Majchrowska, A.; Michałek, T.; Mućk, J.; Stążka-Gawrysiak, A.; Tchorek, G.; Wagner, M. Is Central and Eastern Europe Converging Towards the EU-15? NBP Working Paper; Economic Research Department: Warsaw, Poland, 2017; p. 264. [Google Scholar]
- Siljak, D. Real Economic Convergence in the European Union from 1995 to 2013. Bus. Manag. Rev. 2015, 6, 213–225. [Google Scholar]
- Matkowski, Z.; Próchniak, M.; Rapacki, R. Real Income Convergence between Central Eastern and Western Europe: Past, Present, and Prospects. Ekonomista 2016, 6, 854–892. [Google Scholar]
- Borio, C. The Financial Cycle and Macroeconomics What Have We Learnt? BIS Working Papers: Basel, Switzerland, 2012; p. 395. [Google Scholar]
- Šikić, L. Long-term Economic Convergence Among Ten New EU Member States in the Light of the Economic Crisis. Financ. Theory Pract. 2013, 37, 361–381. [Google Scholar] [CrossRef]
- Dauderstädt, M. Convergence in Crisis. European Integration in Jeopardy. In International Policy Analysis; Friedrich Ebert Stiftung: Bonn, Germany, 2014. [Google Scholar]
- Dvoroková, K. Sigma Versus Beta-convergence in EU28 in Financial Crisis and Postcrisis Period. WSEAS Trans. Bus. Econ. 2014, 11, 314–321. [Google Scholar]
- Bal-Domańska, B. The Impact of Economic Crisis on Convergence Processes in European Union Regions. Prague Econ. Pap. 2016, 25, 509–526. [Google Scholar] [CrossRef]
- Goda, T.; Torres García, A. The Rising Tide of Absolute Global Income Inequality During 1850–2010: Is It Driven by Inequality Within or Between Countries? Soc. Indic. Res. 2017, 130, 1051–1072. [Google Scholar] [CrossRef]
- Merler, S. Income Convergence During the Crisis: Did the EU Funds Provide a Buffer? Bruegel, Working Paper: Brussels, Belgium, 2016; Volume 6, pp. 1–20. [Google Scholar]
- Halmai, P. COVID-Crisis and Economic Growth Tendencies on Potential Growth in the European Union. Acta Oecon. 2021, 71 (Suppl. S1), 165–186. [Google Scholar] [CrossRef]
- Bodnár, K.; Le Roux, J.; Lopez-Garcia, P.; Szörfi, B. The Impact of COVID-19 on Potential Output in the Euro Area. ECB Econ. Bull. 2020, 7, 42–61. [Google Scholar]
- Barro, R.J.; Ursua, J.F.; Weng, J. The Coronavirus and the Great Influenza Pandemic Lessons from the ‘Spanish Flu’ for the Coronavirus’ Potential Effects on Mortality and Economic Activity; NBER Working Paper: Cambridge, MA, USA, 2020; Volume 26866, pp. 1–26. [Google Scholar] [CrossRef]
- Boissay, F.; Rungcharoenkitkul, P. Macroeconomic Effects of COVID-19 An Early Review; Bank for International Settlements: Basel, Switzerland, 2020; Volume 7, pp. 1–7. [Google Scholar]
- Martinho, V.J.P.D. Impact of COVID-19 on the Convergence of GDP per capita in OECD Countries. Reg. Sci. Policy Pract. 2021, 13 (Suppl. S1), 55–72. [Google Scholar] [CrossRef]
- Figari, F.; Fiorio, C.; Gandullia, L.; Montorsi, C. The resilience of the Italian social protection system at the beginning of COVID-19 outbreak: Territorial evidence. Politica Econ. 2020, 36, 3–34. [Google Scholar] [CrossRef]
- Greiner, A.; Owusu, B.K. How to Spend 750 Billion Euro? Applying Sacrifice Theory to Determine COVID-19 Compensations in the EU. Econ. Bull. 2020, 40, 2457–2470. [Google Scholar] [CrossRef]
- Zhang, Y.; Aycock, L.; Chen, X. Levels of Economic Development and the Spread of Coronavirus Disease 2019 (COVID-19) in 50 U.S. States and Territories and 28 European Countries: An Association Analysis of Aggregated Data. Glob. Health J. 2021, 5, 24–30. [Google Scholar] [CrossRef]
- Brussevich, M.; Liu, S.; Papageorgiou, C. Income Convergence or Divergence in the Aftermath of the COVID-19 Shock? IMF Working Papers: Washington, DC, USA, 2022; Volume 121, pp. 1–33. [Google Scholar]
- Fedajev, A.; Radulescu, M.; Babucea, A.G.; Mihajlovic, V.; Yousaf, Z.; Milićević, R. Has COVID-19 Pandemic Crisis Changed the EU Convergence Patterns? Econ. Res.–Ekon. Istraz. 2021, 35, 2112–2141. [Google Scholar] [CrossRef]
- Bisciari, P.; Essers, D.; Vincent, E. Does the EU Convergence Machine Still Work and How Will the COVID-19 Crisis Impact It? SUERF Policy Note No 172; SUERF: Vienna, Austria, 2020; pp. 1–10. [Google Scholar]
- Alcidi, C.; Ferrer Nunez, J.; di Salvo, M.; Musmeci, R.; Pilati, M. Income Convergence in the EU: A Tale of Two Speeds. CEPS Comment. 2018, 9, 1–7. [Google Scholar]
- Verianto, M.I.; Faiq, M.N.; Tarassyta, A. The Influence of the COVID-19 Pandemic on Economic Growth Convergence at the District/City Level in East Java: What is the Right Public Policy? JIET J. Ilmu Ekon. Terap. 2022, 7, 75–84. [Google Scholar] [CrossRef]
- Choudhary, M.A.; Haqqani, I.A.; Lenzi, F.; Limodio, N. Subnational Income, Convergence, and the COVID-19 Pandemic; Final Report. S-20204-PAK-1; International Growth Centre: London, UK, 2021. [Google Scholar]
- Ghecham, M.A. The Impact of COVID-19 on Economic Growth of Countries: What Role Has Income Inequality in It? Economies 2022, 10, 158. [Google Scholar] [CrossRef]
- Islam, N. What Have We Learnt from the Convergence Debate? In Surveys in Economic Growth: Theory and Empirics; George, D., Oxley, L., Carlaw, K., Eds.; Blackwell Publishing: Oxford, UK, 2004. [Google Scholar]
- Aghion, P.; Howitt, P. Endogenous Growth Theory; MIT Press: Cambridge, MA, USA, 1999. [Google Scholar]
- Foley, D.K.; Michl, T.R.; Tavani, D. Growth and Distribution, 2nd ed.; Harvard University Press: Cambridge, MA, USA; London, UK, 2019. [Google Scholar]
- Barro, R.J.; Sala-i-Martin, X. Economic Growth, 2nd ed.; MIT Press: Cambridge, MA, USA, 2004. [Google Scholar]
- Svoboda, O.; Klementova, T. Correlation Analysis and Model of the Regional Economic Resilience. WSEAS Trans. Bus. Econ. 2014, 11, 765–777. [Google Scholar]
- Postiglione, P.; Andreano, M.; Benedetti, R. Using Constrained Optimization for the Identification of Convergence Clubs. Comput. Econ. 2013, 42, 151–174. [Google Scholar] [CrossRef]
- Castellacci, F.; Los, B.; de Vries, G.J. Sectoral Productivity Trends Convergence Islands in Oceans of Non-convergence. J. Evol. Econ. 2014, 24, 983–1007. [Google Scholar] [CrossRef]
- Nowak, W. Konwergencja w Modelach Endogenicznego Wzrostu Gospodarczego (Convergence in Endogenous Growth Models); Kolonia Limited: Wrocław, Poland, 2007. [Google Scholar]
- Monfort, M.; Cuestas, J.; Ordonez, J. Real Convergence in Europe: A Cluster Analysis. Econ. Model. 2013, 33, 689–694. [Google Scholar] [CrossRef]
- Gros, D. Convergence is Alive and Well in Europe. In European Union. Post Crisis Challenges and Prospects for Growth; Vlachos, V., Bitzenis, A., Eds.; Palgrave Macmillan: Cham, Switzerland, 2019. [Google Scholar]
- Baldwin, R. The Great Convergence. Information Technology and the New Globalization; The Belknap Press: Cambridge, MA, USA.
- Güreşçi, G.; Utkulu, U. Country-Specific Convergence Behavior in an Enlarged Europe. İşletme Fakültesi Derg. 2015, 16, 207–226. [Google Scholar]
- Wójcik, P. Methods for the Measurement of Real Economic Convergence in Regional and Local Perspectives; Parallel Convergence; Wydawnictwa Uniwersytetu Warszawskiego: Warszawa, Poland, 2018. [Google Scholar]
- Nahar, S.; Inder, B. Testing Convergence in Economic Growth. Appl. Econ. 2002, 34, 2011–2022. [Google Scholar] [CrossRef]
- CreditMetrics. Technical Document; JP Morgan: New York, NY, USA, 1997. [Google Scholar]
- Walfish, S. A Review of Statistical Outlier Methods. Pharm. Technol. 2006, 30, 82–86. [Google Scholar]
- Ruts, I.; Rousseeuw, P. Computing Depth Contours of Bivariate Point Clouds. Comput. Stat. Data Anal. 1996, 23, 153–168. [Google Scholar] [CrossRef]
- Penny, K.I.; Jolliffe, I.T. A Comparison of Multivariate Outlier Detection Methods for Clinical Laboratory Safety Data. Statistician 2001, 50, 295–308. [Google Scholar] [CrossRef]
- Acuna, E.; Rodriguez, C.A. Meta Analysis Study of Outlier Detection Methods in Classification. Department of Mathematics, University of Puerto Rico at Mayaguez. Available online: http://academic.uprm.edu/eacuna/paperout.pdf (accessed on 14 July 2022).
- Lu, C.; Chen, D.; Kou, Y. Algorithms for Spatial Outlier Detection. In Proceedings of the 3rd IEEE International Conference on Data-Mining ICDM’03, Melbourne, FL, USA, 19–22 December 2003. [Google Scholar]
- Belsley, D.A.; Kuh, E.; Welsch, R.E. Regression Diagnostics: Identifying Influential Data and Sources of Collinearity; Wiley: New York, NY, USA, 1980. [Google Scholar]
- Williams, G.J.; Baxter, R.A.; He, H.X.; Hawkins, S.; Gu, L. A Comparative Study of RNN for Outlier Detection in Data Mining. In Proceedings of the IEEE International Conference on Data-mining ICDM’02, Maebashi, Japan, 9–12 December 2002. [Google Scholar]
- Ben-Gal, I. Outlier detection. In Data Mining and Knowledge Discovery Handbook: A Complete Guide for Practitioners and Researchers; Maimon, O., Rockach, L., Eds.; Kluwer Academic Publishers: Boston, MA, USA, 2005. [Google Scholar]
- Ampanthong, P. A Comparative Study of Outlier Detection Procedures in Multiple Linear Regression. In Proceedings of the International MultiConference of Engineers and Computer Scientists 2009, I, IMECS 2009, Hong Kong, China, 18–20 March 2009. [Google Scholar]
- Almeida, V.; Barrios, S.; Christl, M.; De Poli, S.; Tumino, A.; van der Wielen, W. The Impact of COVID-19 on Households’ Income in the EU. J. Econ. Inequal. 2021, 19, 413–431. [Google Scholar] [CrossRef] [PubMed]
- Quah, D.T. Empirics for Economic Growth and Convergence. Eur. Econ. Rev. 1996, 40, 1353–1375. [Google Scholar] [CrossRef]
- Durlauf, S.N.; Johnson, P.A.; Temple, J.R.W. Growth Econometrics; Vassar College Economics Working Paper: Poughkeepsie, NY, USA, 2004; Volume 61. [Google Scholar]
- Groot, S.T.P.; Möhlmann, J.L.; Garretsen, J.H.; de Groot, H.L.F. The Crisis Sensitivity of European Countries and Regions: Stylized Facts and Spatial Heterogeneity. Camb. J. Reg. Econ. Soc. 2011, 4, 437–456. [Google Scholar] [CrossRef]
- Archibugi, D.; Filipetti, A. Is the Economic Crisis Impairing Convergence in Innovation Performance across Europe? J. Common Mark. Stud. 2011, 49, 1153–1182. [Google Scholar] [CrossRef]
- Suciu, M.C.; Petre, A.; Istudor, L.G.; Mituca, M.O.; Stativa, G.A.; Mardarovici, D.; Tofan, O.R.; Cotescu, R.G. Testing Real Convergence as a Prerequisite for Long Run Sustainability. Sustainability 2021, 13, 9943. [Google Scholar] [CrossRef]
- Papell, D.H.; Prodan, R. The Statistical Behaviour of GDP after Financial Crises and Severe Recessions. B. E. J. Macroecon. Spec. Issue Long-Term Eff. Great Recess. 2012, 12, 1–31. [Google Scholar] [CrossRef]
- Zandi, M. What Does Rising Inequality Mean for the Macroeconomy? In After Piketty. The Agenda for Economics and Inequality; Boushey, H., DeLong, J.B., Steinbaum, M., Eds.; Harvard University Press: Cambridge, MA, USA, 2017. [Google Scholar]
- Berg, A.; Ostry, J.D.; Zettelmeyer, J. What Makes Growth Sustained? J. Dev. Econ. 2012, 98, 149–166. [Google Scholar] [CrossRef]
Disclaimer/Publisher’s Note: The statements, opinions and data contained in all publications are solely those of the individual author(s) and contributor(s) and not of MDPI and/or the editor(s). MDPI and/or the editor(s) disclaim responsibility for any injury to people or property resulting from any ideas, methods, instructions or products referred to in the content. |
© 2024 by the authors. Licensee MDPI, Basel, Switzerland. This article is an open access article distributed under the terms and conditions of the Creative Commons Attribution (CC BY) license (https://creativecommons.org/licenses/by/4.0/).