Abstract
Maintaining and planting sustainable forests is fundamental in perpetuating the essential functions of these ecosystems. A central aspect of managing forests for future resilience is the consideration of past migration and evolution of trees using genetic and genomic data to ensure that functionally appropriate diversity is conserved and utilized. In our study, we generated and compared genetic and genomic data from the plastome to better understand phylogeography and molecular evolution in the tree species Populus tremuloides (aspen). With these analyses, we found evidence of divergence and migration between northern and southern sites. Additionally, evidence of deep incomplete plastome sorting across the Salicaceae was found when examining insertion–deletion (indel) sites associated with DNA repair. By examining these indels in plastomic genes with introns across Salicaceae, we found a strong correlation between the abundance of DNA repair with genomic position and transcript abundance. From our findings, we conclude that previously ignored plastomic data are essential in understanding phylogeography and the evolution of key metabolic processes for improved aspen forest planning. Given the propensity of aspen forests to host high levels of biodiversity, rapidly sequester carbon, absorb excess nitrogen, and efficiently regulate snowmelt, improvements to planning and conservation will be highly impactful.
1. Introduction
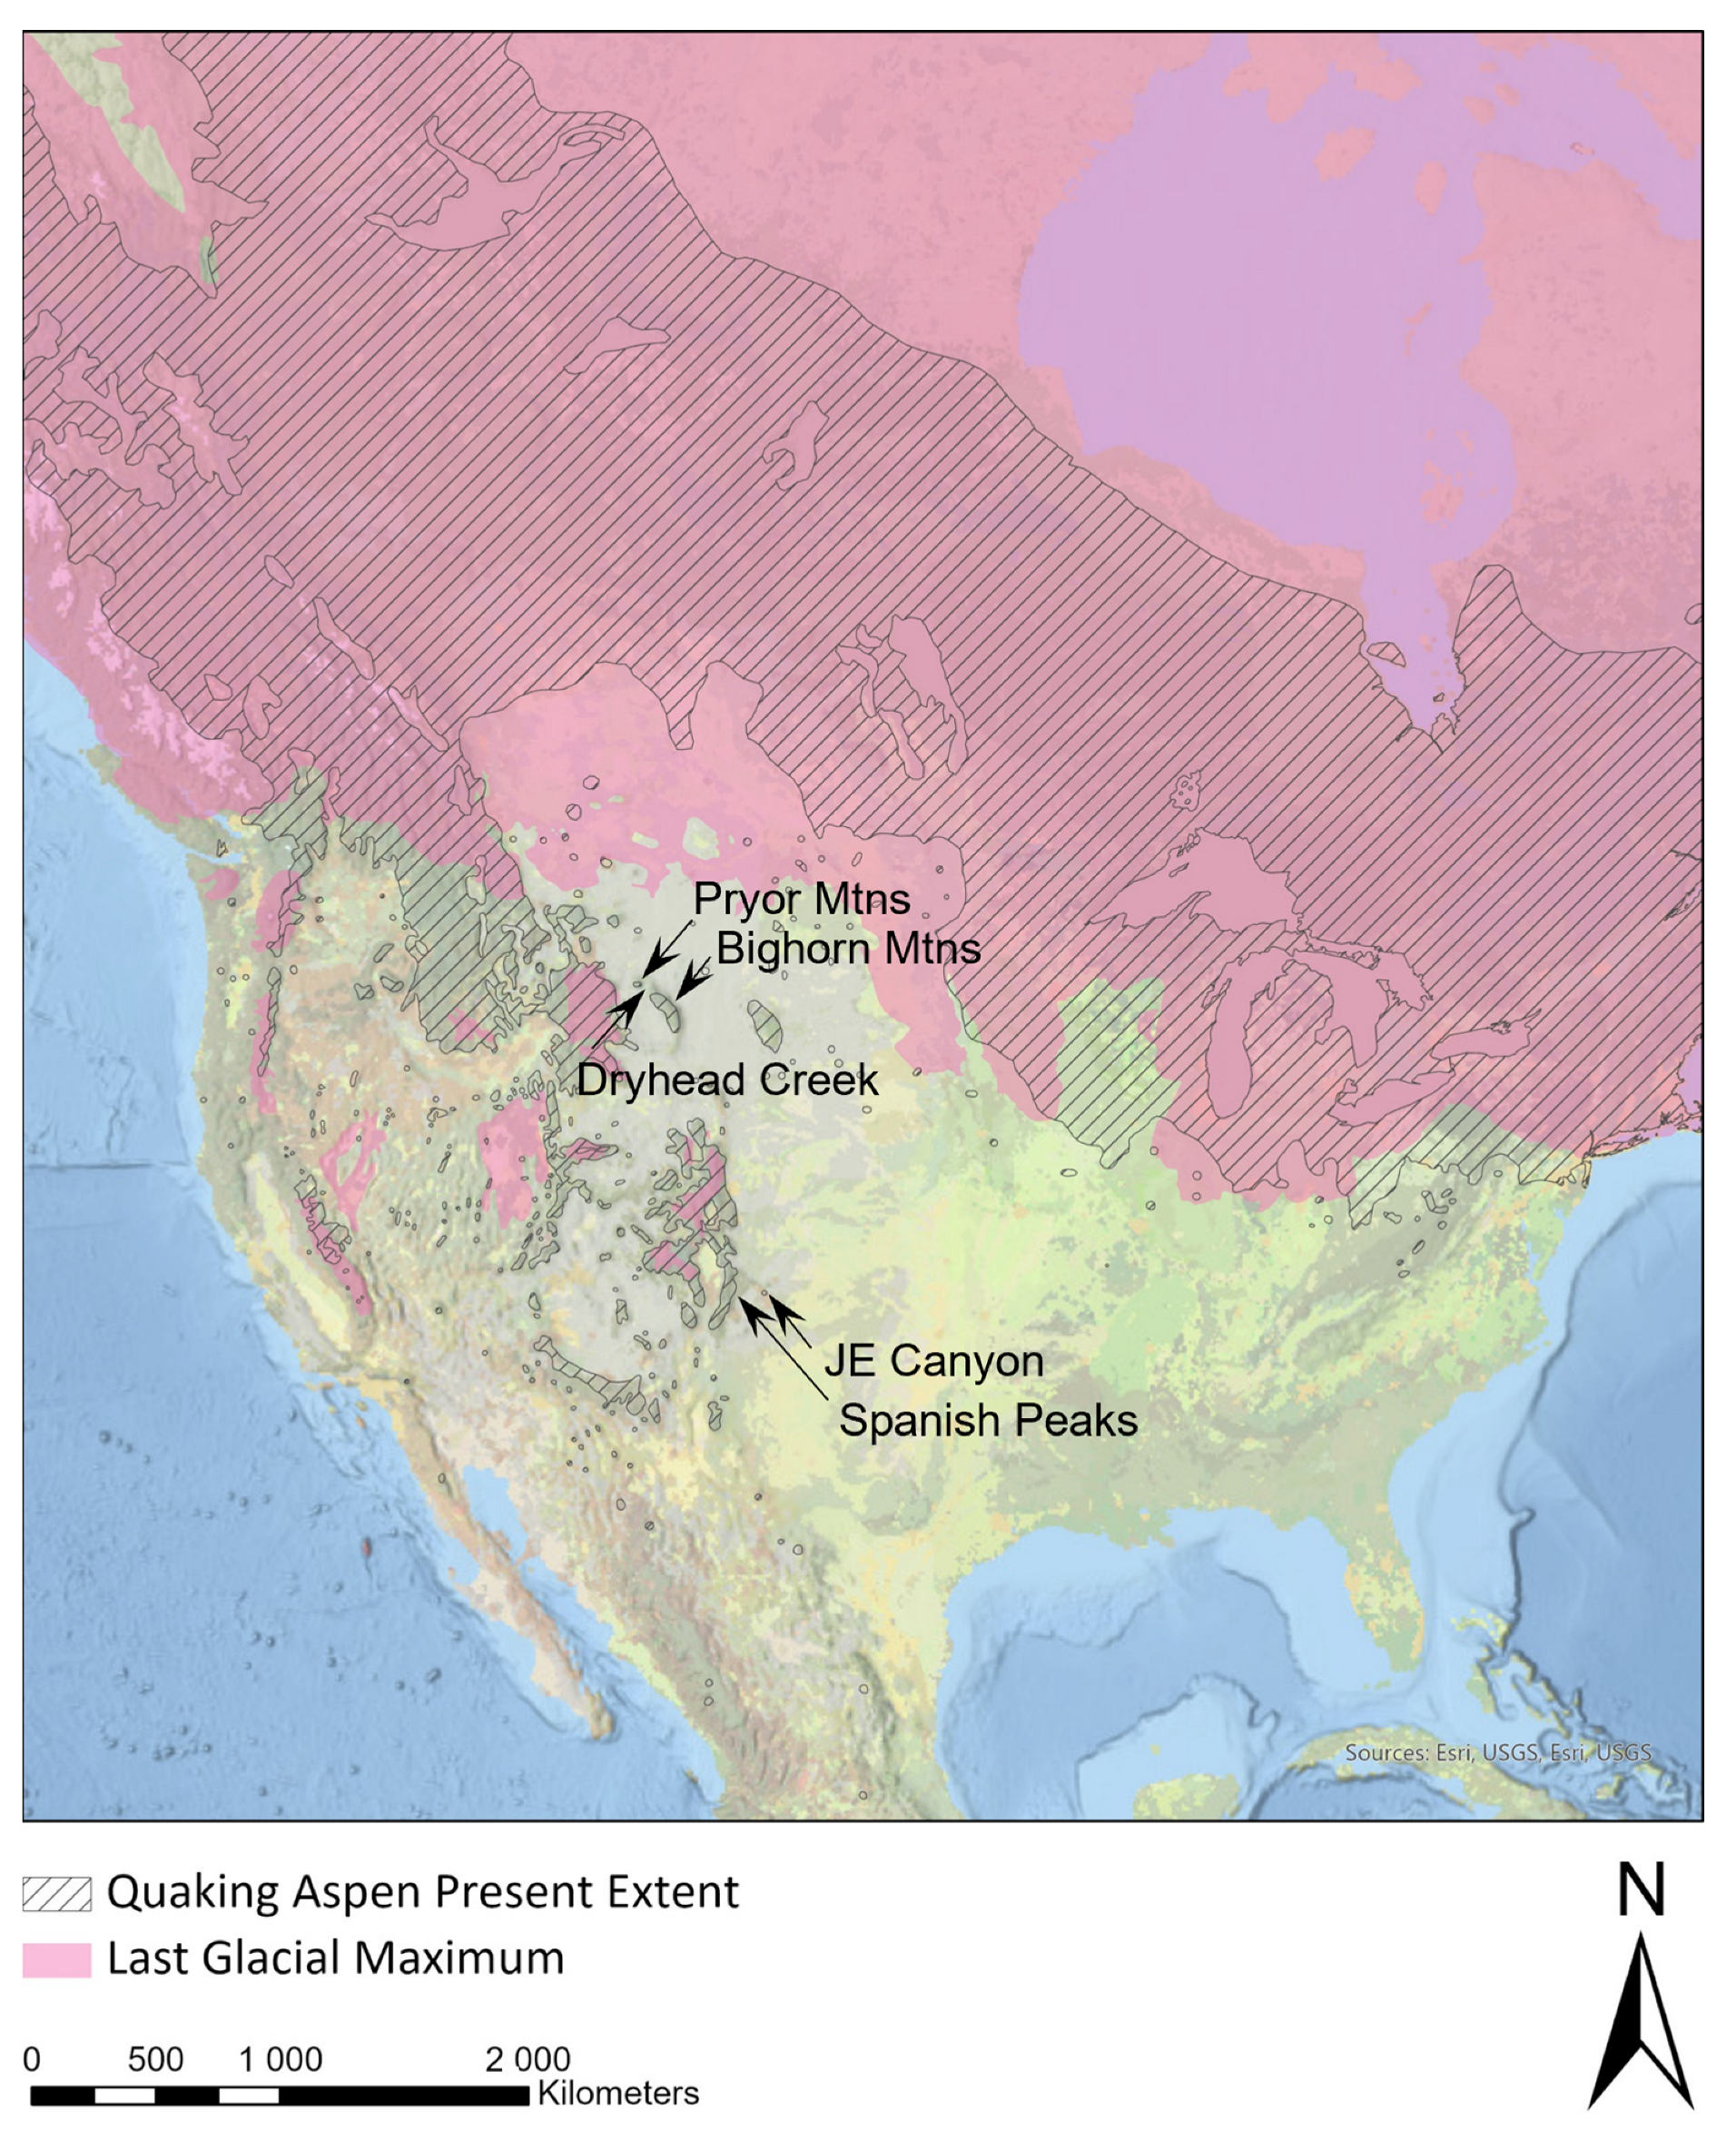
The quaking aspen, or aspen (Salicaceae: Populus tremuloides Michx.), is the most widespread deciduous tree species in North America [1,2] (Figure 1). The range of aspen stretches from the Arctic Circle to Central Mexico and from Nova Scotia to Alaska. Aspen forests provide important ecosystem services such as hosting a high biodiversity of bird, plant, and insect life (e.g., [3,4,5]). These forests can also rapidly sequester atmospheric carbon [6,7], absorb excess nitrogen runoff [8], efficiently store and release snowpack [9], and slow the rate of wildfire progression [10]. Aspens are also economically important as a source of timber, pulp, and wood fiber, as well as for their aesthetic value in ornamental plantings [11]. Efforts to conserve and promote aspen stands have numerous positive environmental and economic benefits [12]. A central aspect of such conservation measures should include the genetic and genomic characterization of aspen clones throughout the species range to preserve locally adapted alleles, so reforestation and afforestation projects can employ ecologically appropriate genotypes [13].
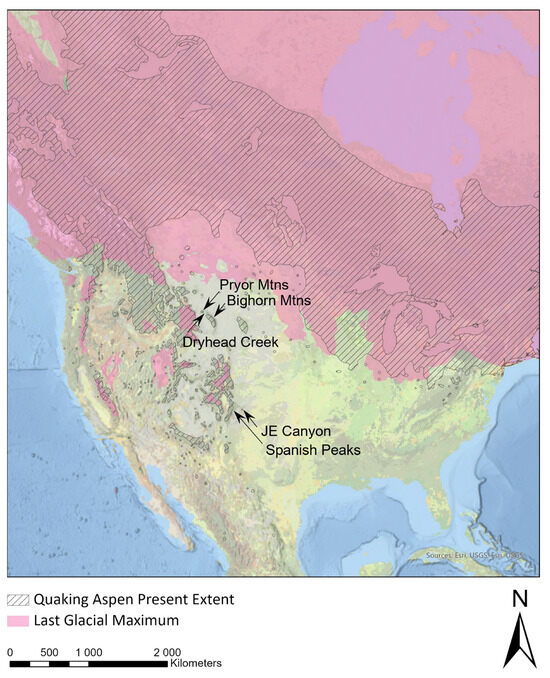
Figure 1.
The present species range of P. tremuloides superimposed on the last glacial maximum (LGM). Collection sites used in this study are indicated with arrows and labels. Relict stands were found at JE Canyon and at Dryhead Creek.
The current, vast species range of aspen has been shaped by large-scale northward expansion that followed the retreat of the Cordilleran and Laurentide ice sheets starting around 10,000 ybp (Figure 1). Phylogeographic work suggests that the recent northward expansion is evident in the genetic structuring of the species into northern and southwestern genetic clusters [14]. This division between genetic clusters, when geographically mapped, generally occurs along the last glacial maximum (LGM). The northern genetic cluster is characterized by limited sub-structuring both within populations and individuals, as well as high rates of inferred geneflow and almost no effect from isolation caused by distance [15]. This genetic pattern is consistent with recent rapid population expansion [16,17]. In contrast, the southwestern genetic cluster is sub-structured, with lower relative diversity within populations but high allelic diversity regionally [14]. This genetic pattern suggests that the southwestern genetic cluster is a stable, relictual population moving between low and high elevations during climate fluctuations. However, it remains somewhat unclear as to the source of the northern genetic cluster before northward expansion. Niche modeling across the aspen species range [18] and the genotyping of relictual populations along the Niobrara River [19] suggest that the northcentral Great Plains east of the central Appalachians may have been a refugial area for aspen (specifically, the northern genetic cluster) during the last ice age. Work on these relict stands indicates that, in some locations, interspecies [19] and inter-genetic–cluster [20] hybridization likely occurred during refugial sympatry.
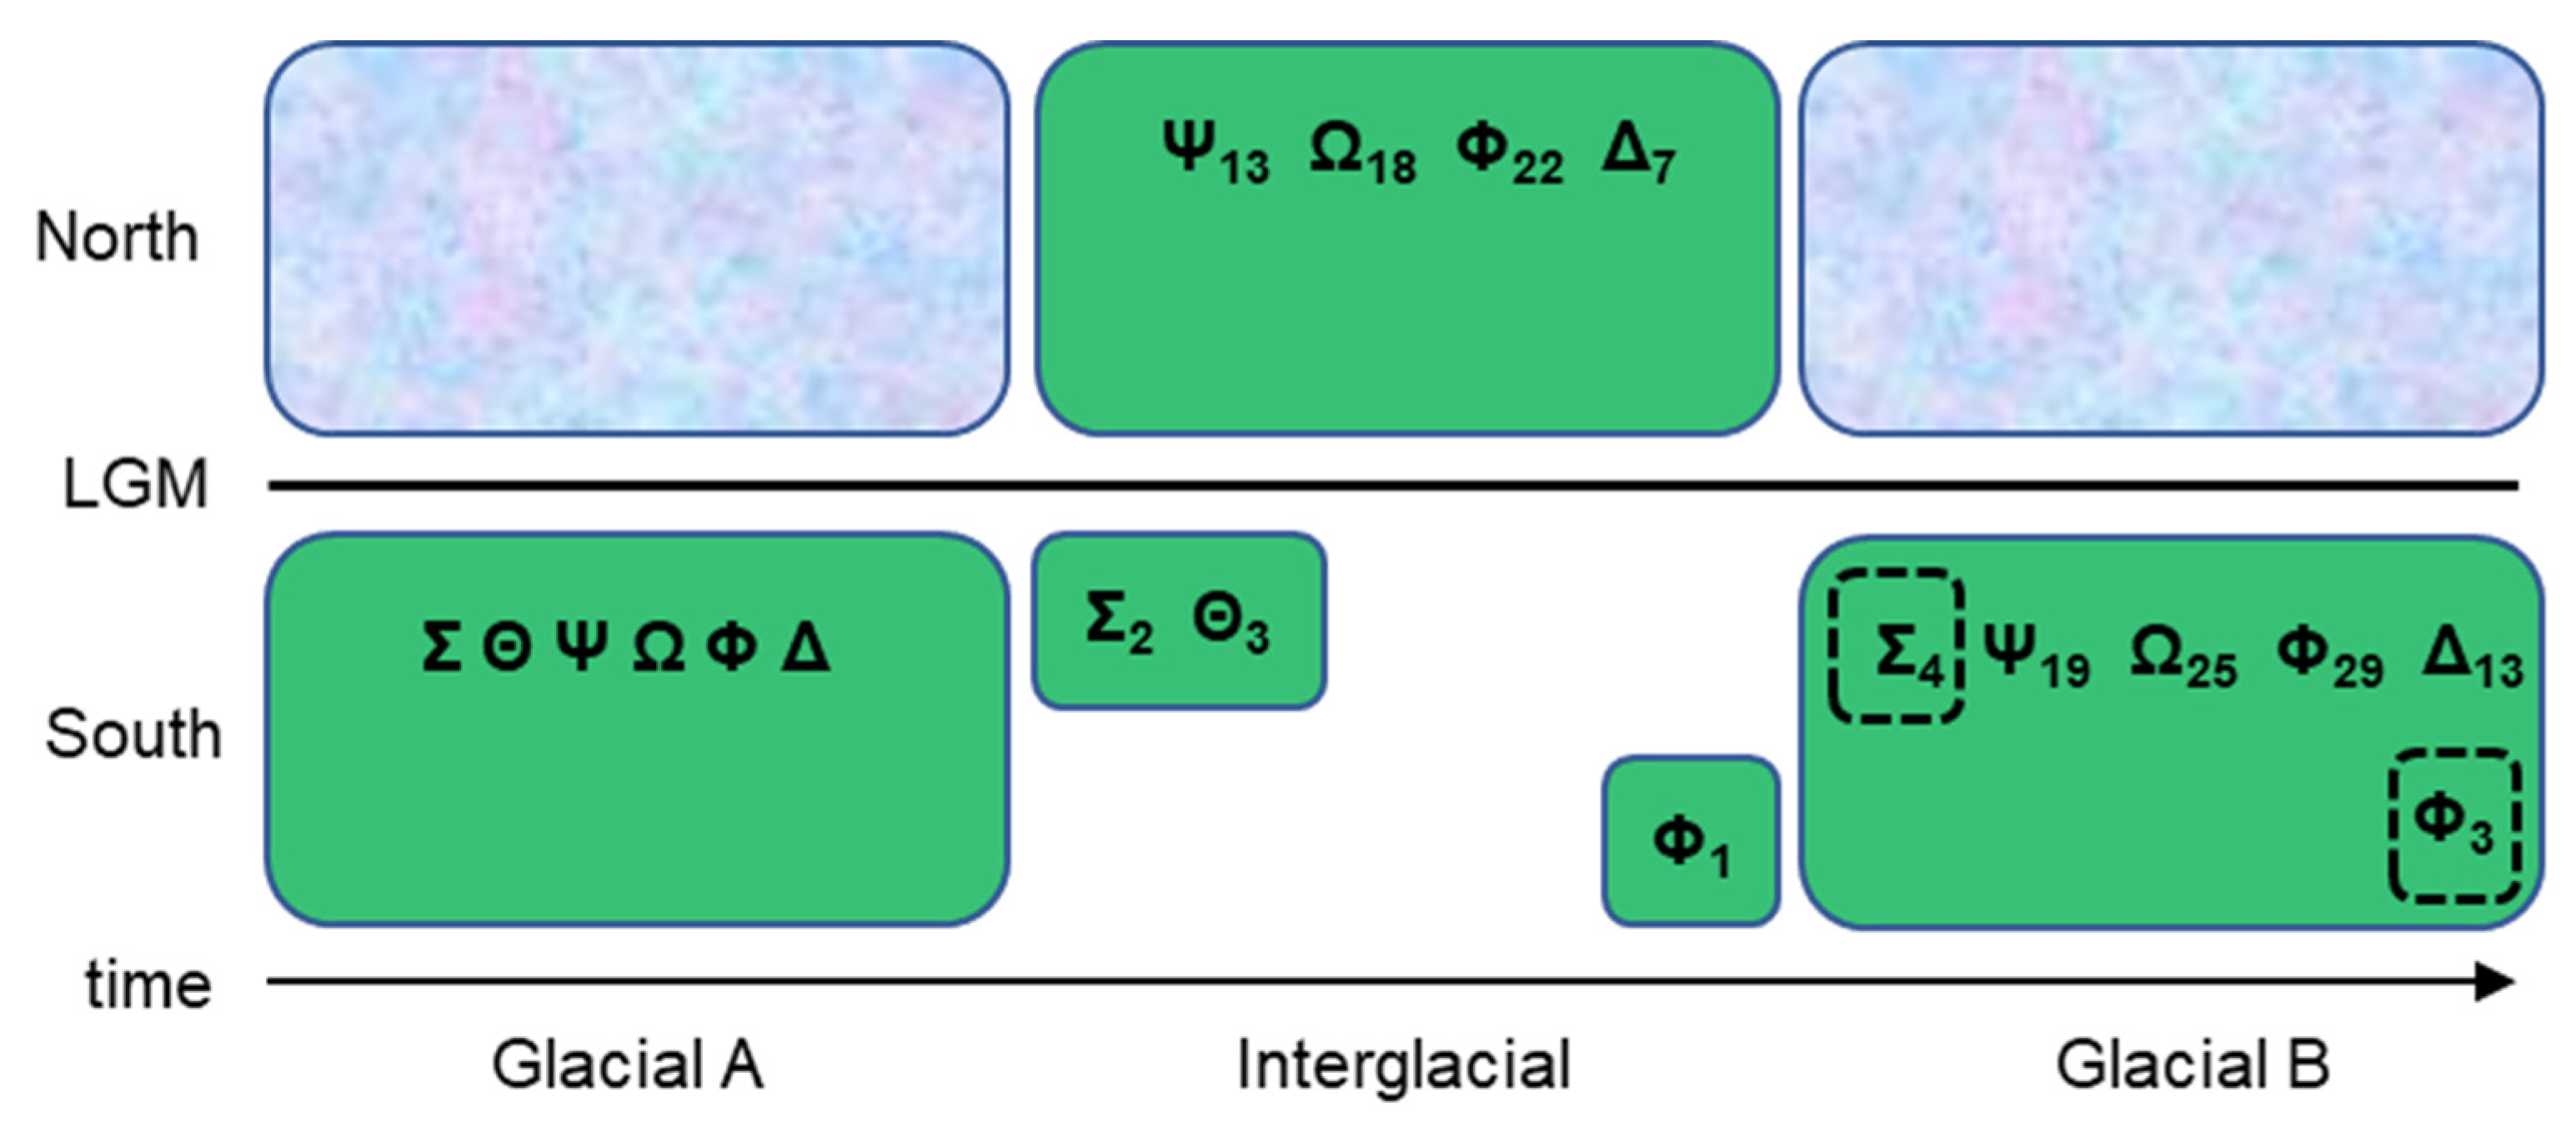
The occurrence of hybridization (both natural and man-made) is well known across Populus [2], where such events have occurred so regularly that signals of divergence in molecular datasets can sometimes be difficult to detect [21,22,23]. Strongly discordant patterns between nuclear genomic and plastomic phylogenies have led some researchers to conclude that the capture and retention of plastomes from now extinct lineages (ghost lineages [24]) with repeatedly admixed nuclear lineages may be the source of such phylogenetic discordance [25]. The inferred extreme age of some aspen clones [26] may be part of such a scenario, wherein long-isolated relictual stands retain ancient alleles (or plastomes) that go extinct in populations rapidly migrating northward during interglacial periods and are transferred back into southward-migrating lineages through the reestablishment of contact during glacial periods (Figure 2). In this scenario, the extinction of certain haplotypes is the result of migration-associated bottlenecks, drift, and selection, while the birth rate of new haplotypes increases with larger effective population sizes expected in the newly established northern post-glacial areas such that numerous mutations separate relict and derived haplotypes [27]. After transfers of “paleoplastomes”, repeated backcrossing among the more abundant non-relict genotypes obscures the signal of relict lineages in the nuclear genome while it is retained in the plastome [28]. The obscuring effect from these backcrosses could also be further accelerated by distortions in nuclear chromosomal segregation, which has been previously noted in Populus crosses [29]. Naturally occurring admixture between some divergent North American Populus lineages is thought to provide a selective advantage in areas of sympatry [30], yet how plastomes are sorted during these lineage reticulations has not been thoroughly examined, and neither has the impact on local adaptation from changes in plastome haplotype frequency.

Figure 2.
A diagram of glacial–interglacial migration of P. tremuloides. At “Glacial A”, the Greek letters represent the different plastid haplotypes occurring across the species range with northward expansion blocked by continental glaciers. During the interglacial period, the species range shifts as individuals begin to inhabit open niches previously covered by glaciers while some individuals remain in the former range where suitable conditions persist. The interglacial period was also one of the most likely times when intercontinental dispersal could have occurred. Subscripts refer to the number of mutations acquired in a given haplotypic lineage through time; the greater number of mutations in the interglacial northern part of the range is a result of larger population sizes, and the inverse is true for southern relictual stands. At “Glacial B”, southward migration takes place because of the expansion of continental glaciers, and relictual haplotypes (in dashed boxes) are introgressed back into the larger, more contiguous population through sexual reproduction. The loss of haplotypic lineages from one glacial period to the next is the result of demographic bottlenecks, drift, and/or selection. The present state of the P. tremuloides species range is interglacial.
Given this gap in knowledge regarding aspen plastid diversity, we reanalyzed a nuclear SSR (simple sequence repeat) dataset from two distinct refugial locations [20] with newly generated sequence data from the plastid rpL16 intron to examine whether patterns of genetic divergence are similar between nuclear and plastid datasets. In particular, we examined whether samples from the two refugial locations could be differentiated with plastid data and if any evidence of ghost lineages could be detected when compared with the nuclear data or with plastid data from other species. To this point, the aspen rpL16 dataset was also compared broadly across Populus and with other Salicaceae species to find any evidence of shared alleles across lineages. Given the nature of the rpL16 intron, analysis was carried out using both SNVs (single nucleotide variants) and indels. Additionally, all intronic indels were examined across a broad group of Populus lineages and Salicaceae outgroups to better understand the evolution of indels and improve inferences for this type of molecular marker. While rpL16 has been historically employed in phylogenetic studies at the species level and above [31], it has not been employed to study genetic diversity at the population level in North American aspens. The results of this study will help to establish whether nonrecombinant plastid data could be useful for tracing past migrations, screening aspen genetic diversity for conservation, and providing insights into plastomic molecular evolution. Such genetic assessments and knowledge are foundational in the upkeep and improvement of sustainable forests by properly matching genotypes to the environment in reforestation and afforestation projects, as well as avoiding cytoplasmic incompatibility to ensure that seed production will be maintained for future natural migrations.
2. Materials and Methods
2.1. Sample Collection, DNA Extraction, and SSR Genotyping
A detailed explanation of sample collection and processing can be found in Tembrock et al. [20], but both are summarized here for convenience. Trees from isolated aspen stands at Bighorn Canyon National Recreation Area, Montana, USA, and JE Canyon Ranch, Colorado, USA, were identified for study based on their abnormal persistence outside the expected habitat for aspen and were presumed to be of relictual origin on this basis. The Big Bend National Park samples analyzed by Tembrock et al. [20] were not sequenced for this study because DNA was not available during the preparation of this publication. Samples were also taken from the closest large prototypical montane aspen stands to assess the genetic origins of the isolated stands (Figure 1). For the Bighorn stand, this consisted of collections from the Pryor Mountains in Montana to the east and the Bighorn Mountains to the southeast in Wyoming, and for the JE Canyon stand in Colorado, the adjacent Spanish Peaks to the west were sampled. Sampled material from each tree consisted of three mature healthy leaves placed in silica gel.
Dried leaf material (about 1/3 of a leaf) was pulverized with a ball mill (Biospec Products, Bartlesville, OK, USA) in 1.5 mL tubes using silica–zircon beads. DNA was extracted from pulverized tissue using a Qiagen (Hilden, Germany) DNeasy Plant Mini Kit following the manufacturer’s instructions, except for the final elution step, where volume was reduced from 100 µL to 50 µL. DNA samples were diluted to approximately 5.5 ng/µL, and 12 SSR loci were amplified, including 7 described in Callahan et al. [14] (W14, W15, W17, W20, P86, P10, and P71). The 10 µL reactions contained 2× MyTaq HS Master Mix (BioLine, Memphis, TN, USA), 0.5 mM of MgCl2, 0.3 µM of forward and reverse primers, and approximately 15 ng of DNA. Thermocycling conditions were 95 °C for 3 min followed by 35 cycles of 95 °C for 30 s, a locus-specific annealing temperature (50 °C, 54 °C, 57 °C, or 60 °C) for 40 s, 72 °C for 50 s, and a final extension of 72 °C for 10 min. All loci were amplified separately, with the exception of W20/P14 and P86/P71, and then pooled prior to fragment analysis into 4 multiplex groups. Fragments were scored using GeneMarker v2.6.7 (SoftGenetics, LLC., State College, PA, USA), and allele sizes were adjusted and binned to match allele sizes from Callahan et al. [14] based on a subset of replicated samples from that study.
2.2. Sequencing Plastid rpL16
Using the above DNA extractions, rpL16 introns (and portions of the exons where the primers bind) were amplified via PCR using the primers described by Shaw et al. [31] with a single nucleotide modification (C>T at the third nucleotide from 5′) made to the reverse primer based on alignments of rpL16 from across Populus to improve specificity. Each 50 μL amplification reaction included 32.75 μL of molecular grade H2O, 5.00 μL of 10× Ex TAQ buffer, 4.00 μL of dNTP mixture at 2.5 mM, 1.00 μL of 10 μM rpL16F71 forward primer, 1.00 μL of 10 μM rpL16R1516 reverse primer, 0.25 μL of TaKaRa Ex Taq HS polymerase (Takara Bio Inc., Shiga, Japan) at 5 U/μL, and 1 μL of DNA template. Thermocycling conditions were 95 °C for 3 min followed by 35 cycles of 95 °C for 1 min, 50 °C for 1 min, and 72 °C for 2 min, followed by a final extension at 72 °C for 5 min. Positive PCRs were confirmed on 1% agarose gels containing Ethidium Bromide and imaged with a UV light source (Analytik Jena, LLC., Jena, Germany). Reactions that produced visible bands were purified using a Qiagen QIAquick PCR purification kit following the manufacturer’s instructions (Qiagen Inc., Hilden, Germany). Purified PCR products were sent for sequencing to the University of Chicago Comprehensive Cancer Center DNA Sequencing Facility, where amplicons were sequenced on an Applied Biosystems 3730XL DNA sequencer (Applied Biosystems, Foster City, CA, USA) using the same rpL16 primers as in the amplification reactions. Sanger electropherograms from both forward and reverse sequences were contiged after manually trimming poor-quality base calls from the 5′ and 3′ ends of the sequences. The trimmed sequences were contiged and converted into consensus sequences in GeneiousPrime 2021.0.3 (https://www.geneious.com) and used in all subsequent analyses. Sequences that could not be contiged because of poor read quality were excluded from further analyses. All rpL16 sequences generated in this study are available in GenBank under accession numbers PP176177-PP176208.
2.3. Comparison of Datasets and Data Types Using Tree-Based Comparisons
Trimmed, contiged rpL16 intron sequences were aligned using MAFFT v7.308 [32,33]. After alignment, repeat unit boundaries associated with indels were manually adjusted to ensure they were properly aligned based on the recognition of adjacent repeat motifs. Since all repeat units were one, two, or three (rare) units in length and only varied by the loss or gain of a single unit relative to all other sequences, these motifs were coded as 0,1 characters. The SSRs from Tembrock et al. [20] were identified by differences in repeat numbers and recorded in total length. The only other molecular characters were SNVs, and they were identified in the consensus sequence after alignment. Monomorphic nucleotides were masked before analyses. Two comparisons were made between different sample sets and data types using an unweighted neighbor-joining (NJ) method, as implemented in DARwin v6.0.021 [34,35] in all cases. The first comparison was between 12 SSR loci from 28 samples analyzed by Tembrock et al. [20] and 6 rpL16 intron SNVs from the same 28 samples. The next comparison was made between rpL16 intronic SNVs and 0,1-coded indels for 9 species and a total of 52 samples (including all samples from the first comparison plus 4 triploid aspen individuals). This second comparative dataset included closely related Populus rpL16 sequences downloaded from GenBank, aligned, and adjusted as above. For each data type, dissimilarity matrices were calculated using algorithms optimized for each data type. The SSR matrix was calculated via the DARwin matching algorithm, the 0,1 matrix with Dice’s similarity coefficient [36], and the SNV matrices with a simple matching calculation used in DARwin given that all SNV loci were represented by only two nucleotides. From the different matrices, unweighted NJ trees were used in all cases to resolve relationships between individuals and species, with 1000 bootstrap (BS) replicates used to assess branch support. Because of evidence of incomplete lineage sorting (a pattern consistent with ghost lineages) found in direct tandem repeat TTTAGATAATG, it was examined in greater depth across Salicaceae (see sections below).
2.4. Intronic Indel Comparisons
To better understand intronic indel evolution on a broader scale in Salicaceae, several comparative analyses were conducted. First, 250 complete rpL16 sequences from across Salicaceae (using P. tremuloides as a query) were downloaded from GenBank and aligned (using MAFFT, as above), with incomplete or mislabeled sequences removed (Supplementary File S1). From the alignment, an unrooted NJ tree using a Tamura–Nei genetic distance model [37] was resolved, with 1000 jackknife (JK) replicates used to assess branch support. Clear examples of indels formed from tandem duplication were graphically depicted by the number of repeats at each indel (one or two in all cases but one) for each individual across the tree, as were any SNVs detected in the tandem duplicates. All genes with introns in the plastome large single copy (LSC) region were compared across ~250 individuals in Salicaceae using MAFFT alignments as above. In each intron, indels (longer than 2bp) formed from tandem duplication (omitting homopolymer indels and SSR indels) were counted across the alignment and regressed on genomic position from the end of Inverted Repeat A (IRa) and to the closest IR, as in Robbins and Kelly [38]. Intronic indel counts per gene were also regressed on average transcript abundance for that gene using transcripts per million (TPM) values from Forsythe et al. [39]. A linear regression line was fitted to each set of points and R2 values calculated.
3. Results
3.1. Intraspecific Molecular Evolution of rpL16 in Populus tremuloides
An alignment of P. tremuloides rpL16 intron sequences from two geographically distinct locations in North America and with closely related North American and Eurasian aspen species revealed that both indel and SNV mutations occur in one of two states per locus in nearly every case. At both the population and species levels, transversions are the dominant SNV mutation type, making up 83% of P. tremuloides variants and 87% across the nine different Populus species (Table 1; Supplementary File S1). A species-specific indel (single copy of repeat TTTTAG locus H) and an SNV (C>T) at 706 distinguished P. tremuloides from P. grandidentata and the other Eurasian aspens (Table 1). Within P. tremuloides, several unique polymorphic indels were noted, including three copies of direct repeat GATATT (locus A), and two copies of TTCATTT (locus L). In all instances, the TTCATTT indel cooccurred with SNV C>A at 995. When a single copy of TTTAGATAATG (locus I) was found with a single copy of TTCATTT (present in two samples), it always cooccurred with a unique A>G SNV at 837. These unique indel–SNV combinations were only found in samples from the Northern Bighorn Mountains (WY) and adjacent Pryor Mountains (MT). Some samples from the Spanish Peaks area in Colorado could be differentiated from all other P. tremuloides samples and the other species by a single SNV at 846 (C>T), or 871 (T>C). At 1022, a G separates most Spanish Peak samples from the Bighorn/Pryor samples (except 17160 and the triploid samples 17163 and 17185), but it is shared with all other aspen species. Similarly, a single TTTAGATAATG copy (locus I) can be found in eight Bighorn/Pryor samples and is shared with P. yunnanensis, an Asian species from a sister clade to the aspens (see below for a broad-scale analysis of this and other indels). Indels in the Spanish Peaks samples were invariant relative to each other and thus did not covary with SNVs. The only other North American aspen, P. grandidentata (MW376777), contained three unique SNVs (C>T at 450, G>A at 567, and G>A at 753) and a single insertion (TTAATTATGTATTCTATTTCTAT locus E) that separated it from all other Populus species examined in this study.

Table 1.
Samples and DNA sequence differences employed in this study. Sites (see Figure 1) are divided into north (N), south (S), and collection sites: Pryor (P), Bighorn (B), Spanish Peaks (SP), and JE Canyon (JE). Columns A–M refer to indels (0,1) and numbered columns to SNV loci, variant states are highlighted in green for clarity. Fuchsia highlights indicate transition point mutations. (Haplo)type combines indel and SNV data; * denotes triploid samples.
3.2. Comparisons of SSR, SNV, and Indel Data
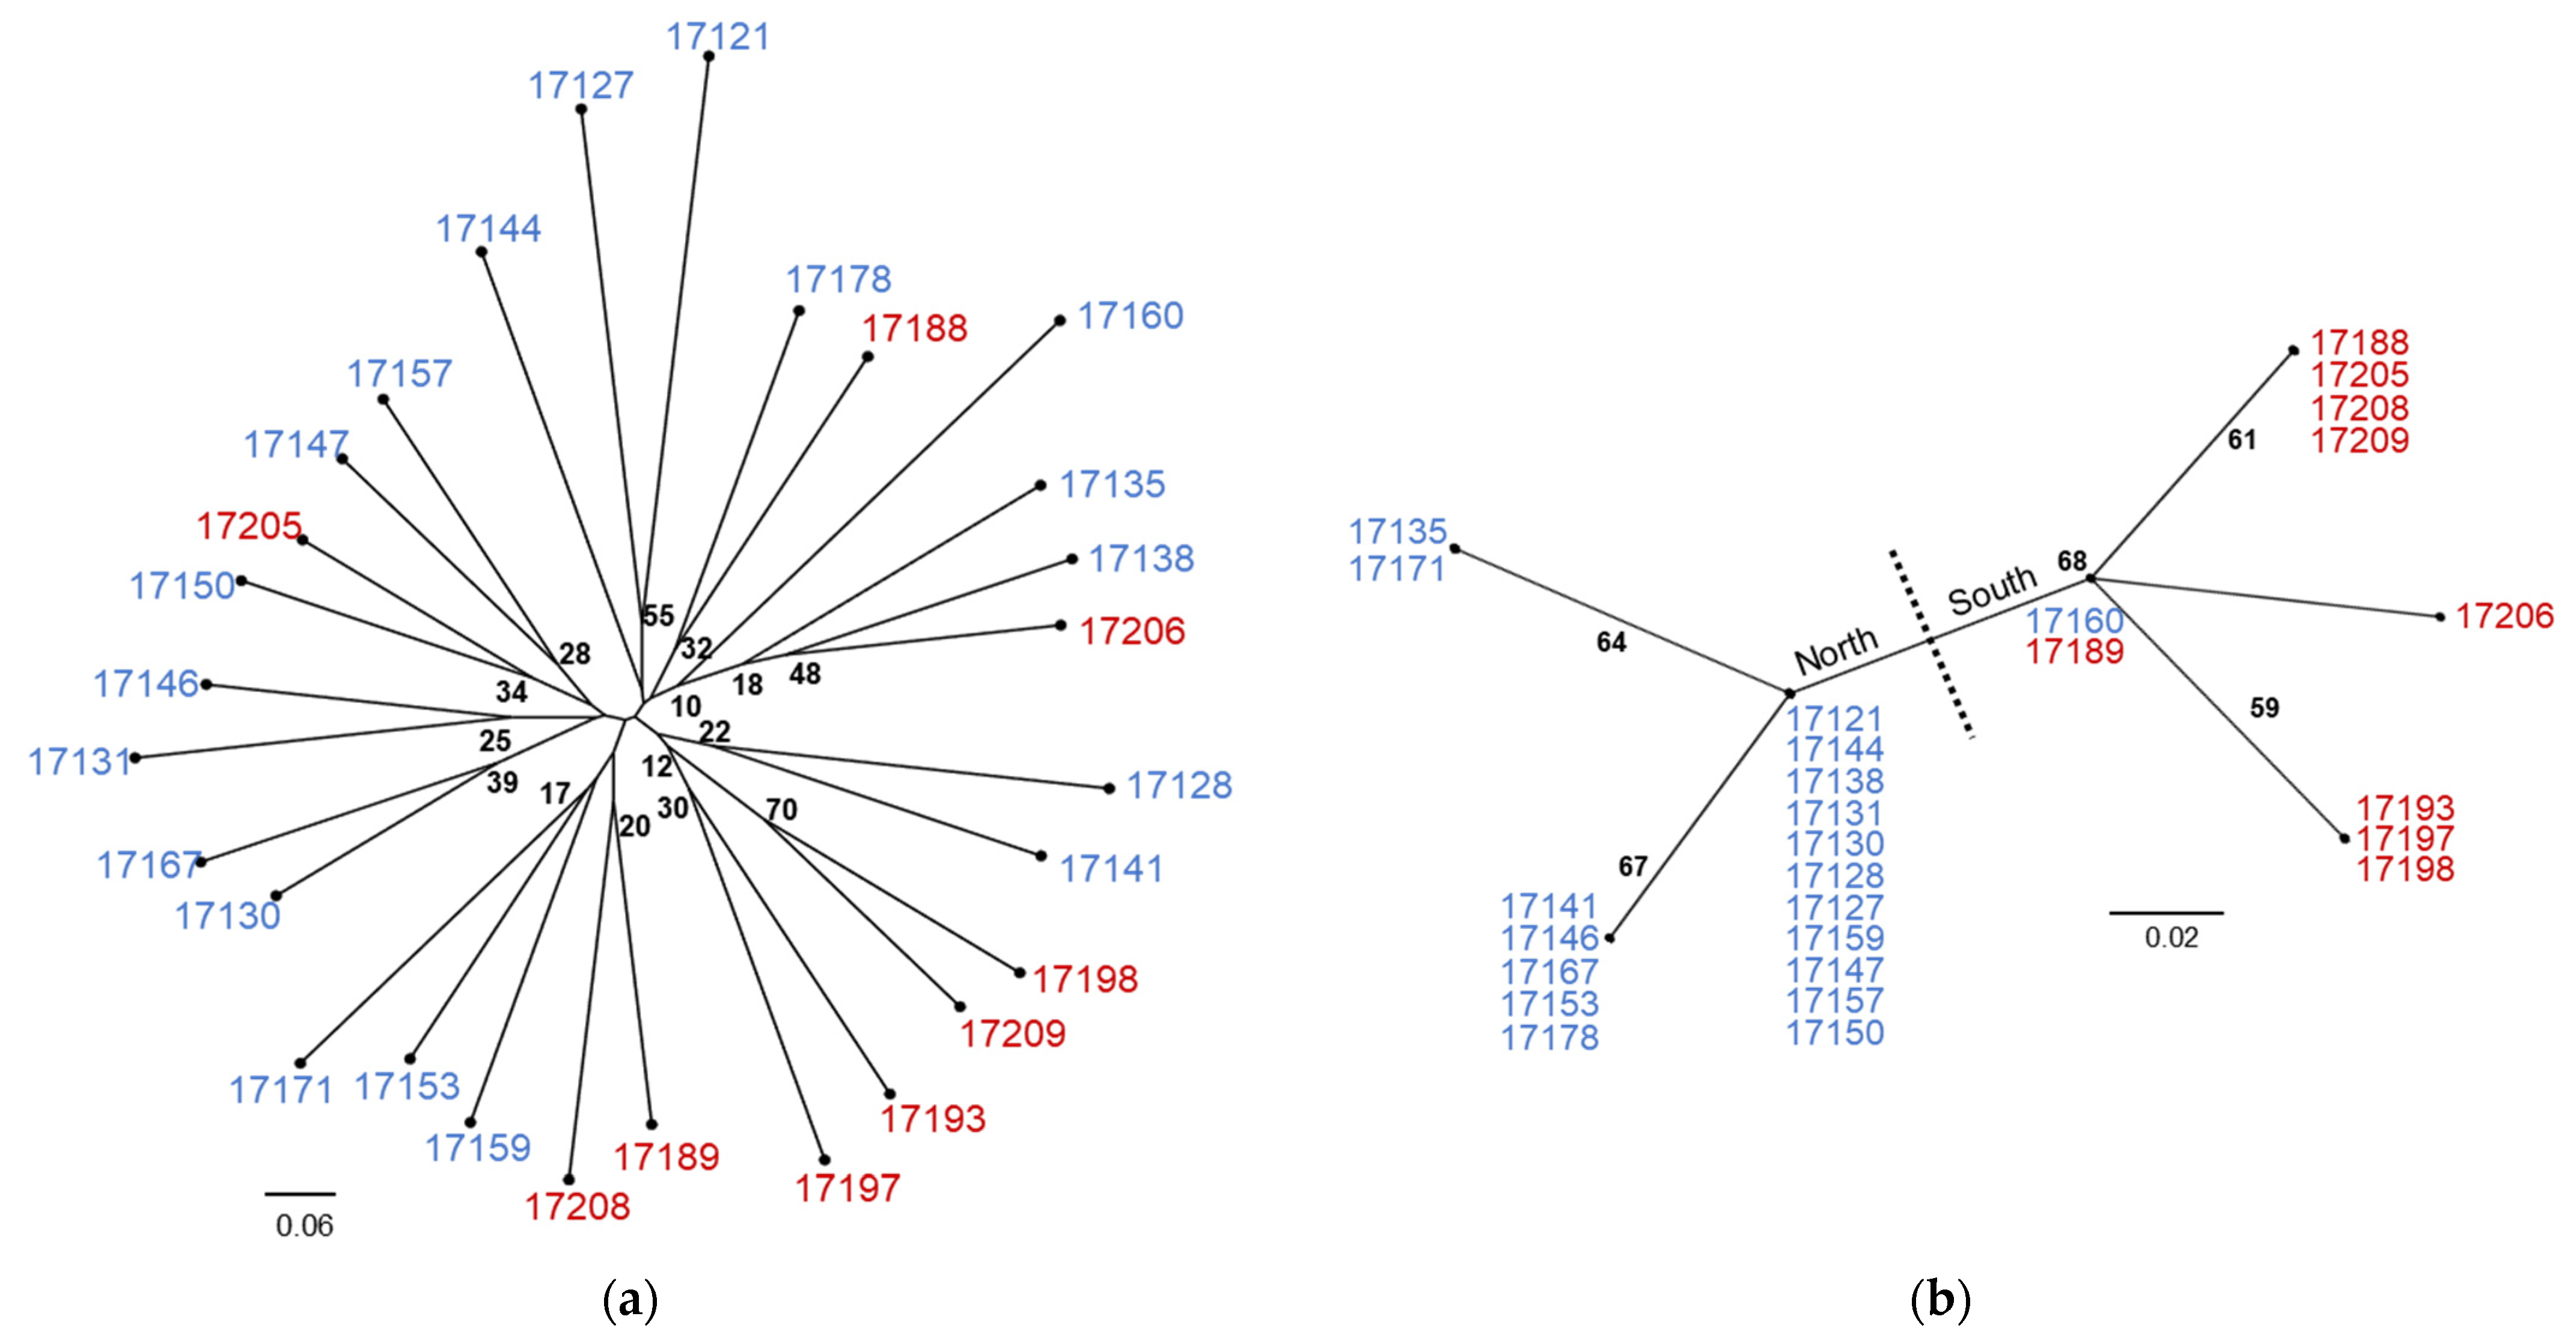
The NJ trees from the comparison between nuclear SSR data and plastid SNV data differ in both topology and BS support (Figure 3). The SSR tree is characterized by long terminal branches between individuals with varying levels of BS support and short internal branches with consistently low levels of BS support (Figure 3a). By contrast, the plastid SNV tree contains internal branches of equal length with consistent levels of moderate BS support (Figure 3b). While numerous individuals share haplotypes in the SNV tree, this is not the result of clonal reproduction as comparison with the SSR tree indicates. At this level of sampling, the SSR tree does not produce a topology that corresponds with geographic collection location whereas the SNV tree is clearly separated into northern and southwestern haplogroups with the exception of 17160 (and the triploid samples 17163 and 17185, not shown on the tree) which shares a haplotype with 17189 (17185 matches to 17196) in the Spanish Peaks. Neighbor-joining tree comparisons with multiple aspen species using 0,1 indel and SNV data types are similar in that they separate P. tremuloides from the other Populus species but differ at several points (Figure 4). The 0,1 indel tree does not completely differentiate the Bighorn/Pryor samples from the Spanish Peak samples but does differentiate three Bighorn/Pryor haplogroups from all other P. tremuloides samples. The group membership differs somewhat between the two trees. For instance, P. tremula (MT482535) and P. nigra (KX377117) are sister in the indel tree, whereas this same P. tremula in the SNV tree is most closely related to P. alba (MW376760). Support values also vary more in the indel tree compared with the SNV tree, which has BS values only varying between 63 and 66.
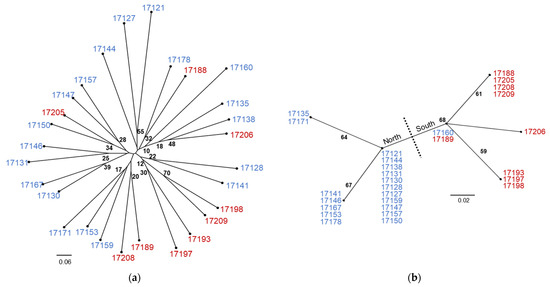
Figure 3.
Unrooted NJ trees resolved from (a) 12 SSR loci for 28 diploid P. tremuloides individuals from two geographic locations and (b) the same individuals resolved using SNVs from the plastid rpL16 gene. Individuals 17121–17178 (in blue) were collected from the Bighorn/Pryor Mountain area, and samples 17188–17209 (in red) were collected from the Spanish Peaks area (see Figure 1). Bootstrap support values of 10 or above are shown to indicate clade support.
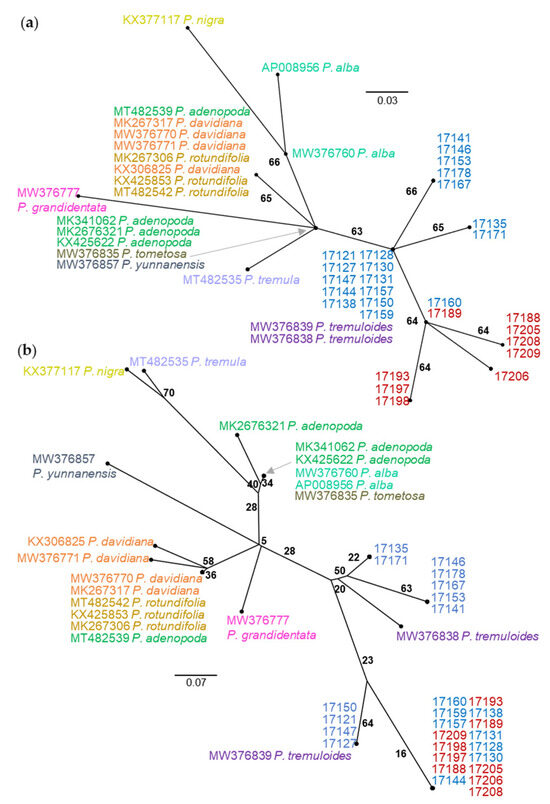
Figure 4.
Unrooted NJ trees resolved from (a) SNVs from the plastid rpL16 gene for 31 P. tremuloides individuals and 18 total samples from nine additional species (color coded by species) and (b) the same individuals resolved using indels from the plastid rpL16 gene. Individuals 17121–17178 (in blue) were collected from the Bighorn/Pryor Mountain area, and samples 17188–17209 (in red) were collected from the Spanish Peaks area (see Figure 1). Bootstrap support values are shown to indicate clade support.
3.3. rpL16 Indel Sorting across Salicaceae
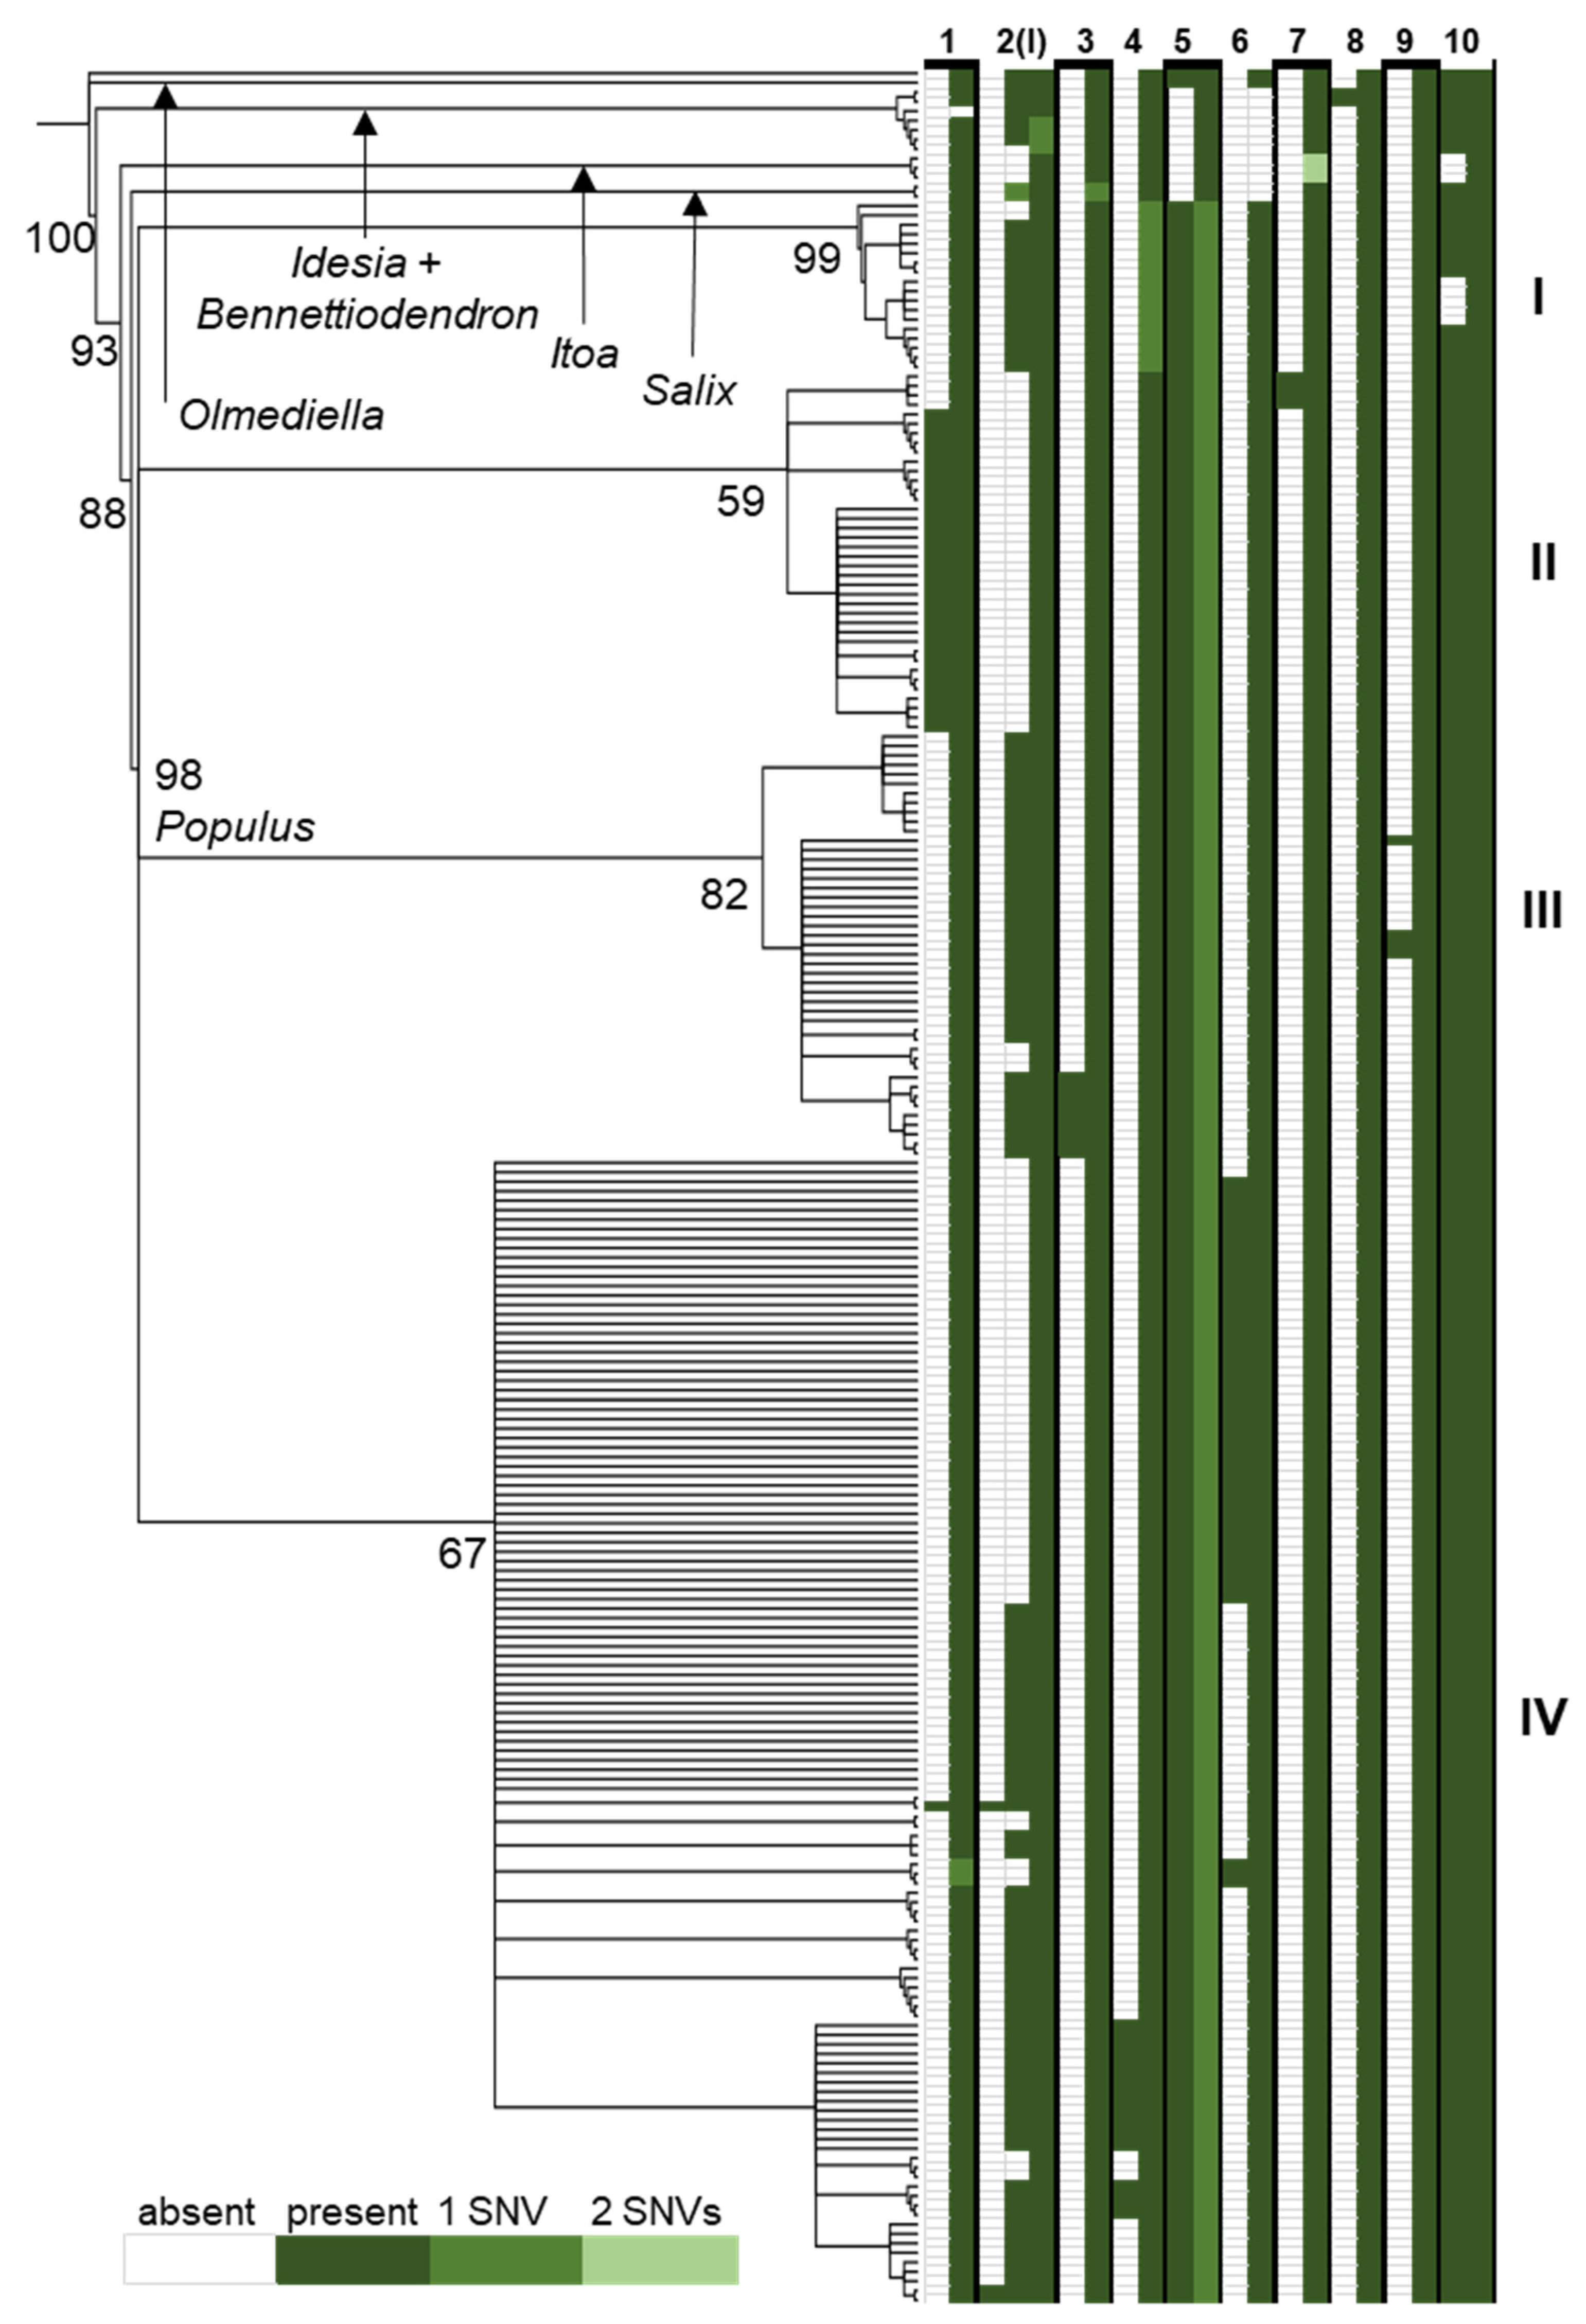
In the comparison across the Salicaceae of the rpL16 intron, some indels were sorted into individuals and clades incongruent with the resolution of lineages based on SNVs (Figure 5). For instance, the tandem copies at indel 2 in Figure 5 (locus I in Table 1) were present in two copies in outgroups such as Olmediella, Idesia, and Salix but found in a single copy in Itoa and one individual of Bennettiodendron leprosipes (all other Bennettiodendron contained two copies). Within Populus, the direct repeat at indel 2 occurs in one; two; or, rarely, three copies (in one P. grandidentata and two P. tremula individuals) across lineages except for clade II, where it is found in a single copy. Another such case of incongruence is in indel 10, where the number of tandem copies is two in nearly all individuals except the three Itoa individuals sampled and a clade containing all P. pruinosa samples. Examples of indel and SNV congruence can also be found. In indel 3, all samples in the tree contain a single tandem repeat copy, except a subclade of clade III, where two copies are present. Indel 7 is similarly congruent, with two tandem copies only found in a subclade of clade II. Additionally, repeats that were detected in our population-level comparison were not found in the broader whole-gene Salicaceae comparison, such as repeat TTCATTT at locus L, which was only present in two copies for three individuals in the Pryor Mountains and three individuals in the Spanish Peaks.

Figure 5.
A neighbor-joining tree resolved from SNVs in the alignment of complete rpL16 genes. Values at nodes indicate JK support from 1000 replicates. To the right of the tree is a diagram of the presence (green box) or absence (white box) of 10 indel loci in each individual resulting from tandem duplication with SNVs (relative to the most frequent motif) in the repeat motif noted by color. Roman numerals indicate major clades within Populus, P. tremuloides resolves in clade IV.
3.4. Intronic Indel Abundance in Salicaceae Plastomes
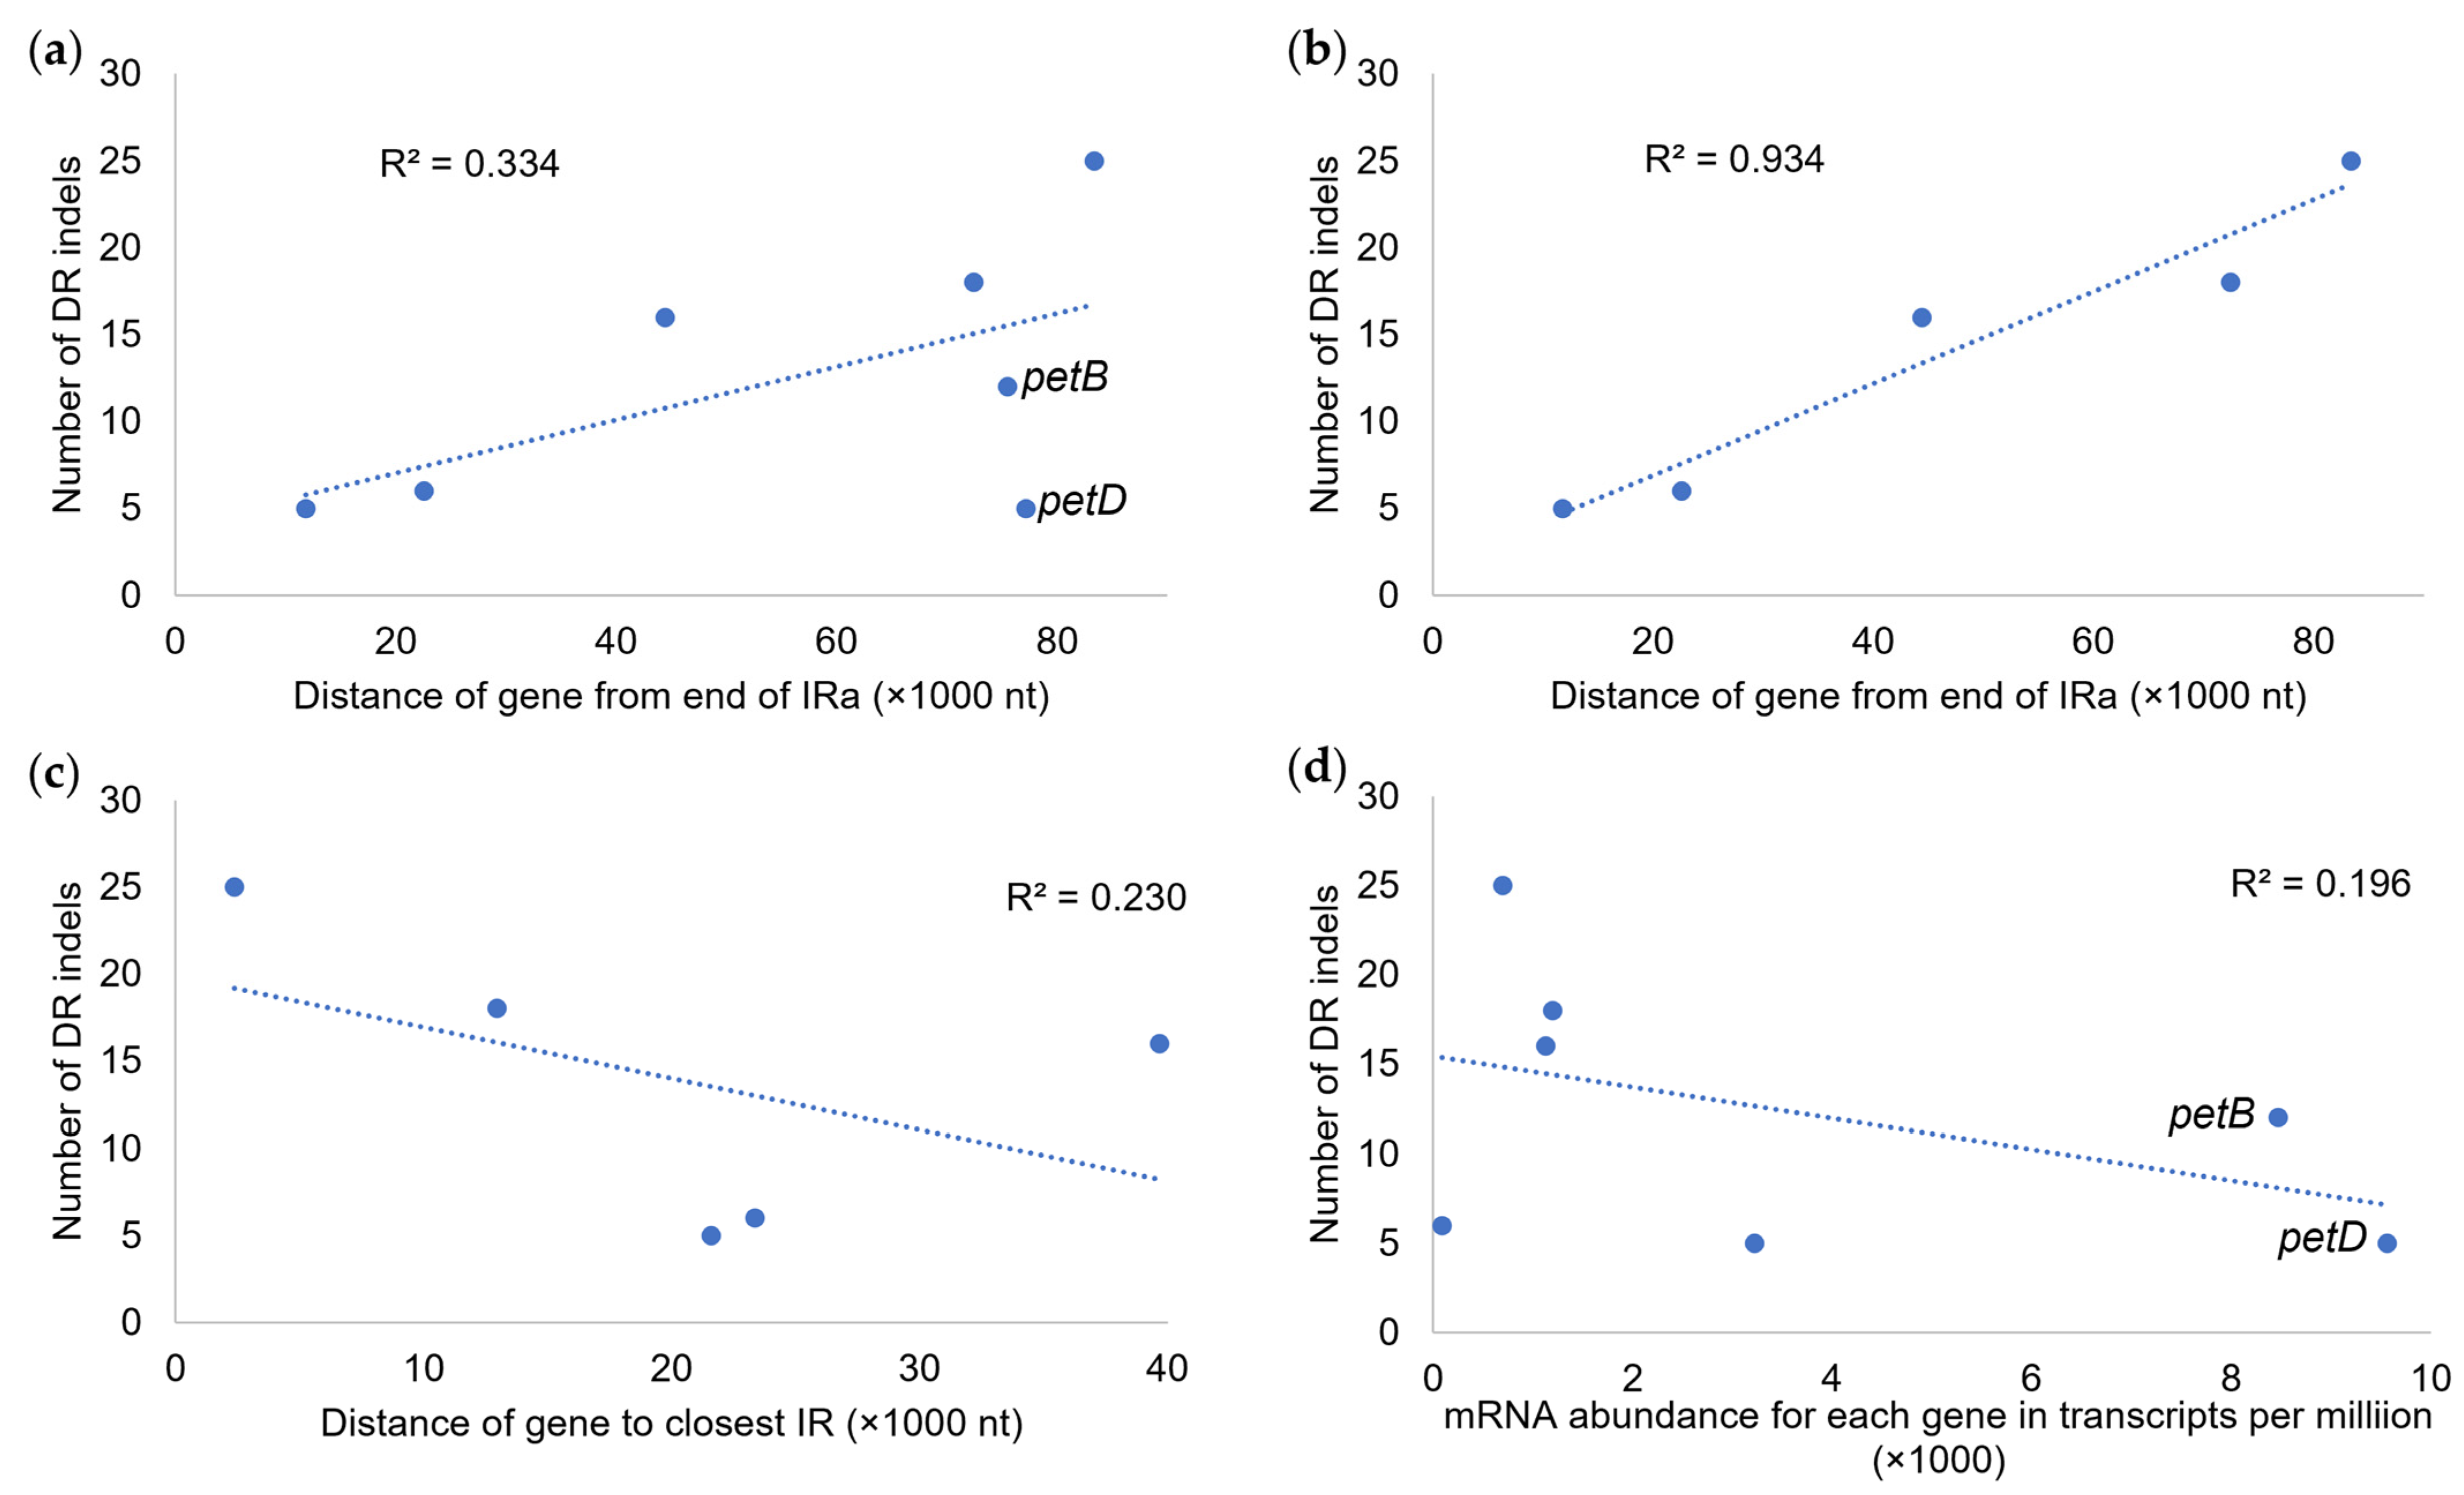
When comparing indel numbers in gene introns to genomic positions and transcript abundance, several patterns were noted (Figure 6). When measuring gene distance from the end of IRa, a weak positive correlation with indel number (R2 = 0.334) was found, and after removing outlier genes petB and petD, the positive correlation increased (R2 = 0.934). When using the method of Robbins and Kelly (2023) [38] to measure gene position to the nearest IR, a weak negative correlation (R2 = 0.230) to indel number was detected, and when including petB and petD, the correlation was further reduced (R2 = 0.044, not shown). When comparing the indel number to the average transcript abundance, a weak negative correlation (R2 = 0.196) was found. Here too, the inclusion of petB and petD strongly skewed the results, as the omission of these genes changed the correlation to weakly positive (R2 = 0.315, not shown).
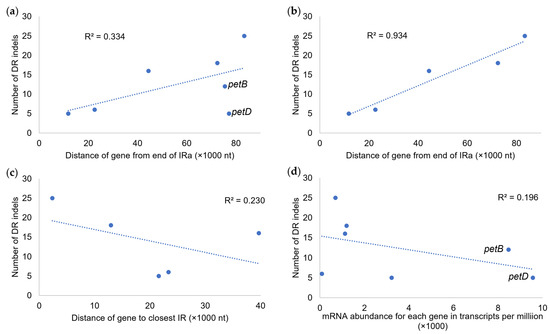
Figure 6.
Regression of indel number per gene intron on plastomic location and transcript abundance. (a) Regression of intronic indel number per LSC gene on gene distance from the end of IRa with petB and petD included. (b) Regression of intronic indel number per LSC gene on gene distance from the end of IRa with petB and petD excluded. (c) Regression of intronic indel number per LSC gene on gene distance from the nearest IR with petB and petD excluded. (d) Regression of intronic indel number per LSC gene on average transcript abundance for each gene (in transcripts per million) with petB and petD included.
4. Discussion
Genetic markers from organellar genomes have long been utilized in phylogeographic studies given that they are nonrecombinant and uniparentally inherited, simplifying estimates of divergence and reconstructions of migration history (e.g., [40,41,42]). Several different studies of Populus have shown that plastid loci can provide robust signals in identifying the movement of maternal lineages from the population to the genus level but can be widely discordant from nuclear markers because of admixture and differences in biogeographic history, as well as asymmetry in reproductive crosses [23,25,43,44]. By reanalyzing a subset of samples from Tembrock et al. [20], we found that most individuals could be delineated into northern and southwestern haplogroups based on several SNV and indel loci in the rpL16 intron (Figure 3). Resolving northern and southwestern lineages using nuclear SSR markers required nine loci and a large, continent-wide reference set of hundreds of samples from the original Tembrock et al. [20] publication. With this large SSR sample set, the origin of the relictual stands of interest could only be made to a general grouping. Using SNVs from the rpL16 intron, an exact match of haplotypes connected the relict stand in JE Canyon (CO) with a mother population 100 km to the west in the Spanish Peaks (Table 1). Similarly, a connection between the Dryhead relict stand (samples 17121 and 17127) and stands in the Bighorn and Pryor Mountains could be made through exact SNV haplotype matches. In the case of the relictual Dryhead stand (in an arid lowland valley between the Bighorn and Pryor mountains), the origin could be further specified by matching indel patterns to stands in the Pryor Mountains. Matching the Dryhead and Pryor indel (three copies of GATATT) with the same indel in a GenBank accession (MW376839) from Illinois provides further evidence of a connection between eastern genotypes and the Dryhead genotype proposed by Tembrock et al. [20]. An exact match (both SNVs and indels) between haplotypes in 17160 and 17163 (triploid) collected in the Bighorn Mountains of northern Wyoming and the haplotype in 17189 collected in the Spanish Peaks of Southern Colorado provide evidence of north–south migration, perhaps as part of glacial–interglacial range oscillations (Figure 2). In addition, exact matches between the haplotype in 17185 (triploid) in the Bighorn Mountains and the haplotypes in 17188, 17196 (triploid), 17205, 17208, and 17209 in the Spanish peaks also provide maternal evidence for past north–south migrations. Understanding and integrating genetic and genomic data from past climatic migrations into future planning models (particularly regarding assisted migration) have the potential to improve outcomes in sustainable forest planning, especially among forest trees with large geographic ranges like P. tremuloides.
The rpL16 intron and other plastomic loci provide an excellent opportunity to study molecular evolution in the absence of recurrent recombination. For example, the presence of both SNV and indel loci in a single gene allows for intragene and intergene comparisons (see below) within the plastome and across lineages such that congruence between mutation types can be quantified. Such comparisons can help to improve models of evolution for indels [45,46] by providing a complementary mutation rate based on SNVs for comparison to the rate of indel formation. In the dataset presented here, congruence between SNVs and indels was decoupled in the Spanish Peaks haplotypes but congruent in the Bighorn/Pryor haplotypes. Previous studies have shown that SNVs occur at higher rates closer to indels, but few studies have examined this pattern in plastomes [47,48,49] and fewer still (if any) have examined the relationship at the population level in a phylogeographic context. The presence of shared indels between distant lineages, such as a single copy of TTTAGATAATG between Bighorn/Pryor haplotypes and P. yunnanensis, brings about the question as to whether this indel is shared because of homoplasy or common ancestry. Previous inferences of ancient plastome capture (ghost lineages) and multiple intercontinental migrations [23,25], as well evidence that indels can be maintained over relatively long periods of time in Populus genomes [50], certainly support the idea that these indels could be shared because of ancestry. Our comparisons here reached the same conclusion: the formation of indels, in particular, those associated with tandem direct repeats, are rare events that decay slowly after their occurrence.
We expanded our comparative analyses to better understand how plastomic intronic indels have evolved in Populus to improve inferences related to interpreting these markers in reconstructing genealogical history. The formation of an indel where a tandem direct repeat is made has been shown to be the result of a certain type of DNA repair (nonhomologous end joining) [51,52,53]. Given this mechanism of formation, several properties for this motif should be expected. These properties include the following: (1) the detection and quantification of these indels is a function of the size of the comparison (e.g., number of individuals in an alignment), (2) the single copy state is expected to be ancestral given that it predates a repair event, (3) the distribution of this type of indel is expected to be non-random given the impact on proper gene function (shown in [51]), and (4) the decay of these indels/evidence of past DNA repair occurs through multiple processes including SNVs in direct repeats and further indel formation.
The detection of indels in our dataset was closely linked to sampling where we were able to find unique indels at the population level (such as repeat TTCATTT at locus L only in P. tremuloides) and a broader distribution among samples of a given copy number arrangement when sampling was increased (such as a single TTTAGATAATG copy in locus I found in a greater number of individuals and species than in smaller sample sizes of either). The number of individuals sampled also affects how many SNVs can be detected, but the magnitude in these data types is quite different. For example, 764 SNVs were found in our Salicaceae-wide rpL16 comparison compared with only 25 indels with direct repeats in the same dataset. This difference in number, along with the fact that indels are usually coded 0,1, accounts for why SNVs can return higher clade support values here and in other analyses [54]. This difference in abundance between SNVs and indels paired with a uniquely detectable motif (DRs) associated with a certain type of DNA repair indicates that the formation of indels is relatively rare and less prone to homoplasy than SNVs [54], and thus, they are an excellent marker for detecting incomplete lineage/plastome sorting.
Our analyses linked gene location and transcript abundance to indel abundance. When we measured the location of a gene from the end of IRa, the number of indels found in individuals across Salicaceae correlated positively with increasing distance. When the genes petB and petD were removed from the analysis, this correlation sharply increased. Of the genes in this comparison, petB and petD are the only two that are transcribed in a clockwise orientation. When we applied the Robbins and Kelly [38] method for gene distance measurement—which is predicated on distance from the likely origin of replication—to intronic indel abundance, we found a weak negative correlation, much as they did, for synonymous and nonsynonymous nucleotide changes in coding regions. If we apply their rationale for the mutation of nucleotides in coding regions of genes to indels in introns, then we can conclude that fewer repairs are being made further from the origin of replication because there are fewer DNA breaks. The strongly contrasting pattern found when measuring from the end of IRa may have several possible explanations. One possibility is that DNA further from the end of IRa spends more time in a single-stranded arrangement as a result of its position in the replication process [55], making it more susceptible to breakage and, thus, more frequently repaired, resulting in more indels. This might also explain why the strongly functionally constrained genes petB and petD are transcribed from the opposing strand. The abundance of transcripts from petB and petD (Figure 6d) also appears to favor fewer breaks and repair-associated insertions because of possible changes in splicing efficiency and function [56,57]. If indel abundance is indeed a target of natural selection, then it might also be a useful criterion in selecting improved trees for a given environment, but comparative studies are needed.
In this study, the number of differences between P. tremuloides haplotypes is similar or greater in extent than between some Populus species, although more comprehensive sampling is needed to better understand haplotype diversity and abundance across Populus (Figure 4). Such high levels of intraspecific haplotypic diversity may have arisen from a scenario in which all or some of the following conditions existed: (1) the retention of relict haplotypes in long-lived clones passed onto latter generations (lowering extinction rate); (2) long periods of time since divergence from other Populus species, allowing for sufficient time for more haplotypes to evolve; and (3) large population sizes during interglacial periods, which increases the probability that new haplotypes could evolve (Figure 2). Specifically, the stands at Dryhead and JE Canyon, which have been inferred as relictual on the basis of both environmental and genetic evidence, are also consistent with the genetic expectations of relictual populations being genetically divergent [58,59] when comparing haplotypic plastome data from a single locus. A primary goal of this study was to examine molecular differences from a single plastome marker to assess what differences and similarities could be detected between two distant locations to help inform future studies. The presence of shared and divergent haplotypes was found even with this small sample set, suggesting that plastomic data could have great utility in inferring the phylogeographic history of this ecologically important tree species, but larger datasets (including the entire plastome and greater sampling across the species range) are necessary for more completely resolving the maternal genealogy of P. tremuloides.
Recent appraisals of earth system operational thresholds have found that biosphere integrity is among the systems being forced beyond safe operational thresholds, with losses in genetic diversity being one of the main drivers [60]. Given the capacity of P. tremuloides forests to harbor biodiversity, rapidly sequester atmospheric CO2, and improve hydrological cycles over large portions of North America, the preservation of genetic diversity in existing forests and dissemination to future plantings should be prioritized. While mostly inapplicable to studying clonal dynamics, the often-overlooked P. tremuloides plastome should be more widely integrated into studies of phylogeography given the relative simplicity of tracing the maternal lineage and its relation to the inference of past seed migration and establishment. Furthermore, the use of plastome data would improve the study of photosynthetic metabolism [61] and spectral imaging [62] in aspen given the central importance of chloroplasts in these pathways and the production of light-harvesting pigments. Plastome data, in conjunction with nuclear loci, would also be useful in detecting cytoplasmic incompatibilities (or a lack thereof) that are involved in the establishment and maintenance of divergent lineages [63] in P. tremuloides and other Populus species.
5. Conclusions
By reanalyzing a subset of samples from geographically distinct locations on the Wyoming–Montana border and in Southern Colorado [20] with plastome rpL16 intron sequences, evidence of divergence was found between relict stands and past maternal gene flow from shared haplotypes between sites. The determination of the maternal origin of relict stands was also improved over previous methods through the matching of haplotypes in relict stands to stands in nearby mountain ranges. Data from both indels and SNVs were employed in making inferences where both data types differentiated all P. tremuloides from related aspen species in Eurasia, yet some indels in more distantly related species were also found in some P. tremuloides haplotypes. From this pattern of indel sharing across divergent lineages, we inferred incomplete plastome sorting based on the properties of indels formed from DNA repair, such as low levels of homoplasy, the rarity of formation, and the slow and detectable decay of these indels. The presence of abundant indels and SNVs in the aspen plastome provides a rich nonrecombinant dataset for studying molecular evolution, and the large species range and dramatic oscillations associated with glaciation provide an excellent demographic setting in which to study this evolution. To this point, we examined the abundance of intronic indels across Salicaceae as a function of different plastomic characteristics and found that the relative position from the end of IRa and the direction and abundance of transcription were the best predictors of intronic indel number. A key aspect to planning sustainable aspen forests is the generation and analysis of genetic and genomic data to optimize genotype-to-environment correspondence and ensure compatible mating pairs such that natural propagation via seeds can occur in the future. The present study provides data and analyses for such future work to help guide experiments for the improvement of sustainable forestry practices.
Supplementary Materials
The following supporting information can be downloaded at https://www.mdpi.com/article/10.3390/su16030949/s1: Supplementary File S1: All sequence alignments used in this study.
Author Contributions
L.R.T. collected samples; L.R.T. conceived and designed the research; L.R.T. generated and analyzed the data; F.A.Z., C.G. and Z.W. provided guidance on analytical approaches for the study of plastomic data; L.R.T., F.A.Z., G.Z., A.S., C.G. and Z.W. wrote and edited the manuscript. All authors have read and agreed to the published version of the manuscript.
Funding
This research received no external funding.
Institutional Review Board Statement
Not applicable.
Informed Consent Statement
Not applicable.
Data Availability Statement
All sequence data generated for this study are publicly available in GenBank under accessions PP176177-PP176208.
Acknowledgments
Thanks to Tammy Cook, Karl Brown, and Bill Pickett of the US National Park Service for helping coordinate access to the Bighorn National Recreation Area and facilitating the initial grant that funded the SSR work. Thanks to Joe Stevens of the Colorado Natural Heritage Program for his work in documenting the Dryhead stand, as well as his help in acquiring funding for the initial study and assistance with many aspects thereafter. Thanks to James Walton at Utah State University for generating SSR genotypes and William Buikema at the University of Chicago for generating Sanger sequence data. Thanks to the owner of the JE Canyon Ranch, the hardworking ranchers, and the Nature Conservancy for allowing access to and preserving relict aspen stands in SE Colorado. Thanks to Todd Gilligan of USDA-APHIS-PPQ-S&T for allowing access to laboratory equipment to conduct this study. Special thanks to the Galloway family of Wyoming for their logistical support while working in the Bighorn Mountains.
Conflicts of Interest
The authors declare no conflicts of interest.
References
- Little, E.L., Jr. Atlas of United States Trees Volume 1: Conifers and Important Hardwoods; USDA Forest Service: Washington, DC, USA, 1971. [Google Scholar]
- Eckenwalder, J.E. Systematics and evolution of Populus. In Biology of Populus and Its Implications for Management and Conservation; Stettler, R.F., Bradshaw, H.D., Jr., Heilman, P.E., Hinckley, T.M., Eds.; NRC Research Press, Nation Research Council of Canada: Ottawa, ON, Canada, 1996; pp. 7–32. [Google Scholar]
- Mark, A.; Rumble, L.D.F.; Mills, T.R.; Dykstra, B.L. Do Pine Trees in Aspen Stands Increase Bird Diversity? USDA Forest Service Rocky Mountain Research Station: Fort Collins, CO, USA, 2001; pp. 185–192. [Google Scholar]
- Simonson, S.E.; Opler, P.A.; Stohlgren, T.J.; Chong, G.W. Rapid assessment of butterfly diversity in a montane landscape. Biodivers. Conserv. 2001, 10, 1369–1386. [Google Scholar] [CrossRef]
- Griffis-Kyle, K.L.; Beier, P. Small isolated aspen stands enrich bird communities in southwestern ponderosa pine forests. Biol. Conserv. 2003, 110, 375–385. [Google Scholar] [CrossRef]
- Cole, C.T.; Anderson, J.E.; Lindroth, R.L.; Waller, D.M. Rising concentrations of atmospheric CO2 have increased growth in natural stands of quaking aspen (Populus tremuloides). Glob. Chang. Biol. 2010, 16, 2186–2197. [Google Scholar] [CrossRef]
- Boča, A.; Jacobson, A.R.; Van Miegroet, H. Aspen soils retain more dissolved organic carbon than conifer soils in a sorption experiment. Front. For. Glob. Chang. 2020, 3, 594473. [Google Scholar] [CrossRef]
- DesRochers, A.; Driessche, R.V.D.; Thomas, B.R. Nitrogen fertilization of trembling aspen seedlings grown on soils of different pH. Can. J. For. Res. 2003, 33, 552–560. [Google Scholar] [CrossRef]
- LaMalfa, E.M.; Ryle, R. Differential snowpack accumulation and water dynamics in aspen and conifer communities: Implications for water yield and ecosystem function. Ecosystems 2008, 11, 569–581. [Google Scholar] [CrossRef]
- Fechner, G.H.; Barrows, J.S. Aspen Stands and Wildfire Fuel Breaks; U.S. Department of Agriculture, Forest Service, Rocky Mountain Forest and Range Experiment Station: Washington, DC, USA, 1976. [Google Scholar]
- DeByle, N.B.; Winokur, R.P. Aspen: Ecology and Management in the Western United States; USDA Forest Service General Technical Report RM-119; Rocky Mountain Forest and Range Experiment Station: Fort Collins, CO, USA, 1985; p. 283. [Google Scholar]
- Rogers, P.C.; Pinno, B.D.; Sebesta, J.; Albrectsen, B.R.; Li, G.Q.; Ivanova, N.; Kusbach, A.; Kuuluvainen, T.; Landhausser, S.M.; Liu, H.Y.; et al. A global view of aspen: Conservation science for widespread keystone systems. Glob. Ecol. Conserv. 2020, 21, e00828. [Google Scholar] [CrossRef]
- Gray, L.K.; Gylander, T.; Mbogga, M.S.; Chen, P.Y.; Hamann, A. Assisted migration to address climate change: Recommendations for aspen reforestation in western Canada. Ecol. Appl. 2011, 21, 1591–1603. [Google Scholar] [CrossRef]
- Callahan, C.M.; Rowe, C.A.; Ryel, R.J.; Shaw, J.D.; Madritch, M.D.; Mock, K.E. Continental-scale assessment of genetic diversity and population structure in quaking aspen (Populus tremuloides). J. Biogeog. 2013, 40, 1780–1791. [Google Scholar] [CrossRef]
- Latutrie, M.; Bergeron, Y.; Tremblay, F. Fine-scale assessment of genetic diversity of trembling aspen in northwestern North America. BMC Evol. Biol. 2016, 16, 231. [Google Scholar] [CrossRef]
- Schaal, B.A.; Olsen, K.M. Gene genealogies and population variation in plants. Proc. Natl. Acad. Sci. USA 2000, 97, 7024–7029. [Google Scholar] [CrossRef]
- Pluess, A.R. Pursuing glacier retreat: Genetic structure of a rapidly expanding Larix decidua population. Mol. Ecol. 2011, 20, 473–485. [Google Scholar] [CrossRef]
- Ding, C.; Schreiber, S.G.; Roberts, D.R.; Hamann, A.; Brouard, J.S. Post-glacial biogeography of trembling aspen inferred from habitat models and genetic variance in quantitative traits. Sci. Rep. 2017, 7, 4672. [Google Scholar] [CrossRef]
- Deacon, N.J.; Grossman, J.J.; Schweiger, A.K.; Armour, I.; Cavender-Bares, J. Genetic, morphological, and spectral characterization of relictual Niobrara River hybrid aspens (Populus × smithii). Am. J. Bot. 2017, 104, 1878–1890. [Google Scholar] [CrossRef]
- Tembrock, L.R.; Stevens, J.E.; Schuhmann, A.; Walton, J.A. Genetic Characterization and Comparison of Three Disjunct Populus Temuloides Michx (Salicaceae) Stands Across a Latitudinal Gradient; Natural Resource Report NPS/NRSS/IMD/NRR; National Park Service: Fort Collins, CO, USA, 2020; p. 74. [Google Scholar]
- Wang, D.; Wang, Z.; Kang, X.; Zhang, J. Genetic analysis of admixture and hybrid patterns of Populus hopeiensis and P. tomentosa. Sci. Rep. 2019, 9, 4821. [Google Scholar] [CrossRef]
- Wang, M.; Zhang, L.; Zhang, Z.; Li, M.; Wang, D.; Zhang, X.; Xi, Z.; Keefover-Ring, K.; Smart, L.B.; DiFazio, S.P.; et al. Phylogenomics of the genus Populus reveals extensive interspecific gene flow and balancing selection. New Phytol. 2020, 225, 1370–1382. [Google Scholar] [CrossRef]
- Wang, Y.; Huang, J.; Li, E.; Xu, S.; Zhan, Z.; Zhang, X.; Yang, Z.; Guo, F.; Liu, K.; Liu, D.; et al. Phylogenomics and biogeography of Populus based on comprehensive sampling reveal deep-level relationships and multiple intercontinental dispersals. Front. Plant Sci. 2022, 13, 813177. [Google Scholar] [CrossRef]
- Norell, M.A. Tree-based approaches to understanding history: Comments on ranks, rules, and the quality of the fossil record. Am. J. Sci. 1993, 293, 10. [Google Scholar] [CrossRef]
- Huang, D.I.; Hefer, C.A.; Kolosova, N.; Douglas, C.J.; Cronk, Q.C.B. Whole plastome sequencing reveals deep plastid divergence and cytonuclear discordance between closely related balsam poplars, Populus balsamifera and P. trichocarpa (Salicaceae). New Phytol. 2014, 204, 693–703. [Google Scholar] [CrossRef]
- Barnes, B.V. Phenotypic variation of trembling aspen in western North America. For. Sci. 1975, 21, 319–328. [Google Scholar]
- Elena, S.F.; Wilke, C.O.; Ofria, C.; Lenski, R.E. Effects of population size and mutation rate on the evolution of mutational robustness. Evolution 2007, 61, 666–674. [Google Scholar] [CrossRef]
- Thompson, S.L.; Lamothe, M.; Meirmans, P.G.; Perinet, P.; Isabel, N. Repeated unidirectional introgression towards Populus balsamifera in contact zones of exotic and native poplars. Mol. Ecol. 2010, 19, 132–145. [Google Scholar] [CrossRef]
- Macaya-Sanz, D.; Suter, L.; Joseph, J.; Barbara, T.; Alba, N.; Gonzalez-Martinez, S.C.; Widmer, A.; Lexer, C. Genetic analysis of post-mating reproductive barriers in hybridizing European Populus species. Heredity 2011, 107, 478–486. [Google Scholar] [CrossRef]
- Chhatre, V.E.; Evans, L.M.; DiFazio, S.P.; Keller, S.R. Adaptive introgression and maintenance of a trispecies hybrid complex in range-edge populations of Populus. Mol. Ecol. 2018, 27, 4820–4838. [Google Scholar] [CrossRef]
- Shaw, J.; Lickey, E.B.; Beck, J.T.; Farmer, S.B.; Liu, W.; Miller, J.; Siripun, K.C.; Winder, C.T.; Schilling, E.E.; Small, R.L. The tortoise and the hare II: Relative utility of 21 noncoding chloroplast DNA sequences for phylogenetic analysis. Am. J. Bot. 2005, 92, 142–166. [Google Scholar] [CrossRef]
- Katoh, K.; Misawa, K.; Kuma, K.; Miyata, T. MAFFT: A novel method for rapid multiple sequence alignment based on fast Fourier transform. Nucleic Acids Res. 2002, 30, 3059–3066. [Google Scholar] [CrossRef]
- Katoh, K.; Standley, D.M. MAFFT multiple sequence alignment software version 7: Improvements in performance and usability. Mol. Biol. Evol. 2013, 30, 772–780. [Google Scholar] [CrossRef]
- Perrier, X.; Flori, A.; Bonnot, F. Data analysis methods. In Genetic Diversity of Cultivated Topical Plants; Hamon, P., Sguin, M., Perrier, X., Glaszmann, J.C., Eds.; Enfield, Science Publishers: Montpellier, France, 2003; pp. 43–76. [Google Scholar]
- Perrier, X.; Jacquemoud-Collet, J.P. DARwin Software. Available online: https://darwin.cirad.fr/ (accessed on 21 December 2023).
- Dice, L.R. Measures of the amount of ecologic association between species. Ecology 1945, 26, 297–302. [Google Scholar] [CrossRef]
- Tamura, K.; Nei, M. Estimation of the number of nucleotide substitutions in the control region of mitochondrial DNA in humans and chimpanzees. Mol. Biol. Evol. 1993, 10, 512–526. [Google Scholar] [CrossRef]
- Robbins, E.H.J.; Kelly, S. The evolutionary constraints on angiosperm chloroplast adaptation. Genome Biol. Evol. 2023, 15, evad101. [Google Scholar] [CrossRef]
- Forsythe, E.S.; Grover, C.E.; Miller, E.R.; Conover, J.L.; Arick, M.A., II; Chavarro, M.C.F.; Leal-Bertioli, S.C.M.; Peterson, D.G.; Sharbrough, J.; Wendel, J.F.; et al. Organellar transcripts dominate the cellular mRNA pool across plants of varying ploidy levels. Proc. Natl. Acad. Sci. USA 2022, 119, e2204187119. [Google Scholar] [CrossRef]
- Avise, J.C.; Arnold, J.; Ball, R.M.; Bermingham, E.; Lamb, T.; Neigel, J.E.; Reeb, C.A.; Saunders, N.C. Intraspecific phylogeography—The mitochondrial-DNA bridge between population-genetics and systematics. An. Rev. Ecol. Systemat. 1987, 18, 489–522. [Google Scholar] [CrossRef]
- Cuenca, A.; Escalante, A.E.; Pinero, D. Long-distance colonization, isolation by distance, and historical demography in a relictual Mexican pinyon pine (Pinus nelsonii Shaw) as revealed by paternally inherited genetic markers (cpSSRs). Mol. Ecol. 2003, 12, 2087–2097. [Google Scholar] [CrossRef]
- He, W.; Chen, C.; Xiang, K.; Wang, J.; Zheng, P.; Tembrock, L.R.; Jin, D.; Wu, Z. The history and diversity of rice domestication as resolved from 1464 complete plastid genomes. Front. Plant Sci. 2021, 12, 781793. [Google Scholar] [CrossRef]
- Wang, Z.S.; Du, S.H.; Dayanandan, S.; Wang, D.S.; Zeng, Y.F.; Zhang, J.G. Phylogeny reconstruction and hybrid analysis of Populus (Salicaceae) based on nucleotide sequences of multiple single-copy nuclear genes and plastid fragments. PLoS ONE 2014, 9, e103645. [Google Scholar] [CrossRef]
- Zhou, J.; Zhang, S.; Wang, J.; Shen, H.; Ai, B.; Gao, W.; Zhang, C.; Fei, Q.; Yuan, D.; Wu, Z.; et al. Chloroplast genomes in Populus (Salicaceae): Comparisons from an intensively sampled genus reveal dynamic patterns of evolution. Sci. Rep. 2021, 11, 9471. [Google Scholar] [CrossRef]
- Cartwright, R.A. Problems and solutions for estimating indel rates and length distributions. Mol. Biol. Evol. 2009, 26, 473–480. [Google Scholar] [CrossRef]
- Loewenthal, G.; Rapoport, D.; Avram, O.; Moshe, A.; Wygoda, E.; Itzkovitch, A.; Israeli, O.; Azouri, D.; Cartwright, R.A.; Mayrose, I.; et al. A probabilistic model for indel evolution: Differentiating insertions from deletions. Mol. Biol. Evol. 2021, 38, 5769–5781. [Google Scholar] [CrossRef]
- Golenberg, E.M.; Clegg, M.T.; Durbin, M.L.; Doebley, J.; Ma, D.P. Evolution of a noncoding region of the chloroplast genome. Mol. Phylogenet. Evol. 1993, 2, 52–64. [Google Scholar] [CrossRef]
- Tian, D.; Wang, Q.; Zhang, P.; Araki, H.; Yang, S.; Kreitman, M.; Nagylaki, T.; Hudson, R.; Bergelson, J.; Chen, J.Q. Single-nucleotide mutation rate increases close to insertions/deletions in eukaryotes. Nature 2008, 455, 105–108. [Google Scholar] [CrossRef]
- Abdullah; Mehmood, F.; Shahzadi, I.; Ali, Z.; Islam, M.; Naeem, M.; Mirza, B.; Lockhart, P.J.; Ahmed, I.; Waheed, M.T. Correlations among oligonucleotide repeats, nucleotide substitutions, and insertion–deletion mutations in chloroplast genomes of plant family Malvaceae. J. Systemat. Evol. 2021, 59, 388–402. [Google Scholar] [CrossRef]
- Pan, Z.L.; Li, Z.T.; Zhang, J.P.; Bai, S.J.; Zhao, W.; Tong, C.F. Investigation of genome-wide InDel distribution and segregation in Populus with restriction-site associated DNA sequencing data. Trop. Plant Biol. 2022, 15, 171–180. [Google Scholar] [CrossRef]
- Messer, P.W.; Arndt, P.F. The majority of recent short DNA insertions in the human genome are tandem duplications. Mol. Biol. Evol. 2007, 24, 1190–1197. [Google Scholar] [CrossRef]
- Schiml, S.; Fauser, F.; Puchta, H. Repair of adjacent single-strand breaks is often accompanied by the formation of tandem sequence duplications in plant genomes. Proc. Natl. Acad. Sci. USA 2016, 113, 7266–7271. [Google Scholar] [CrossRef]
- Wolter, F.; Schindele, P.; Beying, N.; Scheben, A.; Puchta, H. Different DNA repair pathways are involved in single-strand break-induced genomic changes in plants. Plant Cell 2021, 33, 3454–3469. [Google Scholar] [CrossRef]
- Houde, P.; Braun, E.L.; Narula, N.; Minjares, U.; Mirarab, S. Phylogenetic signal of indels and the neoavian radiation. Diversity 2019, 11, 108. [Google Scholar] [CrossRef]
- Morley, S.A.; Ahmad, N.; Nielsen, B.L. Plant organelle genome replication. Plants 2019, 8, 358. [Google Scholar] [CrossRef]
- Reddy, A.S.; Rogers, M.F.; Richardson, D.N.; Hamilton, M.; Ben-Hur, A. Deciphering the plant splicing code: Experimental and computational approaches for predicting alternative splicing and splicing regulatory elements. Front. Plant Sci. 2012, 3, 18. [Google Scholar] [CrossRef]
- Abramowitz, A.; Gos, M. Splicing mutations in human genetic disorders: Examples, detection, and confirmation. J. App. Genet. 2018, 59, 253–268. [Google Scholar] [CrossRef]
- Hampe, A.; Jump, A.S. Climate relicts: Past, present, future. Annu. Rev. Ecol. Evol. Syst. 2011, 42, 313–333. [Google Scholar] [CrossRef]
- Cobo-Simon, I.; Mendez-Cea, B.; Jump, A.S.; Seco, J.; Gallego, F.J.; Linares, J.C. Understanding genetic diversity of relict forests. Linking long-term isolation legacies and current habitat fragmentation in Abies pinsapo Boiss. For. Ecol. Manag. 2020, 461, 117947. [Google Scholar] [CrossRef]
- Steffen, W.; Richardson, K.; Rockstrom, J.; Cornell, S.E.; Fetzer, I.; Bennett, E.M.; Biggs, R.; Carpenter, S.R.; de Vries, W.; de Wit, C.A.; et al. Sustainability. Planetary boundaries: Guiding human development on a changing planet. Science 2015, 347, 1259855. [Google Scholar] [CrossRef] [PubMed]
- Tanaka, A.; Tanaka, R. Chlorophyll metabolism. Curr. Opin. Plant Biol. 2006, 9, 248–255. [Google Scholar] [CrossRef] [PubMed]
- Blonder, B.; Graae, B.J.; Greer, B.; Haagsma, M.; Helsen, K.; Kapás, R.E.; Pai, H.; Rieksta, J.; Sapena, D.; Still, C.J.; et al. Remote sensing of ploidy level in quaking aspen (Populus tremuloides Michx.). J. Ecol. 2020, 108, 175–188. [Google Scholar] [CrossRef]
- Bogdanova, V.S. Genetic and molecular genetic basis of nuclear-plastid incompatibilities. Plants 2019, 9, 23. [Google Scholar] [CrossRef]

Disclaimer/Publisher’s Note: The statements, opinions and data contained in all publications are solely those of the individual author(s) and contributor(s) and not of MDPI and/or the editor(s). MDPI and/or the editor(s) disclaim responsibility for any injury to people or property resulting from any ideas, methods, instructions or products referred to in the content. |
© 2024 by the authors. Licensee MDPI, Basel, Switzerland. This article is an open access article distributed under the terms and conditions of the Creative Commons Attribution (CC BY) license (https://creativecommons.org/licenses/by/4.0/).