Abstract
Maintenance is becoming an increasingly green process, aiming to simultaneously minimize the impact of assets on the economy, society, and the surrounding environment while also mitigating any adverse consequences arising from maintenance activities. To manage maintenance from a sustainable perspective, appropriate indices able to represent environmental assessment results in an aggregated and synthetic way are necessary, along with rational decision-making tools able to simulate different maintenance alternatives considering various sustainability dimensions. In response to this challenge, a methodology rooted in sustainability indices and RAM analysis is proposed to support decision making with respect to sustainable maintenance practices. By applying the proposed methodology to a proof of concept we demonstrate that the approach enables the evaluation of both the environmental and economic impacts of different maintenance activities. Furthermore, the methodology facilitates the identification of specific environmental dimensions that need improvement, in addition to discerning the distinct contributions of individual components to the environmental and economic impacts at the system level. These insights offer valuable information to support informed decision making regarding the allocation of internal resources for impact mitigation. The obtained results underscore the potential applicability of this approach to industrial systems, signifying its contribution to the goal of achieving sustainable maintenance practices.
1. Introduction
Sustainable development refers to the management of human activity to meet the needs of the present without compromising the ability of future generations to survive [1]. It is concerned with three main areas, known as the triple bottom line (TBL) [2]: economic prosperity, environmental protection, and social equity. This approach entails organizing a company to account for both current and future considerations, such as preservation of the environment, as well as natural and human resources, and addressing industrial risks and safety. Given the existing social, environmental, and regulatory challenges, managers grapple with the complexity of devising a strategy that effectively balances the social, environmental, and economic requirements of both the company and society [3]. Consequently, focus has shifted from debating the necessity of implementing sustainability to the practical question of how to execute it.
Maintenance is defined as the “combination of all technical, administrative and managerial actions during the life-cycle of an item intended to retain it in, or restore it to, a state in which it can perform the required function” [4]. The potential for sustainability is embedded in an efficient and effective maintenance process and its consequential impacts [5,6]. Maintenance operations, by their nature, consume energy, produce emissions, utilize materials, and involve individuals executing diverse tasks. When well-managed, these maintenance activities can conserve resources and establish a secure and efficient work environment. In particular, a proficient maintenance system profoundly influences the performance of the maintained assets across the TBL. Consequently, maintenance is recognized as a process that necessitates sustainable management practices [7].
The role of the maintenance function is undergoing a transformation to enhance its contribution to value creation. This evolution involves not only contributions to the economic dimension but also the expansion of considerations with respect to environmental and social aspects [8]. As noted by Ajukumar and Gandhi [9], maintenance has progressed from a reactive function with no preventive actions to the initial adoption of a preventive approach, followed by a transition to a lean process, eventually becoming a green process. In this context, Franciosi et al. [10] define sustainable maintenance as “a set of interconnected processes that, from one hand, has to sustain asset/equipment during their operation to guarantee the compliance of the production process, of the manufactured products and to reduce their industrial impacts on the economy, society, and surrounding environment. On the other hand, itself has to be a sustainable business function to limit its flaws and impacts generated during maintenance activities”.
While the correlation between maintenance and sustainability is recognized, numerous scholars have underscored the scarcity of research linking sustainability concepts to maintenance impacts, hindering effective maintenance decision making. Scholars have highlighted that traditional research in maintenance management has mostly focused on economic and technical facets, overlooking the consequential effects on various sustainability dimensions [11,12,13]. Achieving the full integration of sustainability considerations into maintenance management requires vigilant monitoring and measurement of maintenance impact on the TBL through the use of [14]: (i) appropriate indices capable of presenting assessment results in a consolidated and synthetic manner and (ii) rational decision-making tools (e.g., mathematical models, simulation, etc.) that take into account diverse sustainability dimensions.
Decision making involving sustainability is inherently intricate and multidimensional and is characterized by tradeoffs among various sustainability dimensions [15]. Moreover, assessing sustainability is a challenging endeavor. To address the complexity of sustainability, sustainability assessments often necessitate the integration of multiple indicators to create composite indices [16,17]. In this context, sustainability indices (SIs) furnish insights into current performance and aid decision makers in determining future operational directions [18].
Modeling and simulation tools play a crucial role in designing and managing the life cycle of modern systems, especially as they become increasingly complex [19]. In the domain of maintenance decision-making tools, RAM (reliability, availability, and maintainability) analysis comprises a diverse range of methods, encompassing both qualitative and quantitative approaches, along with commercially available software tools. These tools enable the evaluation and forecasting of maintenance-related indicators throughout the life cycle of assets. Typically, this information is applied to aid in maintenance decision making, encompassing tasks such as the implementation of design modifications; specification of reliability and maintainability requirements; and the detailing of maintenance plans, inventory management strategies, and life-cycle costs—among other considerations [20,21].
In this context, this paper introduces an innovative sustainable maintenance methodology that leverages sustainability indices (SIs) and RAM analysis to facilitate decision making concerning maintenance activities. This methodology not only takes into account technical and economic considerations but also incorporates environmental sustainability. It is important to note that this work focuses specifically on decision making related to the sustainability of maintenance activities and does not address their impact on the performance of the maintained assets along the TBL. The remained of this paper is structured as follows. In Section 2, we analyze the state of the art, and in Section 3, we summarize the main tools utilized in the methodology: SIs and RAM analysis. Section 4 illustrates the proposed methodology, and in Section 5, we apply it to a case study for the development of a proof of concept. The obtained results are discussed in Section 6, and finally, in Section 7, we present our conclusions and identify directions for future work.
2. State of the Art
In the literature, different works can be found concerning maintenance and sustainability modeling. In particular, Saihi et al. [14] presented a literature review pertaining to sustainable maintenance decision-making models, seeking to establish the evolution of such research over time and identify the main research clusters and gaps. Among the different research opportunities outlined by the authors, the followings are relevant in the context of this work: (i) Holistic approach: Most works address one of the sustainability aspects (e.g., energy, emissions, waste, etc.), with few considering several factors at once; (ii) Systemic approach: The authors of many studies included single components in their optimization models but did not focus on systems. Systems consist of interdependent components, which complicates analysis [22]. Next, state-of-the-art reviews concerning holistic and systemic approaches in sustainable maintenance decision making are presented in Section 2.1 and Section 2.2, respectively.
2.1. Holistic Approaches
In maintenance management, maintenance performance measurement systems (MPMSs) have been utilized to measure, monitor, and improve the outcome of the maintenance function [23,24]; the ongoing digital transformation is further facilitating the implementation of these systems [25,26]. MPMSs need to be aligned with corporate objectives by defining measures at each organizational level; i.e., strategic, tactical, and operational. Furthermore, indicators at different hierarchical levels should be linked through cause-and-effect connections with the objective of building chains of indicators that quantify the value created by the maintenance function [27].
In the context of the TBL, a sustainability perspective must be embedded into MPMSs. Sari et al. [28] developed a framework for measuring sustainable maintenance performance, identifying 15 measures at the strategic level, 20 measures at the tactical level, and 43 measures at the operational level. Franciosi et al. [10] provided a framework for measuring maintenance impacts on sustainability and the relationships between sustainability indicators and maintenance processes. Although these approaches provide a holistic view by categorizing the indicators along the TBL, the authors did not link them through cause-and-effect connections. Therefore, maintenance decision making considering sustainability aspects remains complex, since the contributions of tactical and operational indicators to strategic indicators have not been quantified.
Approaches based on multicriteria decision analysis have been proposed to establish the relative importance of different indicators utilized to assess maintenance from the perspective of sustainability [29]. The authors of [30], integrated the TBL with Kaplan and Norton’s balance scorecard perspectives as a basis for the development of a framework for maintenance sustainability performance assessment. Then, the fuzzy integral method was implemented to establish the relative importance of the indicators. However, in these works, indicators were not linked to each other, as only their relative importance was identified.
One method to build chains of sustainability indicators that can support strategic decision making involves the utilization of sustainability indices. Hierarchical links between indicators can be generated through the selection of weighting and aggregation methods to form SIs. SIs are utilized to evaluate and monitor progress towards sustainability goals, identify areas for improvement, benchmark performance against that of peers, inform decision making, and communicate sustainability performance to stakeholders.
To the best of our knowledge, the only work in the sustainable maintenance domain that illustrates the assessment of an overall sustainability score (similar in concept to SIs) was presented in [31]. The proposed approach is based on the correlation between sustainability-related indicators and maintenance efficiency and utilizes the best–worst method to aggregate the indicators of the TBL. Nevertheless, estimating the efficiency of maintenance is not an easy task, since it consists of assigning a percentage score to maintenance actions, where 0% corresponds to minimal repair (restores the system to its state before the maintenance action) and 100% corresponds to perfect maintenance (restores a system to an ’as-good-as-new’ state) [32]. Since the approach relies on a parameter that is difficult to estimate (i.e., maintenance efficiency), a different method is utilized in this article.
Given the above considerations, the first novelty of this work is the adoption of the SI concept to support maintenance decision making considering different aspects of environmental sustainability.
2.2. Systemic Approaches
As highlighted in [31], numerous enterprises lack sufficient visibility into environmental and social impacts at the equipment level. This poses a challenge for those responsible for meeting sustainability targets, as they may struggle to determine the most effective allocation of internal resources to achieve impact mitigation goals. Therefore, in addition to quantifying economic impacts, it is crucial to measure and evaluate environmental and social impacts at a more detailed component level. This approach enables managers to pinpoint opportunities for equipment upgrades and replacements and strategically adjust preventive maintenance routines to enhance sustainability performance. In the existing literature, various works address the sustainability assessment and optimization of sustainable maintenance decision making for components (see to [5,33,34,35]).
Even if maintenance actions are applied at the component level, they have an impact on the health status of the system. Since systems consist of interdependent components, the quantification of the impact of component-level decision making on the sustainability performance of systems is not an easy task. RAM analysis based on Monte Carlo simulation has been applied in different domains to convert component-level indicators to system-level indicators in order to support maintenance decision making (e.g., railways [36], manufacturing [37], data centers [38], and electromechanical systems [39], amongst others). In RAM analysis, the reliability and maintainability of components are utilized to assess the system availability [40]. This method is adopted to quantitatively define the impacts of subsystems and components, redundancy, stock policy, maintenance policy, and logistics on system availability [41]. This information is then utilized to simulate different scenarios and identify strategies to improve system availability.
Along with the technical dimension, RAM analysis has been largely applied to study the economic sustainability of maintenance decision making throughout the different phases of the asset life cycle. For instance, Al-Douri et al. [42] utilized this tool during the conceptual design of a chemical process plant to assess the impacts of component RAM characteristics on technical and economic performance indicators such as system availability, annual net profit, and return on investment. Regattieri et al. [43] tested and simulated different preventive maintenance policies for an aircraft, demonstrating a reduction in the yearly maintenance cost without a significant change in availability with the adoption of the new policies. Setia et al. [44] applied this tool to build priority rankings of assets in the context of the allocation of very limited maintenance budgets. Roda et al. [45] utilized it to drive the implementation of a predictive maintenance policy within an industrial plant from a strategic point of view through the estimation of the total cost of ownership. The abovementioned are just few of the many works that can be found in the literature, showing that the integration of technical and economic aspects through RAM analysis has been thoroughly investigated.
To the best of our knowledge, the only existing work in the sustainable maintenance field that demonstrates the evaluation of an overall sustainability score (akin to sustainability indices) is that discussed in [31]. The proposed methodology relies on establishing correlations between sustainability-related indicators and maintenance efficiency, employing the best–worst method to aggregate the indicators of the triple bottom line (TBL). However, assessing maintenance efficiency is a challenging task, involving the assignment of a percentage score to maintenance actions, where 0% corresponds to minimal repair (restoring the system to its state before the maintenance action) and 100% signifies perfect maintenance (restoring a system to an ’as-good-as-new’ state) [32]. Given the reliance on a challenging-to-estimate parameter (maintenance efficiency), an alternative method is employed in this paper.
Given the above considerations, the methodology for supporting sustainable maintenance decision making introduced in this work constitutes a novelty, since it is grounded in (i) RAM analysis and (ii) SIs that can be customized based on the considered case study.
3. Theoretical Framework
In this section, the main tools that utilized in the proposed methodology are summarized. SIs are presented in Section 3.1, and RAM analysis is described in Section 3.2.
3.1. Sustainability Indices
An indicator is a variable or an aggregation of related variables whose values provide information about the conditions or trajectories of a system or phenomenon of interest. Put simply, an indicator is an operational representation of an attribute (quality, characteristic, or property) of a system [46]. Sustainability indicators offer information about the state, dynamics, and underlying drivers of human–environmental systems. However, it is important to note that many indicators only capture specific aspects of human–environmental systems, with varying levels of integrative capacity, and no single indicator is sufficient to comprehensively assess the multiple dimensions of sustainability [17]. Consequently, adopting a variety of indicators is necessary to adequately assess sustainability.
Providing an excessive number of indicators can lead to confusion rather than clarity, particularly when indicators vary in terms of both magnitude and direction of change. Decision makers require concise information that presents the assessment result in an aggregated manner yet allows for decomposition to lower levels, demonstrating the impact of each assessed criterion on the final outcome [30]. To streamline the number of indicators or capture the integrative nature of a system, sustainability indicators are frequently amalgamated through mathematical manipulations to generate sustainability indices.
The key steps in building SIs are weighting and aggregation operations [47], as they are the processes by which sustainability information is transferred from variables to indicators, then from indicators to indices (see Figure 1). Mathematical aggregation can be generically described as follows [48]:
where is the ith indicator and g constitutes the aggregation function. The latter usually consists of one of three options:
- The summation operation, in which individual indicators are added together;
- The multiplication operation, in which a product is formed of some or all of the indicators;
- The maximum or minimum operation, in which just the maximum or minimum indicator, respectively, is reported.

Figure 1.
Illustration of the roles of weighting and aggregation methods in the building of sustainability indices [49].
Figure 1.
Illustration of the roles of weighting and aggregation methods in the building of sustainability indices [49].

Lastly, an aggregation function often necessitates the use of weights. Selecting suitable weights for commensuration poses a significant challenge in aggregation functions. The authors of [49] provided an extensive list of weighting methods accompanied by a process-oriented approach for choosing the most appropriate weighting and aggregation methods based on research objectives.
3.2. Ram Analysis
Simulation based on RAM analysis has been applied in different domains to convert component-level indicators to system-level indicators in order to support maintenance decision making. In RAM analysis, the reliability and maintainability of components are utilized to assess system availability. This metric can be calculated by either Boolean models or state-based models [50].
Boolean models encapsulate the conditions that lead to a system’s failure (or functioning) based on the structural relationships among its components. A reliability block diagram (RBD) is a Boolean model technique, constructing networks of functional blocks connected according to the impact of each block’s failure (and repair) on the system’s reliability (and availability) [51]. In the RBD, each component is depicted as a block with two end points [52]. When the component is operational, there is a connection between the two end points, which is severed when the component fails. A multicomponent system can be illustrated as a network of such blocks with two end points. The system is operational if there is a connected path between the two end points. The system is considered to have failed if no such path exists. Despite the widespread use of Boolean models in reliability analysis, they have certain limitations: (i) they can only model ’two-state’ components (working and failed), and (ii) it is assumed that the failure or recovery of a component is not influenced by the behavior of any other component, meaning no dependencies among components can be represented.
State-based models emerge as more suitable options for capturing intricate interactions among components and real-world phenomena [53]. These phenomena may encompass standby operation modes, deteriorating repairs, aging, preventive maintenance actions, the availability of repair teams for different types of interventions (e.g., mechanical, electronic, hydraulic, etc.), and prioritization of components, among other factors. Such models depict the system’s behavior, including failures and repair activities, through its states, with event occurrences denoted as labeled state transitions. Labels can take the form of probabilities, rates, or distribution functions, facilitating the implementation of Monte Carlo simulations. The most prominent state-based models include Markov chains and Petri nets.
Petri nets (PNs) are split into two different kinds of graphical elements [54]: (i) static elements (i.e., places, transitions, and arcs), which are simple drawings, and (ii) dynamic elements (i.e., tokens, predicates, and assertions), which define the current state of the modeled system and change accordingly. In contrast to the Markovian approach, no combinatory explosion occurs in PNs and the size of the model remains linear relative to the number of components [50]. PNs can be used to model ’multistate’ components as depicted in Figure 2. Furthermore, PNs can be built to model different behaviors (e.g., dependencies of components) and used as blocks within an RBD architecture. The latter is defined as a reliability block diagram-driven Petri net and constitutes the modeling approach implemented in most commercial software tools.
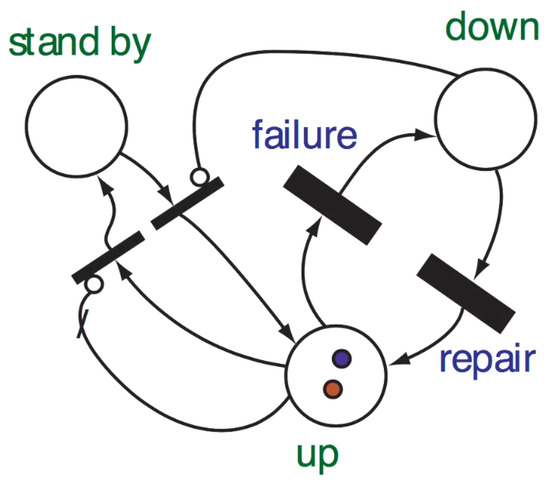
Figure 2.
Petri net representation of a periodically tested component (see: https://medium.com/musings-on-reliability-and-maintenance-topics/petri-nets-for-system-reliability-modeling-f381da2244b1 (accessed on 14 December 2023)). It can be noted that the component has three states (i.e., down, standby, and up) and different transitions.
4. Sustainable Maintenance Methodology
This section presents a sustainable maintenance methodology that supports maintenance decision making while considering environmental sustainability. The methodology is depicted in Figure 3 and consists of the integration of workflows for (i) the building of sustainability indices (located on the the left-hand side of the figure) and (ii) the implementation of RAM analysis (located on the right-hand side). The steps for building sustainability indices are adapted from the generic framework for calculating aggregate indices proposed in [48], while the steps for implementing RAM analysis were developed by integrating different sources [41,55,56]. By combining these two workflows, the methodology provides a comprehensive approach for supporting maintenance decision making from an environmental sustainability perspective. Next, the different phases of the methodology are illustrated.
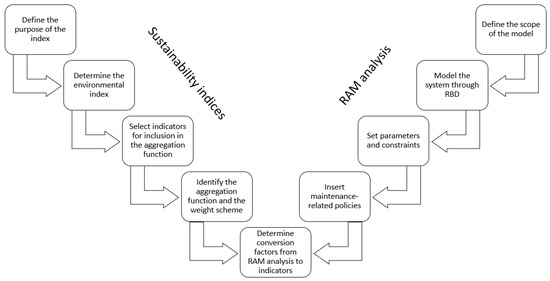
Figure 3.
Sustainable maintenance methodology for supporting maintenance decision making considering environmental sustainability. The steps for the building of sustainability indices are presented on the left-hand side, while the steps for the implementation of RAM analysis are presented on the right-hand side.
4.1. Defining the Purpose of the Index
The initial phase in the construction of sustainability indices involves articulating the purpose of the index. Clearly stating this purpose is crucial to facilitate subsequent evaluations. The definition of purpose encompasses several interconnected considerations [48], including the reporting frequency and issues like spatial and temporal boundaries. In the context of this study, it is imperative to account for end-user or audience needs. For instance, the purpose and formulation of the index vary depending on whether it is meant to monitor maintenance impacts on environmental sustainability or to inform general stakeholders within the company. Monitoring maintenance impacts on environmental sustainability necessitates indices that trace the environmental consequences of maintenance activities, such as energy consumption, water usage, greenhouse gas emissions, and waste generation. Conversely, indices designed to inform general stakeholders should offer a broader perspective on the maintenance function and its role in the company’s overall sustainability strategy. These indices might include information on the environmental impacts of maintenance activities and their contributions to the company’s sustainability goals.
4.2. Determining the Environmental Index
In building an index to support maintenance decision making from an environmental sustainability perspective, it is essential to develop a conceptual understanding of the maintenance system that the index is related to. For instance, if the index aims to measure the environmental sustainability of maintenance operations in a building, a conceptual picture of the dynamics of sustainable maintenance needs to be developed. This involves identifying the key dimensions of sustainable maintenance, such as energy efficiency, water conservation, waste reduction, and indoor air quality, as well as how they are related to each other. Then, the environmental index is selected. In some cases, it may be possible to use an existing or adjusted index in order to meet specific needs. The selection of an existing index may be desirable, since some of the steps reported on the left-hand side of Figure 3 can be avoided, i.e., selecting indicators and identifying the aggregation function and weight scheme. If an existing index is unsuitable, it may be necessary to develop a new index from scratch, which would involve a thorough conceptual scoping exercise to ensure that the index accurately captures the relevant sustainability dimensions.
4.3. Selecting Indicators for Inclusion in the Aggregation Function
After identifying the index, the next step is to select appropriate indicators for inclusion in the aggregation function. Different standards or themes for sustainability reporting can be used for this purpose, such as the National Institute of Standards and Technology (NIST) sustainable manufacturing indicators repository [57], the Global Reporting Initiative (GRI) standards for sustainability reporting [58], ISO 14001:2015 ‘Environmental Management Systems’ [59], the Lowell Centre Sustainable Production (LCSP) indicator framework [60], and EN 15341:2019 ’Maintenance Key Performance Indicators’ [61], amongst others. During this phase, it is crucial to confirm that the chosen environmental indicators align with the sustainability dimensions identified for the index and that they can be computed using the output data of the RAM analysis (see Section 4.9). When relevant indicators are selected, the resulting index provides an accurate representation of the sustainability performance of the maintenance system under consideration.
4.4. Identifying the Aggregation Function and the Weight Scheme
Aggregation functions facilitate the transformation of indicators into indices. As outlined in [62], the success of an aggregation approach relies on clearly identifying all assumptions and data sources, ensuring transparency and public reporting of the methodology, and enabling easy disaggregation of the index into individual components without loss of information.
Weights are often necessary in aggregation functions to combine sustainability indicators into an overall index. However, selecting appropriate weights can be challenging, since it often requires explicit value judgments on the relative importance of different indicators. This is particularly true for environmental indicators for which determining the relative importance of ecosystem services such as water, energy, and land can be difficult.
In this context, Gan et al. [49] examined widely used approaches for the weighting and aggregating of sustainability indices (SIs). They delved into the advantages and disadvantages of these methods, proposing a process-oriented approach for selecting suitable weighting and aggregation techniques based on specific research objectives.
4.5. Defining the Scope of the Model
The building of environmental indices is accompanied by the development of RAM analysis. The first step in the RAM workflow involves defining the objective of the model, the system boundaries, and the simulation time frame. Additionally, information regarding the selected system is collected, such as taxonomic decomposition, the utilization pattern, the component function and maintenance booklet, the impact of a failure or stoppage on production, applied maintenance plans, the maintenance record, and available repair teams and spare parts, among others. This information forms the foundation for the subsequent stages of the RAM workflow.
4.6. Modeling the System through RBD
In this step, the system is modeled using an RBD representation. The modeling process can be performed at different levels of detail; at one end of the spectrum, a block can represent a subsystem, while at the other end, blocks can be used to represent each failure mode of the components. The defined blocks are connected to each other using logical relationships to convey system-level failures. RBDs typically contain components arranged in series, parallel, and ’k-out-of-n’ substructures [41], where ’k’ is the number of parallel elements that must function properly for the system to work and ’n’ is the total number of these elements within the parallel substructure.
4.7. Setting Parameters and Constraints
Once the RBD model has been built, constraints and parameters must be set for each block. The main types of parameters and constraints are specified as follows [56]:
- Parameters:
- –
- Failure and repair data: The failure and repair distributions and their parameters are set for each block. This information can be obtained from various sources [55], including (i) public databases, (ii) maintenance records of the actual system, (iii) expert judgments, and (iv) laboratory testing.
- –
- Delay: Delays can be added to better model the dynamics of the system, such as logistics delays in the supply of spare parts or the execution of maintenance activities.
- –
- Income and cost: The financial performance of the system can be evaluated by including the income generated by the production process and various cost parameters, such as spares, resources, etc. This information can guide changes aimed at improving economic sustainability.
- Constraints:
- –
- Dependency: This constraint is used to specify how the behavior of a block depends on the status of other blocks or the system as a whole. For instance, blocks may continue to operate in their own failure–repair cycles regardless of what happens elsewhere in the system, or they may stop operating based on the status of other components.
- –
- Standby: In parallel configurations, one block operates while the other is in a standby state, waiting to be called upon if needed. Different options can be adopted to make the standby block either accumulate life while in standby or not.
- –
- Logistic constraints: These constraints specify the type of spare used in maintenance activities, as well as the resources (e.g., operators, tools, consumables, etc.) required for their execution.
4.8. Inserting Maintenance-Related Policies
Once the constraints and parameters have been set, maintenance-related policies are inserted. These include the definition of the maintenance plan, the inventory strategy, and the management of resources. Concerning preventive maintenance activities, the periodicity or the triggering event is defined, along with the duration, the necessary resources, and the efficiency of the action, i.e., whether the block is restored to the ‘as-good-as-new’ state or not. For inventory, various strategies are available, such as economic order quantity and safety stock [63]. Lastly, the management of resources involves determining the number of operators and tools available for the different maintenance activities.
4.9. Determining Factors for the Conversion of RAM Analysis to Indicators
This step represents the most important part of the methodology, since it connects the technical data generated from the RAM analysis to the environmental indicators identified in Section 4.3. To accomplish this, one can employ the life cycle assessment (LCA) technique [64]. LCA offers a comprehensive framework for evaluating the environmental impacts associated with all stages of the life cycle of a product, process, or service. For example, in the case of a manufactured product, environmental impacts are assessed from the extraction and processing of raw materials (cradle) through the product’s manufacturing, distribution, and use to the recycling or final disposal of its constituent materials (grave). The use of LCA makes it feasible to translate technical data into indicators for the assessment of the environmental sustainability of the system under investigation.
5. Proof of Concept
In this section, the sustainable maintenance methodology outlined in Section 4 is implemented and validated through a proof of concept (PoC). To assess its effectiveness, a semirealistic case study is developed, emulating a crude oil transport pumping system situated in an oil refinery in Barrancabermeja, Colombia. The system consists of two Atlas 80SPL-A52 (https://www.tiiec.com/slurry-pumps-performance-curve-atlas-80-spl-heavy-duty-high-head-slurry-pump-tiiec.html (accessed on 14 December 2023)) slurry pumps working in a one-out-of-two configuration, where one pump operates while the other serves as a standby. The system is designed for continuous operation, running 24 h a day and 7 days a week, with an oil flow rate of 100 m/h. The primary objective of the analysis is to investigate maintenance strategies that can mitigate the environmental impact while maintaining economic sustainability. In the subsequent sections, the sustainable maintenance methodology is applied to the presented case study.
5.1. Workflow for Sustainability Indices
In this section, the workflow for sustainability indices (left-hand side of Figure 3) is applied to the oil transport pumping system.
5.1.1. Defining the Purpose of the Index
Defining the purpose of the environmental index is crucial to ensure alignment with the subsequent phases of the process. To achieve this, it is essential to consider the needs of end users or the target audience. In the context of the PoC, the index was specifically tailored for maintenance decision makers with the objective of assessing maintenance impacts on environmental sustainability. The ultimate goal was to guide the formulation of maintenance strategies that can effectively mitigate the environmental impact while preserving economic sustainability.
5.1.2. Determining the Environmental Index
Before selecting the index, it is crucial to develop a conceptual understanding of the maintenance system to which the index is related. Ghaleb & Taghipour [65] conducted a comprehensive review and analysis of literature evidence regarding the social, environmental, and economic impacts of maintenance. They identified sustainability-related indicators significantly affected by maintenance actions and categorized them into functional groups. For the assessment of environmental sustainability, indicators related to resource consumption, emissions, and pollution were considered. In this study, our focus with respect to selecting the index was resource consumption and emissions, while pollution was neglected to maintain a manageable level of complexity for the PoC.
After gaining a conceptual understanding of the maintenance system, the appropriate environmental index is selected. While the index’s primary purpose may not be to inform general stakeholders about the environmental impacts of maintenance activities, choosing an index aligned with the company’s sustainability goals can offer a robust justification for implementing changes in maintenance strategies, especially when presenting to top management.
Carbon dioxide equivalent, also known as CO2 equivalent or CO2-eq, is a metric used to compare greenhouse gas emissions based on their global-warming potential (GWP). It allows for the conversion of the emissions of different gases into equivalent amounts of carbon dioxide with the same GWP [66]. As a crucial index for the assessment of environmental sustainability, CO2-eq is gaining significance among enterprises. Notably, the Carbon Disclosure Project utilizes CO2-eq scores and ratings to evaluate companies based on their reported emissions and climate change strategies. Similarly, the Dow Jones Sustainability Indices (DJSI) incorporate CO2-eq emissions as a key component of their environmental criteria to assess companies’ sustainability performance.
In their framework, Ghaleb and Taghipour [65] categorized energy, water use, and material indicators under the resource consumption functional category, while carbon emissions and other greenhouse gas (GHG) emissions were classified under the emissions category. Notably, the CO2-eq index encompasses indicators related to emissions but not those related to resource consumption. To address this, we introduced an extended carbon dioxide equivalent index (eCO2-eq). This index allows for the indirect quantification of the resources consumed during maintenance activities into equivalent carbon dioxide, as detailed in Section 5.3. We decided to use eCO2-eq with the aim of creating a comprehensive index encompassing all selected environmental dimensions while remaining intelligible to top management due to its resemblance to CO2-eq.
5.1.3. Selecting Indicators for Inclusion in the Aggregation Function
The objective of this phase is to select suitable indicators for inclusion in the aggregation function. Following the framework proposed in [65], the environmental indicators listed in Table 1 were utilized in the presented PoC. Notably, these indicators align with the dimensions identified for the eCO2-eq index and can be computed using RAM analysis by assigning values of these indicators to each maintenance activity, as detailed in Section 5.3.

Table 1.
Environmental indicators selected for the calculation of eCO2-eq.
5.1.4. Identifying the Aggregation Function and the Weight Scheme
In this phase, the selected environmental indicators are converted into the eCO2-eq index. Additive aggregation methods employ functions that sum up the normalized values of subindicators to form a sustainability index. By far, the most widespread additive method is the weighted arithmetic mean [67]:
where SI is the sustainability index, the weight of the ith indicator, and is the normalized score of the ith indicator. In this PoC, this aggregation method was selected to include the contributions of the indicators illustrated in Table 1 for the assessment of the eCO2-eq index.
Since the resources consumed during maintenance activities were converted into kg-CO2-eq (Section 5.3), equal weighting was assigned to the indicators, considering them equally important and quantified in the same functional unit (i.e., kg-CO2-eq). Equal weighting is computed as follows [47]:
where represents the weight of the ith indicator, and is a constant used as the weight for all the indicators. In this PoC, was assumed to equal 1, since all the resources were quantified in kg-CO2-eq.
In summary, the eCO2-eq is computed as the sum of the environmental indicators quantified in kg-CO2-eq.
5.2. Workflow for RAM Analysis
In this section, the workflow for RAM analysis (right-hand side of Figure 3) is applied to the oil transport pumping system.
5.2.1. Defining the Scope of the Model
The first step in the RAM workflow involves defining the objective of the model, establishing system boundaries, and determining the simulation time frame. Additionally, maintenance-related information regarding the selected system is collected, forming the foundation for the subsequent stages of the RAM analysis.
For the PoC, the model has to enable the simulation of various maintenance strategies and the estimation of the data necessary to assess their environmental and economic impact. The system under consideration comprises two Atlas 80SPL-A521 slurry pumps, with only two significant failure modes analyzed: (i) wear of the blade leading to shaft vibrations and (ii) seal leaks leading to oil trickle. To simulate the system’s behavior, a time frame of 25 years was chosen, assuming that the pumps will be replaced after this period. As a conceptual case study, maintenance-related information was derived from available datasets, and plausible values were assigned in the absence of specific data.
It is noteworthy that the energy consumption associated with maintenance operations (e.g., the use of power tools, etc.) was omitted from consideration due to its negligible cost and impact in terms of kg-CO2-eq when compared to other factors. Additionally, only the environmental sustainability of maintenance was simulated, while the impact of system operation was not considered.
5.2.2. Modeling the System through RBD
In this step, the system is modeled using the RBD representation, as illustrated in Figure 4. For the RAM analysis, RAPTOR 7.0 was selected as a software tool [56]. In RAPTOR, failure modes are represented by blocks (square symbols in the figure), while nodes (circle symbols) and links (lines) connect the blocks to define the system’s failure logic. and identify the ith pump, while and represent the redundancy information that defines the parallel substructure of the system. Specifically, the 1/2 symbol above indicates a one-out-of-two configuration, meaning that one pump must function properly for the system to operate successfully.
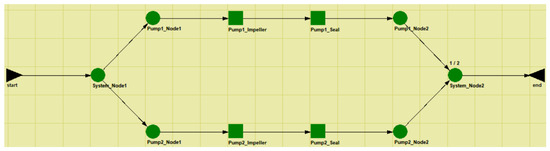
Figure 4.
RBD of the oil transport pumping system modeled in RAPTOR 7.0.
5.2.3. Setting Parameters and Constraints
In this step, parameters and constraints are defined for each block. The impeller’s mean time to failure (MTTF) was set to 48 months (i.e., 35,040 h), considering a shaft speed of 1375 rpm (see [68]). The seal’s MTTF of 44,300 h—this information can be found under taxonomy 1.3.1.4: Centrifugal Crude oil handling pump-external leakage process medium—was implemented as defined in [69]. Both failure modes were modeled with an exponential distribution, assuming a constant failure rate.
For repair parameters (i.e., corrective maintenance), a mean time to repair (MTTR) of 15 h was set for the impeller, with an MTTR of 10 h for the seal. Both failure modes were modeled with a log-normal distribution, using a standard deviation of 2 h. Each repaired block was restored to the ‘as-good-as-new’ state, as both the impeller and the seal were assumed to be replaced after a failure.
In the case of the impeller, a scenario was considered in which an inspector located in Bogotá needs to assess the effects of blade vibrations to ensure that they have not caused additional failures. The repair operation would only commence after this inspection. To accommodate the waiting time for the inspector, a fixed pre-repair logistics delay time of 48 h was set for each impeller failure.
A summary of the defined failure and repair parameters is provided in Table 2.
Table 2.
Summary of the failure and repair parameters of the impeller and seal failure modes.
Next, the costs of the repair activities are defined. The impeller spare cost was set to USD 500 (https://www.alibaba.com/product-detail/High-Efficient-Casting-Iron-Impeller-For_1600457478305.html?spm=a2700.galleryofferlist.normal_offer.d_image.71e81fbdmBEji3 (accessed on 14 December 2023)), while the cost of a spare seal was set to USD 200 (https://www.alibaba.com/product-detail/2610-2620-2630-2640-2660-3171_60651013226.html?spm=a2700.galleryofferlist.normal_offer.d_title.7e297c0eUuFReB&s=p (accessed on 14 December 2023)). A single on-site technician with a salary of USD 15 per hour is required for the replacement operation.
The inspector responsible for the pump check has to travel from Bogotá. The costs were set to USD 85 for flight transport and USD 125 USD for bus transport. The higher cost of the bus option is due to the longer duration of the working trip, which doubles the inspector’s time compared to the flight option.
Lastly, in the case of a system outage, a penalization cost of USD 6000 per hour was assumed, considering an oil flow rate of 100 m/h and the continuous operation of the system.
A summary of the defined costs is provided in Table 3.
Table 3.
Summary of the costs for the corrective maintenance of the impeller and the seal failure modes.
After defining the parameters, constraints are established. A local dependency was implemented, meaning that when the impeller fails, the seal also stops operating and vice-versa. Additionally, a standby functionality was defined, where the redundant pump does not accumulate any life while acting as an alternate, i.e., ‘cold standby’.
5.2.4. Inserting Maintenance-Related Policies
In this phase, maintenance-related policies are incorporated into RAPTOR 7.0. These policies encompass the establishment of the maintenance plan, the formulation of the inventory strategy, and the management of resources.
Regarding the inventory strategy, a stock of one spare was set for both the impeller and the seal, and a logistic delay in their supply of 168 h was assumed. This means that as soon as the spare stock drops to zero, a new spare is ordered to replenish the stock. While an alternative inventory strategy could have been explored to enhance environmental sustainability, this PoC exclusively focuses on evaluating maintenance strategies.
Following the establishment of the inventory strategy, the maintenance scenarios to be evaluated through RAM analysis were formulated. These scenarios include:
- CM-flight: Corrective maintenance (CM) is applied to the two maintainable items, with the condition that in each impeller failure event, the inspector travels from Bogotá by plane.
- CM-bus: Corrective maintenance (CM) is applied to the two maintainable items, with the condition that in each impeller failure event, the inspector travels from Bogotá by bus. The rationale behind this strategy is to mitigate environmental impact by altering the inspector’s transportation method.
- PM-bus: Corrective maintenance (CM) is applied to the two maintainable items, with the condition that in each impeller failure event, the inspector travels from Bogotá by bus. Additionally, preventive maintenance (PM) is scheduled only for the impeller at 29,000 h, i.e., 85% of its MTTF. In PM, the impeller is replaced. The primary aim of this scenario is to reduce the inspector’s travel frequency by introducing PM for the impeller. Notably, the replacement implemented during PM does not require the inspector, since the impeller has not yet experienced failure.
- PM-bus-reuse: Corrective maintenance (CM) is applied to the two maintainable items, with the condition that in each impeller failure event, the inspector travels from Bogotá by bus. PM is scheduled only for the impeller at 29,000 h. With respect to the previous strategy, the impeller is balanced and reused after a failure. It is assumed that the item’s life is reduced by 15% with each reuse and that replacement is necessary after two reuses (i.e., three failures). This scenario aims to examine the impacts of reusing the impeller on both environmental and economic sustainability.
It is worth noting that the various maintenance strategies were developed after a simulation of the CM-flight scenario (see Figure 5). As the transportation of the inspector and the impeller emerged as the primary contributors to kg-CO2-eq emissions, the remaining strategies were formulated with the objective of mitigating the impact of these two factors.
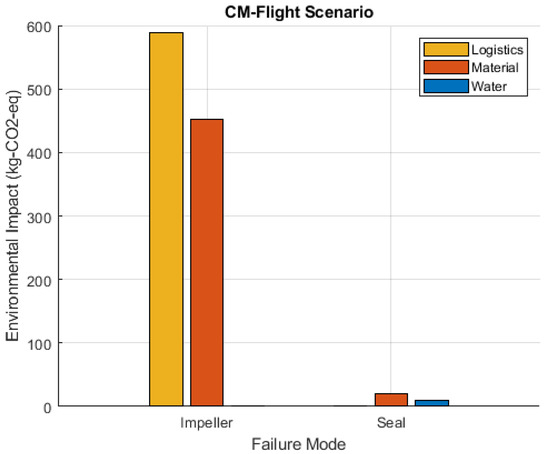
Figure 5.
Environmental impact of the CM-flight maintenance strategy. The negligible effect of the seal is evident compared to the impeller, highlighting the dominant role of impeller logistics and material indicators in kg-CO2-eq emissions.
From a technical perspective, PM was modeled using a log-normal distribution with an MTTR of 7 h and a standard deviation of 2 h. The balancing operation, which was implemented to enable reuse, was assumed to have the same duration as the replacement.
Regarding resources, each maintenance activity (i.e., CM with replacement, CM with impeller balance, and PM) requires the presence of a technician, along with the additional requirement of an inspector visit in the case of CM activities involving both replacement and balance.
A summary of the defined maintenance strategies is provided in Table 4.
Table 4.
Summary of the maintenance strategies investigated in the oil transport PoC.
5.3. Factors Affecting Conversion from RAM Analysis to Indicators
In this section, the process of calculating the indicators outlined in Table 1 based on the outcomes of the RAM analysis is described. As described in Section 5.2, energy consumption linked to maintenance operations (such as the use of power tools, etc.) was excluded from consideration due to its minimal influence in terms of both cost and kg-CO2-eq when compared to other contributing factors.
Following the order presented in Table 1, the assessment of water usage is considered first. In this context, it was assumed that 10,000 L (2642 gallons) of water are required to clean up an oil spill resulting from the seal failure. To convert this volume to kg-CO2-eq, we considered the carbon dioxide emissions associated with the stages of water withdrawal, distribution, treatment of wastewater following the cleanup process, and discharge. In alignment with [70], the calculated impact was found to to 775 kg-CO2-eq per Mgal. As a result, each seal failure contributed to the emission of 2 kg-CO2-eq.
Regarding the influence of materials (i.e., spare parts in the PoC), the life cycle assessment (LCA) technique was employed. To determine the kg-CO2-eq associated with the impeller and the seal, an LCA analysis was conducted using GRANTA EduPack 2023 (https://www.ansys.com/products/materials/granta-edupack (accessed on 14 December 2023)) software. This software facilitates the evaluation of environmental impacts across the entire life cycle of a product, encompassing raw material extraction and processing (cradle), manufacturing, distribution, usage, and ultimate disposal or recycling (grave). To compute kg-CO2-eq, the analysis considered the following factors:
- Material and its mass: A mass of 5 kg of maraging steel is assumed for the impeller, and a mass of 0.35 kg of maraging steel is assumed for the seal.
- Manufacturing processes: Both the impeller and the seal are manufactured with a forging process and subsequent fine machining, which is responsible for the removal of 10% of the material.
- Transportation: Transportation from China to Colombia encompasses 100 km by bus from the Chinese company to the airport, 15,500 km by plane from China to Colombia, and 430 km by bus from Bogotá to Barrancabermeja.
- Disposal: A landfill without recycling is assumed.
Taking into account these elements, environmental impacts of 58 kg-CO2-eq for each impeller and 4 kg-CO2-eq for each seal were assessed.
Direct carbon emissions primarily occur during the operational phase, with maintenance logistics also contributing to this aspect. Logistics-related environmental implications were identified exclusively during the failure of the impeller, resulting from the transportation of the inspector. The calculated values for this indicator are 320 kg-CO2-eq for flight transportation (https://co2.myclimate.org/en/calculate_emissions (accessed on 14 December 2023)) and 23 kg-CO2-eq for bus transportation (https://www.worldlandtrust.org/carbon-calculator/individual/transport/transport-calculator/ (accessed on 14 December 2023)). To enhance the clarity of the analysis of environmental impacts related to maintenance, the term ”carbon emissions” (Table 1) are henceforth be indicated as logistic.
Lastly, other GHG emissions ware analyzed. These emissions occurred during wastewater treatments. However, upon comparison with the magnitude of other factors, they were determined to be negligible.
A summary of the defined environmental impacts is depicted in Table 5.
Table 5.
Summary of the environmental impacts of the maintenance activities.
6. Results and Discussion
In this section, the obtained results are presented and discussed. The PoC is first analyzed, followed by the proposed sustainable maintenance methodology. Finally, possible limitations of the approach and areas for improvement are highlighted.
It is important to note that all the simulations were executed with 50 repetitions, considering a 25-year time frame. This number of repetitions proved suitable for obtaining consistently convergent results. The results are displayed in plots that only present the average values of the indices and indicators, given that the observed variability was deemed negligible.
6.1. Proof of Concept
In the PoC, an initial simulation was conducted for the CM-flight scenario, serving as a baseline for identifying maintenance strategies capable of reducing environmental impact while preserving economic sustainability. The resulting environmental impact is depicted in Figure 5. Notably, the transportation of the inspector (i.e., logistics indicator) and the impeller (i.e., material indicator) emerged as the primary contributors to kg-CO2-eq emissions. Subsequent strategies were developed to mitigate the impact of these two factors.
Based on the results presented in Figure 5, the CM-bus, PM-bus, and PM-bus-reuse strategies were introduced to minimize the impeller logistics and material indicators. As shown in Figure 6, these strategies successfully achieved the intended objective. However, it is important to note that tradeoffs could arise, as improvements in environmental impact might influence economic sustainability. This tradeoff scenario is clearly depicted in Figure 7 for the PM-bus-reuse strategy, where the occurrence of system outages resulted in significant penalization costs. Conversely, the CM-bus and PM-bus strategies exhibited similar costs to those of the CM-flight strategy.
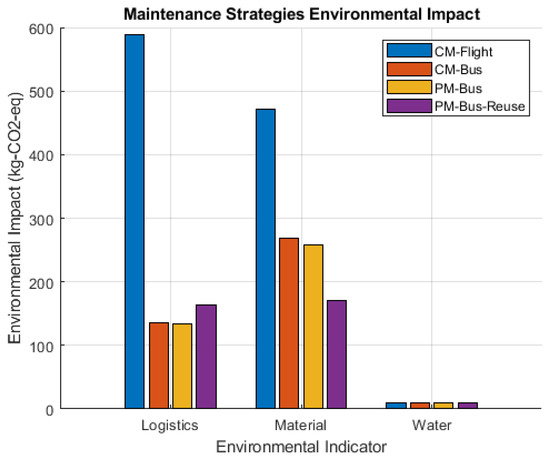
Figure 6.
Environmental impacts of the implemented maintenance strategies. It can be noted that the introduced strategies demonstrate a reduction in environmental impact when compared to the CM-flight strategy.
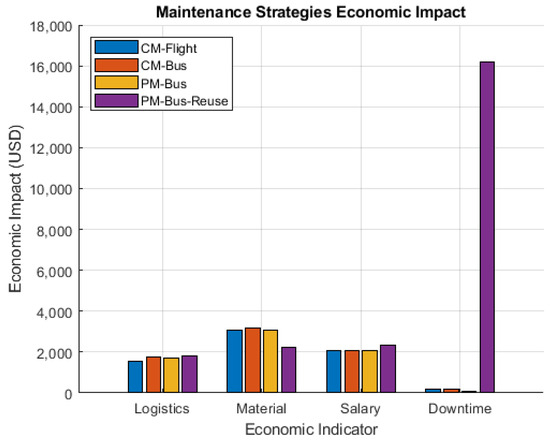
Figure 7.
Economic impacts of the implemented maintenance strategies. The PM-bus-reuse strategy exhibits a significant increase in costs, while both the CM-bus and PM-bus strategies demonstrate costs similar to those of the CM-flight strategy.
A summary of the environmental and economic impacts of each maintenance strategy is presented in Figure 8. It is evident that the CM-bus and PM-bus strategies are preferable, as they effectively mitigate environmental impact while maintaining economic sustainability. Conversely, the PM-bus-flight strategy reduces the environmental impact but at the expense of economic sustainability. It is important to note that when making decisions to change maintenance strategies, other factors must also be taken into consideration. For instance, bus transportation, taking approximately 7 h through secondary tracks and small trails, could potentially impact the well-being of the inspector, influencing social sustainability indicators.
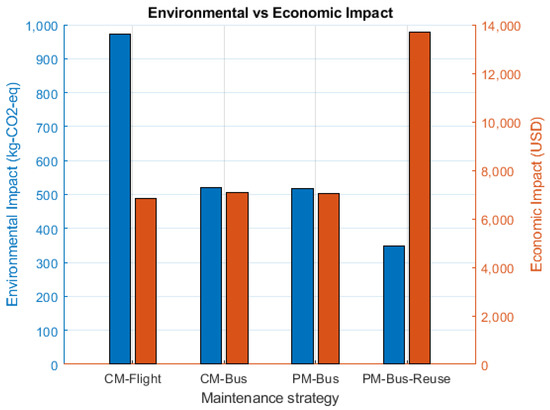
Figure 8.
Summary of the environmental and economic impacts of the implemented maintenance strategies.
6.2. Sustainable Maintenance Methodology
The sustainable maintenance methodology proposed in this study is now examined based on the results obtained from the PoC. The aim of the methodology is to achieve two primary objectives:
- Holistic approach: While much of the existing literature has focused on individual environmental sustainability dimensions (e.g., energy, emissions, waste, etc.), the proposed methodology was designed to encompass multiple factors simultaneously.
- Systemic approach: Unlike studies that focus solely on individual components within optimization models, the aim of the proposed methodology is to integrate the environmental impact of equipment at the system level to better address company sustainability goals.
Next, we outline how the proposed methodology fulfills the aforementioned objectives.
6.2.1. Holistic Approach
In the realm of sustainability studies, a plethora of indicators can be employed for the assessment process. Presenting too many indicators can cause a problem by creating more confusion than understanding, especially when indicators differ in terms of both the magnitude and direction of change. Decision makers need synthetic information, showing the result of the assessment in an aggregated way and enabling decomposition to lower levels, demonstrating the impact of each of the assessed criteria on the final result [30].
To address these challenges, the creation of sustainability indices through the weighting and aggregation of indicators is proposed, in line with the existing sustainability literature. As demonstrated in Figure 8, the utilization of indices offers decision makers a consolidated view that streamlines the decision-making process and facilitates communication with top management and stakeholders. Moreover, the breakdown of the index into individual indicators facilitates the definition of environmental dimensions in need of improvement, as exemplified by the environmental impact of the CM-flight strategy shown in Figure 5. Furthermore, the approach proposed in this work enables the identification of tradeoffs across various sustainability dimensions (Figure 8), providing a valuable tool to address the inherently intricate and multifaceted challenges of sustainability decision making.
6.2.2. Systemic Approach
As highlighted in Section 2.2, numerous enterprises lack insight into the environmental impacts at the equipment level. Even though maintenance actions may be targeted at the component level, these actions inherently influence the overall health of the system. Given that systems are composed of interconnected components, quantifying the effects of component-level decision making on the sustainability performance of entire systems is crucial. In the context of this work, the use of RAM analysis is proposed as a solution to address this challenge.
Just as indices can be deconstructed into indicators to evaluate improvement in environmental dimensions, RAM analysis facilitates the breakdown of system-level environmental impact into individual contributions from components. In the PoC, this component-level deconstruction was implemented for the CM-flight strategy, leading to the prioritization of the impeller’s environmental sustainability compared to that of the seal, as depicted in Figure 5. Thus, RAM analysis demonstrated its effectiveness in assessing environmental impacts at a more detailed component level, providing a valuable tool to guide decision making with respect to how to allocate internal resources optimally to achieve the company’s impact mitigation goals.
In conclusion, the proposed methodology represents a holistic and systemic approach to facilitate sustainable maintenance decision making. This is achieved by simultaneously addressing various environmental dimensions through the application of sustainability indices and by integrating the environmental impact of equipment at the system level via the utilization of RAM analysis.
6.3. Limitations and Areas for Improvement
In this section, potential limitations and areas for improvement are addressed. As a preliminary PoC aimed at developing and testing the presented methodology, a relatively simple system was examined, and basic indices and indicators were defined. Nonetheless, the application of weighting and aggregation methods to construct environmental indices for effective maintenance decision making is a complex endeavor that warrants further investigation.
Furthermore, the scope of the methodology should be expanded to offer a more comprehensive perspective and facilitate sustainable maintenance decision making. For instance, this work focused solely on assessing the environmental sustainability of maintenance activities and does not address their impacts on the performance of the maintained assets along the TBL. From the standpoint of asset management, it is imperative to integrate all phases of the asset’s life cycle, encompassing the identification of requirements or opportunities, asset acquisition or creation, operations and maintenance, and eventual renewal or disposal [71]. In this context, the adoption of the proposed tool would facilitate the simulation of various scenarios, thereby supporting risk-informed decision making.
Finally, our analysis was limited to environmental and economic sustainability aspects, with no inclusion of social sustainability considerations. Future efforts should aim to incorporate the influence of maintenance activities on the following two key aspects within the proposed approach: (i) the environmental impact of asset operations and (ii) social sustainability.
7. Conclusions and Future Work
Sustainable maintenance represents the forefront of modern maintenance management. It serves a dual purpose. First, it serves as a process able to sustain assets/equipment during their operation while reducing their industrial impacts on the economy, society, and surrounding environment. Second, sustainable maintenance itself must function as a sustainable business practice, aiming to mitigate any negative consequences arising from maintenance activities. Achieving the comprehensive integration of sustainability considerations into maintenance management requires close monitoring and measurement of maintenance impact on the TBL through the appropriate use of (i) indices able to present the result of the assessment in an aggregated and synthetic way and (ii) rational decision-making tools able to simulate different maintenance alternatives considering various sustainability dimensions.
In this context, the present research introduces a sustainable maintenance methodology designed to support maintenance decision making with a focus on environmental sustainability. The methodology employs sustainability indices to provide a consolidated overview of the environmental assessment results while also offering the capability to deconstruct these results into finer levels. The deconstruction process enables the identification of specific environmental dimensions in need of improvement. Additionally, RAM analysis is incorporated for its capacity to break down the system-level environmental impact into discrete contributions from individual components. This enables informed decision making regarding the optimal allocation of internal resources to effectively realize the company’s goals with respect to impact mitigation.
By applying the methodology in a proof of concept (PoC), it has been established that it effectively achieves holistic and systemic approaches to support decision making related to sustainable maintenance. The holistic approach is realized by concurrently addressing diverse environmental dimensions using sustainability indices, while the systemic approach involves incorporating the environmental impact of equipment at the system level through the application of RAM analysis.
Notably, the proposed methodology constitutes a preliminary concept that, in the future, should be further validated and improved. Some identified areas future work summarized as follows:
- Industrial case study: While RAM analysis is a state-of-the-art approach in industry, the effective application of sustainability indices in this context requires further validation. Consequently, an industrial case study must be conducted to verify the effectiveness of the proposed sustainable maintenance methodology.
- Asset management: While this study concentrated on evaluating the environmental sustainability of maintenance activities, it is essential to integrate all phases of an asset’s life cycle. This includes identifying requirements or opportunities, asset acquisition or creation, operations and maintenance, and eventual renewal or disposal.
- Social sustainability: The analysis reported in this work was limited to the realms of environmental and economic sustainability, overlooking the inclusion of social sustainability aspects. To ensure comprehensive decision making, it is necessary to incorporate social sustainability indices within the framework of the proposed methodology.
Author Contributions
Conceptualization, G.B.; Methodology, G.B.; Software, J.D.H.; Validation, J.D.H.; Resources, G.B.; Writing—original draft, G.B.; Writing—review & editing, G.B.; Visualization, J.D.H.; Project administration, G.B. All authors have read and agreed to the published version of the manuscript.
Funding
This research received no external funding.
Institutional Review Board Statement
Not applicable.
Informed Consent Statement
Not applicable.
Data Availability Statement
No new data were created or analyzed in this study. Data sharing is not applicable to this article.
Conflicts of Interest
The authors declare no conflict of interest.
References
- WCED. Our Common Future; Technical Report; World Commission on Environment and Development, Oxford University Press: Oxford, UK, 1987.
- Elkington, J. Accounting for the triple bottom line. Meas. Bus. Excell. 1998, 2, 18–22. [Google Scholar] [CrossRef]
- Epstein, M.J.; Roy, M.J. Sustainability in action: Identifying and measuring the key performance drivers. Long Range Plan. 2001, 34, 585–604. [Google Scholar] [CrossRef]
- EN13306; Maintenance—Maintenance Terminology. British Standards Institution: London, UK, 2017.
- Franciosi, C.; Lambiase, A.; Miranda, S. Sustainable maintenance: A periodic preventive maintenance model with sustainable spare parts management. IFAC-Pap. 2017, 50, 13692–13697. [Google Scholar] [CrossRef]
- Liyanage, J.P.; Badurdeen, F. Strategies for integrating maintenance for sustainable manufacturing. In Proceedings of the Engineering Asset Lifecycle Management: Proceedings of the 4th World Congress on Engineering Asset Management (WCEAM 2009), Athens, Greece, 28–30 September 2009; Springer: Berlin/Heidelberg, Germany, 2010; pp. 308–315. [Google Scholar]
- Jasiulewicz-Kaczmarek, M. The role and contribution of maintenance in sustainable manufacturing. IFAC Proc. Vol. 2013, 46, 1146–1151. [Google Scholar] [CrossRef]
- Jasiulewicz-Kaczmarek, M.; Gola, A. Maintenance 4.0 technologies for sustainable manufacturing-an overview. IFAC-Pap. 2019, 52, 91–96. [Google Scholar] [CrossRef]
- Ajukumar, V.; Gandhi, O. Evaluation of green maintenance initiatives in design and development of mechanical systems using an integrated approach. J. Clean. Prod. 2013, 51, 34–46. [Google Scholar] [CrossRef]
- Franciosi, C.; Voisin, A.; Miranda, S.; Riemma, S.; Iung, B. Measuring maintenance impacts on sustainability of manufacturing industries: From a systematic literature review to a framework proposal. J. Clean. Prod. 2020, 260, 121065. [Google Scholar] [CrossRef]
- Karevan, A.; Vasili, M. Sustainable reliability centered maintenance optimization considering risk attitude. J. Appl. Res. Ind. Eng. 2018, 5, 205–222. [Google Scholar]
- Franciosi, C.; Iung, B.; Miranda, S.; Riemma, S. Maintenance for sustainability in the industry 4.0 context: A scoping literature review. IFAC-Pap. 2018, 51, 903–908. [Google Scholar] [CrossRef]
- Van Horenbeek, A.; Pintelon, L.; Muchiri, P. Maintenance optimization models and criteria. Int. J. Syst. Assur. Eng. Manag. 2010, 1, 189–200. [Google Scholar] [CrossRef]
- Saihi, A.; Ben-Daya, M.; Asad, R.A. Maintenance and sustainability: A systematic review of modeling-based literature. J. Qual. Maint. Eng. 2022, 29, 155–187. [Google Scholar] [CrossRef]
- Wu, J. Landscape sustainability science: Ecosystem services and human well-being in changing landscapes. Landsc. Ecol. 2013, 28, 999–1023. [Google Scholar] [CrossRef]
- Özdemir, E.D.; Härdtlein, M.; Jenssen, T.; Zech, D.; Eltrop, L. A confusion of tongues or the art of aggregating indicators—Reflections on four projective methodologies on sustainability measurement. Renew. Sustain. Energy Rev. 2011, 15, 2385–2396. [Google Scholar] [CrossRef]
- Wu, J.; Wu, T. Sustainability indicators and indices: An overview. In Handbook of Sustainability Management; Imperial College Press: London, UK, 2012; pp. 65–86. [Google Scholar]
- Böhringer, C.; Jochem, P.E. Measuring the immeasurable—A survey of sustainability indices. Ecol. Econ. 2007, 63, 1–8. [Google Scholar] [CrossRef]
- Barbieri, G.; Fantuzzi, C. Design of cyber-physical systems: Definition and metamodel for reusable resources. In Proceedings of the 21st International Conference on Emerging Technologies and Factory Automation (ETFA), Berlin, Germany, 6–9 September 2016; pp. 1–9. [Google Scholar]
- Sharma, R.K.; Kumar, S. Performance modeling in critical engineering systems using RAM analysis. Reliab. Eng. Syst. Saf. 2008, 93, 913–919. [Google Scholar] [CrossRef]
- Morales, J.M.; Barbieri, G.; Vargas, H.I.; Villegas, J.S.; Parra, C. Integration of BIM Modeling and RAM Analysis: A Proof of Concept. IFAC-Pap. 2022, 55, 205–210. [Google Scholar] [CrossRef]
- Yu, T.; Zhu, C.; Chang, Q.; Wang, J. Imperfect corrective maintenance scheduling for energy efficient manufacturing systems through online task allocation method. J. Manuf. Syst. 2019, 53, 282–290. [Google Scholar] [CrossRef]
- Parida, A. Asset performance assessment. In Asset Management: The State of the Art in Europe from a Life Cycle Perspective; Springer: Dordrecht, The Netherlands, 2012; pp. 101–113. [Google Scholar]
- Muchiri, P.; Pintelon, L.; Gelders, L.; Martin, H. Development of maintenance function performance measurement framework and indicators. Int. J. Prod. Econ. 2011, 131, 295–302. [Google Scholar] [CrossRef]
- Navas, C.F.E.; Yepes, A.E.; Abolghasem, S.; Barbieri, G. MTConnect-based decision support system for local machine tool monitoring. Procedia Comput. Sci. 2021, 180, 69–78. [Google Scholar] [CrossRef]
- Sanchez-Londono, D.; Barbieri, G.; Fumagalli, L. Smart retrofitting in maintenance: A systematic literature review. J. Intell. Manuf. 2023, 34, 1–19. [Google Scholar] [CrossRef]
- Contreras, J.; Parra, C.; Márquez, A.C.; González-Prida, V.; Kristjanpoller, F.A.; Viveros, P. Model of a Performance Measurement System for Maintenance Management. In Optimum Decision Making in Asset Management; IGI Global: Hershey, PA, USA, 2017; pp. 194–214. [Google Scholar]
- Sari, E.; Shaharoun, A.M.; Ma’aram, A.; Yazid, A.M. Sustainable maintenance performance measures: A pilot survey in Malaysian automotive companies. Procedia CIRP 2015, 26, 443–448. [Google Scholar] [CrossRef]
- Costantino, F.; Di Gravio, G.; Tronci, M. Integrating environmental assessment of failure modes in maintenance planning of production systems. Appl. Mech. Mater. 2013, 295, 651–660. [Google Scholar] [CrossRef]
- Jasiulewicz-Kaczmarek, M.; Żywica, P. The concept of maintenance sustainability performance assessment by integrating balanced scorecard with non-additive fuzzy integral. Eksploat. Niezawodn. 2018, 20, 650–661. [Google Scholar] [CrossRef]
- Ghaleb, M.; Taghipour, S. Assessing the impact of maintenance practices on asset’s sustainability. Reliab. Eng. Syst. Saf. 2022, 228, 108810. [Google Scholar] [CrossRef]
- Wang, H.; Pham, H. Reliability and Optimal Maintenance; Springer: Berlin/Heidelberg, Germany, 2006; Volume 14197. [Google Scholar]
- Van Horenbeek, A.; Kellens, K.; Pintelon, L.; Duflou, J.R. Economic and environmental aware maintenance optimization. Procedia CIRP 2014, 15, 343–348. [Google Scholar] [CrossRef][Green Version]
- Afrinaldi, F.; Tasman, A.M.; Zhang, H.C.; Hasan, A. Minimizing economic and environmental impacts through an optimal preventive replacement schedule: Model and application. J. Clean. Prod. 2017, 143, 882–893. [Google Scholar] [CrossRef]
- Nezami, F.G.; Yildirim, M.B. A sustainability approach for selecting maintenance strategy. Int. J. Sustain. Eng. 2013, 6, 332–343. [Google Scholar] [CrossRef]
- Muhammed Nor, M.; Yusop, A.; Hamidi, M.; Omar, M.; Abdul Hamid, N.; Wan Mohamed, W. Alternative Railway Tools and Sustainability in RAMS: A Review. In Technological Advancement in Instrumentation & Human Engineering: Selected Papers from ICMER 2021; Springer: Singapore, 2022; pp. 541–554. [Google Scholar]
- Soltanali, H.; Garmabaki, A.; Thaduri, A.; Parida, A.; Kumar, U.; Rohani, A. Sustainable production process: An application of reliability, availability, and maintainability methodologies in automotive manufacturing. Proc. Inst. Mech. Eng. Part O J. Risk Reliab. 2019, 233, 682–697. [Google Scholar] [CrossRef]
- Ahmed, K.M.U.; Bollen, M.H.; Alvarez, M. A review of data centers energy consumption and reliability modeling. IEEE Access 2021, 9, 152536–152563. [Google Scholar] [CrossRef]
- Wang, R.; Xu, J.; Zhang, W.; Gao, J.; Li, Y.; Chen, F. Reliability analysis of complex electromechanical systems: State of the art, challenges, and prospects. Qual. Reliab. Eng. Int. 2022, 38, 3935–3969. [Google Scholar] [CrossRef]
- Crespo Marquez, A.; Iung, B. A structured approach for the assessment of system availability and reliability using Monte Carlo simulation. J. Qual. Maint. Eng. 2007, 13, 125–136. [Google Scholar] [CrossRef]
- Calixto, E. Gas and Oil Reliability Engineering: Modeling and Analysis; Gulf Professional Publishing: Houston, TX, USA, 2016. [Google Scholar]
- Al-Douri, A.; Kazantzi, V.; Currie-Gregg, N.; El-Halwagi, M.M. Integrating uncertainty quantification in reliability, availability, and maintainability (RAM) analysis in the conceptual and preliminary stages of chemical process design. Chem. Eng. Res. Des. 2021, 167, 281–291. [Google Scholar] [CrossRef]
- Regattieri, A.; Giazzi, A.; Gamberi, M.; Gamberini, R. An innovative method to optimize the maintenance policies in an aircraft: General framework and case study. J. Air Transp. Manag. 2015, 44, 8–20. [Google Scholar] [CrossRef]
- Setia, F.; Wibawa, A.; Yuniarto, M.N. Plant Maintenance Budgeting Prioritization Based on Reliability Prediction of Repairable System. In Recent Advances in Mechanical Engineering: Select Proceedings of ICOME 2021; Springer: Berlin/Heidelberg, Germany, 2022; pp. 52–60. [Google Scholar]
- Roda, I.; Arena, S.; Macchi, M.; Orrù, P.F. Total cost of ownership driven methodology for predictive maintenance implementation in industrial plants. In Advances in Production Management Systems, Production Management for the Factory of the Future: IFIP WG 5.7 International Conference, APMS 2019, Austin, TX, USA, 1–5 September 2019; Proceedings, Part I; Springer: Berlin/Heidelberg, Germany, 2019; pp. 315–322. [Google Scholar]
- Gallopin, G.C. Indicators and their use: Information for decision-making. Sustain. Crit. Concepts Soc. Sci. 2005, 3, 257–273. [Google Scholar]
- Nardo, M.; Saisana, M.; Saltelli, A.; Tarantola, S. Tools for composite indicators building. Eur. Com. ISPRA 2005, 15, 19–20. [Google Scholar]
- Jollands, N. How to aggregate sustainable development indicators: A proposed framework and its application. Int. J. Agric. Resour. Gov. Ecol. 2006, 5, 18–34. [Google Scholar] [CrossRef]
- Gan, X.; Fernandez, I.C.; Guo, J.; Wilson, M.; Zhao, Y.; Zhou, B.; Wu, J. When to use what: Methods for weighting and aggregating sustainability indicators. Ecol. Indic. 2017, 81, 491–502. [Google Scholar] [CrossRef]
- ISO12489; Petroleum, Petrochemical and Natural Gas Industries—Reliability Modelling and Calculation of Safety Systems. British Standards Institution: London, UK, 2016.
- Cardellini, V.; Casalicchio, E.; Branco, K.; Estrella, J.C.; Monaco, F.J. Performance and Dependability in Service Computing: Concepts, Techniques and Research Directions; IGI Publishing: Hershey, PA, USA, 2012. [Google Scholar]
- Ben-Daya, M.; Kumar, U.; Murthy, D.P. Introduction to Maintenance Engineering: Modelling, Optimization and Management; John Wiley & Sons: Hoboken, NJ, USA, 2016. [Google Scholar]
- Marseguerra, M.; Zio, E. Optimizing maintenance and repair policies via a combination of genetic algorithms and Monte Carlo simulation. Reliab. Eng. Syst. Saf. 2000, 68, 69–83. [Google Scholar] [CrossRef]
- IEC62551; Analysis Techniques for Dependability—Petri Nets Techniques. International Electrotechnical Commission: London, UK, 2012.
- Marquez, A.C.; Heguedas, A.S.; Iung, B. Monte Carlo-based assessment of system availability. A case study for cogeneration plants. Reliab. Eng. Syst. Saf. 2005, 88, 273–289. [Google Scholar] [CrossRef]
- Murphy, K.E.; Carter, C.M.; Grimes, E.A.; Malerich, A.W. RAPTOR 7.0; TutorialWorkbook; ARINC: Annapolis, MD, USA, 2007. [Google Scholar]
- Joung, C.B.; Carrell, J.; Sarkar, P.; Feng, S.C. Categorization of indicators for sustainable manufacturing. Ecol. Indic. 2013, 24, 148–157. [Google Scholar] [CrossRef]
- GRI. The Global Standards for Sustainability Impacts; Technical Report; Global Reporting Initiative: Boston, MA, USA, 2016. [Google Scholar]
- ISO14001; Environmental Management Systems—Requirements with Guidance for Use. British Standards Institution: London, UK, 2015.
- Veleva, V.; Ellenbecker, M. Indicators of sustainable production: Framework and methodology. J. Clean. Prod. 2001, 9, 519–549. [Google Scholar] [CrossRef]
- EN15341; Maintenance—Maintenance Key Performance Indicators. British Standards Institution: London, UK, 2019.
- Hammond, A.L.; Institute, W.R. Environmental Indicators: A Systematic Approach to Measuring and Reporting on Environmental Policy Performance in the Context of Sustainable Development; World Resources Institute: Washington, DC, USA, 1995; Volume 36. [Google Scholar]
- Moncrief, E.; Schroder, D.; Reynolds, M. Production Spare Parts; Industrial Press: New York, NY, USA, 2005. [Google Scholar]
- Horne, R.; Grant, T.; Verghese, K. Life CYCLE assessment: Principles, Practice, and Prospects; Csiro Publishing: Clayton, Australia, 2009. [Google Scholar]
- Ghaleb, M.; Taghipour, S. Evidence-based study of the impacts of maintenance practices on asset sustainability. Int. J. Prod. Res. 2022, 61, 8719–8750. [Google Scholar] [CrossRef]
- EEA. Glossary, Eurostat—Statistic Explained; European Environment Agency: Copenhagen, Denmark, 2018.
- Esty, D.C.; Levy, M.A.; Srebotnjak, T.; de Sherbinin, A.; Kim, C.H.; Anderson, B. Pilot 2006 Environmental Performance Index; Yale Center for Environmental Law & Policy: New Haven, CT, USA, 2006; Volume 356. [Google Scholar]
- Clark, D.; Scott, G. Improve FCCU Profitability—Bottoms System Upgrades; Technical Report; Petroleum Technology Quarterly: Houston, TX, USA, 2003. [Google Scholar]
- OREDA. Offshore Reliability Data Handbook; Sintef: Trondheim, Norway, 2015.
- Griffiths-Sattenspiel, B.; Wilson, W. The Carbon Footprint of Water; River Network: Portland, OR, USA, 2009. [Google Scholar]
- GFMAM. The Asset Management Landscape; Technical Report; The Global Forum on Maintenance and Asset Management: Toronto, ON, Canada, 2014. [Google Scholar]


Disclaimer/Publisher’s Note: The statements, opinions and data contained in all publications are solely those of the individual author(s) and contributor(s) and not of MDPI and/or the editor(s). MDPI and/or the editor(s) disclaim responsibility for any injury to people or property resulting from any ideas, methods, instructions or products referred to in the content. |
© 2024 by the authors. Licensee MDPI, Basel, Switzerland. This article is an open access article distributed under the terms and conditions of the Creative Commons Attribution (CC BY) license (https://creativecommons.org/licenses/by/4.0/).