

Assessment of Urban Wind Potential and the Stakeholders Involved in Energy Decision-Making

 ,
,  ,
,  and
and
Abstract
1. Introduction
2. Materials and Methods
2.1. Phase 1—An Analysis of Urban Wind Energy
- Site characterization and selection
- Wind energy analysis
- The Selection of small wind turbines
- Annual energy production estimation
- Economic evaluation
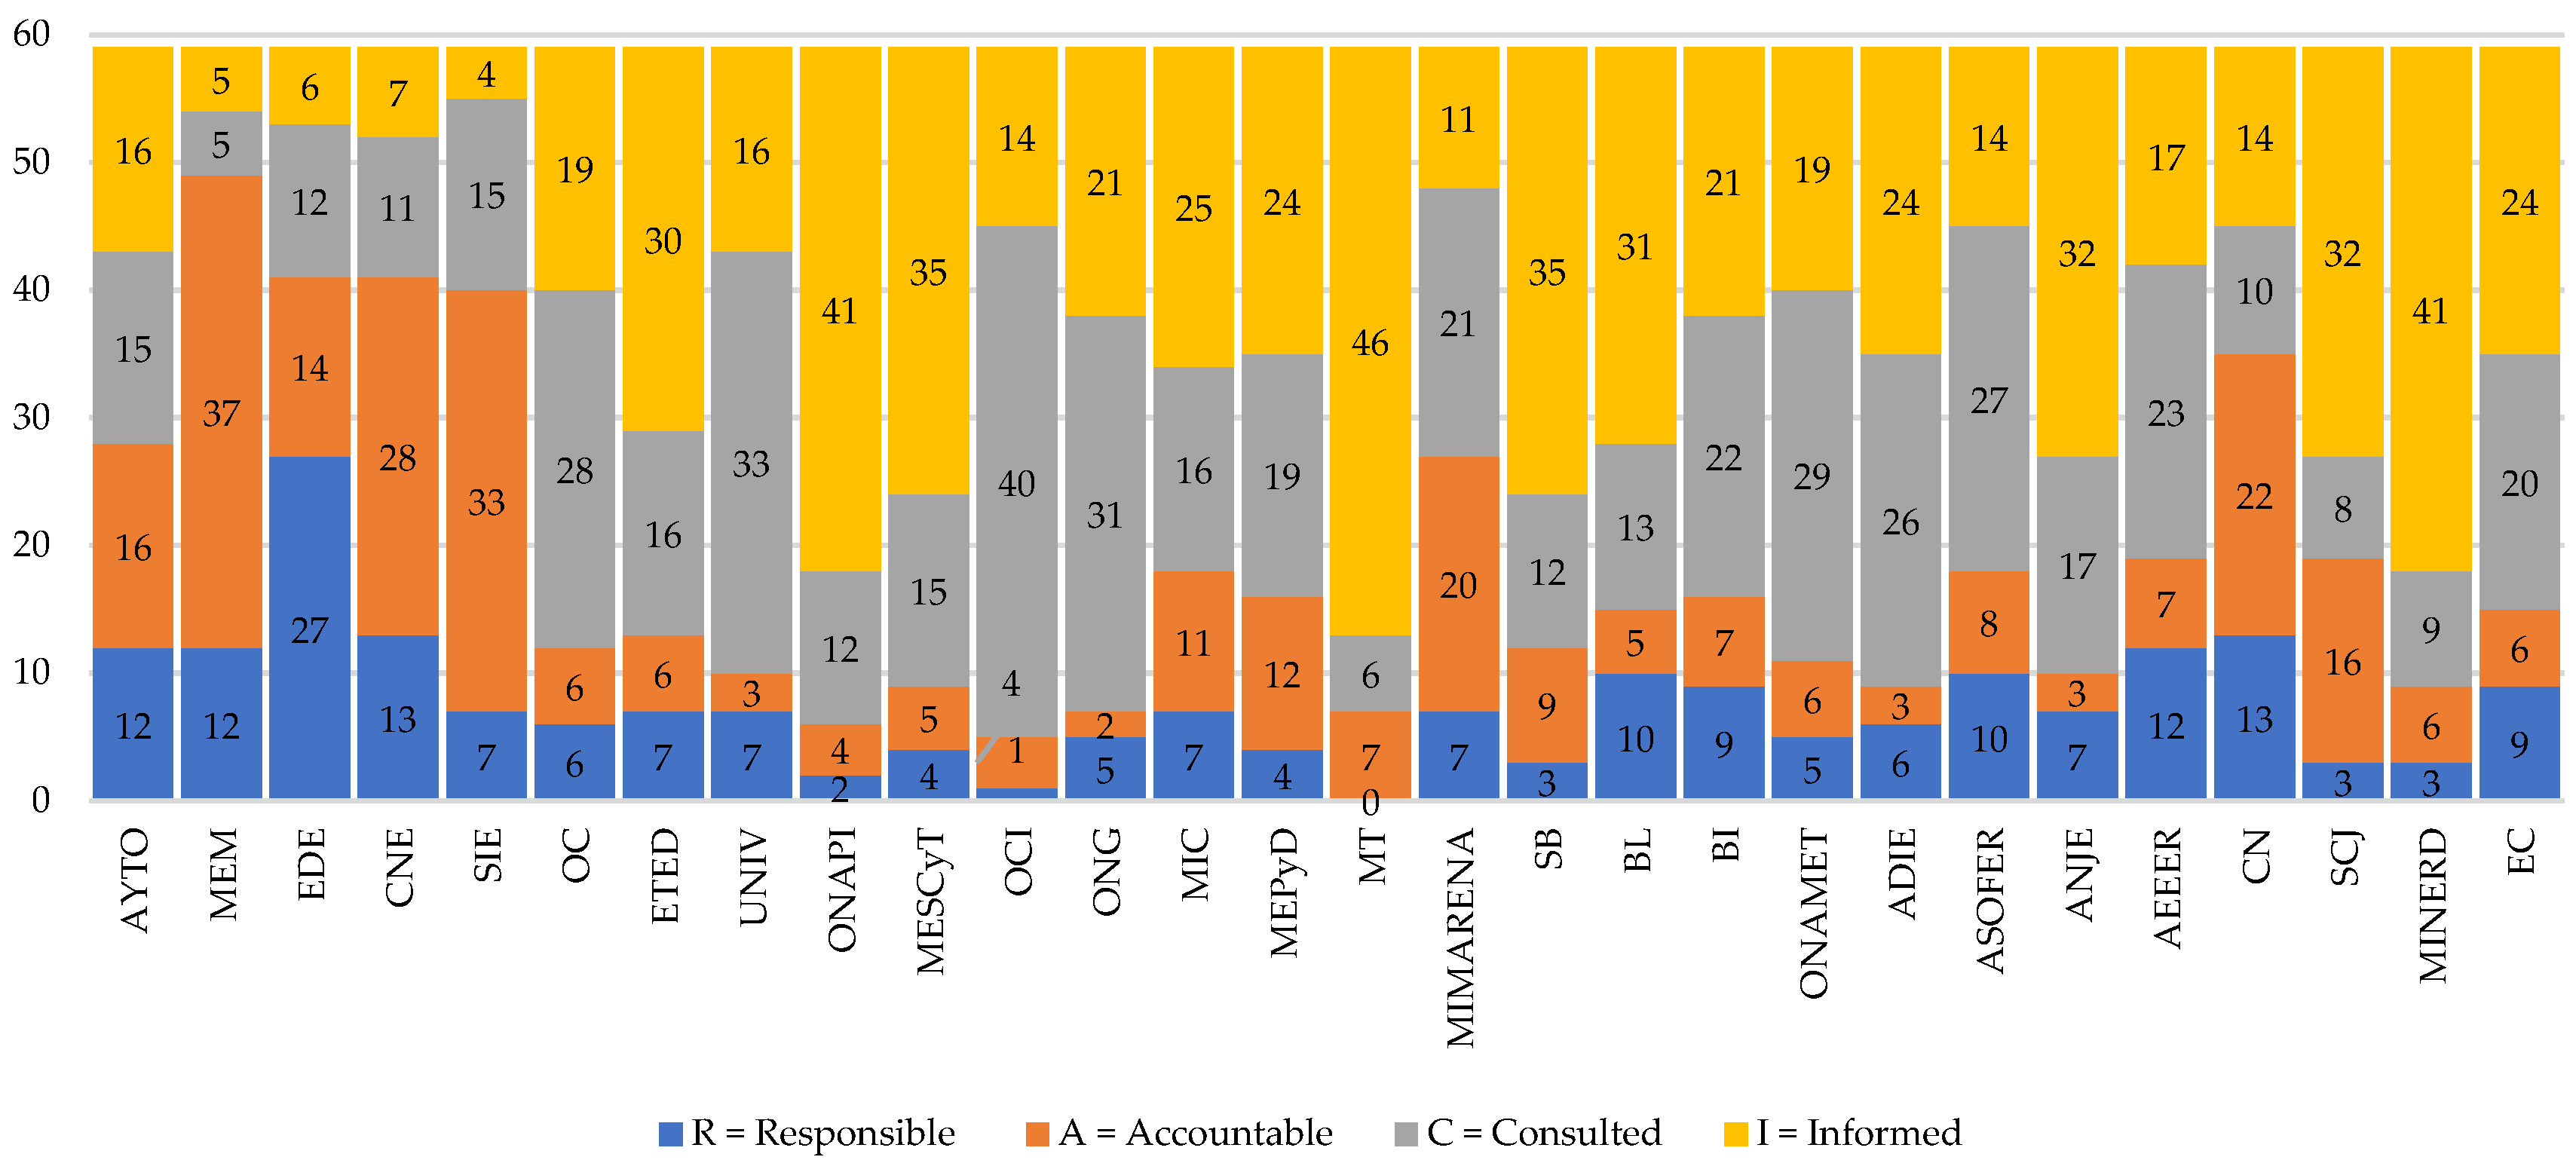
2.2. Phase 2—Stakeholder Analysis through RACI Matrix
- -
- Responsible: someone who bears the responsibility of seeing a task through to completion;
- -
- Accountable: This means that everyone in the team is accountable for whatever work that is assigned to them. Additionally, this person is able to decide on matters pertaining to the assignment. This person is accountable for all of his decisions, which makes this role extremely important;
- -
- Consulted: as they will be responsible for providing information on the project under work, those who are selected for this role possess expertise in their respective fields;
- -
- Informed: those who receive regular updates on developments.
- Rapid network assessment and experts interviews
- RACI Matrix Elaboration
- -
- An accountable stakeholder (quadrant I) was awarded a score of 4, as shown in Equation (1), where and are the coordinates of the stakeholder in the RACI matrix.
- -
- A responsible stakeholder (quadrant II) was awarded a score of 3, as shown in Equation (2).
- -
- A consulted stakeholder (quadrant III) was awarded a score of 2, as shown in Equation (3).
- -
- An informed stakeholder (quadrant IV) was awarded a score of 1, as shown in Equation (4).
- Mapping the RACI matrix
3. Results and Discussion
4. Conclusions
Author Contributions
Funding
Institutional Review Board Statement
Informed Consent Statement
Data Availability Statement
Acknowledgments
Conflicts of Interest
References
- S&P Global. Climate Essentials. ArcGIS StoryMaps. Available online: https://storymaps.arcgis.com/collections/1e05ebf390554cb8b7cefa80e521afda (accessed on 17 September 2023).
- Murugesan, M.; Reedman, L.; Brinsmead, T.S.; Rifkin, W.; Gordon, J.; Megharaj, M. Modelling least-cost technology pathways to decarbonise the New South Wales energy system by 2050. Renew. Sustain. Energy Transit. 2023, 3, 100041. [Google Scholar] [CrossRef]
- Karkowska, R.; Urjasz, S. How does the Russian-Ukrainian war change connectedness and hedging opportunities? Comparison between dirty and clean energy markets versus global stock indices. J. Int. Financ. Mark. Inst. Money 2023, 85, 101768. [Google Scholar] [CrossRef]
- Steffen, B.; Patt, A. A historical turning point? Early evidence on how the Russia-Ukraine war changes public support for clean energy policies. Energy Res. Soc. Sci. 2022, 91, 102758. [Google Scholar] [CrossRef]
- Zhou, E.; Wang, X. Dynamics of systemic risk in European gas and oil markets under the Russia–Ukraine conflict: A quantile regression neural network approach. Energy Rep. 2023, 9, 3956–3966. [Google Scholar] [CrossRef]
- Martins, F.F.; Felgueiras, C.; Caetano, N.S. Macro modeling of electricity price towards SDG7. Energy Rep. 2022, 8, 614–622. [Google Scholar] [CrossRef]
- LAZARD. Levelized Cost Of Energy. Available online: http://www.lazard.com/perspective/levelized-cost-of-energy-levelized-cost-of-storage-and-levelized-cost-of-hydrogen/ (accessed on 1 October 2022).
- IRENA. Renewable Power Generation Costs in 2022. Available online: https://www.irena.org/Publications/2023/Aug/Renewable-Power-Generation-Costs-in-2022 (accessed on 17 September 2023).
- Schlindwein, L.F.; Montalvo, C. Energy citizenship: Accounting for the heterogeneity of human behaviours within energy transition. Energy Policy 2023, 180, 113662. [Google Scholar] [CrossRef]
- Zou, Y.; Wang, M. Does environmental regulation improve energy transition performance in China? Environ. Impact Assess. Rev. 2024, 104, 107335. [Google Scholar] [CrossRef]
- ICSC-CITIES ICSC-CITIES|2023 VI Ibero-American Congress of Smart Cities. Available online: http://icsc-cities.com/ (accessed on 28 October 2023).
- van der Meij, M.G.; Fraaije, A.; Broerse, J.E.W.; Kupper, F. Guiding visions of corporate smart city innovators: Identifying opportunities for participatory futuring. Futures 2023, 154, 103269. [Google Scholar] [CrossRef]
- DOE. Distributed Wind Market Report: 2022 Edition. Available online: https://www.energy.gov/eere/wind/articles/distributed-wind-market-report-2022-edition (accessed on 10 March 2023).
- Simões, T.; Estanqueiro, A. A new methodology for urban wind resource assessment. Renew. Energy 2016, 89, 598–605. [Google Scholar] [CrossRef]
- Fields, J.; Oteri, F.; Preus, R.; Baring-Gould, I. Deployment of Wind Turbines in the Built Environment: Risks, Lessons, and Recommended Practices; No. NREL/TP--5000-65622; National Renewable Energy Lab. (NREL): Golden, CO, USA, 2016; p. 1260340.
- Lens. Scholar Search Results. The Lens—Free & Open Patent and Scholarly Search. Available online: https://www.lens.org/lens/search/scholar/list?publication_type.must=journal%20article&preview=true&q=urban%20wind%20energy&publishedDate.from=2015-01-01&publishedDate.to=2022-12-31 (accessed on 27 October 2023).
- VOSviewer. VOSviewer—Visualizing Scientific Landscapes. VOSviewer. Available online: https://www.vosviewer.com// (accessed on 11 June 2023).
- O’Regan, A.C.; Nyhan, M.M. Towards sustainable and net-zero cities: A review of environmental modelling and monitoring tools for optimizing emissions reduction strategies for improved air quality in urban areas. Environ. Res. 2023, 231, 116242. [Google Scholar] [CrossRef]
- Wang, Q.; Wang, J.; Hou, Y.; Yuan, R.; Luo, K.; Fan, J. Micrositing of roof mounting wind turbine in urban environment: CFD simulations and lidar measurements. Renew. Energy 2018, 115, 1118–1133. [Google Scholar] [CrossRef]
- Rezaeiha, A.; Montazeri, H.; Blocken, B. A framework for preliminary large-scale urban wind energy potential assessment: Roof-mounted wind turbines. Energy Convers. Manag. 2020, 214, 112770. [Google Scholar] [CrossRef]
- Fan, X.; Ge, M.; Tan, W.; Li, Q. Impacts of coexisting buildings and trees on the performance of rooftop wind turbines: An idealized numerical study. Renew. Energy 2021, 177, 164–180. [Google Scholar] [CrossRef]
- Juan, Y.-H.; Wen, C.-Y.; Chen, W.-Y.; Yang, A.-S. Numerical assessments of wind power potential and installation arrangements in realistic highly urbanized areas. Renew. Sustain. Energy Rev. 2021, 135, 110165. [Google Scholar] [CrossRef]
- Zagubień, A.; Wolniewicz, K. Energy Efficiency of Small Wind Turbines in an Urbanized Area—Case Studies. Energies 2022, 15, 5287. [Google Scholar] [CrossRef]
- Vallejo, A.; Herrera, I.; Castellanos, J.; Pereyra, C.; Garabitos, E. Urban Wind Potential Analysis: Case Study of Wind Turbines Integrated into a Building Using On-Site Measurements and CFD Modelling. In Proceedings of the 36th International Conference on Efficiency, Cost, Optimization, Simulation and Environmental Impact of Energy Systems (ECOS 2023), Las Palmas De Gran Canaria, Spain, 25–30 June 2023; pp. 534–546. [Google Scholar]
- Wilke, A.; Shen, Z.; Ritter, M. How Much Can Small-Scale Wind Energy Production Contribute to Energy Supply in Cities? A Case Study of Berlin. Energies 2021, 14, 5523. [Google Scholar] [CrossRef]
- Gil-García, I.C.; García-Cascales, M.S.; Molina-García, A. Urban Wind: An Alternative for Sustainable Cities. Energies 2022, 15, 4759. [Google Scholar] [CrossRef]
- Vallejo-Díaz, A.; Herrera-Moya, I.; Fernández-Bonilla, A.; Pereyra-Mariñez, C. Wind energy potential assessment of selected locations at two major cities in the Dominican Republic, toward energy matrix decarbonization, with resilience approach. Therm. Sci. Eng. Prog. 2022, 32, 101313. [Google Scholar] [CrossRef]
- Islam, M.R.; Saidur, R.; Rahim, N.A. Assessment of wind energy potentiality at Kudat and Labuan, Malaysia using Weibull distribution function. Energy 2011, 36, 985–992. [Google Scholar] [CrossRef]
- Vallejo Díaz, A.; Herrera Moya, I.; Pereyra Mariñez, C.; Garabitos Lara, E.; Casilla Victorino, C. Key factors influencing urban wind energy: A case study from the Dominican Republic. Energy Sustain. Dev. 2023, 73, 165–173. [Google Scholar] [CrossRef]
- NASA. Data Access Viewer. Available online: https://power.larc.nasa.gov/data-access-viewer/ (accessed on 20 September 2022).
- Hirmer, S.A.; George-Williams, H.; Rhys, J.; McNicholl, D.; McCulloch, M. Stakeholder decision-making: Understanding Sierra Leone’s energy sector. Renew. Sustain. Energy Rev. 2021, 145, 111093. [Google Scholar] [CrossRef]
- IAEA. Enhanced Electricity System Analysis for Decision Making—A Reference Book; IAEA: Vienna, Austria, 2000. [Google Scholar]
- Tajbakhsh, A.; Shamsi, A. Sustainability performance of countries matters: A non-parametric index. J. Clean. Prod. 2019, 224, 506–522. [Google Scholar] [CrossRef]
- Craig, P.P.; Gadgil, A.; Koomey, J.G. What can history teach us? A retrospective examination of long-term energy forecasts for the United States. Annu. Rev. Energy Environ. 2002, 27, 83–118. [Google Scholar] [CrossRef]
- Kivits, R.; Sawang, S. Stakeholder Theory. In The Dynamism of Stakeholder Engagement: A Case Study of the Aviation Industry; Kivits, R., Sawang, S., Eds.; Contributions to Management Science; Springer International Publishing: Cham, Switzerland, 2021; pp. 1–8. ISBN 978-3-030-70428-5. [Google Scholar]
- Read, L.; Madani, K.; Mokhtari, S.; Hanks, C. Stakeholder-driven multi-attribute analysis for energy project selection under uncertainty. Energy 2017, 119, 744–753. [Google Scholar] [CrossRef]
- Pollitt, M.G. In Search of ‘Good’ Energy Policy: The Social Limits to Technological Solutions to Energy and Climate Problems; Energy Policy Research Group, Cambridge Judge Business School, University of Cambridge: Cambridge, UK, 2015. [Google Scholar]
- Ludovico, N.; Dessi, F.; Bonaiuto, M. Stakeholders Mapping for Sustainable Biofuels: An Innovative Procedure Based on Computational Text Analysis and Social Network Analysis. Sustainability 2020, 12, 10317. [Google Scholar] [CrossRef]
- Widya Yudha, S.; Tjahjono, B. Stakeholder Mapping and Analysis of the Renewable Energy Industry in Indonesia. Energies 2019, 12, 602. [Google Scholar] [CrossRef]
- Kantamaturapoj, K.; Chanchitpricha, C.; Hongsuwan, P.; Suebsing, P.; Thaweesuk, S.; Wibulpolprasert, S. A framework of stakeholder analysis for public participation in EIA process: A case study of Thailand. Impact Assess. Proj. Apprais. 2023, 41, 442–462. [Google Scholar] [CrossRef]
- Vallejo, A.; Herrera, I.; Malmquist, A. Building-mounted wind energy potential in Santo Domingo, the Dominican Republic, a contribution for resilient decarbonisation. In Proceedings of the ECOS 2022—The 35th International Conference on Efficiency, Cost, Optimization, Simulation and Environmental Impact of Energy Systems, Copenhagen, Denmark, 7–12 July 2022; Elmegaard, B., Sciubba, E., MBlanco-Marigorta, A., Jensen, J.K., Markussen, W.B., Meesenburg, W., Kermani, N.A., Zhu, T., Kofler, R., Eds.; Danmarks Tekniske Universitet (DTU): Lyngby, Denmark, 2022; pp. 1925–1936. Available online: https://ecos2022.dtu.dk/ (accessed on 9 December 2023).
- Arteaga-López, E.; Ángeles-Camacho, C.; Bañuelos-Ruedas, F. Advanced methodology for feasibility studies on building-mounted wind turbines installation in urban environment: Applying CFD analysis. Energy 2019, 167, 181–188. [Google Scholar] [CrossRef]
- Gagliano, A.; Nocera, F.; Patania, F.; Capizzi, A. Assessment of micro-wind turbines performance in the urban environments: An aided methodology through geographical information systems. Int J Energy Environ. Eng. 2013, 4, 43. [Google Scholar] [CrossRef]
- Jervase, J.A.; Al-Lawati, A.M. Wind energy potential assessment for the Sultanate of Oman. Renew. Sustain. Energy Rev. 2012, 16, 1496–1507. [Google Scholar] [CrossRef]
- Potić, I.; Joksimović, T.; Milinčić, U.; Kićović, D.; Milinčić, M. Wind energy potential for the electricity production—Knjaževac Municipality case study (Serbia). Energy Strategy Rev. 2021, 33, 100589. [Google Scholar] [CrossRef]
- SkyscraperPage. Database—SkyscraperPage.com. SkyscraperPage. Available online: https://skyscraperpage.com/cities/ (accessed on 2 May 2021).
- CIA. Dominican Republic—Details. The World Factbook 2023. Central Intelligence Agency. Available online: https://www.cia.gov/the-world-factbook/countries/dominican-republic/locator-map/ (accessed on 14 January 2024).
- Alberto Then, N.M.; Delanoy, R.; Rodríguez Alberto, D.; Méndez Henández, R.; Díaz Rizo, O.; Bello, L. Heavy Metal Pollution Assessment in the Agricultural Soils of Bonao, Dominican Republic. Sustainability 2023, 15, 16510. [Google Scholar] [CrossRef]
- Ruiz-Valero, L.; Arranz, B.; Faxas-Guzmán, J.; Flores-Sasso, V.; Medina-Lagrange, O.; Ferreira, J. Monitoring of a Living Wall System in Santo Domingo, Dominican Republic, as a Strategy to Reduce the Urban Heat Island. Buildings 2023, 13, 1222. [Google Scholar] [CrossRef]
- Gualtieri, G.; Secci, S. Wind shear coefficients, roughness length and energy yield over coastal locations in Southern Italy. Renew. Energy 2011, 36, 1081–1094. [Google Scholar] [CrossRef]
- Vita, G.; Shu, Z.; Jesson, M.; Quinn, A.; Hemida, H.; Sterling, M.; Baker, C. On the assessment of pedestrian distress in urban winds. J. Wind Eng. Ind. Aerodyn. 2020, 203, 104200. [Google Scholar] [CrossRef]
- IEC 61400-2:2013. 2013. Available online: https://webstore.iec.ch/publication/5433 (accessed on 9 December 2023).
- Cheng, C.; Gutierrez, N.P.; Blakers, A.; Stocks, M. GIS-based solar and wind resource assessment and least-cost 100% renewable electricity modelling for Bolivia. Energy Sustain. Dev. 2022, 69, 134–149. [Google Scholar] [CrossRef]
- Zhang, Y.; Cao, S.; Zhao, L.; Cao, J. A case application of WRF-UCM models to the simulation of urban wind speed profiles in a typhoon. J. Wind Eng. Ind. Aerodyn. 2022, 220, 104874. [Google Scholar] [CrossRef]
- Toja-Silva, F.; Kono, T.; Peralta, C.; Lopez-Garcia, O.; Chen, J. A review of computational fluid dynamics (CFD) simulations of the wind flow around buildings for urban wind energy exploitation. J. Wind Eng. Ind. Aerodyn. 2018, 180, 66–87. [Google Scholar] [CrossRef]
- Du, S.; Zhang, X.; Jin, X.; Zhou, X.; Shi, X. A review of multi-scale modelling, assessment, and improvement methods of the urban thermal and wind environment. Build. Environ. 2022, 213, 108860. [Google Scholar] [CrossRef]
- Al-Quraan, A.; Stathopoulos, T.; Pillay, P. Comparison of wind tunnel and on site measurements for urban wind energy estimation of potential yield. J. Wind Eng. Ind. Aerodyn. 2016, 158, 1–10. [Google Scholar] [CrossRef]
- Mittal, H.; Sharma, A.; Gairola, A. A review on the study of urban wind at the pedestrian level around buildings. J. Build. Eng. 2018, 18, 154–163. [Google Scholar] [CrossRef]
- Mikhailuta, S.V.; Lezhenin, A.A.; Pitt, A.; Taseiko, O.V. Urban wind fields: Phenomena in transformation. Urban Clim. 2017, 19, 122–140. [Google Scholar] [CrossRef]
- Walker, S.L. Building mounted wind turbines and their suitability for the urban scale—A review of methods of estimating urban wind resource. Energy Build. 2011, 43, 1852–1862. [Google Scholar] [CrossRef]
- Byrne, R.; Hewitt, N.J.; Griffiths, P.; MacArtain, P. An assessment of the mesoscale to microscale influences on wind turbine energy performance at a peri-urban coastal location from the Irish wind atlas and onsite LiDAR measurements. Sustain. Energy Technol. Assess. 2019, 36, 100537. [Google Scholar] [CrossRef]
- Stathopoulos, T.; Alrawashdeh, H.; Al-Quraan, A.; Blocken, B.; Dilimulati, A.; Paraschivoiu, M.; Pilay, P. Urban wind energy: Some views on potential and challenges. J. Wind Eng. Ind. Aerodyn. 2018, 179, 146–157. [Google Scholar] [CrossRef]
- Kc, A.; Whale, J.; Urmee, T. Urban wind conditions and small wind turbines in the built environment: A review. Renew. Energy 2019, 131, 268–283. [Google Scholar] [CrossRef]
- Tasneem, Z.; Al Noman, A.; Das, S.K.; Saha, D.K.; Islam, R.; Ali, F.; Badal, F.R.; Ahamed, H.; Moyeen, S.I.; Alam, F. An analytical review on the evaluation of wind resource and wind turbine for urban application: Prospect and challenges. Dev. Built Environ. 2020, 4, 100033. [Google Scholar] [CrossRef]
- Micallef, D.; Van Bussel, G. A Review of Urban Wind Energy Research: Aerodynamics and Other Challenges. Energies 2018, 11, 2204. [Google Scholar] [CrossRef]
- Eltayesh, A.; Castellani, F.; Natili, F.; Burlando, M.; Khedr, A. Aerodynamic upgrades of a Darrieus vertical axis small wind turbine. Energy Sustain. Dev. 2023, 73, 126–143. [Google Scholar] [CrossRef]
- Dai, K.; Bergot, A.; Liang, C.; Xiang, W.-N.; Huang, Z. Environmental issues associated with wind energy—A review. Renew. Energy 2015, 75, 911–921. [Google Scholar] [CrossRef]
- Aldersey-Williams, J.; Rubert, T. Levelised cost of energy—A theoretical justification and critical assessment. Energy Policy 2019, 124, 169–179. [Google Scholar] [CrossRef]
- Brugha, R.; Varvasovszky, Z. Stakeholder analysis: A review. Health Policy Plan. 2000, 15, 239–246. [Google Scholar] [CrossRef]
- Mori, N. Roles of stakeholders in strategic decision-making of microfinance organizations. Int. Bus. Econ. Res. J. 2010, 9, 51–64. [Google Scholar] [CrossRef]
- Chai, J.; Liu, J.N.K.; Ngai, E.W.T. Application of decision-making techniques in supplier selection: A systematic review of literature. Expert Syst. Appl. 2013, 40, 3872–3885. [Google Scholar] [CrossRef]
- Metze, T.A.P.; van den Broek, J.; van Est, R.; Cuppen, E.H.W.J. Participatory repertoires for aligning policy and society: An analysis of Dutch stakeholder views on deep geothermal energy. Energy Res. Soc. Sci. 2023, 98, 103019. [Google Scholar] [CrossRef]
- Tomás, M.; García-Muros, X.; Alonso-Epelde, E.; Arto, I.; Rodríguez-Zúñiga, A.; Monge, C.; González-Eguino, M. Ensuring a just energy transition: A distributional analysis of diesel tax reform in Spain with stakeholder engagement. Energy Policy 2023, 177, 113558. [Google Scholar] [CrossRef]
- Shortall, O.K.; Anker, H.T.; Sandøe, P.; Gamborg, C. Room at the margins for energy-crops? A qualitative analysis of stakeholder views on the use of marginal land for biomass production in Denmark. Biomass Bioenergy 2019, 123, 51–58. [Google Scholar] [CrossRef]
- Fu, F.; Feng, W.; Li, Z.; Crawley, E.F.; Ni, W. A network-based modeling framework for stakeholder analysis of China’s energy conservation campaign. Energy 2011, 36, 4996–5003. [Google Scholar] [CrossRef]
- Reed, M.; Graves, A.; Dandy, N.; Posthumus, H.; Hubacek, K.; Morris, J.; Prell, C.; Quinn, C.H.; Stringer, L.C. Who’s in and why? A typology of stakeholder analysis methods for natural resource management. J. Environ. Manag. 2009, 90, 1933–1949. [Google Scholar] [CrossRef]
- Hare, M.; Pahl-Wostl, C. Stakeholder categorisation in participatory integrated assessment processes. Integr. Assess. 2002, 3, 50–62. [Google Scholar] [CrossRef]
- Salam, M.A.; Noguchi, T. Evaluating capacity development for participatory forest management in Bangladesh’s Sal forests based on ‘4Rs’ stakeholder analysis. For. Policy Econ. 2006, 8, 785–796. [Google Scholar] [CrossRef]
- Susanto, N.; Putranto, T.T. Stakeholder interactions model of groundwater management in Semarang City/Indonesia. Int. J. GEOMATE 2018, 15, 170–177. [Google Scholar] [CrossRef]
- Suhanda, R.D.P.; Pratami, D. RACI matrix design for managing stakeholders in project case study of PT. XYZ. Int. J. Innov. Enterp. Syst. 2021, 5, 122–133. [Google Scholar] [CrossRef]
- Mkhaimer, L.G.; Arafeh, M.; Sakhrieh, A.H. Effective implementation of ISO 50001 energy management system: Applying Lean Six Sigma approach. Int. J. Eng. Bus. Manag. 2017, 9, 1847979017698712. [Google Scholar] [CrossRef]
- Cabanillas, C.; Resinas, M.; Ruiz-Cortés, A. A template-based approach for responsibility management in executable business processes. Enterp Inf. Syst. 2017, 12, 550–586. [Google Scholar] [CrossRef]
- Brower, H.H.; Nicklas, B.J.; Nader, M.A.; Trost, L.M.; Miller, D.P. Creating effective academic research teams: Two tools borrowed from business practice. J. Clin. Transl. Sci. 2021, 5, e74. [Google Scholar] [CrossRef]
- Simhachalam, V.; Wang, T.; Liu, Y.; Wamelink, H.; Montenegro, L.; van Gorp, G. Accelerating Building Energy Retrofitting with BIM-Enabled BREEAM-NL Assessment. Energies 2021, 14, 8225. [Google Scholar] [CrossRef]
- Lee, W.; Lee, S.; Jin, C.; Hyun, C. Development of the RACI Model for Processes of the Closure Phase in Construction Programs. Sustainability 2021, 13, 1806. [Google Scholar] [CrossRef]
- Altissimo, A. Combining egocentric network maps and narratives: An applied analysis of qualitative network map interviews. Sociol. Res. Online 2016, 21, 152–164. [Google Scholar] [CrossRef]
- Vallejo, A.; Morban, H.; Domínguez, N.; Cabrera, M.; Herrera, I.; Andrickson, J.; Pereyra, C.; Castellanos, J.; Jiménez, E.; Casilla, C. Urban wind energy potential in the southern region of the Dominican Republic. In Proceedings of the VI Ibero-American Congress of Smart Cities (ICSC-CITIES 2023), Cuenca, Ecuador, 28–30 November 2022; Moreno-Bernal, P., Hernández-Callejo, L., Nesmachnow, S., Rossit, D., Ochoa-Correa, D., Eds.; Universidad de Cuenca: Cuenca, Ecuador, 2023; pp. 642–656. [Google Scholar]
- AL-Yahyai, S.; Charabi, Y.; Gastli, A.; Al-Alawi, S. Assessment of wind energy potential locations in Oman using data from existing weather stations. Renew. Sustain. Energy Rev. 2010, 14, 1428–1436. [Google Scholar] [CrossRef]


| Profesiononal Area | Years of Experience | Counter | % |
|---|---|---|---|
| Engineering | 17 | 48 | 81% |
| Lawyer | 12 | 7 | 12% |
| Bussiness | 9 | 3 | 5% |
| Architecture | 18 | 1 | 2% |
| Avg. 16 | Total 59 | Total 100% |
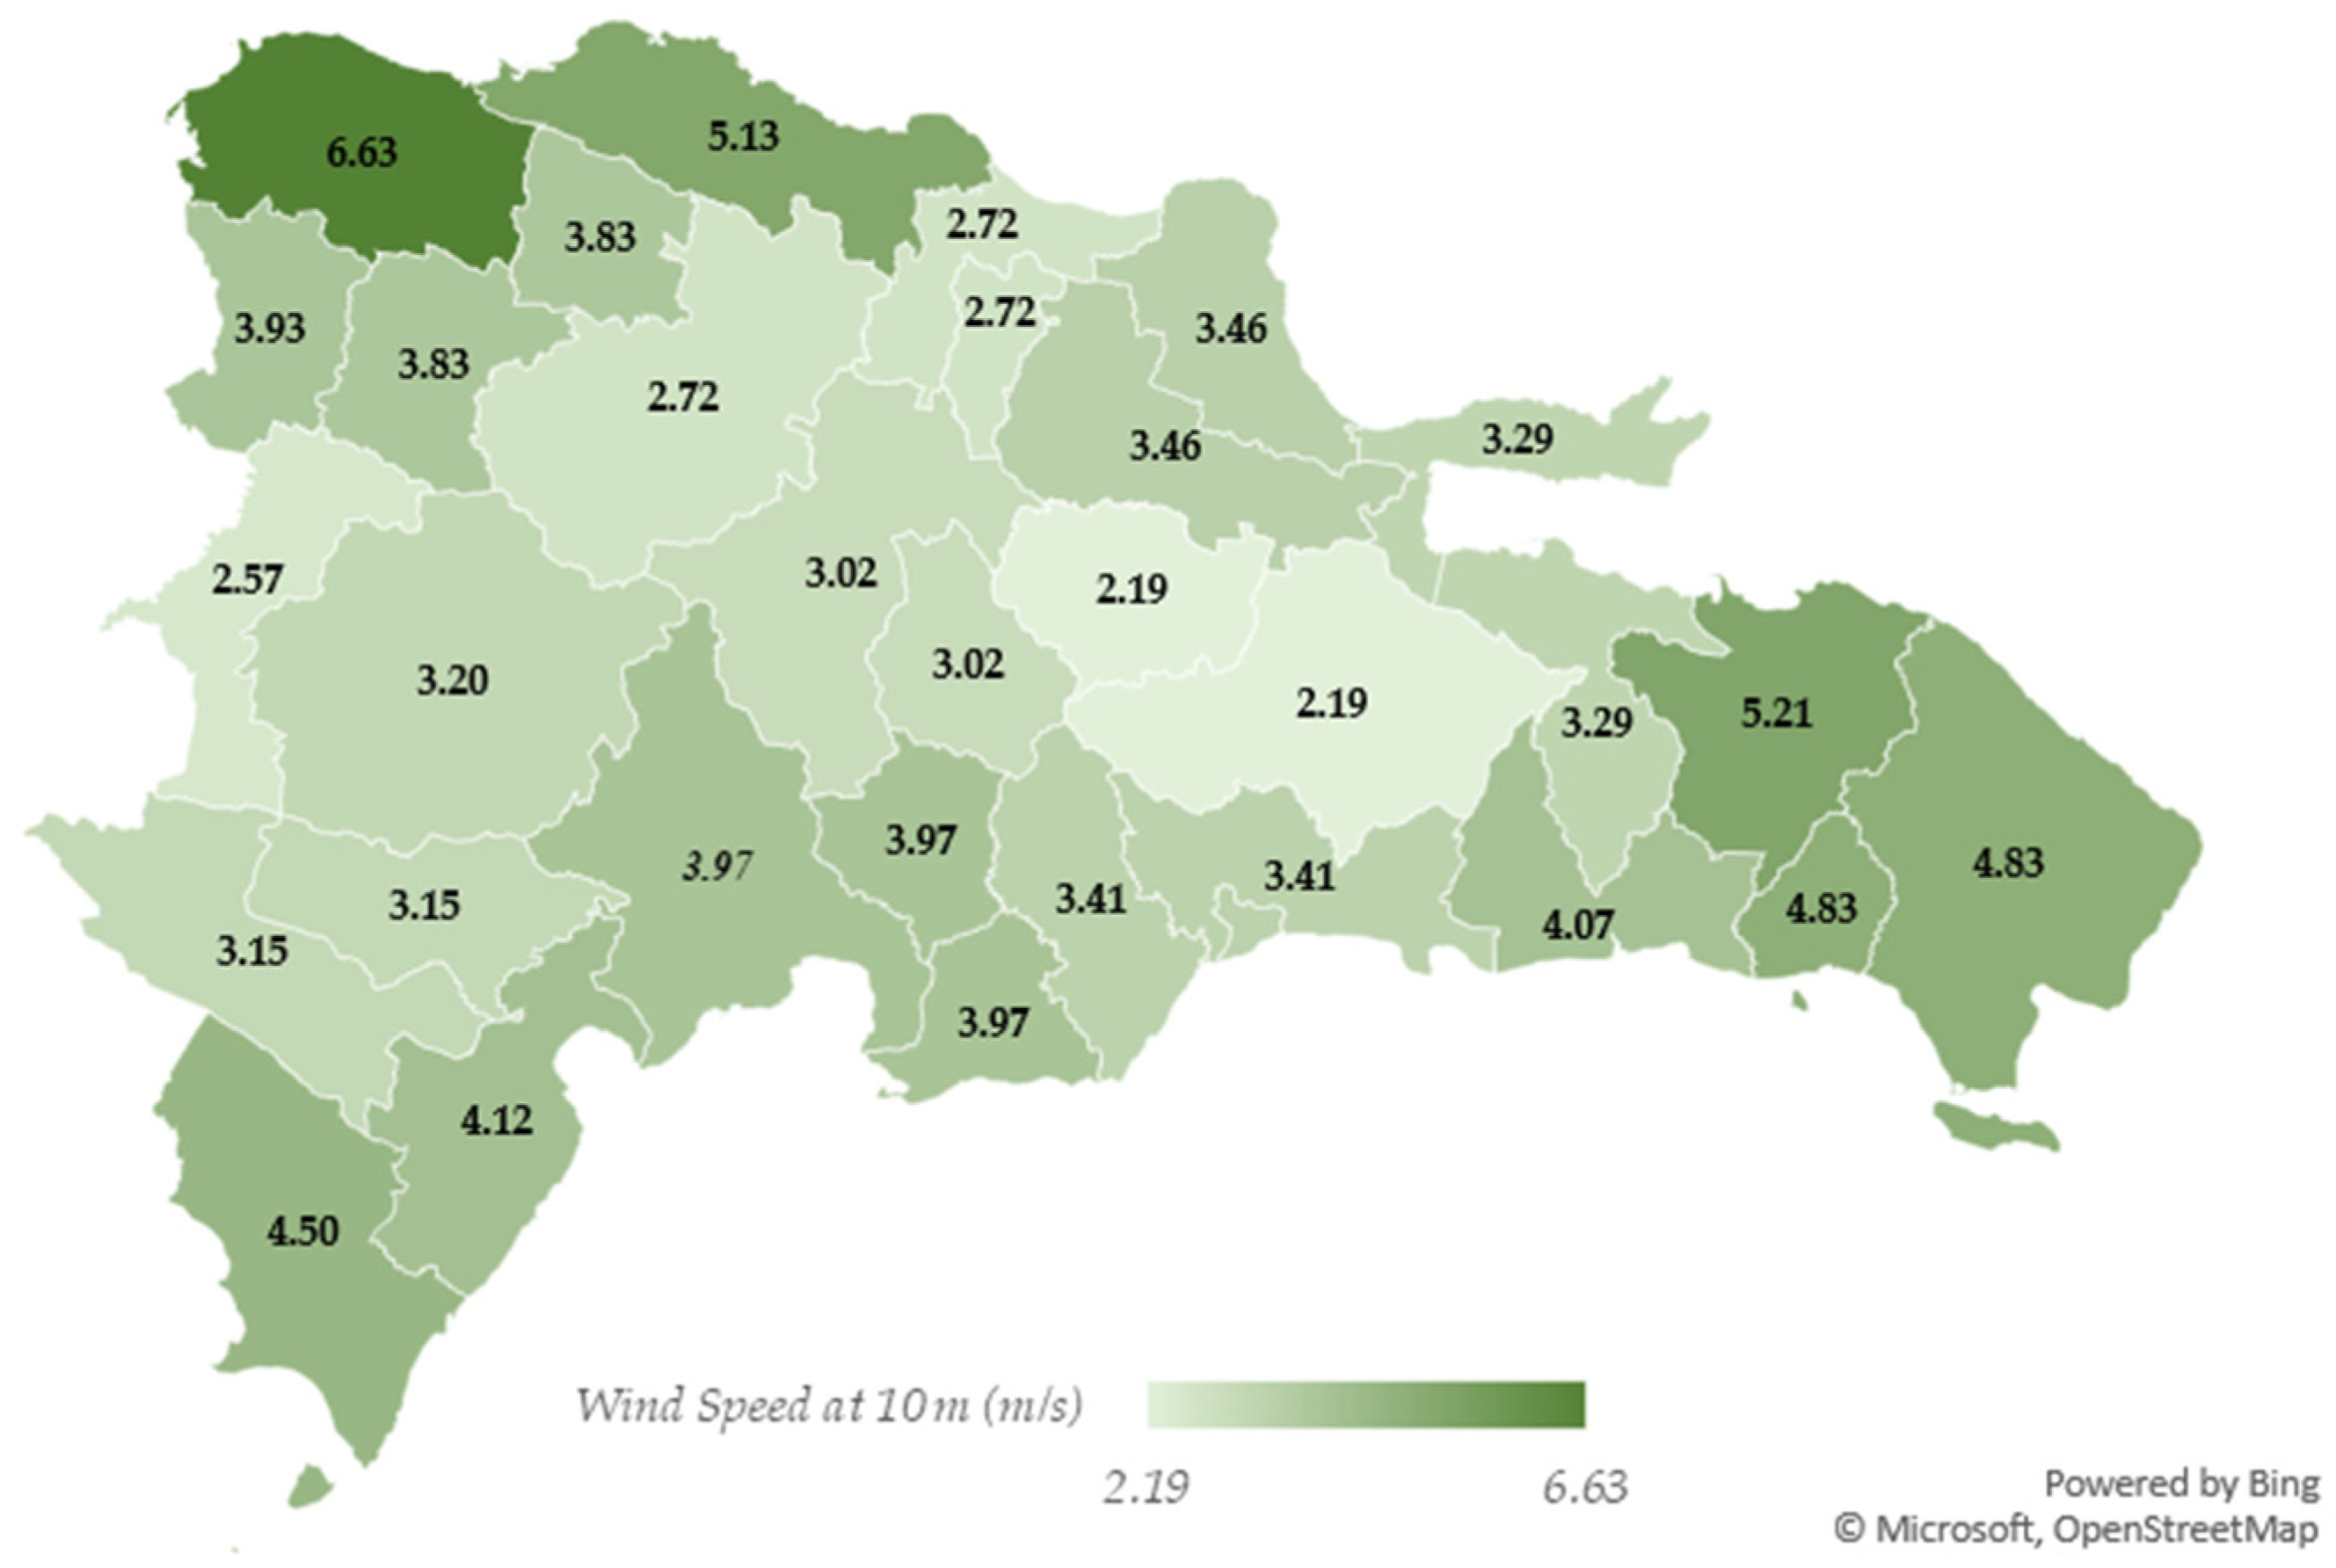
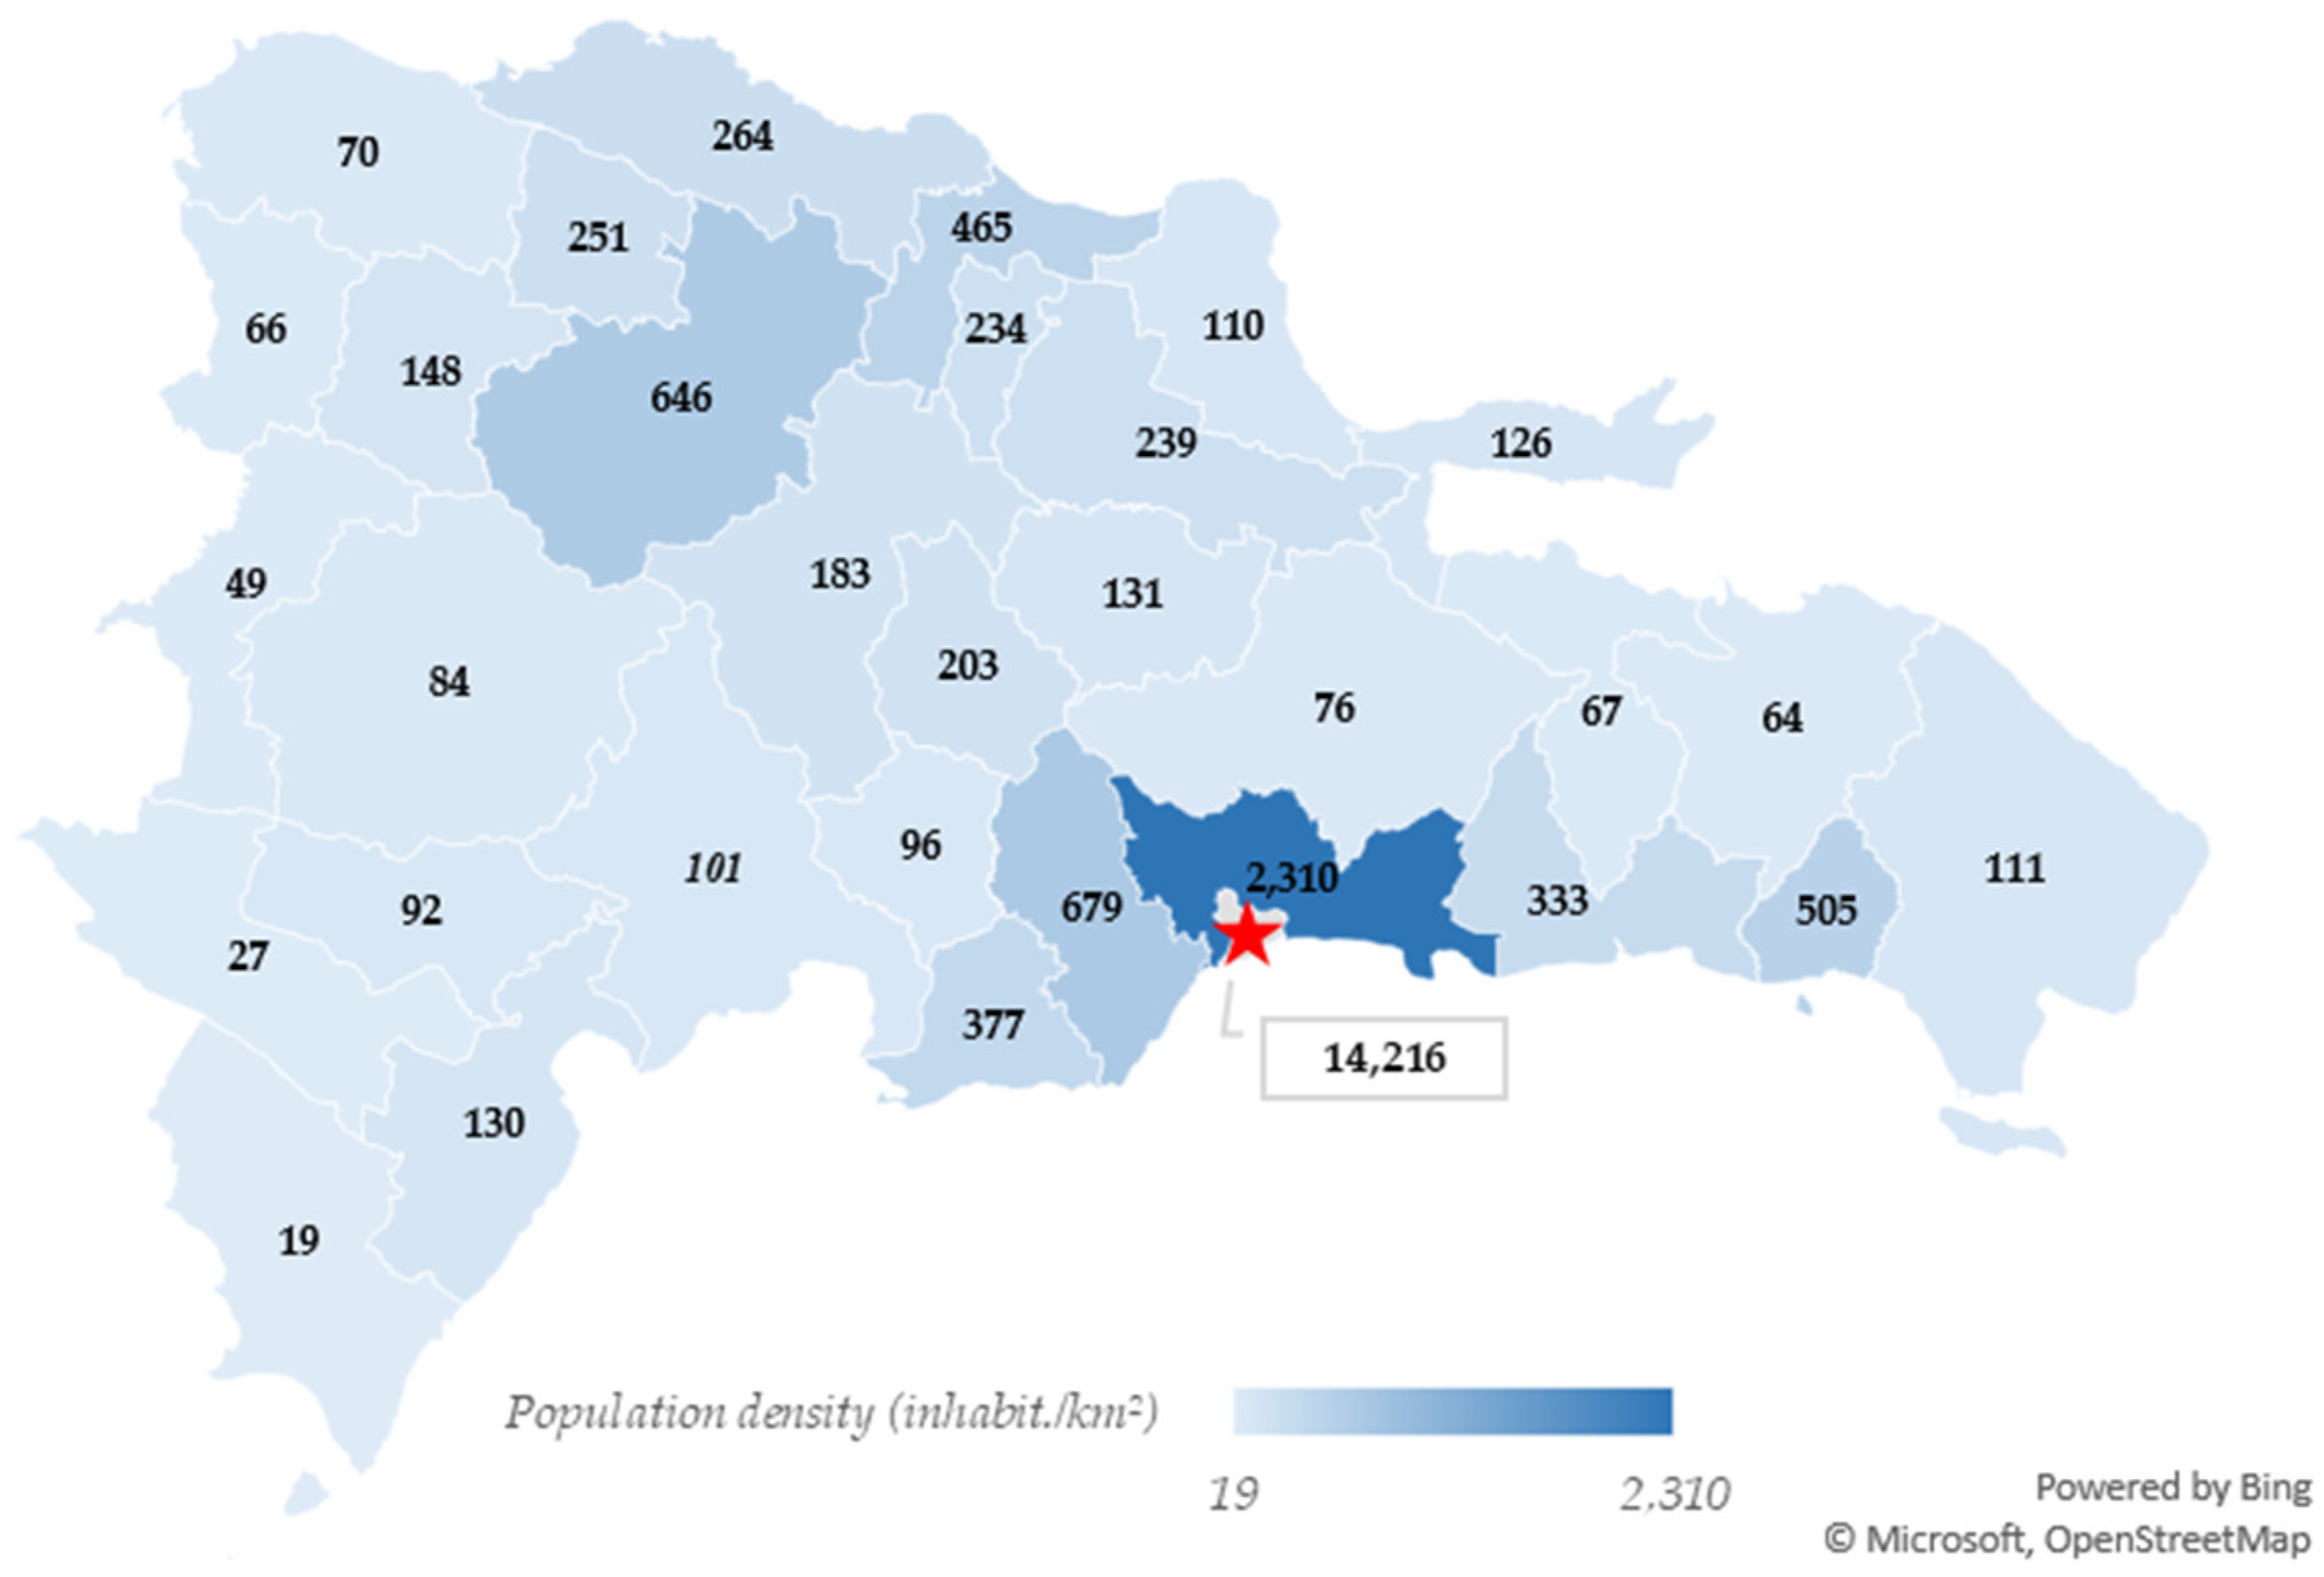
| Privinces | WS at 10 m (m/s) | WD at 10 m (°) | AEP (kWh/yr) | Area (km2) | Population (Inhabit.) | Population Density (Inhabit./km2) |
|---|---|---|---|---|---|---|
| Azua | 3.97 | 86 | 1464 | 2532 | 256,981 | 101 |
| Bahoruco | 3.15 | 117 | 722 | 1282 | 118,987 | 92 |
| Barahona | 4.12 | 92 | 1638 | 1739 | 226,898 | 130 |
| Dajabón | 3.93 | 60 | 1416 | 1021 | 67,887 | 66 |
| Distrito Nacional | 3.41 | 80 | 919 | 104 | 1,484,789 | 14,216 |
| Duarte | 3.46 | 87 | 964 | 1605 | 384,789 | 239 |
| Elías Piña | 2.57 | 80 | 385 | 1426 | 70,589 | 49 |
| El Seibo | 5.21 | 82 | 3162 | 1787 | 115,889 | 64 |
| Espaillat | 2.72 | 88 | 461 | 839 | 390,478 | 465 |
| Hato Mayor | 3.29 | 82 | 828 | 1329 | 89,578 | 67 |
| Hermanas Mirabal | 2.72 | 88 | 461 | 440 | 103,974 | 234 |
| Independencia | 3.15 | 117 | 722 | 2006 | 54,785 | 27 |
| La Altagracia | 4.83 | 81 | 2587 | 3010 | 335,677 | 111 |
| La Romana | 4.83 | 81 | 2587 | 654 | 330,587 | 505 |
| La Vega | 3.02 | 90 | 632 | 2287 | 420,478 | 183 |
| María Trinidad Sánchez | 3.46 | 87 | 964 | 1272 | 140,784 | 110 |
| Monseñor Nouel | 3.02 | 90 | 632 | 992 | 201,474 | 203 |
| Montecristi | 6.63 | 73 | 5197 | 1924 | 135,710 | 70 |
| Monte Plata | 2.19 | 84 | 236 | 2632 | 200,454 | 76 |
| Pedernales | 4.50 | 95 | 2121 | 2075 | 38,941 | 19 |
| Peravia | 3.97 | 86 | 1464 | 792 | 298,747 | 377 |
| Puerto Plata | 5.13 | 90 | 3045 | 1853 | 490,733 | 264 |
| Samaná | 3.29 | 82 | 828 | 854 | 168,265 | 126 |
| Sánchez Ramírez | 2.19 | 84 | 236 | 1196 | 248,807 | 131 |
| San Cristóbal | 3.41 | 80 | 919 | 1266 | 859,741 | 679 |
| San José de Ocoa | 3.97 | 86 | 1464 | 855 | 82,458 | 96 |
| San Juan | 3.20 | 99 | 761 | 3569 | 300,476 | 84 |
| San Pedro de Macorís | 4.07 | 82 | 1572 | 1255 | 418,850 | 333 |
| Santiago | 2.72 | 88 | 461 | 2837 | 1,833,451 | 646 |
| Santiago Rodríguez | 3.83 | 78 | 1313 | 1111 | 164,941 | 148 |
| Santo Domingo | 3.41 | 80 | 919 | 1302 | 2,995,211 | 2310 |
| Valverde | 3.83 | 78 | 1313 | 823 | 207,447 | 251 |
| No. | Institution List | Accronys | X-Axes | Y-Axes | Z-Axes (Relevance) |
|---|---|---|---|---|---|
| 1 | Municipal councils | AYTO | 0.03 | 0.09 | 0.49 |
| 2 | Ministry of Energy and Mines | MEM | 0.36 | 0.64 | 0.75 |
| 3 | Electricity Distribution Companies | EDE | −0.34 | 0.40 | 0.61 |
| 4 | National Energy Commission | CNE | 0.16 | 0.16 | 0.16 |
| 5 | Superintendence of Electricity | SIE | 0.26 | 0.40 | 0.70 |
| 6 | Coordinating Entity | OC | −0.13 | −0.36 | 0.39 |
| 7 | Dominican Electric Transmission Company | ETED | 0.09 | 0.09 | 0.09 |
| 8 | Universities | UNIV | −0.33 | −0.40 | 0.37 |
| 9 | National Industrial Property Office (ONAPI) | ONAPI | 0.25 | −0.36 | 0.21 |
| 10 | Ministry of Higher Education, Science and Technology | MESCyT | 0.19 | −0.36 | 0.27 |
| 11 | International Cooperation Organizations (USAID, UNDP, GIZ) | OCI | −0.31 | −0.56 | 0.35 |
| 12 | NGOs | ONG | −0.19 | −0.44 | 0.31 |
| 13 | Ministry of Industry and commerce | MIC | 0.10 | −0.14 | 0.35 |
| 14 | Ministry of Economy, Planning and Development | MEPyD | 0.09 | −0.16 | 0.36 |
| 15 | Ministry of Labor | MT | 0.38 | −0.29 | 0.18 |
| 16 | Ministry of Environment and Natural Resources | MIMARENA | 0.01 | 0.04 | 0.55 |
| 17 | Superintendence of Banks | SB | 0.24 | −0.27 | 0.28 |
| 18 | Local banks | BL | 0.10 | −0.24 | 0.33 |
| 19 | International Cooperation Banks | BI | −0.09 | −0.25 | 0.38 |
| 20 | National Meteorological Office | ONAMET | −0.20 | −0.36 | 0.37 |
| 21 | Dominican Association of the Electrical Industry | ADIE | −0.19 | −0.43 | 0.34 |
| 22 | Association for the Promotion of Renewable Energies | ASOFER | −0.27 | −0.22 | 0.46 |
| 23 | National Association of Young Entrepreneurs | ANJE | 0.11 | −0.32 | 0.27 |
| 24 | Association of Energy Efficiency and Renewable Energy Companies | AEEER | −0.19 | −0.15 | 0.41 |
| 25 | National Congress | CN | 0.18 | 0.32 | 0.59 |
| 26 | Supreme Court of Justice | SCJ | 0.30 | −0.05 | 0.33 |
| 27 | Ministry of Education | MINERD | 0.28 | −0.31 | 0.24 |
| 28 | Construction entrepreneurs | EC | −0.06 | −0.27 | 0.35 |
Disclaimer/Publisher’s Note: The statements, opinions and data contained in all publications are solely those of the individual author(s) and contributor(s) and not of MDPI and/or the editor(s). MDPI and/or the editor(s) disclaim responsibility for any injury to people or property resulting from any ideas, methods, instructions or products referred to in the content. |
© 2024 by the authors. Licensee MDPI, Basel, Switzerland. This article is an open access article distributed under the terms and conditions of the Creative Commons Attribution (CC BY) license (https://creativecommons.org/licenses/by/4.0/).
Share and Cite
Vallejo Díaz, A.; Herrera Moya, I.; Garabitos Lara, E.; Casilla Victorino, C.K. Assessment of Urban Wind Potential and the Stakeholders Involved in Energy Decision-Making. Sustainability 2024, 16, 1362. https://doi.org/10.3390/su16041362
Vallejo Díaz A, Herrera Moya I, Garabitos Lara E, Casilla Victorino CK. Assessment of Urban Wind Potential and the Stakeholders Involved in Energy Decision-Making. Sustainability. 2024; 16(4):1362. https://doi.org/10.3390/su16041362
Chicago/Turabian StyleVallejo Díaz, Alexander, Idalberto Herrera Moya, Edwin Garabitos Lara, and Cándida K. Casilla Victorino. 2024. "Assessment of Urban Wind Potential and the Stakeholders Involved in Energy Decision-Making" Sustainability 16, no. 4: 1362. https://doi.org/10.3390/su16041362
APA StyleVallejo Díaz, A., Herrera Moya, I., Garabitos Lara, E., & Casilla Victorino, C. K. (2024). Assessment of Urban Wind Potential and the Stakeholders Involved in Energy Decision-Making. Sustainability, 16(4), 1362. https://doi.org/10.3390/su16041362