
Joint Optimization of Urban Water Quantity and Quality Allocation in the Plain River Network Area


Abstract
1. Introduction
2. Case Study
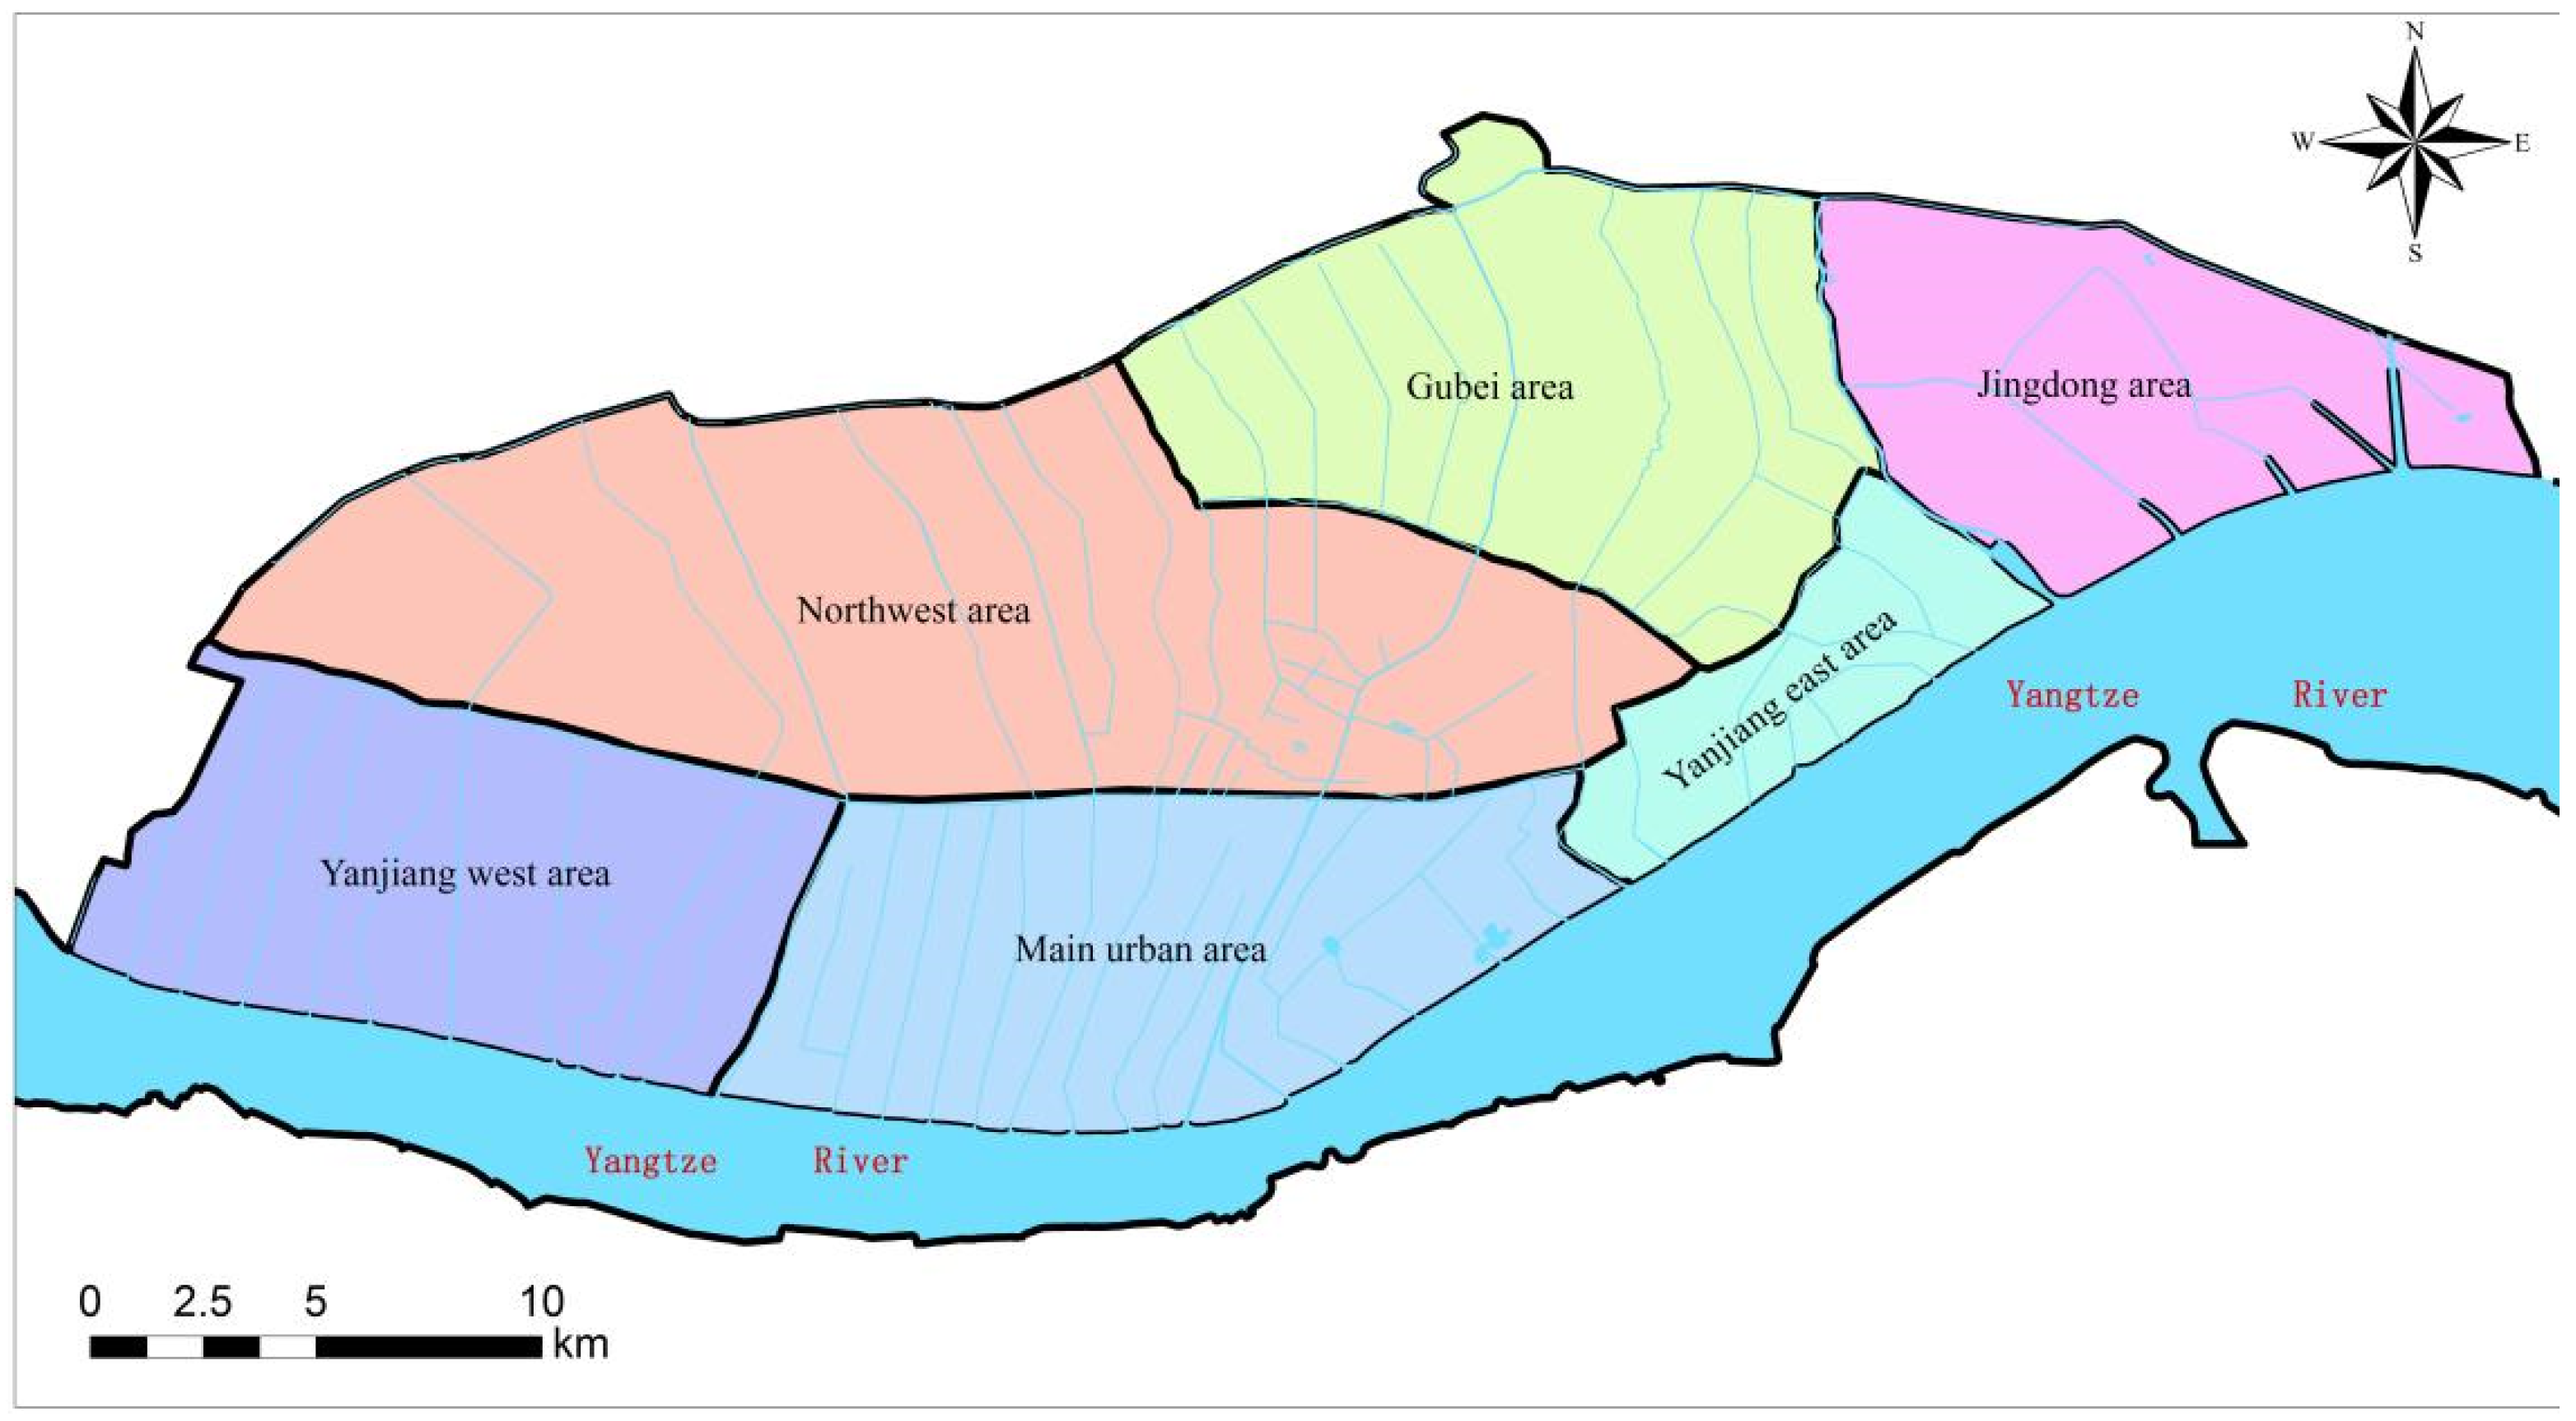
2.1. Study Area
2.2. Data
2.3. Forecast of Water Supply and Demand in the Planning Year
3. Methodology
3.1. Multi-Objective Optimal Allocation Model of Water Quantity and Quality
3.1.1. Objective Function
3.1.2. Constraints
3.1.3. Model Parameter Setting
3.2. Model Solving
3.3. Spatial Equilibrium Assessment of Water Allocation
3.4. Gini Coefficient of Water Distribution
4. Results and Analysis of Water Allocation
4.1. Water Allocation Results
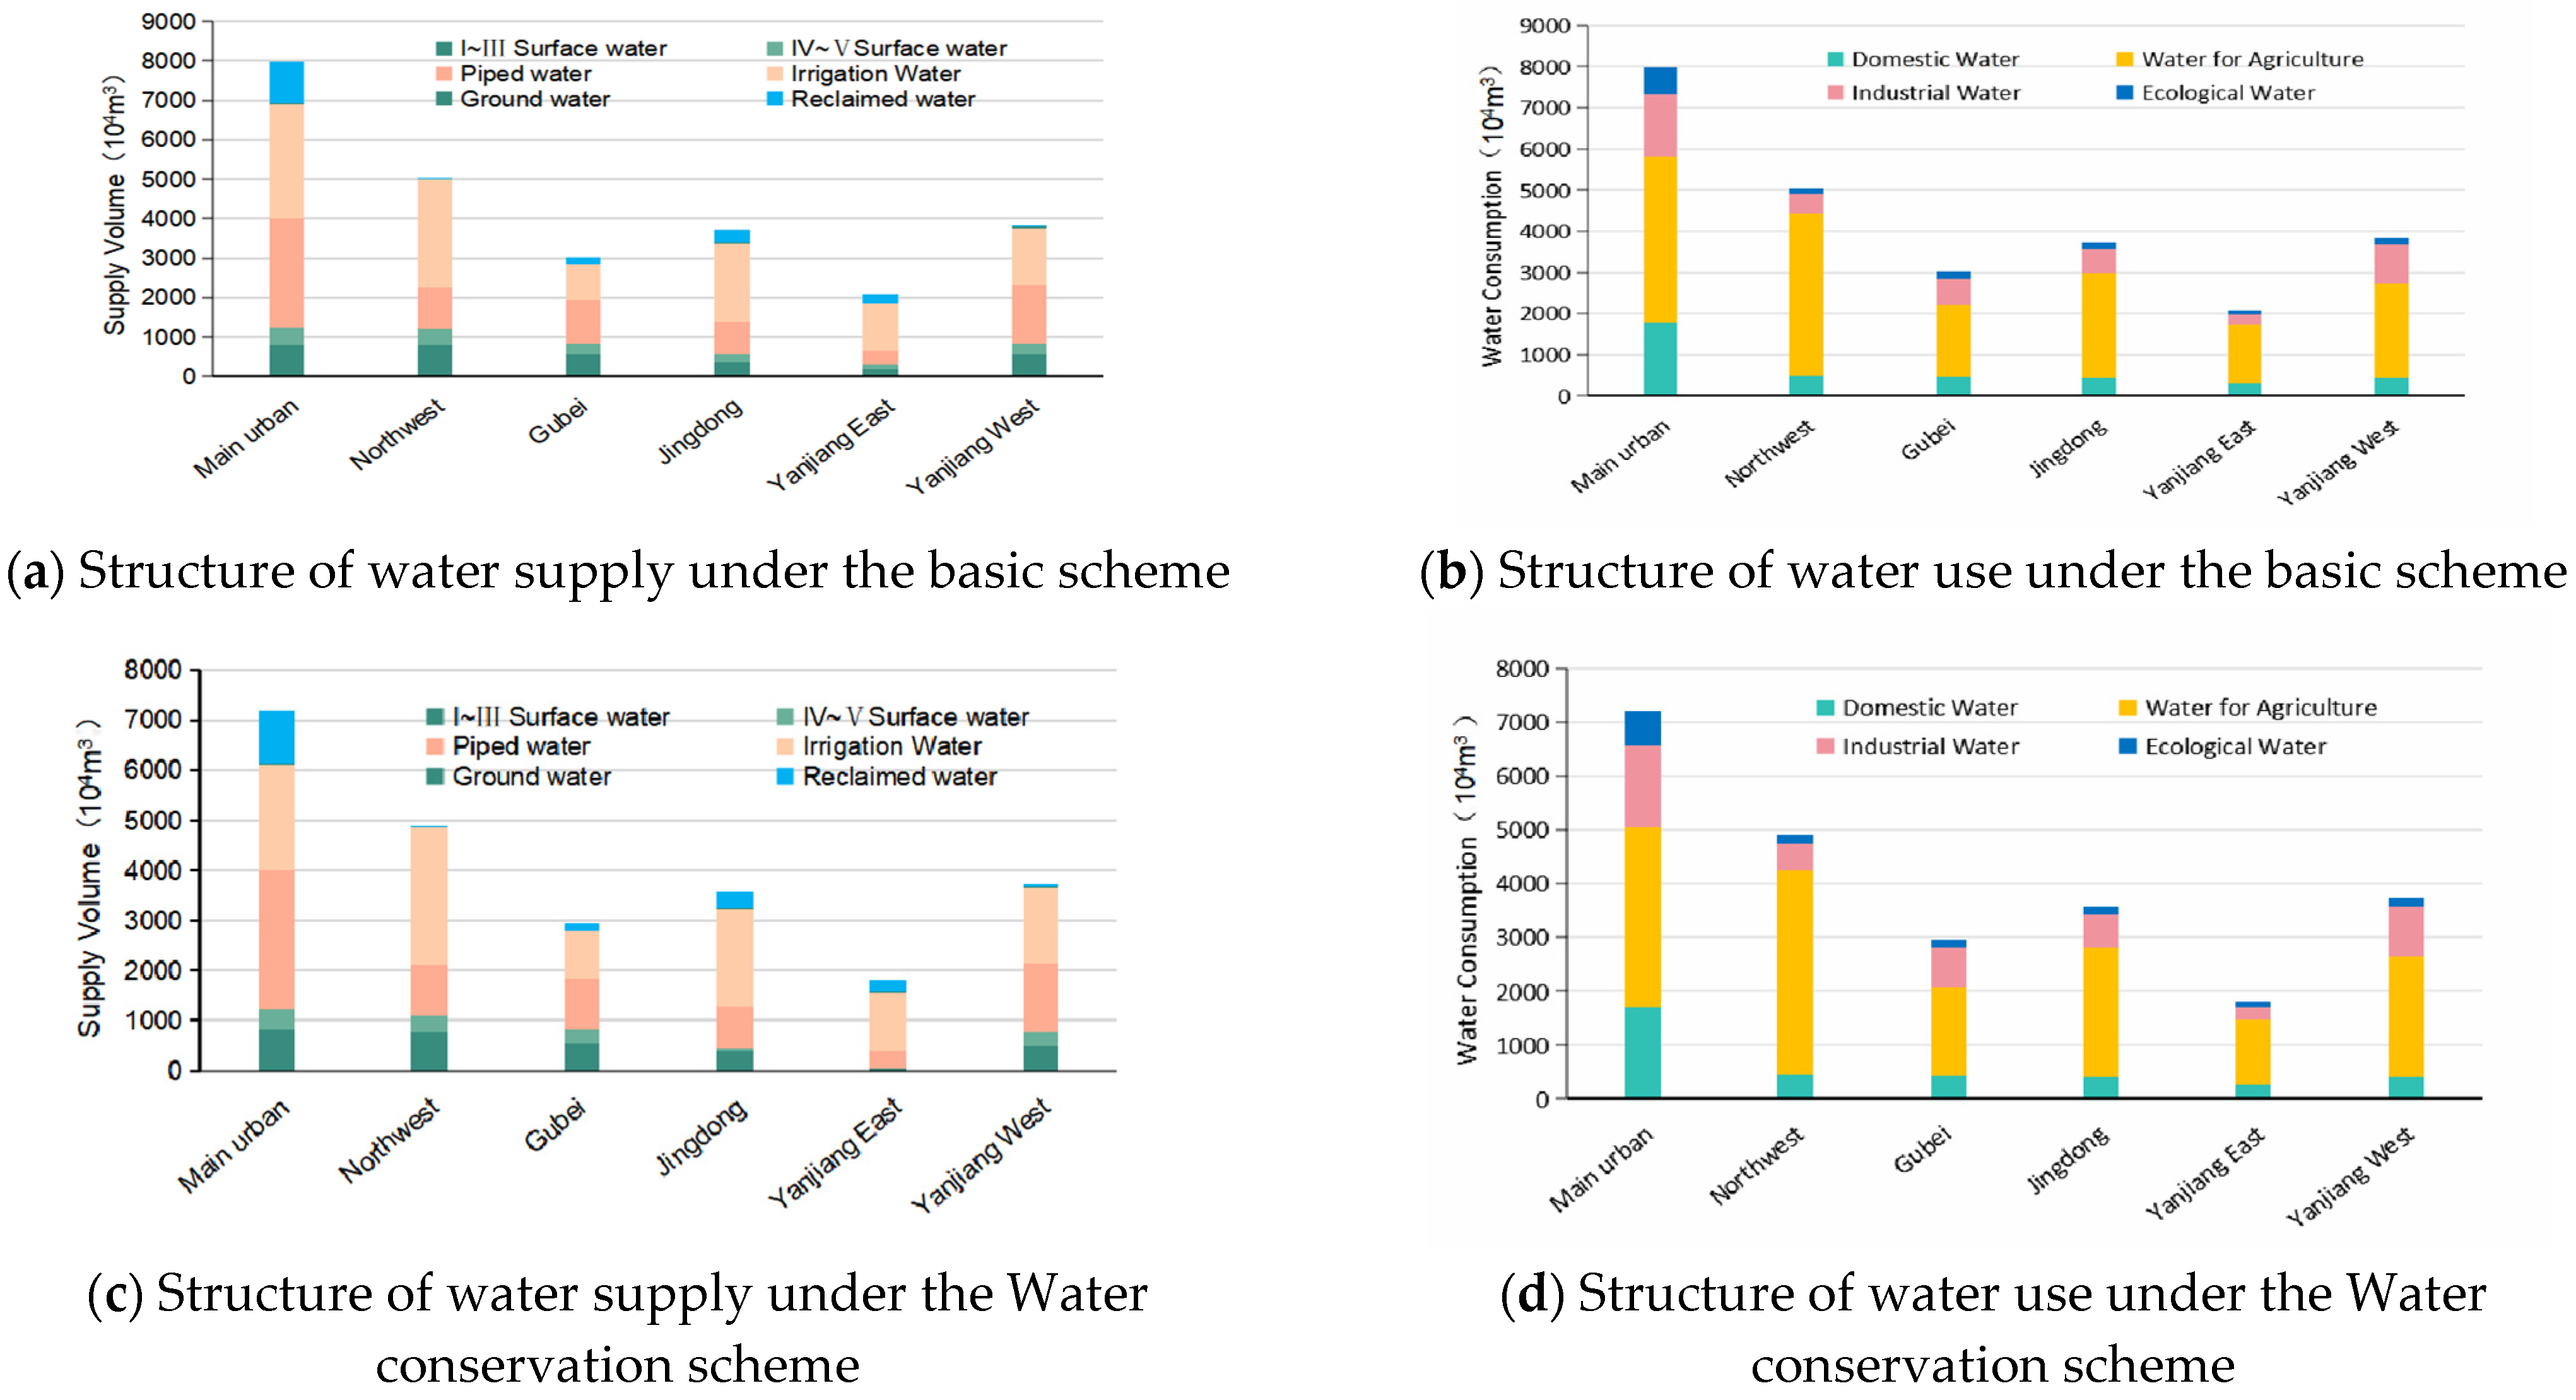
4.2. Analysis of Water Supply Structure
4.3. Analysis of Spatial Equilibrium of Water Resources
4.4. Analysis of Gini Coefficient
5. Conclusions
- (1)
- Total water consumption and chemical oxygen demand (COD) emissions for the current planning period are within their respective limits. In addition, the implementation of the water conservation program has resulted in a 5% reduction in total water shortage and a reduction of 1276 tons of COD emissions. These results highlight the importance of increasing water conservation efforts to mitigate water scarcity and reduce COD emissions in the region. In addition, the optimization of the water supply infrastructure in Jingjiang City has proven to be an important step in ensuring the quality of the water supply. More than 90% of the surface water classified as Grade IV to V is used for agricultural purposes, while the domestic water supply relies mainly on transit water, which effectively ensures quality water is used in domestic water supplies.
- (2)
- This paper presents the concept of spatial equilibrium of water resources and the Gini coefficient of water resource distribution, which can be utilized to gauge the level of regional water resource equilibrium and its compatibility with different economic factors following allocation. Based on the analysis, the spatial equilibrium coefficient of water resources per sub-area is between 0.33 and 0.74, indicating an unbalanced or almost unbalanced level. However, the application of a water conservation program has resulted in the improvement of the spatial equilibrium level of water resources in each sub-area, with an overall spatial equilibrium of 0.64, indicating a more balanced level. In light of the Gini coefficient of water resource distribution, the plains river network area displays a better match between water resources and economic and social factors of each water receiving area, thanks to its unique geographical location and natural conditions.
- (3)
- The allocation of water resources in Jingjiang City is based on the upper and lower limits of water demand among users, which does not entirely fulfill the water requirements of individual users, leading to a significant supply and demand contradiction. To promote sustainable economic and social development in the city, a series of recommended actions have been proposed. These include incorporating water supply in city planning, optimizing industrial layout, vigorously developing the recycling economy, increasing the penetration rate of water-saving appliances and the amount of recycled water, enhancing water conservation awareness among residents, and continuously improving water resource utilization efficiency. Additionally, it is suggested to enhance the remediation of river outfalls and surface source pollution management, increase water reuse, restore river channels, and implement water and ecological restoration projects for comprehensive water environment management and sustainable use of water resources.
6. Limitation
- (1)
- The optimization of water resources involves various factors, including precipitation and climate, which can affect the results of the allocation process. This paper does not consider the impact of these uncertain factors on the allocation optimization, and future research in this area can improve the accuracy of the optimization results.
- (2)
- Although the model proposed in this paper has been applied in Jingjiang City, it has not yet been used to manage real water resources. In the future, the theory and methodology can be introduced into the management of real water resources, such as water allocation, optimization, and scheduling, to expand the scope of application and the practicality of the methodology.
Author Contributions
Funding
Informed Consent Statement
Data Availability Statement
Conflicts of Interest
References
- Qu, S.; Lv, J.; Liu, J. Visualization Analysis for Global Water Resources Based on Digital Earth. J. Coast. Res. 2020, 105, 47–50. [Google Scholar] [CrossRef]
- Howells, M.; Hermann, S.; Welsch, M.; Bazilian, M.; Segerström, R.; Alfstad, T.; Gielen, D.; Rogner, H.; Fischer, G.; Van Velthuizen, H.; et al. Integrated Analysis of Climate Change, Land-Use, Energy and Water Strategies. Nat. Clim. Chang. 2013, 3, 621–626. [Google Scholar] [CrossRef]
- Ma, T.; Sun, S.; Fu, G.; Hall, J.W.; Ni, Y.; He, L.; Yi, J.; Zhao, N.; Du, Y.; Pei, T.; et al. Pollution Exacerbates China’s Water Scarcity and Its Regional Inequality. Nat. Commun. 2020, 11, 650. [Google Scholar] [CrossRef] [PubMed]
- Li, A.; Yuan, Q.; Strokal, M.; Kroeze, C.; Ma, L.; Liu, Y. Equality in River Pollution Control in China. Sci. Total Environ. 2021, 777, 146105. [Google Scholar] [CrossRef]
- Wu, C.; Liu, W.; Deng, H. Urbanization and the Emerging Water Crisis: Identifying Water Scarcity and Environmental Risk with Multiple Applications in Urban Agglomerations in Western China. Sustainability 2023, 15, 12977. [Google Scholar] [CrossRef]
- Zhou, Y.; Duan, N.; Wu, X.; Fang, H. COD Discharge Limits for Urban Wastewater Treatment Plants in China Based on Statistical Methods. Water 2018, 10, 777. [Google Scholar] [CrossRef]
- Lin, L.; Yang, H.; Xu, X. Effects of Water Pollution on Human Health and Disease Heterogeneity: A Review. Front. Environ. Sci. 2022, 10, 880246. [Google Scholar] [CrossRef]
- Tang, W.; Pei, Y.; Zheng, H.; Zhao, Y.; Shu, L.; Zhang, H. Twenty Years of China’s Water Pollution Control: Experiences and Challenges. Chemosphere 2022, 295, 133875. [Google Scholar] [CrossRef]
- Zhu, X.; Zhuang, G.; Xiong, N. A Review of China’s Approaches toward a Sustainable Energy Future: The Period since 1990. WIREs Energy Environ. 2014, 3, 409–423. [Google Scholar] [CrossRef]
- Liu, S.; Liao, Q.; Liang, Y.; Li, Z.; Huang, C. Spatio–Temporal Heterogeneity of Urban Expansion and Population Growth in China. Int. J. Environ. Res. Public Health 2021, 18, 13031. [Google Scholar] [CrossRef]
- Wang, M.; Janssen, A.B.G.; Bazin, J.; Strokal, M.; Ma, L.; Kroeze, C. Accounting for Interactions between Sustainable Development Goals Is Essential for Water Pollution Control in China. Nat. Commun. 2022, 13, 730. [Google Scholar] [CrossRef] [PubMed]
- Zhou, S.; Huang, Y.; Wei, Y.; Wang, G. Socio-Hydrological Water Balance for Water Allocation between Human and Environmental Purposes in Catchments. Hydrol. Earth Syst. Sci. 2015, 19, 3715–3726. [Google Scholar] [CrossRef]
- Zhang, W.; Wang, Y.; Peng, H.; Li, Y.; Tang, J.; Wu, K.B. A Coupled Water Quantity–Quality Model for Water Allocation Analysis. Water Resour. Manag. 2010, 24, 485–511. [Google Scholar] [CrossRef]
- Liu, J.; Ding, R.; Chen, Y.; Zhu, W.; Fan, Z.; Ma, J. Assessment and Optimization of Water Resources Regulation for River Networks in the Tidal Plain—A Case Study of the Qingsong Area in Shanghai. Water 2022, 14, 3523. [Google Scholar] [CrossRef]
- Yu, Z.; Lu, M.; Xu, Y.; Wang, Q.; Lin, Z.; Luo, S. Network Structure and Stability of the River Connectivity in a Rapidly Urbanizing Region. Sci. Total Environ. 2023, 894, 165021. [Google Scholar] [CrossRef] [PubMed]
- Xu, G.; Li, A.; Yang, Q.; Chi, J. Spatiotemporal Change in the River Network in Rapidly Urbanized Plain Regions of the Yangtze River Delta in China. River Res. Appl. 2022, 38, 965–974. [Google Scholar] [CrossRef]
- He, H.; Chen, A.; Yin, M.; Ma, Z.; You, J.; Xie, X.; Wang, Z.; An, Q. Optimal Allocation Model of Water Resources Based on the Prospect Theory. Water 2019, 11, 1289. [Google Scholar] [CrossRef]
- Luo, Y.; Sha, J.; Liu, B.; Zhang, Y.; Yang, J. Optimal Allocation of Water Resources Based on GWAS Model in Handan, China. Water 2023, 15, 1090. [Google Scholar] [CrossRef]
- Zhang, S.; Li, H.; Li, C.; Yi, Y.; Wang, X.; Liu, Q. Allocation of Water Resources in the Lower Yellow River Based on Ecological Footprint. Front. Earth Sci. 2023, 10, 1018980. [Google Scholar] [CrossRef]
- Loftis, B.; Labadie, J.W.; Fontane, D.G. Optimal operation of a system of lakes for quality and quantity. In Computer Applications in Water Resources; ASCW: New York, NY, USA, 1989; pp. 693–702. [Google Scholar]
- Ko, I.H. Integrated River Basin Operational Planning Considering Water Quantity and Water Quality. Ph.D. Thesis, Colorado State University, Fort Collins, CO, USA, 1997. [Google Scholar]
- Mahjouri, N.; Ardestani, M. A Game Theoretic Approach for Interbasin Water Resources Allocation Considering the Water Quality Issues. Environ. Monit. Assess. 2010, 167, 527–544. [Google Scholar] [CrossRef]
- Zhou, K. Integrated Allocation Model of Water Quantity and Quality and Its Application in the Yellow River. Water Supply 2020, 20, 3768–3778. [Google Scholar] [CrossRef]
- Dalcin, A.P.; Fernandes Marques, G. Integrating Water Management Instruments to Reconcile a Hydro-Economic Water Allocation Strategy with Other Water Preferences. Water Resour. Res. 2020, 56, e2019WR025558. [Google Scholar] [CrossRef]
- Yin, Z.; Guan, Y.; Li, Y. Method for Determination of Allocable Water during Formulation of Water Allocation Scheme. Sci. China Technol. Sci. 2011, 54, 2629–2637. [Google Scholar] [CrossRef]
- Candido, L.A.; Coêlho, G.A.G.; De Moraes, M.M.G.A.; Florêncio, L. Review of Decision Support Systems and Allocation Models for Integrated Water Resources Management Focusing on Joint Water Quantity-Quality. J. Water Resour. Plan. Manag. 2022, 148, 03121001. [Google Scholar] [CrossRef]
- Wang, Y.; Yang, J.; Chang, J. Development of a Coupled Quantity-Quality-Environment Water Allocation Model Applying the Optimization-Simulation Method. J. Clean. Prod. 2019, 213, 944–955. [Google Scholar] [CrossRef]
- GB 3838-2002; Environmental Quality Standards for Surface Water. Ministry of Ecology and Environment of the People’ Republic of China: Beijing, China, 2002. (In Chinese)
- Zheng, J.; Wu, S.; Li, L.; Li, S.; Li, Q.; An, Q. Revealing Virtual Water Transfers and Imbalanced Economic Benefits Hidden in China’s Interprovincial Trade. Water 2022, 14, 1677. [Google Scholar] [CrossRef]
- Yan, Z.; Li, M.; Li, Z. Efficient and Economical Allocation of Irrigation Water under a Changing Environment: A Stochastic Multi-Objective Nonlinear Programming Model. Irrig. Drain. 2021, 70, 103–116. [Google Scholar] [CrossRef]
- Beh, E.H.Y.; Dandy, G.C.; Maier, H.R.; Paton, F.L. Optimal Sequencing of Water Supply Options at the Regional Scale Incorporating Alternative Water Supply Sources and Multiple Objectives. Environ. Model. Softw. 2014, 53, 137–153. [Google Scholar] [CrossRef]
- Hu, Z.; Chen, Y.; Yao, L.; Wei, C.; Li, C. Optimal Allocation of Regional Water Resources: From a Perspective of Equity–Efficiency Tradeoff. Resour. Conserv. Recycl. 2016, 109, 102–113. [Google Scholar] [CrossRef]
- Ma, H.; Zhang, Y.; Sun, S.; Liu, T.; Shan, Y. A Comprehensive Survey on NSGA-II for Multi-Objective Optimization and Applications. Artif. Intell. Rev. 2023, 56, 15217–15270. [Google Scholar] [CrossRef]
- Zhao, Z.; Liu, B.; Zhang, C.; Liu, H. An Improved Adaptive NSGA-II with Multi-Population Algorithm. Appl. Intell. 2019, 49, 569–580. [Google Scholar] [CrossRef]
- Wu, L.; Bai, T.; Huang, Q.; Wei, J.; Liu, X. Multi-Objective Optimal Operations Based on Improved NSGA-II for Hanjiang to Wei River Water Diversion Project, China. Water 2019, 11, 1159. [Google Scholar] [CrossRef]
- Yang, Y.; Wang, H.; Wang, C.; Zhang, Y. Coupling Variable Fuzzy Sets and Gini Coefficient to Evaluate the Spatial Equilibrium of Water Resources. Water Resour. 2022, 49, 292–300. [Google Scholar] [CrossRef]
- Zhao, Z.; Cai, Y.; Yang, Y. Construction and Application of a Water Resources Spatial Equilibrium Model: A Case Study in the Yangtze River Economic Belt. Water 2023, 15, 2984. [Google Scholar] [CrossRef]
- Wang, Y.; Song, J.; Sun, H. Coupling Interactions and Spatial Equilibrium Analysis of Water-Energy-Food in the Yellow River Basin, China. Sustain. Cities Soc. 2023, 88, 104293. [Google Scholar] [CrossRef]
- Wu, C.; Wang, X.; Jin, J.; Zhou, Y.; Bai, X.; Zhou, L.; Tong, F.; Zhang, L.; Cui, Y. Structure Simulation and Equilibrium Evaluation Analysis of Regional Water Resources, Society, Economy and Ecological Environment Complex System. Entropy 2023, 25, 181. [Google Scholar] [CrossRef] [PubMed]
- Wang, J.; Zuo, Q.; Wu, Q.; Jiang, L.; Han, C.; Zhang, W. Evaluation and Spatial Equilibrium Analysis of High-Quality Development Level in Mainland China Considering Water Constraints. Water 2022, 14, 2364. [Google Scholar] [CrossRef]
- Bian, D.; Yang, X.; Wu, F.; Babuna, P.; Luo, Y.; Wang, B.; Chen, Y. A Three-Stage Hybrid Model Investigating Regional Evaluation, Pattern Analysis and Obstruction Factor Analysis for Water Resource Spatial Equilibrium in China. J. Clean. Prod. 2022, 331, 129940. [Google Scholar] [CrossRef]
- Lou, Y.; Qiu, Q.; Zhang, M.; Feng, Z.; Dong, J. Spatial Equilibrium Evaluation of the Water Resources in Tai’an City Based on the Lorenz Curve and Correlation Number. Water 2023, 15, 2617. [Google Scholar] [CrossRef]
- Jiang, H.; He, G. Analysis of Spatial and Temporal Evolution of Regional Water Resources Carrying Capacity and Influencing Factors—Anhui Province as an Example. Sustainability 2023, 15, 11255. [Google Scholar] [CrossRef]
- Zhang, Y.; Yan, Z.; Song, J.; Wei, A.; Sun, H.; Cheng, D. Analysis for Spatial-Temporal Matching Pattern between Water and Land Resources in Central Asia. Hydrol. Res. 2020, 51, 994–1008. [Google Scholar] [CrossRef]
- Wang, X.; Zhang, J.; Shahid, S.; ElMahdi, A.; He, R.; Wang, X.; Ali, M. Gini Coefficient to Assess Equity in Domestic Water Supply in the Yellow River. Mitig. Adapt. Strateg. Glob. Chang. 2012, 17, 65–75. [Google Scholar] [CrossRef]
- Karimi, A.R.; Mehrdadi, N.; Hashemian, S.J.; Bidhendi, G.R.N.; Moghaddam, R.T. Selection of Wastewater Treatment Process Based on the Analytical Hierarchy Process and Fuzzy Analytical Hierarchy Process Methods. Int. J. Environ. Sci. Technol. 2011, 8, 267–280. [Google Scholar] [CrossRef]
- Wu, J.-Z.; Zhang, Q. Multicriteria Decision Making Method Based on Intuitionistic Fuzzy Weighted Entropy. Expert Syst. Appl. 2011, 38, 916–922. [Google Scholar] [CrossRef]


| Scheme | Water Resources Zoning | Domestic Water | Agricultural Water | Industrial Water | Ecological Water | In Total |
|---|---|---|---|---|---|---|
| Basic scheme | Main urban area | 1863 | 4086 | 1762 | 715 | 8425 |
| Northwest area | 498 | 4670 | 542 | 164 | 5875 | |
| Gubei area | 461 | 2548 | 759 | 181 | 3949 | |
| Jingdong area | 443 | 3064 | 678 | 152 | 4336 | |
| Yanjiang East area | 286 | 1451 | 230 | 107 | 2075 | |
| Yanjiang West area | 423 | 3107 | 1114 | 149 | 4793 | |
| In total | 3974 | 18,926 | 5086 | 1468 | 29,453 | |
| Water conservation scheme | Main urban area | 1736 | 3365 | 1702 | 664 | 7467 |
| Northwest area | 469 | 3921 | 524 | 153 | 5067 | |
| Gubei area | 435 | 2155 | 733 | 168 | 3491 | |
| Jingdong area | 415 | 2564 | 655 | 141 | 3775 | |
| Yanjiang east area | 268 | 1226 | 223 | 99 | 1816 | |
| Yanjiang west area | 398 | 2614 | 1076 | 138 | 4226 | |
| Total | 3721 | 15,845 | 4913 | 1365 | 25,843 |
| Water Resources Zoning | Surface Water | Transit Water | Ground Water | Reclaimed Water | ||
|---|---|---|---|---|---|---|
| Category Ⅰ~Ⅲ | Category IV~V | Piped Water | Irrigation Water | |||
| Main urban area | 807 | 424 | 2770 | 4512 | 30 | 1051 |
| Northwest area | 803 | 422 | 2617 | 3308 | 1 | 39 |
| Gubei area | 552 | 287 | 1774 | 1551 | 2 | 171 |
| Jingdong area | 425 | 219 | 1314 | 2375 | 10 | 329 |
| Yanjiang east area | 260 | 130 | 756 | 1303 | 1 | 230 |
| Yanjiang west area | 551 | 287 | 1708 | 2530 | 0 | 39 |
| In total | 3399 | 1769 | 10,939 | 15,579 | 45 | 1859 |
| Water Resources | Domestic Water | Agriculture Water | Industrial Water | Ecological Water |
|---|---|---|---|---|
| Class Ⅰ~Ⅲ surface water | 1 | 1 | 0 | 0 |
| Class IV~V surface water | 0 | 1 | 0 | 1 |
| Piped water | 1 | 0 | 1 | 1 |
| Irrigation water | 0 | 1 | 0 | 0 |
| Ground water | 0 | 0 | 1 | 0 |
| Reclaimed water | 0 | 1 | 1 | 1 |
| Coefficient | Domestic Water | Water for Agriculture | Industrial Water | Ecological Water | ||||||||
|---|---|---|---|---|---|---|---|---|---|---|---|---|
| Class Ⅰ~Ⅲ Surface Water | Piped Water | Class Ⅰ~Ⅲ Surface Water | Class IV~V Surface Water | Irrigation Water | Reclaimed Water | Piped Water | Ground Water | Reclaimed Water | Class IV~V Surface Water | Piped Water | Reclaimed Water | |
| Water supply sequence | 0.33 | 0.67 | 0.20 | 0.40 | 0.30 | 0.10 | 0.33 | 0.50 | 0.17 | 0.33 | 0.17 | 0.50 |
| Water equity | 0.67 | 0.40 | 0.33 | 0.67 | 1.00 | 0.10 | 0.67 | 1.00 | 0.30 | 0.33 | 0.20 | 0.33 |
| Serial Number | Spatial Balance Degree | Spatial Balance Level |
|---|---|---|
| 1 | [0, 0.2) | Unbalance |
| 2 | [0.2, 0.4) | Close to unbalance |
| 3 | [0.4, 0.6) | Less balance |
| 4 | [0.6, 0.8) | Basic balance |
| 5 | [0.8, 1.0] | Balance |
| Gini Coefficient | [0, 0.2) | [0.2, 0.3) | [0.3, 0.4) | [0.4, 0.5) | [0.5, 1.0] |
|---|---|---|---|---|---|
| Rating Levels | match | relative match | critical match | mismatch | deep mismatch |
| Scheme | Water Resources Zoning | Domestic Water | Water for Agriculture | Industrial Water | Ecological Water | In Total | ||||||||
|---|---|---|---|---|---|---|---|---|---|---|---|---|---|---|
| Class Ⅰ~Ⅲ Surface Water | Piped Water | Class Ⅰ~Ⅲ Surface Water | Class IV~V Surface Water | Irrigation Water | Reclaimed Water | Piped Water | Ground Water | Reclaimed Water | Class IV~V Surface Water | Piped Water | Reclaimed Water | |||
| Basic scheme | Main urban area | 96 | 1681 | 710 | 422 | 2913 | 1 | 1089 | 30 | 407 | 2 | 1 | 643 | 7993 |
| Northwest area | 13 | 485 | 777 | 407 | 2738 | 0 | 462 | 1 | 5 | 15 | 108 | 34 | 5044 | |
| Gubei area | 0 | 461 | 552 | 281 | 914 | 4 | 637 | 2 | 7 | 6 | 1 | 160 | 3024 | |
| Jingdong area | 11 | 432 | 341 | 202 | 1998 | 0 | 377 | 10 | 194 | 17 | 1 | 135 | 3717 | |
| Yanjiang East area | 46 | 240 | 138 | 122 | 1188 | 3 | 100 | 1 | 129 | 4 | 6 | 97 | 2074 | |
| Yanjiang West area | 2 | 421 | 549 | 272 | 1489 | 1 | 949 | 0 | 3 | 15 | 92 | 35 | 3828 | |
| In total | 168 | 3720 | 3066 | 1707 | 11,239 | 10 | 3613 | 44 | 745 | 59 | 208 | 1103 | 25,680 | |
| Water conservation scheme | Main urban area | 3 | 1712 | 804 | 424 | 2109 | 4 | 1020 | 30 | 457 | 0 | 38 | 590 | 7191 |
| Northwest area | 7 | 462 | 726 | 156 | 2800 | 32 | 447 | 1 | 5 | 83 | 61 | 3 | 4782 | |
| Gubei area | 2 | 433 | 549 | 240 | 938 | 33 | 585 | 2 | 45 | 47 | 28 | 93 | 2995 | |
| Jingdong area | 11 | 404 | 379 | 54 | 1940 | 5 | 429 | 10 | 204 | 16 | 5 | 120 | 3577 | |
| Yanjiang East area | 7 | 261 | 25 | 13 | 1187 | 1 | 72 | 1 | 147 | 10 | 6 | 82 | 1812 | |
| Yanjiang West area | 10 | 388 | 470 | 260 | 1532 | 5 | 920 | 0 | 1 | 27 | 78 | 33 | 3724 | |
| In total | 40 | 3660 | 2954 | 1147 | 10,506 | 79 | 3473 | 44 | 858 | 182 | 216 | 921 | 24,082 | |
| Scheme | Net Benefits of Water Supply/(Million Yuan) | Water Shortages/% | COD Emission/t |
|---|---|---|---|
| Basic scheme | 241.4 | 12 | 14,098.5 |
| Water conservation scheme | 232.7 | 7 | 12,821.8 |
| Scheme | Main Urban Area | Northwest Area | Jingdong Area | Jingdong Area | Yanjiang East Area | Yanjiang West Area |
|---|---|---|---|---|---|---|
| Basic scheme | 4555.3 | 2447.5 | 1963.7 | 1908.9 | 882.5 | 2340.6 |
| Water conservation scheme | 4144.2 | 2287.6 | 1882.4 | 1540.0 | 814.5 | 2153.1 |
| Scheme | Water Resources Zoning | Spatial Equalization Coefficients | Overall Spatial Equalization | |||
|---|---|---|---|---|---|---|
| Domestic Water | Water for Agriculture | Industrial Water | Ecological Water | |||
| Basic scheme | Main urban area | 0.25 | 0.31 | 0.47 | 0.30 | 0.33 |
| Northwest area | 0.70 | 0.37 | 0.67 | 0.65 | 0.60 | |
| Gubei area | 0.63 | 0.63 | 0.89 | 0.69 | 0.71 | |
| Jingdong area | 0.59 | 0.95 | 0.81 | 0.62 | 0.74 | |
| Yanjiang East area | 0.28 | 0.51 | 0.37 | 0.39 | 0.39 | |
| Yanjiang West area | 0.55 | 0.87 | 0.85 | 0.57 | 0.71 | |
| Water conservation scheme | Main urban area | 0.43 | 0.63 | 0.49 | 0.38 | 0.48 |
| Northwest area | 0.76 | 0.45 | 0.70 | 0.66 | 0.64 | |
| Gubei area | 0.70 | 0.67 | 0.96 | 0.76 | 0.78 | |
| Jingdong area | 0.67 | 0.97 | 0.86 | 0.64 | 0.79 | |
| Yanjiang East area | 0.44 | 0.50 | 0.41 | 0.45 | 0.45 | |
| Yanjiang West area | 0.65 | 0.93 | 0.77 | 0.63 | 0.74 | |
| Scheme | Population | GDP | Land Area |
|---|---|---|---|
| Basic scheme | 0.22 | 0.17 | 0.15 |
| Water conservation scheme | 0.19 | 0.15 | 0.14 |
Disclaimer/Publisher’s Note: The statements, opinions and data contained in all publications are solely those of the individual author(s) and contributor(s) and not of MDPI and/or the editor(s). MDPI and/or the editor(s) disclaim responsibility for any injury to people or property resulting from any ideas, methods, instructions or products referred to in the content. |
© 2024 by the authors. Licensee MDPI, Basel, Switzerland. This article is an open access article distributed under the terms and conditions of the Creative Commons Attribution (CC BY) license (https://creativecommons.org/licenses/by/4.0/).
Share and Cite
Zhao, J.; Fang, G.; Wang, X.; Zhong, H. Joint Optimization of Urban Water Quantity and Quality Allocation in the Plain River Network Area. Sustainability 2024, 16, 1368. https://doi.org/10.3390/su16041368
Zhao J, Fang G, Wang X, Zhong H. Joint Optimization of Urban Water Quantity and Quality Allocation in the Plain River Network Area. Sustainability. 2024; 16(4):1368. https://doi.org/10.3390/su16041368
Chicago/Turabian StyleZhao, Jun, Guohua Fang, Xue Wang, and Huayu Zhong. 2024. "Joint Optimization of Urban Water Quantity and Quality Allocation in the Plain River Network Area" Sustainability 16, no. 4: 1368. https://doi.org/10.3390/su16041368
APA StyleZhao, J., Fang, G., Wang, X., & Zhong, H. (2024). Joint Optimization of Urban Water Quantity and Quality Allocation in the Plain River Network Area. Sustainability, 16(4), 1368. https://doi.org/10.3390/su16041368