Article

The Spatial Role and Influencing Mechanism of the Digital Economy in Empowering High-Quality Economic Development

School of Management, Xi’an University of Science and Technology, Xi’an 710054, China
*
Author to whom correspondence should be addressed.
Sustainability 2024, 16(4), 1425; https://doi.org/10.3390/su16041425
Submission received: 2 January 2024 / Revised: 3 February 2024 / Accepted: 6 February 2024 / Published: 8 February 2024
(This article belongs to the Special Issue Digital Technology, Digital Management, and Sustainability)

Abstract

:
Based on the data from 2012 to 2022, this paper comprehensively uses exploratory spatial data analysis, the panel threshold model, and the spatial Durbin model to explore the spatiotemporal evolution characteristics and mechanisms of digital economy and high-quality economic development. The results show that the center of gravity of China’s digital economy development has gradually concentrated in the southeast region, and the level of high-quality economic development has improved rapidly, gradually forming a pattern of radiation driving the development of the central and western regions with the Beijing–Tianjin–Hebei region, the Yangtze River Delta, and the Pearl River Delta. The digital economy can significantly improve the level of high-quality economic development, but this effect has a lag effect, and it can be extended to the fifth stage. There is a single threshold for high-quality economic development of the digital economy, and the two stages of its development can significantly promote the high-quality development of the economy, but the effect of the latter stage is weakened, showing the nonlinear characteristics of first strong and then weak. The digital economy has a notable positive spatial spillover impact, and its development dividend will raise this province’s and its bordering provinces’ levels of high-quality economic development.

1. Introduction

China’s economy has grown at a breakneck pace since enacting the reform and opening-up strategy. This has been made possible by the country’s reliance on the demographic dividend, factor inputs, the pull of external demand, and scale expansion. As a result, China’s gap with developed countries is closing in terms of urbanization and people’s incomes. Because of the objective existence of the law of diminishing marginalis, this extensive mode of economic growth will gradually reveal its drawbacks as the economy reaches a certain stage of development, even though it can quickly improve the social and economic level and has clear effects in promoting employment and social stability, such as a drop in production efficiency, significant resource loss, pollution of the environment, and other issues. Fast but not good, and big but not strong have become a shackle restricting the economy development of China. Against the current backdrop of accelerated globalization and an unstable global economy, China’s past economic growth dividend is gradually disappearing. “Demand contraction, supply shock, and weakening expectations” are the three pressures that China’s economy is currently experiencing. A high-quality and high-efficiency economic growth model has become an inevitable choice for transforming the development model, transforming growth drivers, and optimizing the economic structure. In this regard, the rise of the digital economy has not only spawned new business models, but has also grown to be a significant force behind the economy’s high-quality development. Its contribution to the transition to new from old economic engines as well as to the stimulation of consumption has become more and more apparent [1,2].
By applying and integrating digital technology with the traditional economy, the digital economy promotes a change in the mode of production and a reconfiguration of the innovation system [3]. Additionally, it has effectively addressed the issues of resource mismatch, uneven regional development, and a lackluster industrial innovation capacity in economic development by transforming the data generated and used by the whole society into key production factors [4,5]. Since the digital economy relies heavily on the modern information network, it is impossible to separate the discussion of the digital economy from the analysis of the modern information network. In China today, the internet is a significant component of the contemporary information network [6]. Researchers have discovered that the internet can raise economic development by increasing manufacturing productivity, human capital mismatch, and regional innovation efficiency [7,8,9]. Aside from this, “network externalities” and “Metcalfe’s Law” will cause the benefits of the internet to grow exponentially with the number of users, as well as cause value spillover, and such nonlinear effects and spillover effects will also promote high-quality economic development [7,10]. Thus, whether digital economy also has similar characteristics is worthy of in-depth discussion.
At present, there is a growing complexity in the mechanism path of the digital economy that facilitates high-quality economic development. Throughout existing research, the analysis of the mechanism of the two has mainly been carried out from the micro and macro dimensions. At the micro level, it can be discussed from two aspects: platform economy and enterprise digital transformation. In terms of platform economics, network economies and economies of scale have emerged as significant sources of supplementary profits for goods in the digital economy age. As digital technology has become more widely used, platform economies have grown quickly, and new growth and profit models have been created as a result of the interaction between network economies and economies of scale [11]. In terms of how the digital economy supports business digital transformation, business digital transformation can help businesses better understand consumer demand and maximize resource allocation [12]. At the macro level, it can be discussed from the two aspects of improving resource allocation efficiency and production efficiency. In terms of resource allocation efficiency improvement, the digital economy improves resource allocation efficiency by reducing reliance on traditional production factors in the manufacturing process through the integration of data and digital resources into data elements [13]. In terms of the improvement in TFP, a new technology revolution is underway, and emerging technologies—represented by big data, big models, blockchain, and other concepts of the production process—have brought about the improvement in TFP, which has transformed the traditional approach to enhancing production efficiency by relying solely on manpower and capital increases.
Scholars’ findings essentially agree on one thing when it comes to the digital economy’s influence: it can help to advance high-quality economic development. According to Shen et al. (2022), the effect is pronounced in eastern China [14]. However, Wu et al. (2023) have argued that it has a stronger influence on underdeveloped regions [15]. After that, researchers looked into how the digital economy influences high-quality development. For instance, according to Novikova and Strogonova (2020), the primary engine of economic development is innovation in digital technology and digital processes [16]. Gaziz S. et al. (2020) believe that the primary force driving the growth of SMEs is the digital economy [17]. The digital economy contributes positively to the advancement of sustainable economic growth, as noted by Aniqoh (2020) [18]. However, scholars have found that the unique characteristics of the digital economy also come with new risks and difficulties, like the security of cross-border information transmission, network security, the digital divide, and the dwindling bargaining power of workers [19,20,21]. All these may have a negative impact. In terms of the path of digital economy driving high-quality economic development, scholars’ research mainly focuses on technical innovation, modernizing industrial structures, and increasing production efficiency. According to Ding et al. (2022) and Lu et al. (2023), by increasing the level of technical innovation, the digital economy can promote the economy’s high-quality development [22,23]. Meanwhile, Liao (2023) and Guo et al. (2023) believe that this process has been greatly aided by the modernization of the industrial structure [24,25]. Zhao et al. (2023) have argued that digital economy can boost economic growth by raising businesses’ total factor productivity [26].
The existing literature provides abundant theoretical support for this paper, but it can yet be expanded upon. Firstly, the existing literature only pays attention to the mechanism of action of a certain dimension but does not systematically elaborate its internal mechanism of action. However, data elements can penetrate into every link of production and life, encouraging advancement at the innovation levels of resource allocation efficiency and production efficiency, which reshapes the traditional economic growth model. This is consistent with the concept of high-quality economic development, but the current literature has not incorporated the two into a unified framework to deeply explore their internal mechanism. Secondly, the existing literature fails to note the digital economy’s lag impact. Digital infrastructure construction, the accumulation and training of professional talents, and the popularization of digital technology are not achieved overnight; that is, there can be a lag effect with the digital economy, but few scholars have noticed this. Thirdly, building upon the existing literature, the nonlinear effects of the digital economy are expounded systematically. Because innovation is the digital economy’s primary engine, it will unavoidably have distinct effects on high-quality economic development depending on its stage of development. Furthermore, few researchers have looked into whether the digital economy also has nonlinear impacts because of “network externalities and Metcalfe’s law” in information and communication technologies. Based on this, firstly, the two are visually analyzed with the inclusion of exploratory spatial data analysis (ESDA), thereby revealing a more pronounced spatiotemporal differentiation between them; secondly, dynamic analysis divides the digital economy into several lag periods, and it looks at how the current period affects the high-quality economic development in the ensuing periods; finally, the threshold model is applied to examine the nonlinear consequences of different development stages of digital economy, using the digital economy as the threshold variable.

2. Theoretical Analysis and Research Hypotheses

China’s economic development philosophy and practices have evolved to foster high-quality economic growth, and are also an inevitable choice for addressing the structural conflicts arising from rapid economic expansion and achieving efficiency, equity, sustainability, as well as green and sustainable development. Scholars typically define high-quality economic development in terms of “innovation, coordination, green, open and sharing” [27], which is also the definition of its connotation in this paper. Based on this, this paper further extends its connotation from three levels. The first level is to lead economic development with green development based on the five concepts. The second level is to put people at the core to promote equity and ensure that the fruits of development are shared by the people. The third level is promoting the natural integration of the market and the government, achieving coordinated market and government development, and improving efficiency.

2.1. Positive Contribution of the Digital Economy to High-Quality Economic Development

Endogenous growth mechanism has taken on a new meaning in light of the digital economy [26]. The digital economy, with ICT as its carrier, has generated emerging technologies that offer enormous potential for innovation and value creation. These technologies’ features of digitization, intelligence, and networking also serve as major catalysts for the advancement of efficiency, justice, and sustainability, as well as delivering high-quality economic development. First, the digital economy drives green and sustainable economic development. Utilizing and integrating digital technology have made it possible to increase the intelligence and automation of traditional real industries, as well as the efficiency of production factors and resource utilization [28]; effectively cut down on the production process’s waste of resources, production factors, pollutant emissions; and thus have promoted the transformation of economic growth momentum. Second, the digital economy puts people at the core and promotes the sharing of results. The digital economy propels the constant influx and exchange of innovation-related resources like capital, talent, and knowledge, which supports the ongoing building up of innovation resources and boosts the innovation vitality of businesses as well as China’s level of innovation [29]. Last, the digital economy increases efficiency and pushes the market and government to develop in tandem. The digital economy efficiently prevents resource mismatch and waste, maximizes factor allocation efficiency, and speeds up data and information sharing and intertemporal dissemination through the integration of the AI, blockchain, and other emerging digital technologies. Meanwhile, the digital economy promotes data and information mobility and accessibility, enhances market transparency [30], increases market competition to some level, creates a situation where “good money expels bad money”, and optimizes resource allocation. Accordingly, this paper proposes:
Hypothesis 1. 
High-quality economic development is positively encouraged by the digital economy.

2.2. Nonlinear Effects of the Digital Economy on High-Quality Economic Development

The market activities of the digital economy are conducted on digital platforms and rely on digital network transmission, resulting in a near-zero marginal cost. In accordance with Metcalfe’s law, there exists a positive growth relationship between the square of output value and the number of users. When it surpasses a certain critical point, costs will indefinitely approach zero while output value experiences explosive growth [31]. Firstly, early on in the digital economy’s development, only a small number of large-scale businesses or organizations benefited from its dividend due to the comparatively high costs associated with its construction, innovation, technology, and application. The usage scenario and user scale of the digital economy have experienced qualitative changes with the adoption of various national policies on the growth of the digital economy. This has promoted the inclusive sharing of its development achievements, lowering the cost of economic subjects’ innovation, and increasing production efficiency [32]. Additionally, the digital economy also encourages the government and the market to collaborate; overcomes the weaknesses of traditional market self-regulation; assists market participants in integrating capital, logistics, and information flows; realizes the digitization and intelligence of the production process; and finally improves the effectiveness of government oversight and the efficient use of resources by the market main body, forming the mechanism of incremental returns to scale [33]. Lastly, the traditional industrial boundaries are gradually blurring as new models and business forms, like the sharing economy and platform economy, emerge. As a result, the dividends of group effect are gradually emerging, which cause the benefits of process participants to increase geometrically [34], proving that Metcalfe’s law still holds true in the digital economy. Accordingly, this paper proposes:
Hypothesis 2. 
High-quality economic development is nonlinearly impacted by the digital economy.

2.3. The Spatial Spillover Effect of Digital Economy on High-Quality Economic Development

Its influence on the “five dimensions” is the primary indicator of the digital economy’s spillover effect on high-quality economic development. Firstly, the cost of data replication is nearly negligible in the digital economy era [35], which speeds up the cross-regional flow of innovation elements, so that both local and surrounding areas can enjoy their development dividends. Meanwhile, data elements compress the time and space distance, reduce trans-regional transaction costs, and strengthen the cooperation and coordination of regional economic activities. Secondly, its inclusive characteristics have promoted the penetration of digital technology, lowered the threshold for the use of digital economic-access equipment, reduced the digital divide between areas, and reshaped economic pattern. Lastly, the digital economy’s benefits of openness, sharing, and collaboration have integrated the growth of traditional real industries, sped up cross-regional flow, spillover, and sharing of innovative knowledge, and made its network external effect is more significant [36]. This increases the rivalry between traditional businesses, pushes outdated low-end industries to modernize, and eventually changes the interregional industrial structure, industrial innovation division, and cooperation pattern, which promotes green economic development. That is, the digital economy’s network externalities also promote high-quality economic development. Accordingly, this paper proposes:
Hypothesis 3. 
High-quality economic development is spatially spillover-effected by the digital economy.

3. Model Construction and Data Sources

Given the frequent mention of the digital economy and high-quality economic development in this paper, for ease of comprehension, the terms DIGE and HQED will be utilized to represent these concepts, respectively, throughout subsequent analysis.

3.1. Modeling

To investigate study Hypothesis 1, scholars have typically used techniques like mixed regression, random effect models, and fixed effect models to confirm the linear effects of the DIGE. The autocorrelation of disturbance terms for the same individual in different periods in panel data, however, is frequently ignored by the first two models; however, the fixed effect model can avoid such problems well. So, this paper uses the panel fixed effect model. In light of this, the model was built as follows:
l n h q d i , t = α 0 + α 1 l n d i g e i , t + α c C i , t + μ i + δ t + ε i , t
In Equation (1), i and t are provinces and years, l n h q d i , t is the level of HQED, l n d i g e i , t is the level of the DIGE, C i , t are the control variables, μ i is the province fixed effect, δ t is the year fixed effect, and ε i , t is the random perturbation term.
Since the DIGE is the product of information technology, the “network effect” and “Metcalfe’s law” pertaining to that field may also apply to the DIGE. To confirm a nonlinear impact, panel threshold models are frequently used in research processes by academics to investigate the phased impact of variables; this work likewise employs similar methodology. The panel threshold model was constructed as follows:
l n h q d i , t = φ 0 + φ 1 l n d i g e i , t × I l n d i g e i , t θ + φ 2 l n d i g e i , t × I l n d i g e i , t > θ + φ c C i , t + μ i + ε i , t
In Equation (2), l n d i g e i , t is the threshold variable, I(•) is the indicator function taking the value 0 or 1, and all other variables are consistent with Equation (1).
The spatial econometric model is an effective method to test the spatial spillover effect. Common spatial models include the spatial autoregressive model (SAR), the spatial error model (SEM), and the spatial Durbin model (SDM). The SAR and SEM models assume that the spillover effect is generated by the spatial interaction of the explained variable and the error term, respectively, while the SDM model adds spatial interaction terms of explanatory variables on the basis of considering these two spatial mechanisms; that is, high-quality economic development is not only affected by the DIGE of the province, but also by neighboring provinces. Consequently, the SDM was built as follows:
l n h q d i , t = α 0 + ρ W l n h q d i , t + β 1 W l n d i g e i , t + α 1 l n d i g e i , t + β 2 W C i , t + α c C i , t + μ i + δ t + ε i , t
In Equation (3), ρ is the autoregressive coefficient, β 1 , β 2 are the elasticity coefficients of the spatial interaction terms of the DIGE and the control variable, and W is the spatial weighting matrix. To ensure the robustness of the results, this paper constructed the adjacency matrix ( W 1 ) and the geographic distance matrix ( W 2 ) for the subsequent regression analysis, respectively.

3.2. Variable Description and Measurement

  • Explained variable: HQED (lnhqd). HQED requires innovative, coordinated, green, open, and shared development. Drawing on the framework proposed by Zhang et al. (2022) [37], and building upon findings from Sun et al. (2020) [38], this paper constructs an evaluation index system based on five concepts (Table 1), and adopts the entropy method for measurement.
  • Core explanatory variables: DIGE (lndige). There is no unanimous agreement on what constitutes the DIGE. Thus, based on Wang et al.’s (2021) [39] study and integrating the theoretical analysis presented in this paper, an evaluation index system (Table 2) was constructed encompassing digital technology innovation, digital infrastructure, digital industrialization, and industrial digitalization, adopting the entropy method for measurement.
  • Control variables. In addition, a set of control variables were established to reduce the bias due to missing variables. These variables are as follows: economic development level (del), economic development level has an important impact on local innovation capacity, education, human resources, and market mechanisms, which in turn affects high-quality economic development, using GDP per capita. Government intervention degree (gov): government fiscal expenditure can interfere with the spontaneous regulation of the market, and the intensity of government fiscal intervention affects regional economic development to a certain extent, expressed by the proportion of local fiscal expenditure in GDP. Foreign investment (fdi): foreign investment is an indispensable factor in China’s economic expansion, job creation, and reform advocacy, using the proportion of total foreign investment to GDP. Advanced industrial structure (isa): industrial development structure can directly affect the environment, sustainable development, and international competitiveness, expressed by the proportion of value-added of the tertiary industry to value-added of the secondary industry. Technological innovation (ti): technological innovation is the key to whether China’s economy can cross the middle-income trap, and directly affects the transformation of the production mode and the improvement in resource utilization efficiency, etc.; its importance is self-evident, and the proportion of authorized domestic patent applications to the number of domestic patent applications is expressed.

3.3. Data Sources and Descriptive Statistics of Variables

Panel data from 30 Chinese administrative regions at the provincial level, spanning the years 2012 to 2022, are analyzed in this article (data for Tibet Autonomous Region is absent). To prevent the effect of heteroskedasticity, the main explanatory variables and explanatory variables are taken as logarithmic treatment, and some of the missing data are interpolated to make up for the missing data. The research data come from the China Statistical Yearbook, the National Bureau of Statistics, the Statistical Yearbook of China’s Tertiary Industry, and the Peking University Digital Financial Inclusion Index [40].
Table 3 shows that the indices of HQED and the DIGE differ greatly among different provinces. These results align with Zhao et al.’s (2020) findings [31]. The control variables also exhibit this characteristic.

4. Empirical Testing

4.1. Characterization of Spatial and Temporal Evolution

  • DIGE. This study utilized the ArcGIS 10.7 software to plot the standard deviation ellipse and the center of gravity distribution of the DIGE development index in 2012, 2017, and 2022, respectively, during the study period in order to investigate the evolutionary characteristics of the overall spatiotemporal pattern of China’s DIGE (Figure 1).
As shown in Figure 1, the standard deviation ellipse of the DIGE development level of each province in China shows a northeast–southwest direction, with its center of gravity located in Henan Province, and the transfer route in 2012–2017–2022 being Runan County → Zhengyang County → Xixian County. During 2012–2017, the center of gravity of the ellipse moved to the southeast and the total movement was 28.24 km, of which, 26.33 km was to the south and 10.20 km was to the east; the average annual movement was 5.65 km. In addition, during 2017–2022, the center of gravity of the ellipse also underwent the same southeastward shift as in 2012–2017, moving 21.67 km to the south and 9.31 km to the east, with an overall shift of 23.58 km. At the same time, it can be seen that in the area of these three periods the standard deviation ellipse area fluctuates greatly from 27,539,596 km2 in 2012 to 2,613,893 km2 in 2017, reaching a minimum of 2,417,648 km2 in 2022. The findings indicate a gradual enhancement of the agglomeration effect of the DIGE over the study period; that is, due to the advantages of the southern region in terms of economic development level as well as scientific and technological level, the growth rate of the DIGE in southern China is faster than that of northern China [41].
2.
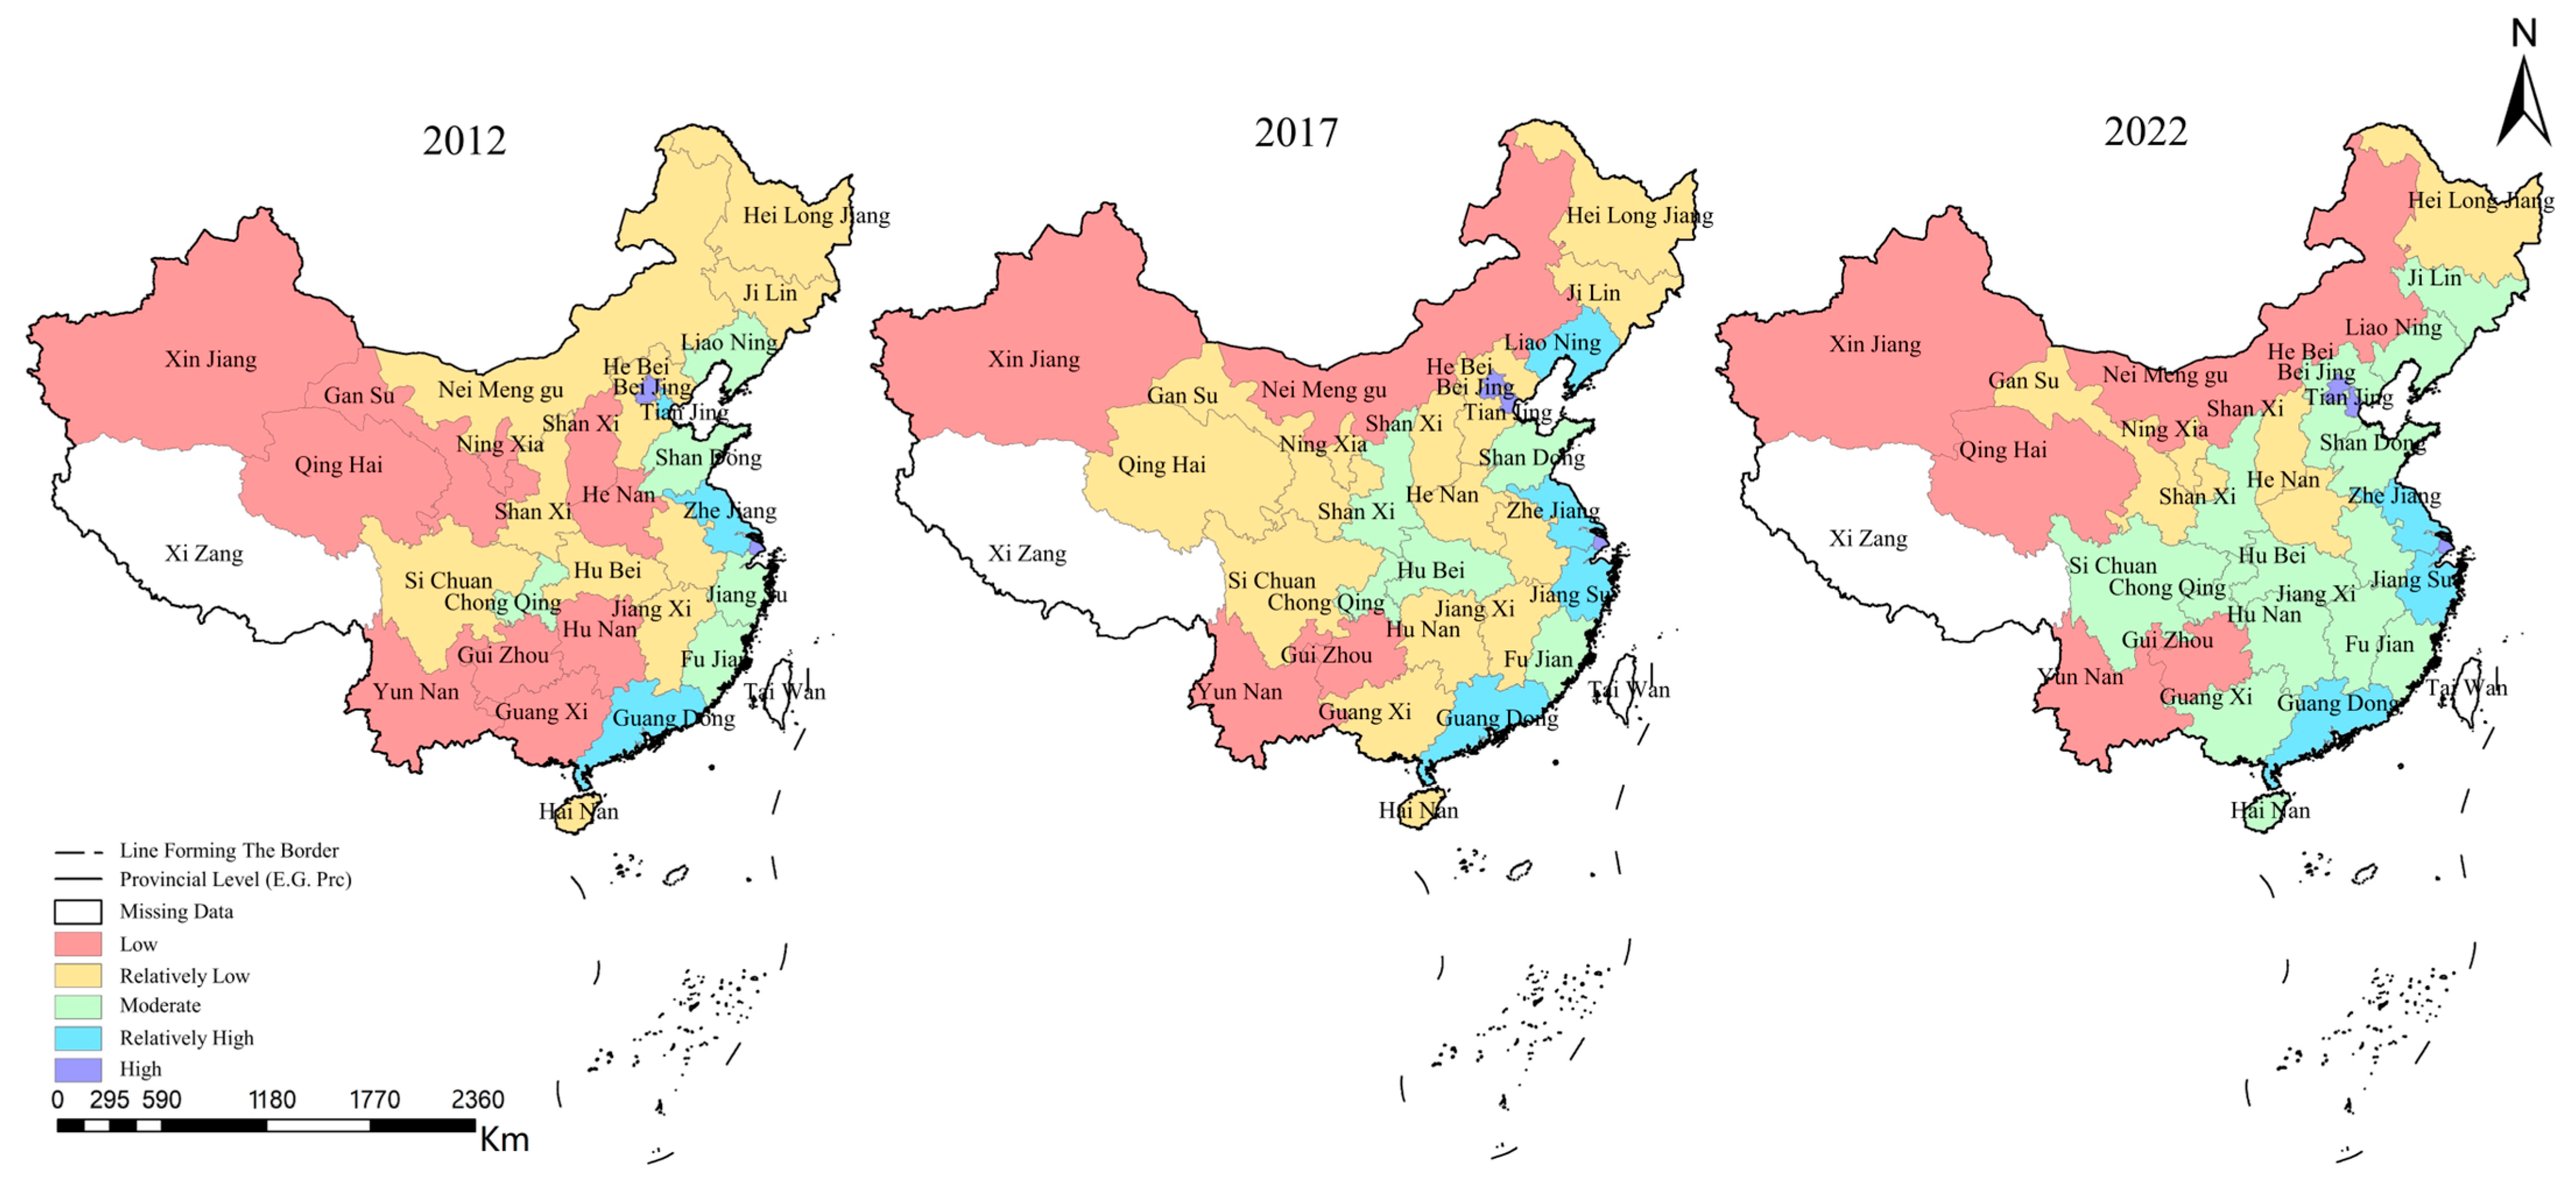
HQED. To further explore the evolution characteristics of the overall spatiotemporal pattern of China’s HQED level in the study, the natural breakpoint method of ArcGIS10.7 software was adopted in this study, which was divided into five levels, and the spatial distribution diagram of these levels in 2012, 2017, and 2022 was drawn, respectively (Figure 2).
Each province’s degree of HQED has greatly increased from 2012 to 2022, as illustrated in Figure 2, owing to China’s steady adoption of the idea of high-quality development. Overall, most provinces in the central and western regions have experienced a transformation of increasing levels, and the provinces in the low level have gradually decreased. Specifically, in 2012, the levels of HQED in most provinces were at the low or lower level, and there was a big gap between the provinces, with only Beijing, Shanghai, Jiangsu, and Guangzhou at a high level or relatively high level of HQED. In 2017, the level of HQED began to undergo hierarchical transitions in most provinces, and Gansu, Qinghai, and Ningxia in the northwest region entered a lower level. The five provinces of Hebei, Shanxi, Henan, Hunan, and Guangxi also transformed from a low level to the lower level. At the same time, the Liaoning and Zhejiang provinces have also undergone a transformation from an intermediate to higher level. By 2022, the level of HQED of all provinces had further improved, most provinces in the east and central regions at the lower stage of development had also joined the ranks of the intermediate level, and a development trend was formed with the level of HQED of the Beijing–Tianjin–Hebei region, the Yangtze River Delta, and the Pearl River Delta. Because of this, the developed eastern coastal provinces have led the way in implementing innovation-driven, industrial structure optimization [42], and other measures since China proposed the high-quality development strategy. These actions have not only directly aided in the development of their own provinces but have also given other provinces valuable experience.

4.2. Benchmark Regression and Mechanism Effects Analysis

4.2.1. Analysis of Baseline Regression Results

Equation (1) was estimated to test the direct effect of the DIGE on HQED, and the results are shown in models (1)–(4) in Table 4. To guarantee the robustness of the regression results, this paper conducted regression analysis through mixed OLS regression models and fixed effect models with and without control variables in the model. Models (1) and (2) are mixed OLS regression models, the first one lacking control variables, and the second one incorporating them. The estimated coefficient of the DIGE in model (1) (0.209) is slightly smaller than that of model (2) (0.210), and both are significant, suggesting that the estimated results have a better fitting effect when control factors are added. Models (3) and (4) are fixed effect models without control variables and after control variables are added, respectively. At the 1% level, both models’ regression coefficients for the DIGE are positive, which enhances the regression results’ robustness even further. Moreover, the estimated coefficient of the DIGE after adding control variables (0.104) is higher than that without adding control variables (0.099), which further indicates that the fitting effect of the estimated results after adding control variables is more reliable, so the regression results after adding control variables will be used for analysis here. The estimated coefficient of the DIGE in model (4) is significantly positive, indicating that the DIGE promotes an improvement in HQED, and that every 1 unit of the DIGE can promote the level of HQED by 0.104 units. Hypothesis 1 is verified. It is important to note that when model (4)’s control variables were added, the coefficient of d e l was significantly negative, indicating that under the new development concept, HQED does not mean the pursuit of economic aggregate growth [31], and the environmental pollution and other problems caused by the previous extensive economic growth mode are not in line with the concept of HQED. The coefficient of g o v is significantly positive, indicating that since entering the new development stage, all provinces have actively introduced corresponding policies to promote their own HQED level. The positive correlation between f d i , i s a , and HQED indicates that HQED has not been effectively improved during the study period when factories were opened by foreign investment and industrial structure adjustment. The estimated coefficient of t i is positive but not significant, and it shows that the emergence of the new technology requires pilot experiments to be conducted; that is, there is a large lag period and so a significant effect cannot be produced immediately.

4.2.2. Dynamic Effect Analysis

The DIGE represents an innovative economic model that seamlessly merges digital technology with the tangible world, utilizing modern information networks as its carrier. This means that the growth of the DIGE must be coordinated with the development of the infrastructure that supports it, including gigabit optical fiber, IPv6, 5G base stations, and satellite communications, as well as with the innovation of new digital technologies like AI and blockchain. In other words, long-term general planning and deployment are necessary for the development of digital technologies and the construction of digital infrastructure. This means that the DIGE may have a certain lag effect while affecting HQED. Therefore, this paper adopts dynamic analysis (here, dynamic analysis means that the core explanatory variable of the DIGE lags behind for several periods, and so we examine the impact of the current DIGE on HQED in the next few periods) to test the lag effect of the DIGE on HQED [43]. Table 4’s models (5) through (7) demonstrate that, with an estimated coefficient of 0.085, the DIGE has the biggest impact on the advancement of HQED in the current period. The second and third lagging periods’ DIGE regression coefficients are likewise considerably positive at the 1% level; however, as the number of lagging periods increases, the estimated coefficient gradually diminishes and the effect becomes less weakened. When the core explanatory variable, DIGE, is in the sixth period, its estimated coefficient is no longer significant, which indicates that in the study samples of this paper, the DIGE has a lagging effect on HQED, and its enhancement effect on HQED can be sustained until the fifth period.

4.3. NonLinear Effects Test Analysis

As analyzed above, considering that “Metcalfe’s law” may exist in the DIGE, the panel threshold model is adopted to verify whether it has a nonlinear effect on HQED. First, in order to verify whether there is a panel threshold for the DIGE index, a triple threshold was set and 300 rounds of repeated sampling were conducted using Bootstrap. The test results showed that the DIGE index meets the single threshold test, but falls short of meeting the criteria for the double and triple threshold tests (Table 5). Therefore, on the basis of the threshold test, a single threshold was set for regression (Table 6).
As Table 6 illustrates, when the DIGE index reaches −2.271, the promotion effect of the DIGE on the level of HQED changes. Specifically, when the DIGE index is less than −2.271, its estimated coefficient for HQED is 0.134 and is significant at the 1% level, indicating that the DIGE’s development can significantly improve the level of HQED. When the DIGE index is greater than −2.271, its estimated coefficient of the HQED index is also significantly positive, indicating that, at this stage, the DIGE can still significantly promote an improvement in HQED, but its driving effect is weaker than that of the first stage. In general, the DIGE can effectively improve the level of HQED, but its enhancement effect is gradually weakened with the increase in the DIGE development index; that is, the DIGE has a nonlinear effect of first strengthening and then weakening the level of HQED, which verifies Hypothesis 2.

4.4. Spatial Effects Test

Data resources are the primary production factors in the DIGE, and network externalities like the permeability and widespread distribution of data mean that the DIGE not only influences neighboring provinces but also raises the standard of development of the local economy. In order to confirm the DIGE’s spillover impact, the SDM was used. Moran’s index is an effective tool for testing the existence of spatial effects before conducting spatial econometric analysis. The spatial autocorrelations of the DIGE and HQED in the adjacency matrix ( W 1 ) and geographical distance matrix ( W 2 ) were verified by Moran’s index (Table 7). As can be seen from Table 7, the DIGE and HQED indices from 2012 to 2022 are significant under different matrices, indicating that the DIGE and HQED have significant spatial autocorrelation characteristics during the study period.

4.4.1. Point Estimate Results

The results of the Moran test show that there is a significant spatial autocorrelation between the DIGE and HQED. Therefore, appropriate models should be selected for analysis before the subsequent regression of spatial econometric models. After the LM test, Hausman test, LR test, and Wald test, the SDM model will not degenerate into the SEM and SAR model, so the SDM with dual fixed time and space was adopted for subsequent analysis. The impact of the DIGE on HQED is shown by the SDM regression findings in Table 8 for both the W 1 and W 2 . Specifically, under the W 1 , the DIGE coefficient is 0.177, significant at the 1% level, demonstrating how the growth of the DIGE can propel the local HQED. The spatial lag coefficient is significantly positive, which shows that the growth of a local DIGE can promote the degree of HQED in adjacent provinces; in other words, there can be a positive spatial spillover effect from the DIGE. Under the W 2 , the DIGE and its spatial lag coefficient also have similar estimation results, which shows that the above results are robust and verify Hypothesis 3.

4.4.2. Partial Differential Estimation Results

This work further executes partial differential estimation under the W 1 and W 2 based on the point estimation findings. Table 9 presents the results.
Under the W 1 , the coefficient of direct effect of the DIGE on HQED is 0.183 and significant, demonstrating that the DIGE may significantly raise this province’s HQED level. The following are possible causes: first, in the era of the DIGE, digital technology has been incorporated into the production system, integrating data resources into production factors. This has accelerated the free flow of production factors and promoted the marketization of production factors, which not only improves production efficiency, but also promotes an improvement in total factor productivity. Second, digital products and services support government services, and improve the quality of government services and the digital and intelligence level of social and economic governance, so as to achieve a coordinated and balanced development of industries, increase total factor productivity, and narrow the industrial gap to provide digital impetus. Third, digital technology utilization can encourage labor mobility, allowing for all workers to benefit from social welfare. Meanwhile, the indirect estimation coefficient of the DIGE on HQED is 0.114 and also significant; that is, every 1% improvement in the DIGE will drive the HQED level of surrounding provinces to increase by 0.114%. This suggests that the DIGE has a positive spillover effect on HQED, further supporting Hypothesis 3. It is worth noting that under the W 2 , a comparable regression result for the enhancement of HQED is also present in the DIGE, indicating that the above partial differential estimation results are robust.

5. Conclusions and Policy Recommendations

5.1. Conclusions

The coordinated development and construction of the DIGE are in line with the concept of HQED, and are a vital measure to implementing the new development concept. Therefore, this study takes the reality that the DIGE has a great impact on social and economic development as an entry point and uses the ESDA, fixed panel effect model, panel threshold model, and SDM based on the panel data from 30 Chinese administrative regions at the provincial level, spanning the years 2012 to 2022, on the basis of constructing a HQED and DIGE indicator system. This paper verifies the spatiotemporal heterogeneity of China’s DIGE and HQED, and empirically tests the internal mechanism and action mechanism of the DIGE on HQED in multiple dimensions. The conclusions are as follows.
First, China’s DIGE underwent rapid expansion during the study period, and as time went on, the overall center of gravity started to shift to the southeast, eventually forming the features of the southeast region cluster. At the same time, a qualitative jump in HQED also occurred throughout the research period, forming a spatial development pattern with the development of central and western regions driven by the radiation of the Yangtze River Delta, Pearl River Delta, and Beijing–Tianjin–Hebei region.
Second, the DIGE significantly promoted the improvement in the level of HQED, and the conclusion remained stable after adding the fixed effects of time and province. The dynamic analysis results show that the DIGE has a lagging effect on HQED, and when the DIGE lags to the sixth stage, the effect on HQED is not significant.
Third, the DIGE has a nonlinear effect of a single threshold on HQED. The DIGE development index can significantly promote an improvement in HQED at both sides of the threshold value, and the improvement effect on the left side of the threshold value is greater than that on the right side of the threshold value, showing a nonlinear feature that is first strong and then weak.
Fourth, the point estimation results of the SDM show that the DIGE has a spatial spillover effect, which is manifested in that the DIGE can not only significantly improve the local HQED, but also significantly promote HQED in neighboring provinces. The results of the partial differential estimation show that both direct and indirect effects of the DIGE can promote HQED, which further supports the conclusion of the point estimation results. After replacing the space matrix, the results are still consistent with the above, which indicates that the estimation results of the SDM are robust.

5.2. Policy Recommendations

This study’s findings lead this paper to propose the following policy recommendations:
First, implementing regional differentiation and dynamic development, allowing the Beijing and Tianjin regions, as well as the eastern coastal provinces and regions, to fully adopt their leading and radiating roles, forming a development pattern where the eastern region radiates to drive the development of the central and western regions and further eliminate the digital divide. At the same time, in order to undertake industrial transfer from the eastern region, the central and western regions should simultaneously modernize their infrastructure.
Second, given that the DIGE has the potential to enhance HQED, the government ought to augment its investment and backing for digital technology, persist in endorsing innovative digital technology, develop digital infrastructure, train talent in digital technology, facilitate digital sharing, and implement other measures to foster the digital economy. Additionally, the process of digital industrialization and industrial digitalization should be further advanced.
Third, create plans for the DIGE and HQED that take local factors and the region’s actual development into consideration. In order to strengthen the weak points in the central and western regions’ DIGE development and close the gap with the eastern region, it is important to expedite the implementation of supporting policies like building DIGE infrastructure, bringing in digital talent, and offering tax breaks. The eastern area should concentrate on the advancement of digital core technologies, improve resource integration and critical technical support capabilities, and offer policy assurances to better encourage the beneficial contribution of the DIGE to HQED.
Fourth, promote regional integrated development. The DIGE has the characteristics of spatial spillover. The driving and radiating role of neighboring regions should be fully embraced by regions with a high degree of DIGE. Local governments should strengthen exchanges and cooperation, establish platforms for sharing digital factors, and smooth the flow of digital factor resources.

6. Discussion

In this study, by sorting out the impact mechanism of the DIGE on HQED, this paper finds that the DIGE can promote China’s HQED, and this effect exists in different stages of DIGE development. It is also found that the DIGE not only promotes HQED in the local areas, but also promotes HQED in neighboring regions. This is consistent with previous studies [7,31,42]. However, on the basis of calculating the level of DIGE and HQED in China, we used exploratory spatial data analysis (ESDA) to analyze the temporal and spatial evolution characteristics of the two. Furthermore, we used dynamic analysis to find that there is a lag effect of DIGE in promoting HQED and to confirm the research results of the panel threshold model in this paper, which is different from other studies. While our research clarifies the mechanisms by which the DIGE affects HQED, there is room for further improvement. First, due to the availability of data, we only studied the impact at the provincial level, and more in-depth research can be conducted from the perspective of prefecture-level cities in the future. Second, the emergence of various emerging technologies in the era of the DIGE may trigger scientific and technological revolution. Therefore, in future studies, an index system can be comprehensively constructed to measure the level of technological innovation, and the mechanism of technological innovation’s impact on HQED can be sorted out for in-depth study, rather than simply used as a control variable.

Author Contributions

Conceptualization, M.S.; methodology, S.Z.; software, S.Z.; validation, Q.Y. and M.S.; formal analysis, Q.Y.; investigation, S.Z.; resources, M.S.; data curation, S.Z. and Q.Y.; writing—original draft preparation, M.S., S.Z. and Q.Y.; writing—review and editing, M.S.; visualization, S.Z. and Q.Y.; supervision, Q.Y. All authors have read and agreed to the published version of the manuscript.

Funding

This research was funded by the Natural Science Foundation of China (No. 72004181), Humanities and Social Science Fund of Ministry of Education of China (No. 20YJC630190).

Institutional Review Board Statement

Not applicable.

Informed Consent Statement

Not applicable.

Data Availability Statement

The data that support the findings of this study are available on reasonable request from the authors.

Conflicts of Interest

The authors declare no conflicts of interest.

References

  1. Rong, K. Research Agenda for the Digital Economy. J. Digit. Econ. 2022, 1, 20–31. [Google Scholar] [CrossRef]
  2. Ge, H.P.; Wu, F.X. Digital Economy Enabling High-quality Economic Development: Theoretical Mechanism and Empirical Evidence. Nanjing Soc. Sci. 2021, 1, 24–33. [Google Scholar]
  3. Li, H.Q.; Jian, Z.Q.; Mao, S.P. Enabling High-quality Development in the Digital Economy: Internal Mechanisms and China’s Experience. Econ. Probl. Explor. 2023, 8, 117–131. [Google Scholar]
  4. Sultana, S.; Akter, S.; Kyriazis, E.; Fosso Wamba, S. Architecting and Developing Big Data-Driven Innovation (DDI) in the Digital Economy. J. Glob. Inf. Manag. 2021, 29, 165–187. [Google Scholar] [CrossRef]
  5. Bessonova, E.; Kelesh, Y.; Babichev, A. Shaping an Effective Ecosystem of the Regional Digital Economy in the Context of Uneven Digital Development. In Proceedings of the International Conference on Comprehensible Science, London, UK, 21–23 June 2022. [Google Scholar]
  6. Zhang, Y.H.; Wang, M.H.; Liu, T.T. The Spatial Effect and Influence Path of Digital Economy on China’s High-quality Economic Development. Geogr. Res. 2022, 41, 1826–1844. [Google Scholar]
  7. Fang, Z.; Razzaq, A.; Mohsin, M.; Irfan, M. Spatial Spillovers and Threshold Effects of Internet Development and Entrepreneurship on Green Innovation Efficiency in China. Technol. Soc. 2022, 68, 101844. [Google Scholar] [CrossRef]
  8. Garg, K.; Goswami, C.; Chhatrawat, R.S.; Dhakar, S.K.; Kumar, G. Internet of Things in Manufacturing: A Review. Mater. Today Proc. 2022, 51, 286–288. [Google Scholar] [CrossRef]
  9. Liu, S.Y.; Wu, Y.M.; Wu, Q.S. Can Internet Penetration Improve Human Capital Misallocation? Contemp. Financ. Econ. 2022, 6, 12–25. [Google Scholar]
  10. Li, J.L.; Chen, L.T.; Liu, M. The Impact of Internet Development on Regional Green Economy Efficiency in China. China’s Popul. Resour. Environ. 2021, 31, 149–157. [Google Scholar]
  11. Matarazzo, M.; Penco, L.; Profumo, G.; Quaglia, R. Digital Transformation and Customer Value Creation in Made in Italy SMEs: A Dynamic Capabilities Perspective. J. Bus. Res. 2021, 123, 642–656. [Google Scholar] [CrossRef]
  12. Khudoykulov, H.; Sherov, A. Digital Economy Development in Corporate Governance of Joint Stock Company. J. Econ. Bus. 2021, 3, 217–219. [Google Scholar]
  13. Ren, B.P.; He, H.C. Enabling High-quality Development in Digital Economy: Theoretical Logic, Path Selection and Policy Orientation. Financ. Sci. 2022, 4, 61–75. [Google Scholar]
  14. Shen, X.; Zhao, H.; Yu, J.; Wan, Z.; He, T.; Liu, J. Digital Economy and Ecological Performance: Evidence from a Spatial Panel Data in China. Front. Environ. Sci. 2022, 10, 969878. [Google Scholar] [CrossRef]
  15. Wu, X. Research on the Digital Economy Promoting the High-Quality Development of Trade in the Central and Western Regions under the Background of Big Data Technology. Optik 2023, 272, 170273. [Google Scholar] [CrossRef]
  16. Strogonova, E.; Novikova, N. Regional Aspects of Studying the Digital Economy in the System of Economic Growth Drivers. J. New Econ. 2020, 21, 76–93. [Google Scholar] [CrossRef]
  17. Sagituly, G.; Oteshova, A.; Prodanova, N.; Savina, N.; Bokov, D. Digital Economy and Its Role in the Process of Economic Development. J. Secur. Sustain. Issues 2020, 9, 1225. [Google Scholar]
  18. Aniqoh, N.A.F. The Role of Digital Economy to Enhancing Sustainable Economic Development. Int. J. Soc. Sci. Bus. 2020, 4, 519. [Google Scholar] [CrossRef]
  19. Amuso, V.; Poletti, G.; Montibello, D. The Digital Economy: Opportunities and Challenges. Glob. Policy 2020, 11, 124–127. [Google Scholar] [CrossRef]
  20. Larionova, M.; Shelepov, A. Emerging Regulation for the Digital Economy: Challenges and Opportunities for Multilateral Global Governance. Int. Organ. Res. J. 2021, 16, 29–63. [Google Scholar] [CrossRef]
  21. Xia, L.; Baghaie, S.; Sajadi, S.M. The Digital Economy: Challenges and Opportunities in the New Era of Technology and Electronic Communications. Ain Shams Eng. J. 2024, 15, 102411. [Google Scholar] [CrossRef]
  22. Ding, C.; Liu, C.; Zheng, C.; Li, F. Digital Economy, Technological Innovation and High-Quality Economic Development: Based on Spatial Effect and Mediation Effect. Sustainability 2022, 14, 216. [Google Scholar] [CrossRef]
  23. Lu, J.; Zhou, S.; Xiao, X.; Zhong, M.; Zhao, Y. The Dynamic Evolution of the Digital Economy and Its Impact on the Urban Green Innovation Development from the Perspective of Driving Force—Taking China’s Yangtze River Economic Belt Cities as an Example. Sustainability 2023, 15, 6989. [Google Scholar] [CrossRef]
  24. Liao, W. How Does the Digital Economy Affect the Development of the Green Economy? Evidence from Chinese Cities. PLoS ONE 2023, 18, e0289826. [Google Scholar] [CrossRef]
  25. Guo, Y.; Jiang, F. How Does the Digital Economy Drive High-Quality Regional Development? New Evidence From China. Eval. Rev. 2023. online first. [Google Scholar] [CrossRef]
  26. Zhao, C.; Liu, Z.; Yan, X. Does the Digital Economy Increase Green TFP in Cities? Int. J. Environ. Res. Public Health 2023, 20, 1442. [Google Scholar] [CrossRef]
  27. Pan, W.; Wang, J.; Lu, Z.; Liu, Y.; Li, Y. High-Quality Development in China: Measurement System, Spatial Pattern, and Improvement Paths. Habitat. Int. 2021, 118, 102458. [Google Scholar] [CrossRef]
  28. Williams, L.D. Concepts of Digital Economy and Industry 4.0 in Intelligent and Information Systems. Int. J. Intell. Netw. 2021, 2, 122–129. [Google Scholar] [CrossRef]
  29. Shi, Y.; Zhang, T.; Jiang, Y. Digital Economy, Technological Innovation and Urban Resilience. Sustainability 2023, 15, 9250. [Google Scholar] [CrossRef]
  30. Clifton, N.; Füzi, A.; Loudon, G. Coworking in the Digital Economy: Context, Motivations, and Outcomes. Futures 2022, 135, 102439. [Google Scholar] [CrossRef]
  31. Zhao, T.; Zhang, Z.; Liang, S.K. Digital Economy, Entrepreneurial Activity and High-Quality Development: Empirical Evidence from Chinese Cities. Manag. World 2020, 36, 65–76. [Google Scholar]
  32. Zhang, W.; Zhao, S.; Wan, X.; Yao, Y. Study on the Effect of Digital Economy on High-Quality Economic Development in China. PLoS ONE 2021, 16, e0257365. [Google Scholar] [CrossRef]
  33. Legowo, M.B.; Prayitno, D.; Indiarto, B. Digital Economy Inclusiveness Information System Model to Encourage National Economic Recovery: Recover Together, Recover Stronger. In Proceedings of the Conference towards ASEAN Chairmanship 2023 (T-A-C 23 2021), Online, 13–15 December 2021; Atlantis Press: Amsterdam, The Netherlands, 2021; pp. 61–67. [Google Scholar]
  34. Pouri, M.J.; Hilty, L.M. The Digital Sharing Economy: A Confluence of Technical and Social Sharing. Environ. Innov. Soc. Transit. 2021, 38, 127–139. [Google Scholar] [CrossRef]
  35. Farboodi, M.; Veldkamp, L. A Model of the Data Economy; National Bureau of Economic Research: Cambridge, MA, USA, 2021; p. w28427. [Google Scholar]
  36. Han, J.; Chen, X.; Feng, X.H. The Practical Challenge and Path Choice of Digital Economy Enabling Green Development. Reformation 2022, 9, 11–23. [Google Scholar]
  37. Zhang, Z.B.; Bi, Z.Q. High-Quality Economic Development. Econ. Res. 2022, 57, 21–32. [Google Scholar]
  38. Sun, H.; Gui, H.Q.; Yang, D. Measurement and Evaluation of High-Quality Development of Provincial Economy in China. Zhejiang Soc. Sci. 2020, 8, 4–14+155. [Google Scholar]
  39. Wang, J.; Zhu, J.; Luo, X. The Development Level and Evolution Measurement of China’s Digital Economy. Quant. Econ. Tech. Econ. Res. 2021, 38, 26–42. [Google Scholar]
  40. Feng Guo, J.W. Measuring the Development of Digital Financial Inclusion in China: Index Compilation and Spatial Characteristics. Economics 2020, 19, 1401–1418. [Google Scholar]
  41. Pan, W.H.; He, Z.C.; Pan, H.Y. Space-Time Evolution and Distribution Dynamics of China’s Digital Economy Development. China Soft Sci. 2021, 10, 137–147. [Google Scholar]
  42. Zhou, H.; Li, X.; Li, X. Can the Digital Economy Improve the Level of High-Quality Financial Development? Evidence from China. Sustainability 2023, 15, 7451. [Google Scholar] [CrossRef]
  43. Zhao, Y.P.; Ye, J. Study on the Influence of Foreign Direct Investment on China’s Industrial Structure. Quant. Econ. Tech. Econ. Res. 2018, 35, 78–95. [Google Scholar]
Figure 1. Spatial and temporal evolution pattern of the DIGE.
Sustainability 16 01425 g001
Figure 2. Spatial and temporal evolution patterns of HQED.
Sustainability 16 01425 g002
Table 1. System of evaluation indicators for HQED.
DimensionFirst-Order IndexSecondary IndexMeasurement Index
High-quality economic developmentInnovationsInnovation InputsR&D intensityR&D expenditure/GDP
Investment efficiencyInvestment rate/GDP growth rate
Innovation OutputsTechnology transaction activityTechnology transaction turnover/GDP
CoordinationUrban–rural coordinationGovernment debt burdenGovernment debt balance/GDP
Urban and rural structureurbanization rate
Industrial CoordinationIndustrial structureTertiary industry output/GDP
Regional CoordinationDemand structureTotal retail sales of consumer goods/GDP
GreenEnergy EfficiencyEnergy consumption intensityTotal energy consumption/GDP
Environmental PollutionWastewater per unit of outputWastewater Emission/GDP
Waste gas per unit of outputSulfur dioxide emission/GDP
OpennessOpenness to the Outside WorldDependence on foreign tradeTotal import and export/GDP
Share of foreign investmentTotal foreign investment/GDP
Openness to DomesticDegree of marketizationRegional marketization index
SharingUrban and Rural SharingShare of labor compensationLabor compensation/GDP
Elasticity of income growthPer capita disposable income growth rate/GDP growth rate
Urban–rural consumption gapPer capita consumption expenditure of urban residents/per capita consumption expenditure of rural residents
Livelihood SharingShare of fiscal expenditure on people’sShare of local financial expenditure on education, health care, housing security, social security, and employment/local financial budget expenditure
Table 2. DIGE evaluation indicator system.
First-Order IndexSecondary IndexMeasurement Index
Digital economyDigital Technology InnovationR&D personnel engaged in high-tech industries
Expenditure on R&D in high-tech industries
Scientific and technological output of high-tech industries
Digital InfrastructureNumber of internet broadband access ports
Density of cell phone base stations
Mobile phone penetration rate
Length of fiber optic cable lines
Digital IndustrializationSoftware business revenue
Information technology service revenue
Total telecom business
Industrial DigitizationEnterprise e-commerce sales
Number of websites per 100 enterprises
Digital inclusive finance index
Table 3. Descriptive statistics of the variables.
ObsMeanStd. Dev.MinMax
l n h q d 330−1.4830.337−1.988−0.542
l n d i g e 330−2.3110.694−4.049−0.527
d e l 3306.0593.0801.88019.053
g o v 3300.2600.1110.1050.758
f d i 3300.9434.6420.05559.278
i s a 3301.3840.7510.6115.283
t i 3300.6050.1440.2511.082
Table 4. Benchmark regression and dynamic effect test results.
Variable(1)(2)(3)(4)(5)(6)(7)
l n d i g e 0.208 ***
(19.35)
0.210 ***
(18.29)
0.099 ***
(4.52)
0.104 ***
(11.44)
——————
l . l n d i g e ————————0.085 ***
(3.39)
————
l 2 . l n d i g e ——————————0.075 ***
(3.32)
——
l 3 . l n d i g e ————————————0.072 **
(3.87)
d e l ——0.036 **
(2.10)
——−0.001
(−0.04)
0.001
(0.01)
0.001
(0.13)
−0.007
(−0.49)
g o v ——1.165 ***
(3.23)
——0.595 ***
(3.33)
0.461 **
(2.14)
0.445 **
(2.68)
0.241
(1.37)
f d i ——0.005
(0.67)
——−0.004
(−1.11)
−0.004
(−1.26)
0.002
(0.92)
0.002
(0.90)
i s a ——−0.119 *
(−1.09)
——−0.030
(−1.08)
0.021
(0.42)
0.004
(0.17)
0.020
(0.64)
t i ——−0.209
(−0.78)
——0.099
(0.56)
0.103
(0.93)
0.048
(0.39)
0.081
(0.64)
_cons1.099 ***
(15.42)
0.857 ***
(4.40)
1.735 ***
(13.58)
1.540 ***
(10.67)
1.560 ***
(6.52)
1.629 ***
(0.39)
1.658 ***
(8.83)
Provinces————YESYESYESYESYES
Year————YESYESYESYESYES
Obs330330330330300270240
R 2 0.5330.5490.6200.6150.6320.6480.637
Note: t statistic in parentheses, * p < 0.1, ** p < 0.05, *** p < 0.01.
Table 5. Threshold test results.
VariableThresholdFPEstimated Threshold95% Confidence Interval1%5%10%
l n d i g e Single29.550.013−2.271[−2.284, −2.270]29.98122.52519.459
Double7.580.727−1.661[−1.746, −1.643]28.87921.45818.411
Triple11.310.387−1.614[−1.985, −1.601]28.03422.78419.692
Table 6. Panel threshold regression results.
Variablelndige (Th ≤ −2.271)lndige (Th > −2.271)
l n d i g e 0.134 ***
(0.247)
0.098 ***
(0.031)
_cons−1.133 ***
(0.074)
control variableYES
Obs330
Provinces30
R 2 0.588
Note: standard errors in parentheses, * p < 0.1, ** p < 0.05, *** p < 0.01, same below.
Table 7. Spatial autocorrelations test results.
Yearlndigelndige
W1W2W1W2
Moran′IZMoran′IZMoran′IZMoran′IZ
20120.174 **2.00420120.174 **2.00420120.174 **2.004
20130.130 *1.51520130.130 *1.51520130.130 *1.515
20140.191 **2.06820140.191 **2.06820140.191 **2.068
20150.208 **2.21420150.208 **2.21420150.208 **2.214
20160.259 ***2.68020160.259 ***2.68020160.259 ***2.680
20170.295 ***3.01920170.295 ***3.01920170.295 ***3.019
20180.277 ***2.87520180.277 ***2.87520180.277 ***2.875
20190.235 ***2.49520190.235 ***2.49520190.235 ***2.495
20200.221 ***2.38520200.221 ***2.38520200.221 ***2.385
20210.195 **2.14920210.195 **2.14920210.195 **2.149
20220.194 **2.15320220.194 **2.15320220.194 **2.153
Note: * p < 0.1, ** p < 0.05, *** p < 0.01.
Table 8. Point estimation results of spatial Durbin model.
VariableW1W2
l n d i g e 0.177 ***
(0.012)
0.187 ***
(0.013)
d e l 0.297 *
(0.015)
0.032 *
(0.018)
g o v 0.644 **
(0.321)
1.221 ***
(0.362)
f d i −0.001
(0.007)
−0.001
(0.007)
i s a −0.135 **
(0.06)
−0.131 **
(0.067)
t i −0.871 ***
(0.259)
−0.809 **
(0.271)
W l n d i g e 0.033 *
(0.236)
0.255 ***
(0.092)
W d e l 0.178 ***
(0.031)
0.482 ***
(0.154)
W g o v 2.265 ***
(0.599)
11.496 ***
(2.720)
W f d i −0.004
(0.013)
−0.002
(0.075)
W i s a −0.277
(0.113)
−0.089 *
(0.521)
W t i −0.179
(0.442)
1.323
(2.027)
ρ 0.298 ***
(0.075)
0.077
(0.227)
R 2 0.7640.705
ProvincesYESYES
YearYESYES
Obs330330
Note: standard errors in parentheses, * p < 0.1, ** p < 0.05, *** p < 0.01.
Table 9. Partial differential estimation results of spatial Durbin model.
VariableW1W2
DirectIndirectTotalDirectIndirectTotal
l n d i g e 0.183 ***
(0.012)
0.114 ***
(0.023)
0.298 ***
(0.026)
0.186 ***
(0.013)
0.227 **
(0.094)
0.414 ***
(0.094)
Control VariableYESYES
ProvincesYESYES
YearYESYES
R 2 0.7640.705
obs330330
Note: standard errors in parentheses, * p < 0.1, ** p < 0.05, *** p < 0.01.
Disclaimer/Publisher’s Note: The statements, opinions and data contained in all publications are solely those of the individual author(s) and contributor(s) and not of MDPI and/or the editor(s). MDPI and/or the editor(s) disclaim responsibility for any injury to people or property resulting from any ideas, methods, instructions or products referred to in the content.

