
Bibliometric Analysis of Urban Coastal Development: Strategies for Climate-Resilient Timber Housing


Abstract
:1. Introduction
2. Materials and Methods
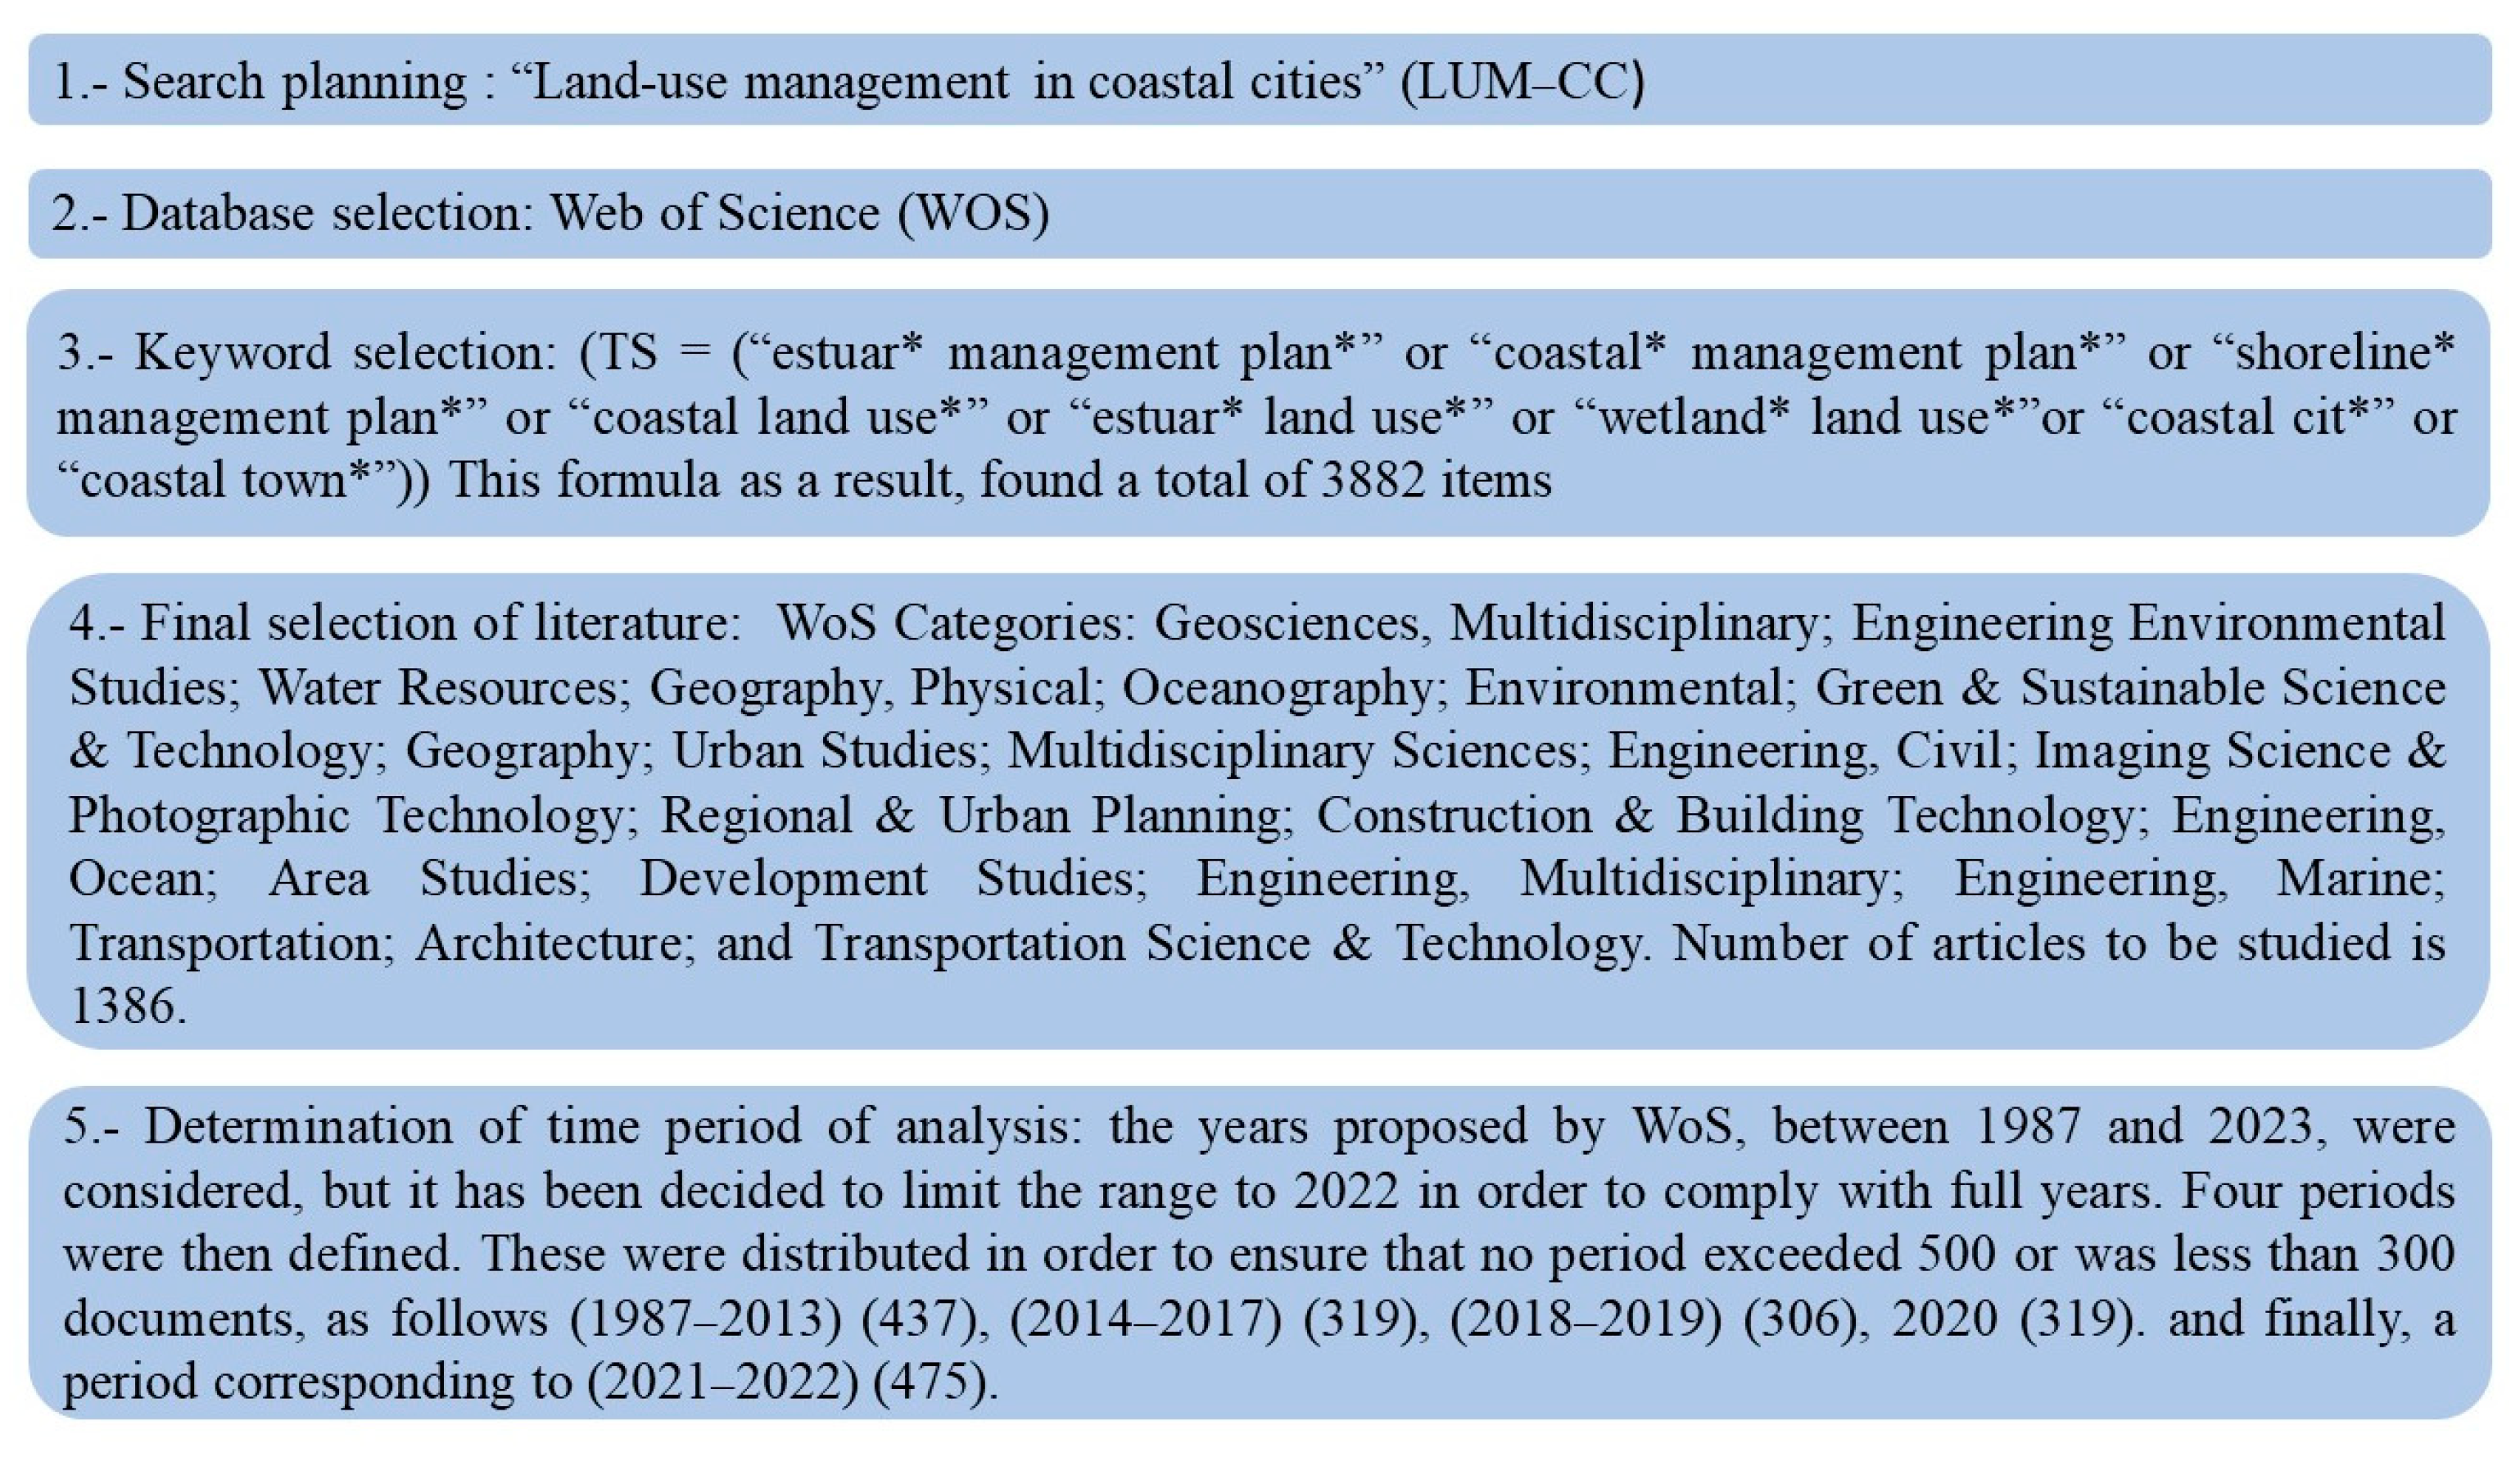
2.1. Bibliometric Analysis
2.2. Building Solutions for Urban–Residential Infrastructure against Flooding
Proposed Resilient Building Solutions in Chile
- -
- Beams: These are the horizontal supports that support the framing. They are usually made of timber or steel and are 60 cm to 120 cm apart.
- -
- Truss: These are the horizontal beams that support the floor. They are made of impregnated timber and are 40 cm apart.
- -
- Subfloor board: This is the layer of timber that is placed perpendicular to the joists and serves as a base for the finish floor. It will be made of 18 mm plywood.
- -
- Finish Floor: This is the top layer of flooring that provides the walking surface; it will be 1 × 4″ boards. In addition, a 2 cm mortar veneer is recommended for leveling.
2.3. Technical–Economic Analysis
3. Results and Discussion
3.1. Bibliometric Analysis
3.2. Scientific Mapping Analysis
3.2.1. Overly Chart and Thematic Evolution Map for LUM-CC
3.2.2. Research Papers according to Type of Coastline
3.2.3. Evolution of Wetland Research
3.3. Analysis of Building Typologies
3.3.1. Structural Weights and Materials for Typical Housing
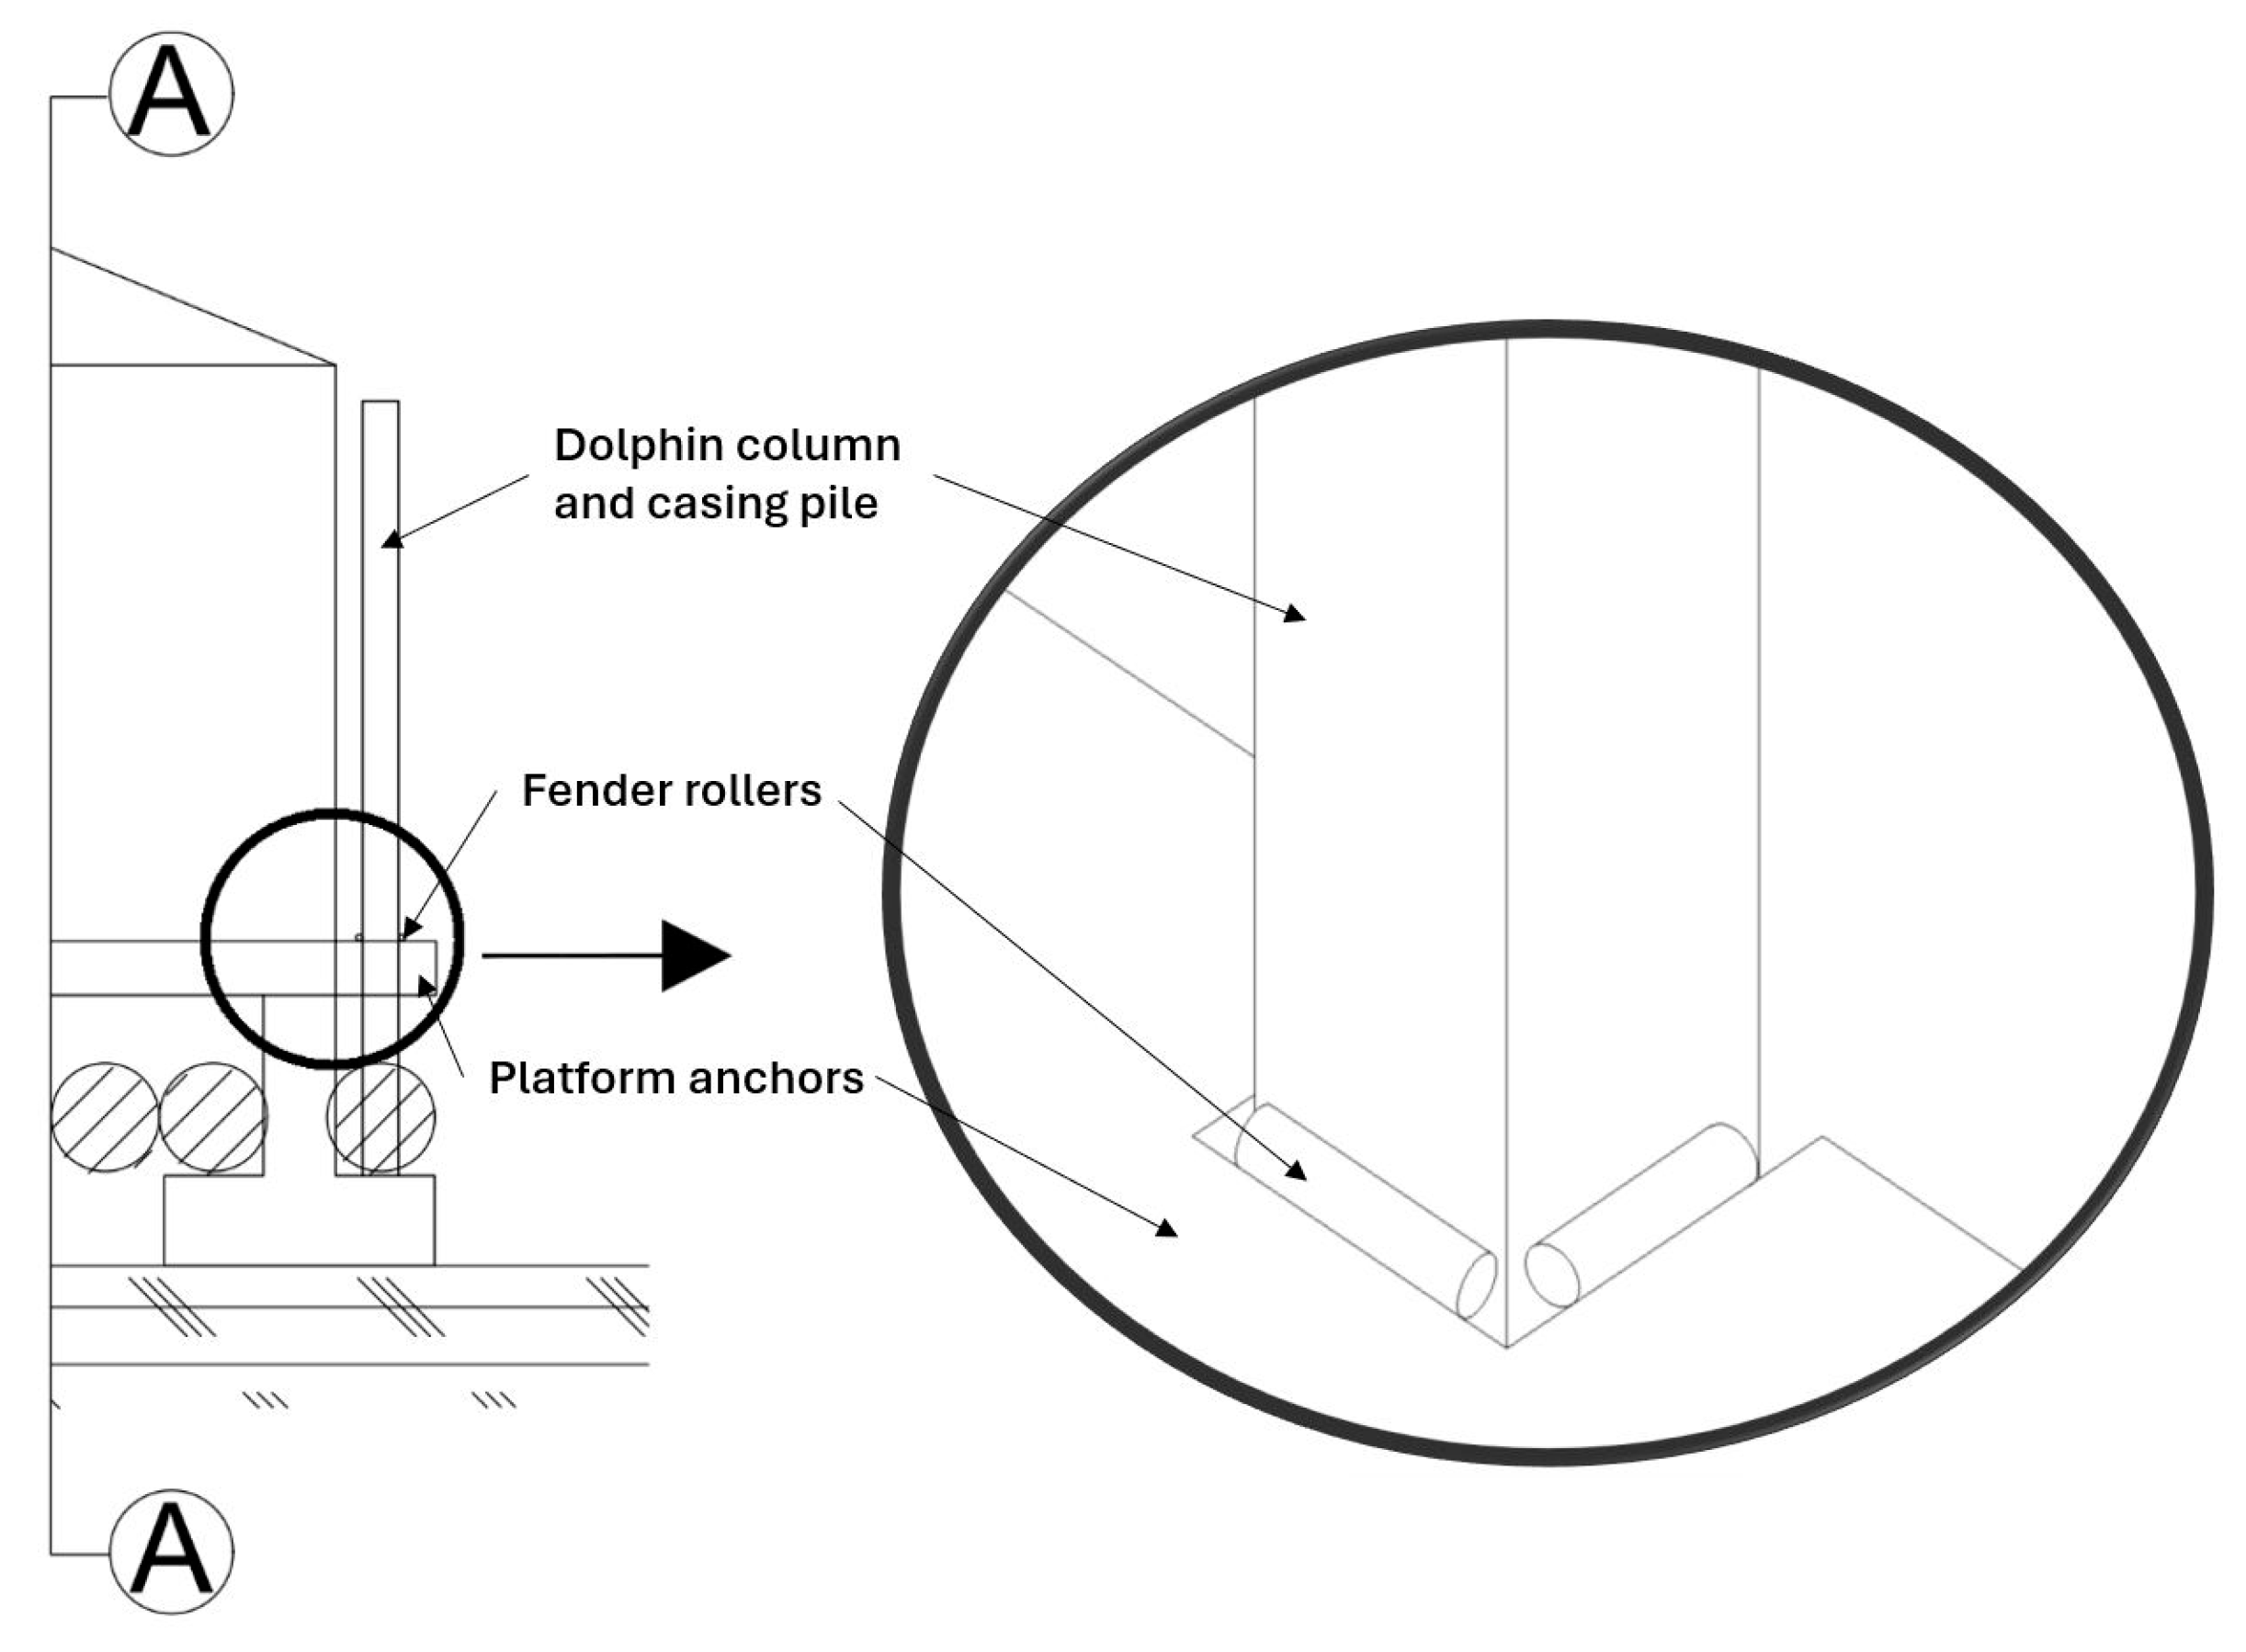
3.3.2. Design Amphibious House
3.4. Economic Analysis for Proposed Houses
4. Conclusions
Author Contributions
Funding
Institutional Review Board Statement
Informed Consent Statement
Data Availability Statement
Conflicts of Interest
References
- Grimm, N.B.; Faeth, S.H.; Golubiewski, N.E.; Redman, C.L.; Wu, J.; Bai, X.; Briggs, J.M. Global Change and the Ecology of Cities. Science 2008, 319, 756–760. [Google Scholar] [CrossRef]
- Seto, K.; Sanchez-Rodriguez, R.; Fragkias, M. The New Geography of Contemporary Urbanization and the Environment. Annu. Rev. Environ. Resour. 2010, 35, 167–194. [Google Scholar] [CrossRef]
- Xiao, J.; Shen, Y.; Ge, J.; Tateishi, R.; Tang, C.; Liang, Y.; Huang, Z. Evaluating urban expansion and land use change in Shijiazhuang, China, by using GIS and remote sensing. Landsc. Urban. Plan. 2006, 75, 69–80. [Google Scholar] [CrossRef]
- Dewan, A.M.; Yamaguchi, Y. Land use and land cover change in Greater Dhaka, Bangladesh: Using remote sensing to promote sustainable urbanization. Appl. Geogr. 2009, 29, 390–401. [Google Scholar] [CrossRef]
- Luo, J.; Wei, Y.H.D. Modeling spatial variations of urban growth patterns in Chinese cities: The case of Nanjing. Landsc. Urban Plan. 2009, 91, 51–64. [Google Scholar] [CrossRef]
- Golberg, E. Coastal Zone Space: Prelude to Conflict? United Nations Educational; United NaParis: New York, NY, USA, 1994; p. 134. [Google Scholar]
- ONU. Las Personas y Los Océanos. 2017. Available online: https://www.onu.org.mx/las-personas-y-los-oceanos/ (accessed on 26 December 2023).
- Li, G.; Sun, S.; Fang, C. The varying driving forces of urban expansion in China: Insights from a spatial-temporal analysis. Landsc. Urban Plan. 2018, 174, 63–77. [Google Scholar] [CrossRef]
- De Andres, M.; Barragán, J. Desarrollo Urbano en el Litoral a Escala Mundial. Método de Estudio para su Cuantificación./Urban-Coastal Development. Study Method for Quantifying in a Global Scal. Rev. Estud. Andal. 2016, 33, 64–83. [Google Scholar]
- Lai, S.; Loke, L.H.L.; Hilton, M.J.; Bouma, T.J.; Todd, P.A. The effects of urbanisation on coastal habitats and the potential for ecological engineering: A Singapore case study. Ocean Coast. Manag. 2015, 103, 78–85. [Google Scholar] [CrossRef]
- Barragán, J.M.; de Andrés, M. Analysis and trends of the world’s coastal cities and agglomerations. Ocean Coast. Manag. 2015, 114, 11–20. [Google Scholar] [CrossRef]
- Elsharouny, M.R.M.M. Planning Coastal Areas and Waterfronts for Adaptation to Climate Change in Developing Countries. Procedia Environ. Sci. 2016, 34, 348–359. [Google Scholar] [CrossRef]
- Abadie, L.M.; Jackson, L.P.; Sainz de Murieta, E.; Jevrejeva, S.; Galarraga, I. Comparing urban coastal flood risk in 136 cities under two alternative sea-level projections: RCP 8.5 and an expert opinion-based high-end scenario. Ocean Coast. Manag. 2020, 193, 105249. [Google Scholar] [CrossRef]
- Lorie, M.; Neumann, J.E.; Sarofim, M.C.; Jones, R.; Horton, R.M.; Kopp, R.E.; Fant, C.; Wobus, C.; Martinich, J.; O’Grady, M.; et al. Modeling coastal flood risk and adaptation response under future climate conditions. Clim. Risk Manag. 2020, 29, 100233. [Google Scholar] [CrossRef] [PubMed]
- Bahadur, A.; Tanner, T. Transformational resilience thinking: Putting people, power and politics at the heart of urban climate resilience. Environ. Urban 2014, 26, 200–214. [Google Scholar] [CrossRef]
- Varkey, M.V.; Philip, P.M. Flood risk mitigation through self-floating amphibious houses—Modelling, analysis, and design. Mater. Today Proc. 2022, 65, 442–447. [Google Scholar]
- Ministerio del Medio Ambiente (Gobierno de Chile). Determinación del Riesgo de los Impactos del Cambio Climático en las costas de Chile 1a ed. Pontificia Universdidad Catolica de Chile, editoSantiago, Chile: Centro de Cambio climatico Global UC. 2019, p. 1133. Available online: https://cambioclimatico.mma.gob.cl/wp-content/uploads/2020/04/2019-10-22-Informe-V02-CCCostas-Exposición-Rev1.pdf (accessed on 26 December 2023).
- Morales-Beltran, M.; Engür, P.; Şişman, Ö.A.; Aykar, G.N. Redesigning for Disassembly and Carbon Footprint Reduction: Shifting from Reinforced Concrete to Hybrid Timber–Steel Multi-Story Building. Sustainability 2023, 15, 7273. [Google Scholar] [CrossRef]
- Svatoš-Ražnjević, H.; Orozco, L.; Menges, A. Advanced Timber Construction Industry: A Review of 350 Multi-Storey Timber Projects from 2000–2021. Buildings 2022, 12, 404. [Google Scholar] [CrossRef]
- Cobo, M.; López-Herrera, A.G.; Herrera-Viedma, E.; Herrera, F. SciMAT: A new science mapping analysis software tool. J. Am. Soc. Inf. Sci. Technol. 2012, 63, 1609–1630. [Google Scholar] [CrossRef]
- Verichev, K.; Zamorano, M.; Salazar-Concha, C.; Carpio, M. Analysis of Climate-Oriented Researches in Building. Appl. Sci. 2021, 11, 3251. [Google Scholar] [CrossRef]
- Alonso, S.; Cabrerizo, F.J.; Herrera-Viedma, E.; Herrera, F. h-Index: A review focused in its variants, computation and standardization for different scientific fields. J. Informetr. 2009, 3, 273–289. [Google Scholar] [CrossRef]
- Egghe, L. Theory and Practice of the g-Index. Scientometrics 2006, 69, 131–152. [Google Scholar] [CrossRef]
- Cabrerizo, F.J.; Alonso, S.; Herrera-Viedma, E.; Herrera, F. q2-Index: Quantitative and qualitative evaluation based on the number and impact of papers in the Hirsch core. J. Inf. 2010, 4, 23–28. [Google Scholar] [CrossRef]
- Santana, M.; Cobo, M.J. What is the future of work? A science mapping analysis. Eur. Manag. J. 2020, 38, 846–862. [Google Scholar] [CrossRef]
- Lv, T.; Wang, L.; Xie, H.; Zhang, X.; Zhang, Y. Evolutionary overview of water resource management (1990–2019) based on a bibliometric analysis in Web of Science. Ecol. Inform. 2021, 61, 101218. [Google Scholar] [CrossRef]
- Carpio, M.; González, Á.; González, M.; Verichev, K. Influence of pavements on the urban heat island phenomenon: A scientific evolution analysis. Energy Build. 2020, 226, 110379. [Google Scholar] [CrossRef]
- Sharifi, A. Urban sustainability assessment: An overview and bibliometric analysis. Ecol. Indic. 2021, 121, 107102. [Google Scholar] [CrossRef]
- Díaz-López, C.; Carpio, M.; Martín-Morales, M.; Zamorano, M. Analysis of the scientific evolution of sustainable building assessment methods. Sustain. Cities Soc. 2019, 49, 101610. [Google Scholar] [CrossRef]
- Nalbandian, K.M.; Carpio, M.; González, Á. Analysis of the scientific evolution of self-healing asphalt pavements: Toward sustainable road materials. J. Clean. Prod. 2021, 293, 126107. [Google Scholar] [CrossRef]
- Casado-Aranda, L.-A.; Sánchez-Fernández, J.; Viedma-del-Jesús, M. Analysis of the scientific production of the effect of COVID-19 on the environment: A bibliometric study. Environ. Res. 2021, 193, 110416. [Google Scholar] [CrossRef] [PubMed]
- Salazar-Concha, C.; Ficapal-Cusí, P.; Boada-Grau, J.; Camacho, L.J. Analyzing the evolution of technostress: A science mapping approach. Heliyo 2021, 7, e06726. [Google Scholar] [CrossRef] [PubMed]
- Cobo, M.J.; Martínez, M.A.; Gutiérrez-Salcedo, M.; Fujita, H.; Herrera-Viedma, E. 25 years at Knowledge-Based Systems: A bibliometric analysis. Knowl.-Based Syst. 2015, 80, 3–13. [Google Scholar] [CrossRef]
- Thomé, A.M.; Scavarda, L.; Scavarda, A. Conducting systematic literature review in operations management. Prod. Plan. Control 2016, 27, 408–420. [Google Scholar] [CrossRef]
- Cobo, M.; López-Herrera, A.G.; Herrera-Viedma, E.; Herrera, F. An approach for detecting, quantifying, and visualizing the evolution of a research field: A practical application to the Fuzzy Sets Theory field. J. Informetr. 2011, 5, 146–166. [Google Scholar] [CrossRef]
- Nillesen, A.L. Chapter 24—Designing and building flood proof houses. In Coastal Flood Risk Reduction; Brody, S., Lee, Y., Kothuis, B., Eds.; Elsevier: Amsterdam, The Netherlands, 2022; pp. 329–339. [Google Scholar]
- American Society of Civil Engineers. Flood Resistant Design and Construction; American Society of Civil Engineers: Reston, VA, USA, 2014; p. 92. [Google Scholar]
- Coulbourne, W.L.; Kriebel, D.L.; Behm, R.L.; McKenna, K.K. Guide for Design of Flood-Resistant Buildings; National Research Council of Canada: Ottawa, ON, Canada, 2021. [Google Scholar]
- Molina, C.; Kent, M.; Hall, I.; Jones, B. A data analysis of the Chilean housing stock and the development of modelling archetypes. Energy Build. 2020, 206, 109568. [Google Scholar] [CrossRef]
- Trinidad, M.A. Precios Unitarios. Primera; de Tabasco, U.J.A., Ed.; Universidad Juarez Autonoma de Tabasco: Tabasco, Mexico, 2005; p. 80. [Google Scholar]
- New York United Nations. Transforming Our World: The 2030 Agenda for Sustainable Development; New York United Nations, Department of Economic and Social Affairs: New York, NY, USA, 2015. [Google Scholar]
- Hallegatte, S.; Green, C.; Nicholls, R.J.; Corfee-Morlot, J. Future flood losses in major coastal cities. Nat. Clim. Chang. 2013, 3, 802–806. [Google Scholar] [CrossRef]
- Sallenger, A.; Doran, K.; Howd, P. Hotspot of accelerated sea-level rise on the Atlantic Coast of North America. Nat. Clim. Chang. 2012, 2, 884–888. [Google Scholar] [CrossRef]
- Wahl, T.; Jain, S.; Bender, J.; Meyers, S.; Luther, M. Increasing risk of compound flooding from storm surge and rainfall for major US cities. Nat. Clim. Chang. 2015, 5, 1093–1097. [Google Scholar] [CrossRef]
- Vitousek, S.; Barnard, P.; Fletcher, C.; Frazer, N.; Erikson, L.; Storlazzi, C. Doubling of coastal flooding frequency within decades due to sea-level rise. Sci. Rep. 2017, 7, 1–9. [Google Scholar] [CrossRef] [PubMed]
- Nicholls, R. Planning for the Impacts of Sea Level Rise. Oceanography 2011, 24, 144–157. [Google Scholar] [CrossRef]
- Su, L.; Sharp, S.M.; Pettigrove, V.J.; Craig, N.J.; Nan, B.; Du, F.; Shi, H. Superimposed microplastic pollution in a coastal metropolis. Water Res. 2019, 168, 115140. [Google Scholar] [CrossRef]
- Miranda, L.; Andutta, F.; Kjerfve, B.; Castro, B. Fundamentals of Estuarine and Physical Oceanography; Springer: Singapore, 2017; Volume 8. [Google Scholar]
- Ruiz-Luna, A.; Berlanga-Robles, C. Land use, land cover changes and coastal lagoon surface reduction associated with urban growth in northwest Mexico. Landsc. Ecol. 2003, 18, 159–171. [Google Scholar] [CrossRef]
- Deegan, L.A.; Johnson, D.S.; Warren, R.S.; Peterson, B.J.; Fleeger, J.W.; Fagherazzi, S.; Wollheim, W.M. Coastal eutrophication as a driver of salt marsh loss. Nature 2012, 490, 388–392. [Google Scholar] [CrossRef]
- Bilskie, M.V.; Hagen, S.C.; Medeiros, S.C.; Passeri, D.L. Dynamics of sea level rise and coastal flooding on a changing landscape. Geophys. Res. Lett. 2014, 41, 927–934. [Google Scholar] [CrossRef]
- Glasby, T.; Connell, S. Urban Structures as Marine Habitats; UN, FAO, Eds.; ROYAL Swedish Academic Sciences: Stockholm, Sweden, 1999; Available online: http://hdl.handle.net/2440/12039 (accessed on 26 December 2023).
- Nicholls, R.J.; Hoozemans, F.M.J. The Mediterranean: Vulnerability to coastal implications of climate change. Ocean Coast. Manag. 1996, 31, 105–132. [Google Scholar] [CrossRef]
- Balica, S.; Wright, N.; Meulen, F. A flood vulnerability index for coastal cities and its use in assessing climate change impacts. Nat. Hazards 2012, 64, 73–105. [Google Scholar] [CrossRef]
- Schiller, A.; de Sherbinin, A.; Hsieh, W.-H.; Pulsipher, A. The Vulnerability of Global Cities to Climate Hazards; Environ. Urba; Routledge: London, UK, 2007; Volume 19. [Google Scholar]
- Torabi, E.; Dedekorkut-Howes, A.; Howes, M. Adapting or maladapting: Building resilience to climate-related disasters in coastal cities. Cities 2018, 72, 295–309. [Google Scholar] [CrossRef]
- Du, S.; Scussolini, P.; Ward, P.J.; Zhang, M.; Wen, J.; Wang, L.; Koks, E.; Diaz-Loaiza, A.; Gao, J.; Ke, Q.; et al. Hard or soft flood adaptation? Advantages of a hybrid strategy for Shanghai. Glob. Environ. Chang. 2020, 61, 102037. [Google Scholar] [CrossRef]
- Farrapeira, C.; Melo, A.V.O.M.; Barbosa, D.; Silva, K. Ship hull fouling in the Port of Recife, Pernambuco. Braz. J. Ocean. 2007, 55, 207–221. [Google Scholar] [CrossRef]
- Yang, X.; Liu, Z. Using satellite imagery and GIS for land-use and land-cover change mapping in an estuarine watershed. Int. J. Remote Sens. 2005, 26, 5275–5296. [Google Scholar] [CrossRef]
- Pourebrahim, S.; Hadipour, M.; Mokhtar, M.; Taghavi, S. Application of VIKOR and fuzzy AHP for conservation priority assessment in coastal areas: Case of Khuzestan district, Ira. Ocean Coast. Manag. 2014, 98, 20–26. [Google Scholar] [CrossRef]
- Wang, G.; Liu, Y.; Wang, H.; Wang, X. A comprehensive risk analysis of coastal zones in China. Estuar. Coast. Shelf Sci. 2014, 140, 22–31. [Google Scholar] [CrossRef]
- Dyckman, C.; SJohn, C.; London, J. Realizing managed retreat and innovation in state-level coastal management planning. Ocean Coast. Manag. 2014, 102, 212–223. [Google Scholar] [CrossRef]
- García-Ruiz, A.; Carpio, M.; Giesecke, R.; Bermúdez, M.; Díez-Minguito, M. Circulation and distribution of suspended mesozooplankton carcasses in a mid-latitude estuary. J. Mar. Syst. 2021, 225, 103646. [Google Scholar] [CrossRef]
- Cheng, H.; Chen, J.; Chen, Z.; Ruan, R.; Xu, G.; Zeng, G.; Zhu, J.; Dai, Z.; Chen, X.; Gu, S.; et al. Mapping Sea Level Rise Behavior in an Estuarine Delta System: A Case Study along the Shanghai Coast. Engineering 2018, 4, 156–163. [Google Scholar] [CrossRef]
- Dykstra, S.; Dzwonkowski, B. The Propagation of Fluvial Flood Waves Through a Backwater-Estuarine Environment. Water Resour. Res. 2020, 56, e2019WR025743. [Google Scholar] [CrossRef]
- Hall, J.W.; Harvey, H.; Manning, L.J. Adaptation thresholds and pathways for tidal flood risk management in London. Clim. Risk Manag. 2019, 24, 42–58. [Google Scholar] [CrossRef]
- Li, Y.; Shi, Y.; Zhu, X.; Cao, H.; Yu, T. Coastal wetland loss and environmental change due to rapid urban expansion in Lianyungang, Jiangsu, China. Reg. Environ. Chang. 2014, 14, 1175–1188. [Google Scholar] [CrossRef]
- Duan, H.; Zhang, H.; Huang, Q.; Zhang, Y.; Hu, M.; Niu, Y.; Zhu, J. Characterization and environmental impact analysis of sea land reclamation activities in China. Ocean Coast. Manag. 2016, 130, 128–137. [Google Scholar] [CrossRef]
- Li, X.; Bellerby, R.; Craft, C.; Widney, S. Coastal wetland loss, consequences, and challenges for restoration. Anthr. Coasts 2018, 3, 1–15. [Google Scholar] [CrossRef]
- Balogun, A.-L.; Yekeen, S.T.; Pradhan, B.; Althuwaynee, O.F. Spatio-Temporal Analysis of Oil Spill Impact and Recovery Pattern of Coastal Vegetation and Wetland Using Multispectral Satellite Landsat 8-OLI Imagery and Machine Learning Models. Remote Sens. 2020, 12, 1225. [Google Scholar] [CrossRef]
- Fastelli, P.; Marcelli, M.; Guerranti, C.; Renzi, M. Recent Changes of Ecosystem Surfaces and their Services Value in a Mediterranean Costal Protected Area: The Role of Wetlands. Thalass. An. Int. J. Mar. Sci. 2018, 34, 233–245. [Google Scholar] [CrossRef]
- Gracia, A.; Rangel-Buitrago, N.; Oakley, J.A.; Williams, A.T. Use of ecosystems in coastal erosion management. Ocean Coast. Manag. 2018, 156, 277–289. [Google Scholar] [CrossRef]
- Zhu, C.; Zeng, Y. Effects of urban lake wetlands on the spatial and temporal distribution of air PM10 and PM2.5 in the spring in Wuhan. Urban For. Urban Green 2018, 31, 142–156. [Google Scholar] [CrossRef]
- Zhang, Y.; Chen, R.; Wang, Y. Tendency of land reclamation in coastal areas of Shanghai from 1998 to 2015. Land Use Policy 2020, 91, 104370. [Google Scholar] [CrossRef]
- Poulsen Rydborg, M.; Lauring, M.; Brunsgaard, C. Vulnerabilities and resilience in Danish housing stock: A comparative study of architectural answers to climate change in Danish housing in relation to other oceanic climates. In E3S Web of Conferences; EDP Sciences: Les Ulis, France, 2019; Volume 111. [Google Scholar]
- Harriss, R.; Sebacher, D.; Bartlett, K.; Bartlett, D.; Crill, P. Sources of atmospheric methane in the South Florida environment. Glob. Biogeochem. Cycles 1988, 2, 231–243. [Google Scholar] [CrossRef]
- Xie, Z.; Liu, J.; Zhu, G.; Shao, Q.; Xu, X. Evaluating Habitat Change and Boundary Adjustment of a Nature Reserve in Coastal Wetlands: Case Study of Beidagang Nature Reserve, China. J. Coast. Res. 2011, 27, 966–972. [Google Scholar] [CrossRef]
- Ellis, J.T.; Spruce, J.P.; Swann, R.A.; Smoot, J.C.; Hilbert, K.W. An assessment of coastal land-use and land-cover change from 1974–2008 in the vicinity of Mobile Bay, Alabama. J. Coast. Conserv. 2011, 15, 139–149. [Google Scholar] [CrossRef]
- Enaruvbe, G.O.; Ige-Olumide, O. Geospatial analysis of land-use change processes in a densely populated coastal city: The case of Port Harcourt, south-east Nigeria. Geocarto Int. 2015, 30, 441–456. [Google Scholar] [CrossRef]
- Halls, J.N.; Magolan, J.L. A Methodology to Assess Land Use Development, Flooding, and Wetland Change as Indicators of Coastal Vulnerability. Remote Sens. 2019, 11, 2260. [Google Scholar] [CrossRef]
- Kim, S.K. The Economic Effects of Climate Change Adaptation Measures: Evidence from Miami-Dade County and New York City. Sustainability 2020, 12, 1097. [Google Scholar] [CrossRef]
- de Ruig, L.T.; Barnard, P.L.; Botzen, W.J.W.; Grifman, P.; Hart, J.F.; de Moel, H.; Sadrpour, N.; Aerts, J.C. An economic evaluation of adaptation pathways in coastal mega cities: An illustration for Los Angeles. Sci. Total Environ. 2019, 678, 647–659. [Google Scholar] [CrossRef]
- Aerts, J.C.J.H.; Botzen, W.J.W.; Emanuel, K.; Lin, N.; de Moel, H.; Michel-Kerjan, E.O. Evaluating Flood Resilience Strategies for Coastal Megacities. Science 2014, 344, 473–475. [Google Scholar] [CrossRef]
- Degrieck, J.; Van Paepegem, W.; Van Schepdael, L.; Samyn, P.; De Baets, P.; Suister, E.; Leendertz, J.S. Characterization of Composites for the Maeslant Storm Surge Barrie. In Fracture of Nano and Engineering Materials and Structures Dordrecht; Springer: Amsterdam, The Netherlands, 2006; pp. 315–316. [Google Scholar]
- Pirazzoli, P.A. Possible Defenses against a Sea-Level Rise in the Venice Area, Italy. J. Coast. Res. 1991, 7, 231–248. [Google Scholar]
- Rosenzweig, C.; Solecki, W.D.; Blake, R.; Bowman, M.; Faris, C.; Gornitz, V.; Horton, R.; Jacob, K.; LeBlanc, A.; Leichenko, R.; et al. Developing coastal adaptation to climate change in the New York City infrastructure-shed: Process, approach, tools, and strategies. Clim. Chang. 2011, 106, 93–127. [Google Scholar] [CrossRef]
- Rivera Campos, P.; Tendero Caballero, R. Vernacular architecture in the palafitos from Chiloé = Arquitectura vernácula en palafitos de Chiloé. Build. Manag. 2021, 5, 7. [Google Scholar] [CrossRef]
- Laturnus, T. Floating Homes: A Houseboat; Handbook Harbour Publishing Company: Madeira Park, BC, Canada, 1986. [Google Scholar]
- Postacchini, M.; Zitti, G.; Giordano, E.; Clementi, F.; Darvini, G.; Lenci, S. Flood impact on masonry buildings: The effect of flow characteristics and incidence angle. J. Fluids Struct. 2019, 88, 48–70. [Google Scholar] [CrossRef]
- Labaran, Y.H.; Mathur, V.S.; Muhammad, S.U.; Musa, A.A. Carbon footprint management: A review of construction industry. Clean. Eng. Technol. 2022, 9, 100531. [Google Scholar] [CrossRef]
- Lomnitz, C. Major Earthquakes of Chile: A Historical Survey, 1535–1960. Seism. Res. Lett. 2004, 75, 368–378. [Google Scholar] [CrossRef]
- Garcés-Vargas, J.; Ruiz, M.; Pardo, L.M.; Nuñez, S.; Pérez-Santos, I. Hydrographic features of Valdivia river estuary south-central Chile. Lat. Am. J. Aquat. Res. 2013, 41, 113–125. [Google Scholar]
- Pino, M.; Perillo, G.M.; Santamarina, P. Residual Fluxes in a Cross-section of the Valdivia River Estuary, Chile. Estuar. Coast. Shelf Sci. 1994, 38, 491–505. [Google Scholar]
- NCh 1537 2009; Diseño Estructural—Cargas Permanentes y Cargas de Uso. Instituto Nacional de Normalización: Santiago, Chile, 2009.
- Koh, H.; Lim, Y.; Seow, T.; Stocks, D.; Thapar, A. The Floating Performance Stage @ Marina Bay, Singapore: New Possibilities for Space Creation. In Proceedings of the International Conference on Offshore Mechanics and Arctic Engineering—OMAE, Estoril, Portugal, 15–20 June 2008; Volume 3. [Google Scholar]
- Nekooie, M.A.; Mohamad, M.I.; Ismail, Z. Drag coefficient for amphibious house. Urban Water J. 2017, 14, 1045–1057. [Google Scholar] [CrossRef]
- Hurtado Saldias, M.; Sills Garrido, P.; Manríquez Cárdenas, C. Metodología para una rehabilitación arquitectónica sostenible: El caso de los palafitos de Chiloé. Arquit. Sur. 2018, 36, 36–57. [Google Scholar] [CrossRef]
- Alvarado, D.; Valdebenito, G.; Burgos, M. Evaluacion De Caracteristicas Dinamicas De Los Suelos De Valdivia Empleando Metodos Sismicos De Prospeccion Geofisica. In Congreso Chileno de Sinmologia e Ingenieria Sismica; ASHISINA: Valdivia, Chile, 2019; p. 9. [Google Scholar]
- Das, B. Fundamentos de Ingeniería de Cimentaciones, 7th ed. 2010, p. 819. Available online: https://www.academia.edu/42603156/Braja_Das_Fundamentos_de_ingenieria_de_cimentaciones_7ed (accessed on 26 December 2023).


| Type of Coast | Period | Major Studies | Analysis Tools | Main Conclusions |
|---|---|---|---|---|
| open ocean | P1 | Concern about the economic, environmental and social consequences of climate change [42,54,55]. | -Time series analysis. -Local urban database. | Vulnerability indexes against coastal hazard. |
| P2 and P3 | It is observed that the effects of climate change begin to become latent through the rise in sea level [14,44,45], and as the danger of flooding in coastal cities. | -Data analysis. -Projections new climate scenario. -Numerical models. | The need for joint scientific, technical, but mainly governmental efforts to assess coastal development [56]. Integrating ecological and social engineering. | |
| P4 and P5 | There is mainly an idea of the need for adaptation, indicating that we must assume our new climatic reality [57]. | -Analysis of effects of climate forcing on coastal cities. -Satellite mapping. | Deliver new protection tools, not just barriers and/or retaining walls, but updated building codes and nature-based measures that will be more effective in reducing flooding on a longer time scale. | |
| Estuaries | P1 | Human actions affecting the estuarine environment, construction materials and urban development [49,58,59]. | -Satellite visualization. -Analysis of data recorded. | Develop estuarine management planning strategies to integrate urban development through integrated coastal zone management. |
| P2 | Focus on monitoring both urban expansion [60] and flood risks due to sea-level rise [61,62]. | -Satellite visualization. -Multi-criteria analysis [63]. -Hydrodynamic Models [63]. | Apply multifactorial assessment techniques for the integration of social, economic and environmental criteria governing land planning. | |
| P3, P4 and P5 | Studies currently assess the flood risk of cities located on rivers close to the sea [64,65] and the use of effective tools to protect cities from flood hazards [66], in addition to resilient housing [36]. | -Analysis of data recorded. -Analysis GIS. -Coastal bathymetric measurements. | Improving the integration of field parameters to obtain more realistic simulations. Generate proposals for active mitigation and adaptation, such as the use of mobile barriers and mechanical pumping equipment, which, combined and located closer to the sea, improve effectiveness. and propose different construction solutions for floating, amphibious or pile dwellings. | |
| Wetlands | P1 | The influence of climate change on the rise inMSL will affect coastal erosion, water salinization and wetland deterioration [43,46]. | -Time series observation. -Local urban data. | The need for proactive adaptation plans, which evaluate (1) protecting, (2) accommodating or (3) removing infrastructure [53]. |
| P2 and P3 | There is a concern about how the urban expansion of cities reduces the surface of wetlands [67,68]. | -Analysis GIS. -Numerical models. | Implement intelligent management strategies to help solve the coastal erosion problem, considering a multi-criteria decision analysis to identify the most desirable management regimes [69]. | |
| P4 and P5 | Concerns about the risk of flooding of wetlands due to the rise in MSL are reopened [57]. In addition to the effects of pollution derived from human activities on these habitats [70] | -Evaluating satellite images. | Include coastal infrastructure adaptation measures, evaluating economic and social factors and considering soft strategies. |
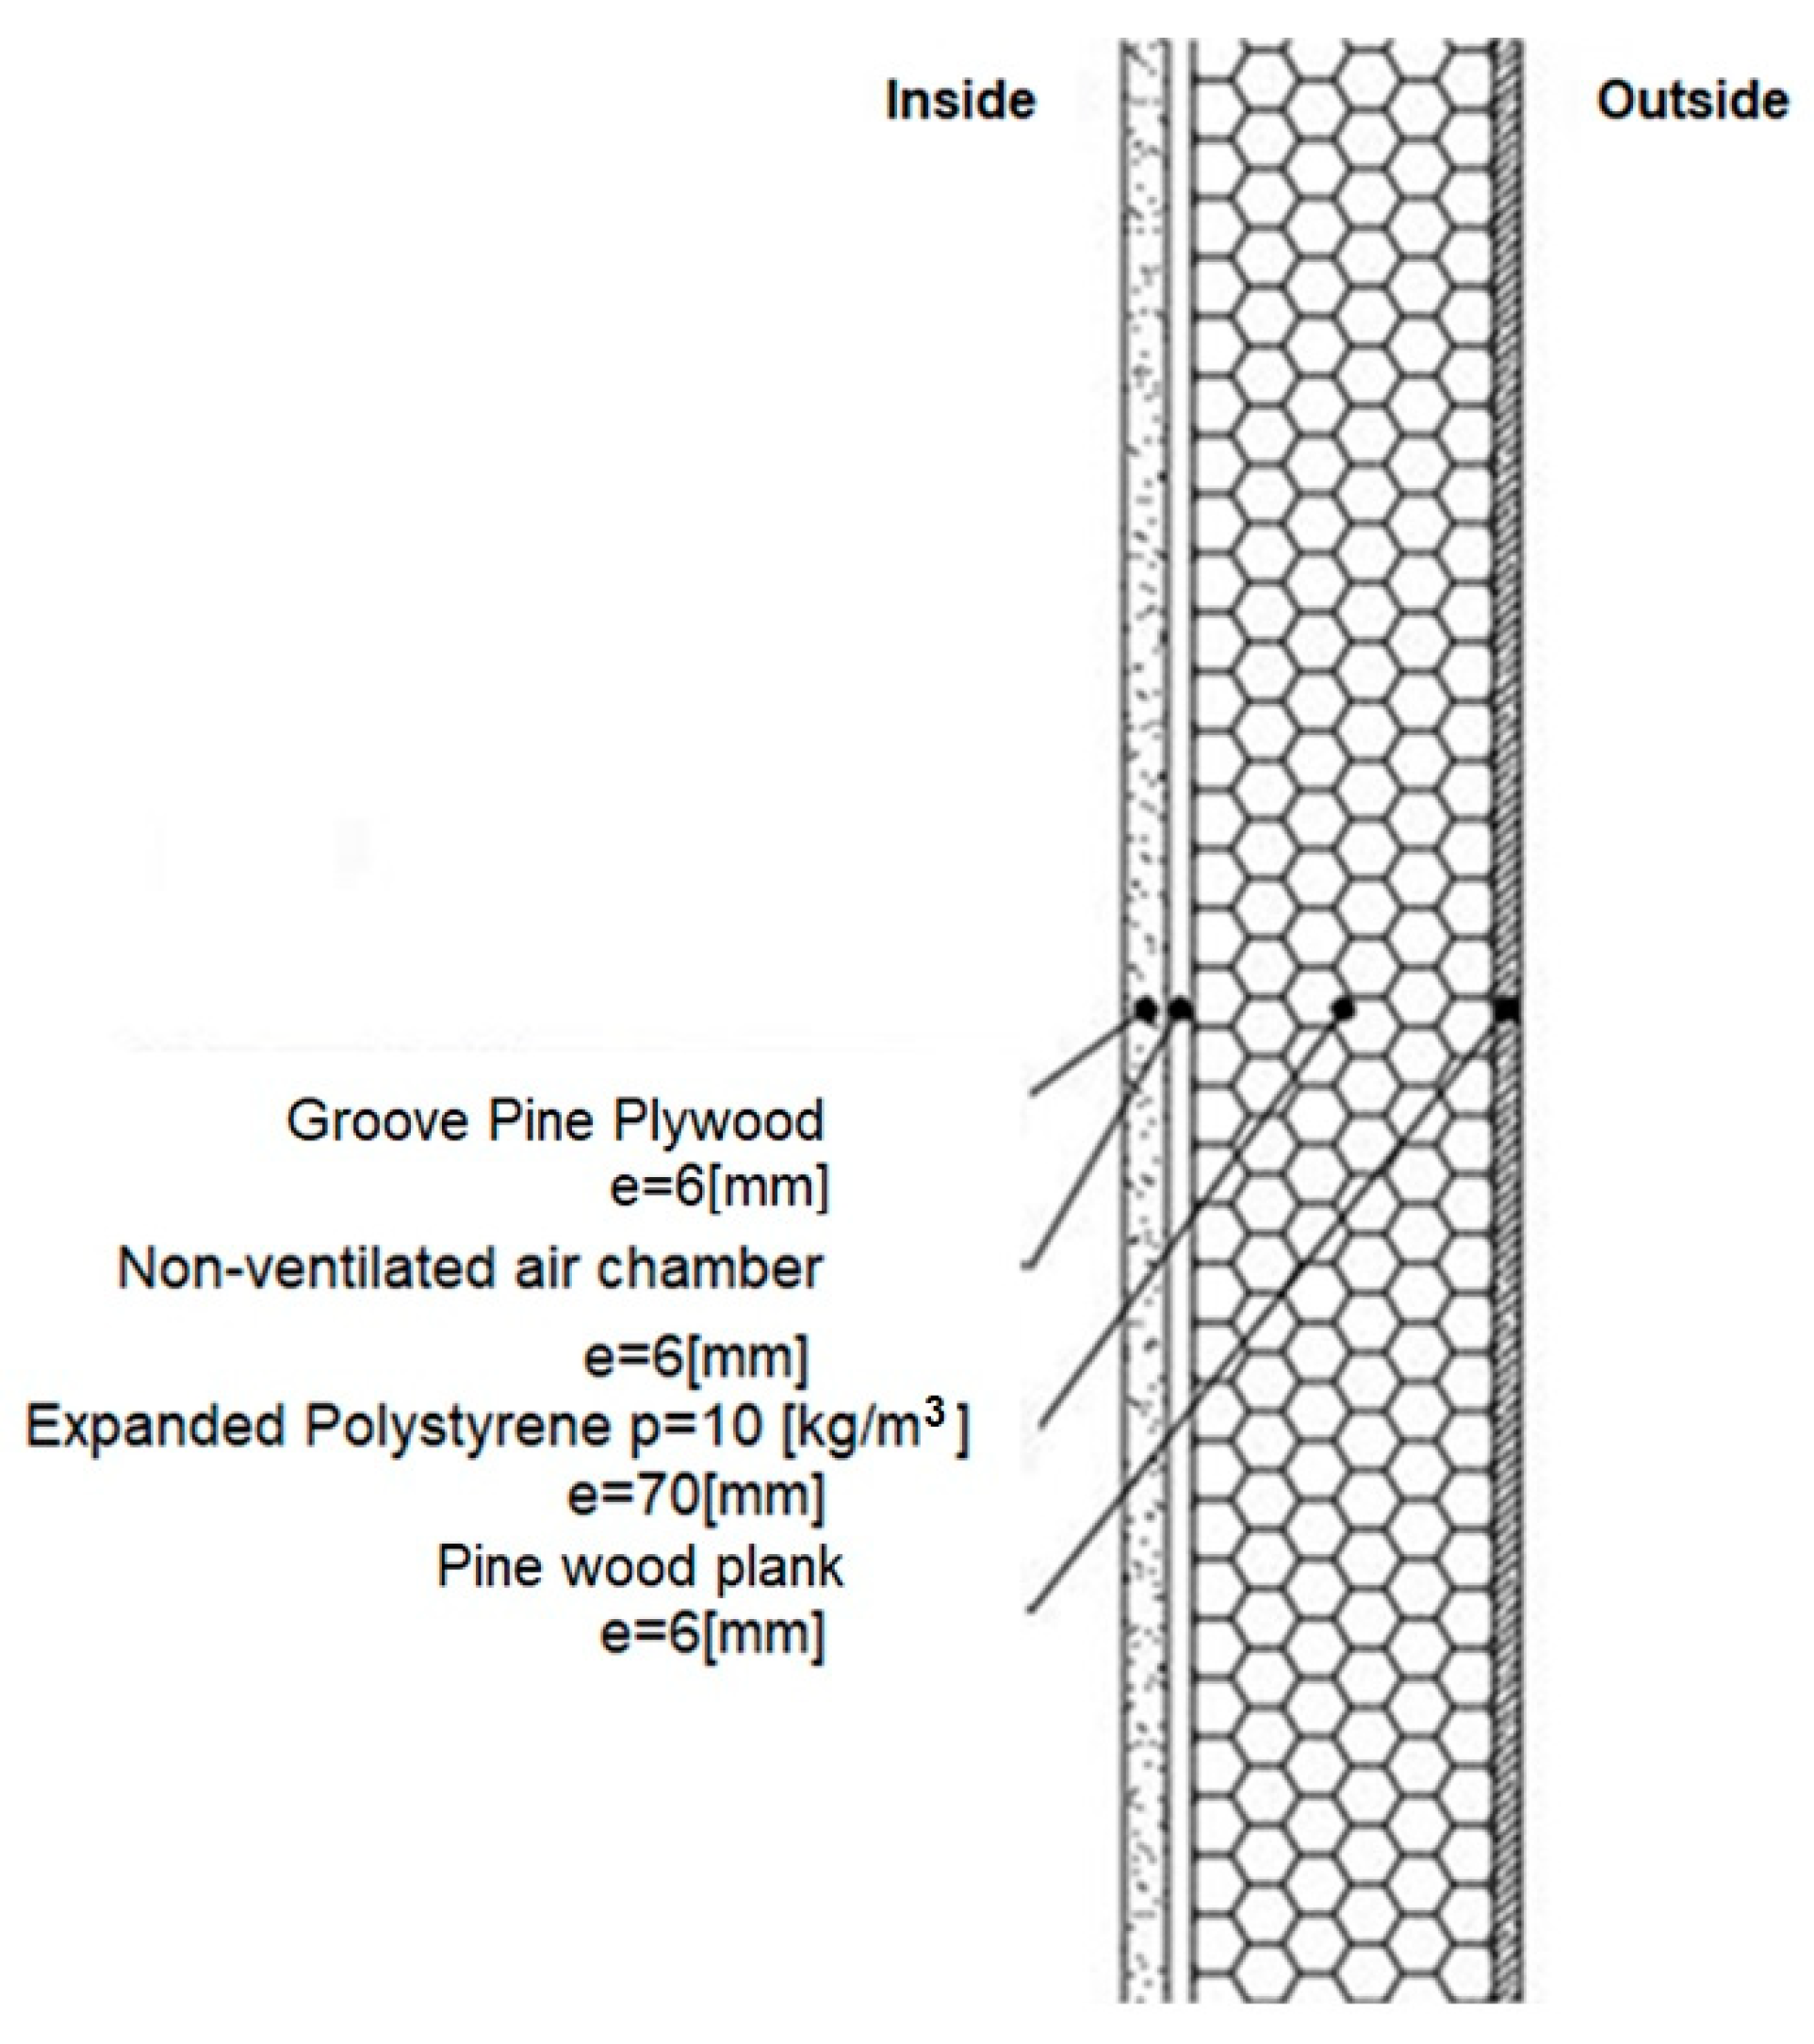
| Wall | |||
| Component | Area (m2) | Unit weight (kg/m2) | Total weight (kg) |
| Groove Pine Plywood | 120.72 | 9.8 | 1183.1 |
| Non-ventilated air chamber | 120.72 | 0 | 0 |
| Expanded polystyrene | 120.72 | 0.7 | 84.504 |
| Pine wood plank | 120.72 | 10.26 | 1238.5872 |
| Total: | 2506.19 | ||
| Roof | |||
| Component | Area (m2) | Unit weight (kg/m2) | Total weight (kg) |
| Asphalt shingles | 27.36 | 7 | 191.52 |
| OSB | 27.36 | 7.65 | 209.304 |
| Moisture barrier | 27.36 | 0 | 0 |
| EPS | 27.36 | 3 | 82.08 |
| Vapor Barrier | 27.36 | 0 | 0 |
| Cardboard plaster RH | 27.36 | 35 | 957.6 |
| Pine 3/4 × 4″ × 4″ tongue-and-groove joint | 294.12 | 0.94 | 276.47 |
| Pine 2 × 6 | 47.88 | 2.76 | 132.15 |
| Total: | 1849.1256 | ||
| Ceiling | |||
| Component | Area (m2) | Unit weight (kg/m2) | Total weight (kg) |
| Waterproofing | 49.6 | 0.005 | 0.248 |
| Concrete overlay | 49.6 | 48 | 2380.8 |
| Structural paving | 49.6 | 7.74 | 383.904 |
| EPS | 49.6 | 2 | 99.2 |
| Cardboard plaster St | 39.5 | 11.8 | 466.1 |
| Cardboard plaster Rh | 10.1 | 35 | 353.5 |
| Total: | 4014.95 | ||
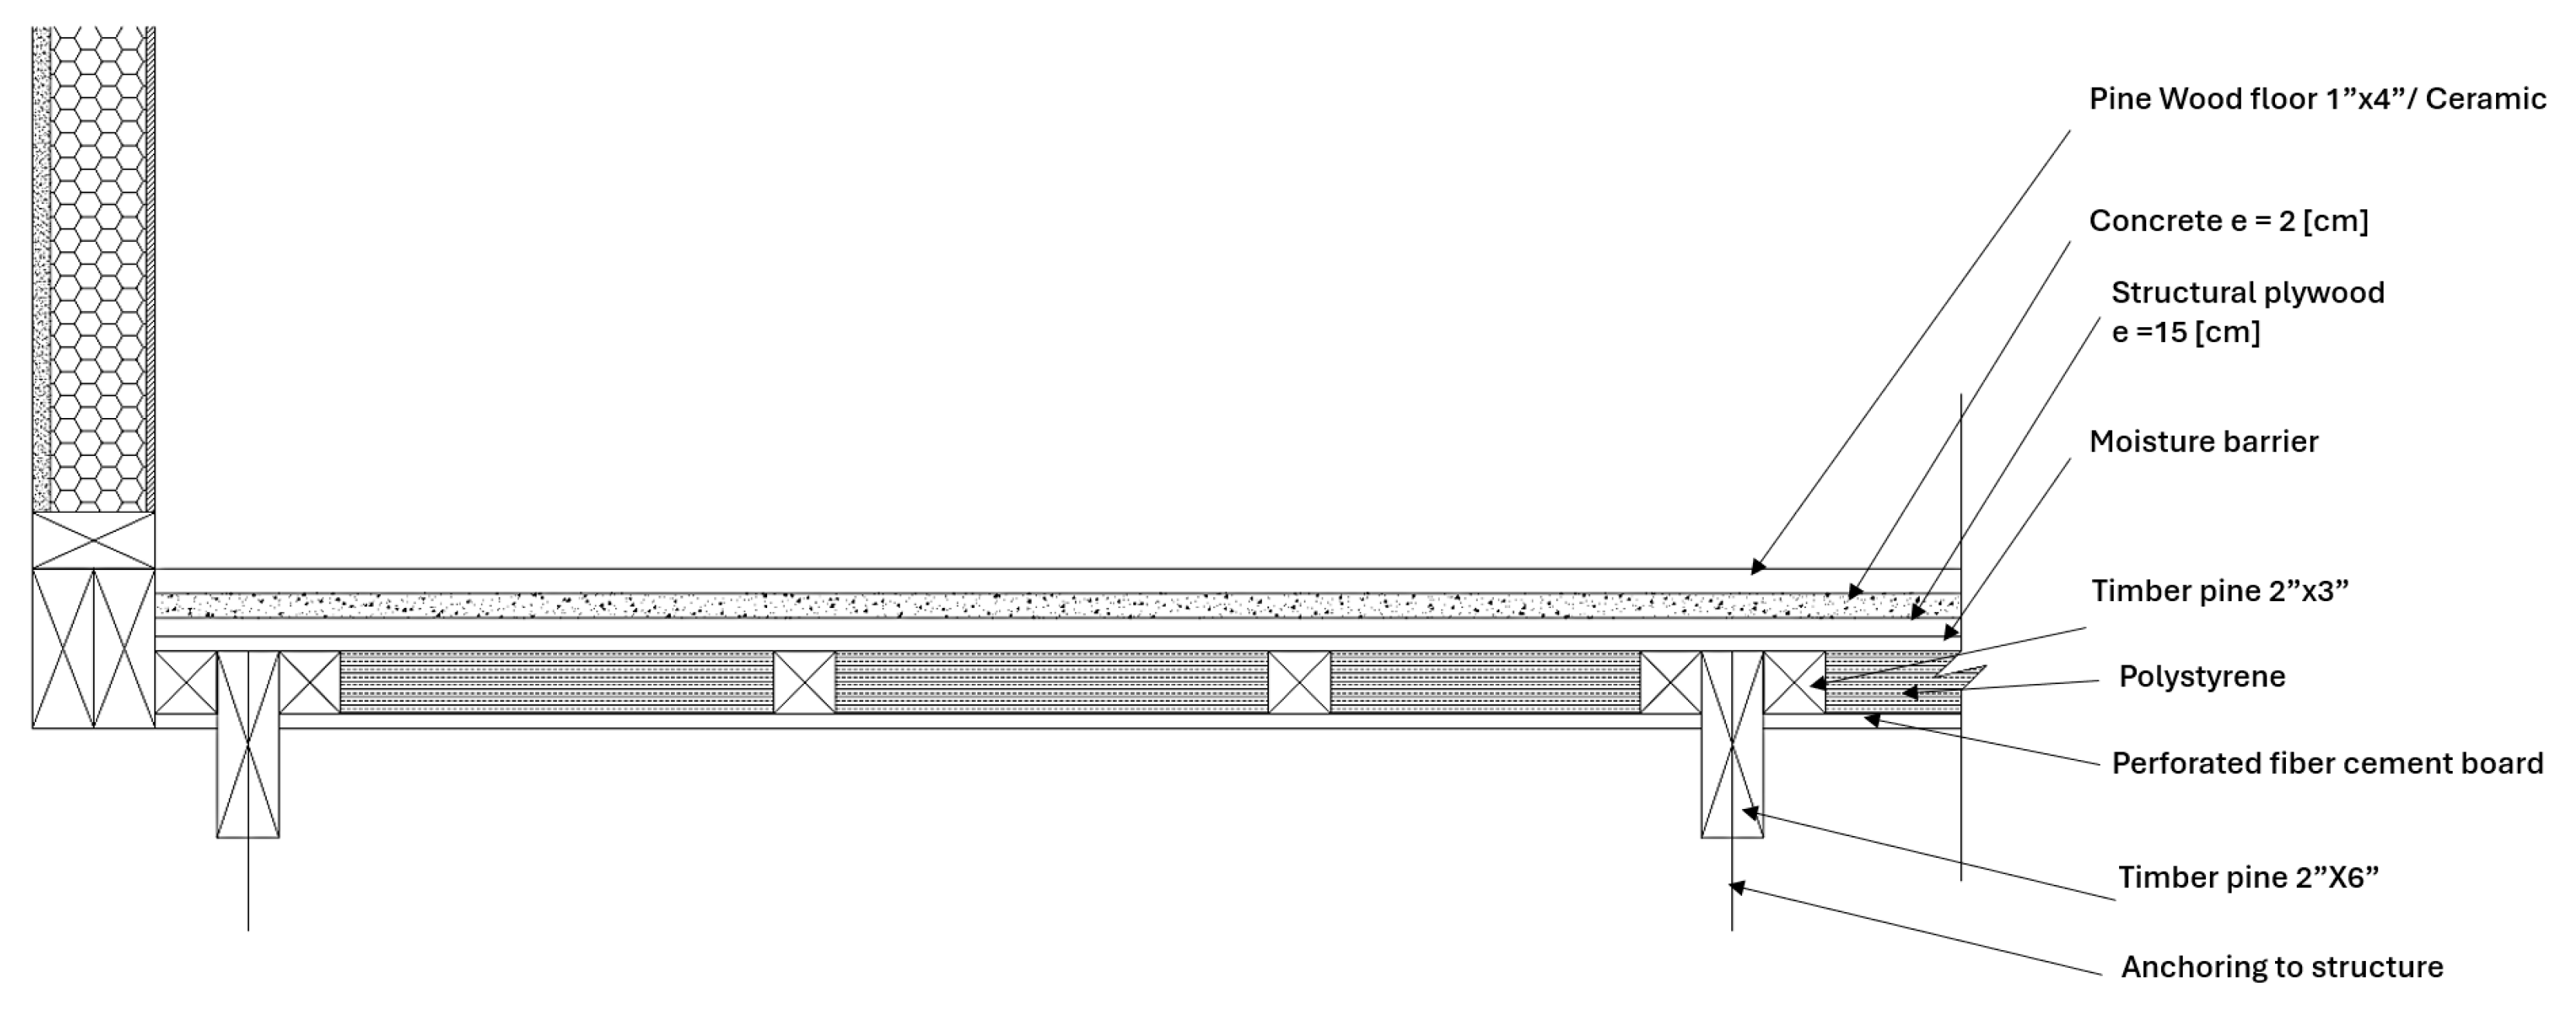
| Floor | |||
| Component | Area (m2) | Unit weight (kg/m2) | Total weight (kg) |
| Moisture barrier | - | - | - |
| Truss 2 × 3 | 160 | 1.21 | 193.6 |
| Polystyrene | - | - | - |
| Pine main beam 2″ × 6″ | 48 | 2.76 | 132.48 |
| Mortar | 49.6 | 48 | 2380.8 |
| Structural plywood | 49.6 | 7.74 | 383.904 |
| Perforated fiber cement board | 49.6 | 3 | 148.8 |
| Ceramic | 49.6 | 1.11 | 55.056 |
| Total: | 3294.64 | ||
| Total weight | 11,664.91 | ||
| Amphibious Housing Structure | ||||
|---|---|---|---|---|
| Description | Unit | Amount | Unit Price | Total |
| Excavations | m3 | 2.5 | USD 61 | USD 153 |
| Fiberglass Tubes 8.2 m (Diameter 0.6 m) | un | 5 | USD 320 | USD 1600 |
| Stainless steel guideposts | m | 42 | USD 70 | USD 2940 |
| Elevating roller systems | un | 8 | USD 280 | USD 2240 |
| Metal structure for pipes | kg | 350 | USD 5 | USD 1750 |
| Concrete foundations | m3 | 2.5 | USD 200 | USD 500 |
| Foundation armor | kg | 200 | USD 2 | USD 400 |
| Molded foundations | m2 | 10 | USD 15 | USD 150 |
| Manufacture and assembly of amphibious system | MHrs | 1080 | USD 8 | USD 8640 |
| Epoxy paint for fiberglass | gl | 5 | USD 30 | USD 150 |
| Anticorrosive paint | gl | 2 | USD 35 | USD 70 |
| Total: | USD 18,593 | |||
| House on Stilts Structure | ||||
|---|---|---|---|---|
| Description | Unit. | Amount | Unit Price | Total |
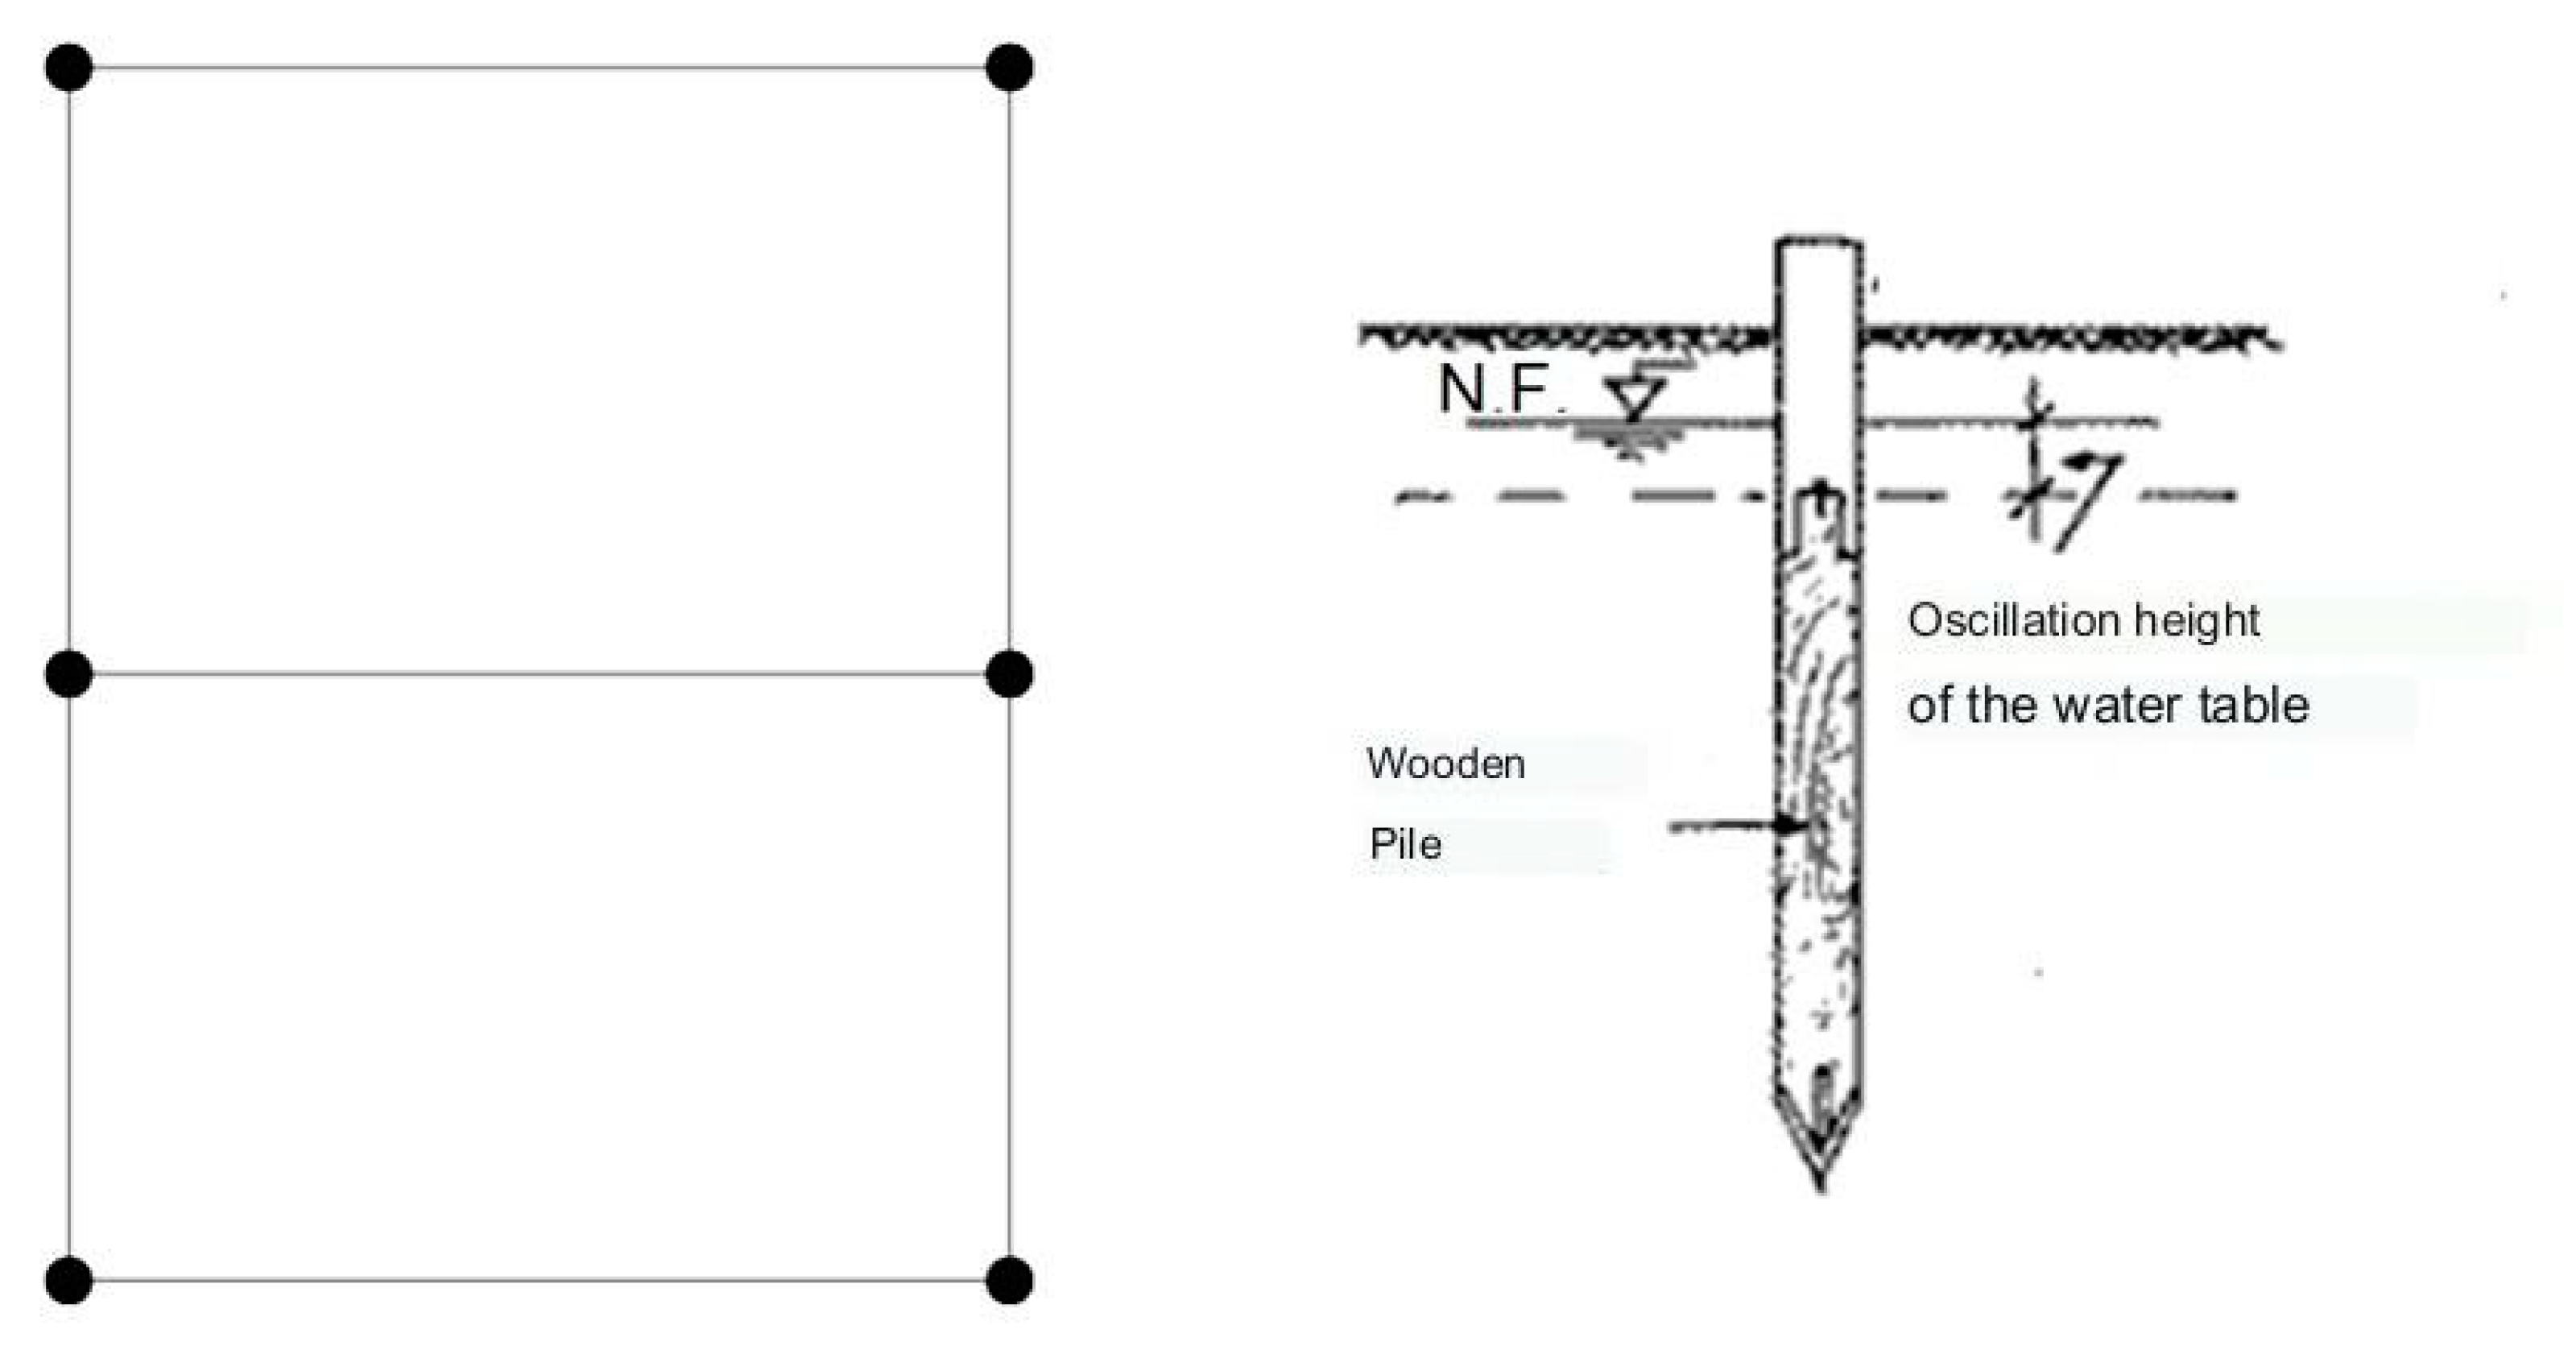
| Timber piles | m | 54 | USD 50 | USD 2700 |
| Pile-driving system | hr | 32 | USD 40 | USD 1280 |
| Support structure house | m2 | 50 | USD 85 | USD 4250 |
| Carbolineum timber preservative | gl | 6 | USD 25 | USD 150 |
| Total: | USD 8380 | |||
| Stilt Houses | Amphibious | |
|---|---|---|
| Desing | Pylon houses are usually built with lightweight materials, such as timber or bamboo, and are designed to rise above the ground to protect them from floods and other natural disasters. | Amphibious houses are usually built with more durable materials, such as steel or concrete, and are designed to withstand the force of water and waves. |
| Adventages | Stilt houses offer a number of advantages, such as protection against floods, pests and alluvium. They can also provide better ventilation and privacy than houses built on the ground. | Amphibious housing offers a number of advantages, such as the ability to move with the tides, the ability to withstand flooding and the possibility of being used for a variety of water activities. |
| Disadvantages | Houses on pillars can be more expensive to build and maintain than those built on the ground. They can also be more vulnerable to storms and other natural disasters. | Amphibious housing can be more expensive to build than houses on stilts. They can also be more difficult to access and maintain. |
Disclaimer/Publisher’s Note: The statements, opinions and data contained in all publications are solely those of the individual author(s) and contributor(s) and not of MDPI and/or the editor(s). MDPI and/or the editor(s) disclaim responsibility for any injury to people or property resulting from any ideas, methods, instructions or products referred to in the content. |
© 2024 by the authors. Licensee MDPI, Basel, Switzerland. This article is an open access article distributed under the terms and conditions of the Creative Commons Attribution (CC BY) license (https://creativecommons.org/licenses/by/4.0/).
Share and Cite
García-Ruiz, A.; Díez-Minguito, M.; Verichev, K.; Carpio, M. Bibliometric Analysis of Urban Coastal Development: Strategies for Climate-Resilient Timber Housing. Sustainability 2024, 16, 1431. https://doi.org/10.3390/su16041431
García-Ruiz A, Díez-Minguito M, Verichev K, Carpio M. Bibliometric Analysis of Urban Coastal Development: Strategies for Climate-Resilient Timber Housing. Sustainability. 2024; 16(4):1431. https://doi.org/10.3390/su16041431
Chicago/Turabian StyleGarcía-Ruiz, Andrés, Manuel Díez-Minguito, Konstantin Verichev, and Manuel Carpio. 2024. "Bibliometric Analysis of Urban Coastal Development: Strategies for Climate-Resilient Timber Housing" Sustainability 16, no. 4: 1431. https://doi.org/10.3390/su16041431