Article

A Coupling Model for Measuring the Substitution of Subways for Buses during Snowstorms: A Case Study of Shenyang, China

1
School of Civil Engineering and Transportation, Northeast Forestry University, Harbin 150040, China
2
Aulin College, Northeast Forestry University, Harbin 150040, China
3
Investment and Financing Consulting Business Department, China International Engineering Consulting Corporation, Beijing 100048, China
4
Department of Economics and Rural Development, Gembloux Agro-Bio Tech, University of Liège, 5030 Gembloux, Belgium
*
Author to whom correspondence should be addressed.
Sustainability 2024, 16(4), 1486; https://doi.org/10.3390/su16041486
Submission received: 13 December 2023 / Revised: 17 January 2024 / Accepted: 7 February 2024 / Published: 9 February 2024

Abstract

:
The development of integrated public transportation networks has received widespread attention in recent years. Especially in global northern cities, improving the substitution of subways for buses could meet population travel demand during snowstorms, which minimizes the impact of snowstorms on the public transportation network. Furthermore, the development of rail transit is conducive to the intensive and efficient use of land resources. Therefore, in this study, we selected a northern Chinese city, Shenyang, as a case study. For obtaining the population travel demand, we collected the actual population flow data in the morning and evening peaks during snowstorms. The network analysis was used to identify the loopholes and key stations in the subway and bus networks, respectively. A coupling model was built to measure the coupling value of each station in the subway and bus networks, according to its population travel demand and supply capacity, which was further used to measure the substitution of subways for buses in the morning and evening peaks during snowstorms. The results indicate that some subway stations were in a coupling state, while their surrounding bus stations were in a decoupling state. These subway stations could replace the bus stations to reduce the impact and damage of snowstorms on public transportation network. However, some subway stations and the surrounding bus stations were all in a decoupling state, which were under great pressure to meet the population commuting demand during snowstorms. This study can provide insight into optimizing public transportation network planning and design in many northern regions and help to coordinate land and transportation utilization.

1. Introduction

With the growing development of integrated public transportation networks, they play an increasing role in people’s daily lives and work [1]. Existing transport infrastructure influences people’s daily transportation mode choices [2,3,4], while daily transportation changes the urban fabric [5,6]. Local governments have realized that the development of integrated three-dimensional transportation can make efficient use of land and thus achieve sustainable development [7]. However, some traditional adverse weather and even natural disasters seriously impact the normal operation of public transportation systems. As one example of traditional adverse weather, the snowstorm is a significant cause of increased traffic accidents and compromised traffic flow in northern Europe and northern America [8]. According to the definition of the China Meteorological Administration (CMA), snowstorm warning standards are divided into four categories, blue, yellow, orange, and red alert, which correspond to snowfall reaching 4 mm in 12 h, 6 mm in 12 h, 10 mm in 6 h, and 15 mm in 6 h [9]. Between 2015 and 2020, snowstorms in northern China caused an average of 1085 fatalities, 3800 injuries, and 25% of total traffic accidents annually (Traffic Administration Bureau of the Ministry of Public Security of the People’s Republic of China, 2021). Particularly in the morning and evening peaks, snowstorms contributed to the higher frequency of severe traffic accidents, extreme congestion, and other cascading impacts which significantly reduced the operating capacity of the entire public transportation system, especially the above-ground bus system [10,11]. The disruption of specific stations or links on the bus network can have a significant impact on morning and evening peak commuting. Some studies have shown that compared to clear days, commuting travel during snowstorms can be reduced by 10%, while it is impossible to eliminate it [12]. However, subway travel is extensively viewed to be more convenient than road-based transport [13,14,15,16] and is considered to be the most effective alternative to surface bus travel during snowstorms. Moreover, optimizing the rail transit station area is conducive to the intensive, efficient, and sustainable use of land resources [17]. Therefore, improving the substitution of subways for buses and enhancing subway rail transit would meet the commuting needs of the population and impact development and land use in subway station areas [18,19], as well as mitigating the impacts of snowstorms on the public transportation system.
There have been several substitution studies regarding modes of transportation, such as replacing other modes of travel with electric bicycles [20,21,22]. Some studies argued that understanding the driving factors behind transportation mode substitution is crucial for managing and comprehending the substitution effects between different modes of public transport [23]. These studies could help transport authorities shift ridership from buses to metro rail transit, as in Oslo [24], or conversely, like in London, support people moving from underground rail to bus networks [25,26]. Researchers estimated the impact of high-speed rail networks on air transportation by assessing the substitution effects between these two modes of transportation [27]. Some studies integrated previous research on transportation mode substitution and conducted meta-analyses to investigate the substitution effects of electric bicycles in replacing cars, public transportation, traditional bicycles, and walking [28]. Other studies explored the potential for Bus Rapid Transit (BRT) to replace bicycles by comparing the distances and travel times for current bicycle and bus commutes [29]. Some researchers focused on reducing carbon emissions by studying the increase in bicycle commuting as a substitute for public transportation, from the perspective of green travel [30]. Furthermore, some researchers investigated the substitutive role of urban rail transit in replacing cars, with an emphasis on improving air quality [31].
There are also various research methods for studying the substitution between modes of transportation. Some studies, using Bayesian inference methods, have determined the substitution probabilities of shared electric bicycles for different original modes of transportation under different travel distances [32]. Researchers have explored the possibility of Bus Rapid Transit (BRT) replacing bicycles by comparing the estimated distances and travel times of current bicycle and bus commutes by mode [29]. Amalia introduced a nested logit model that indicates a significant substitution pattern [33]. Rich conducted research on the changes in the substitution between trains and airplanes based on a demand model for long-distance travel among 42 European countries [34].
Furthermore, it has been shown that complete multimodal transport and the relationship between multi-layered networks are essential for a comprehensive understanding of urban transport systems [35]. Understanding the relationship between urban multimodal transport development is conducive to coordinating the relationship between traffic and land use and alleviating urban traffic congestion [36]. Current research on multi-level transportation networks has focused on the relationship between passenger flow distribution and network characteristics [37], for example, by establishing a simple relationship between passenger flow and route length as a way to assess the change in passenger flow after integration between subway and bus systems [38]. Therefore, it is important to understand the relationships and substitutions between different networks to minimize cascading failures between systems.
However, these studies have mainly focused on the structural relationship between different transportation networks and people’s willingness to choose the modes of travel, and have not paid attention to the actual population flow data of commuting. Moreover, it is necessary to determine whether the population flow matches the capacity of the current public transportation stations, and coupling degree is a statistical concept that is often used to analyze coordinated development level [39]. The higher the coupling degree, the greater the tendency for coordinated development between systems; in the converse case, it tends to be uncoordinated, resulting in adverse effects to the system. Tang studied an indicator system and developed a method to assess the coupling coordination between the tourism industry and the environment [40]. Xue assessed the support capacity of the comprehensive transportation system in Sichuan Province based on the evaluation of coupling coordination [41]. The following studies focused on the coupling model in terms of transportation mode substitution. Li optimized the routes between the double-layer public transportation network through the coupling design of urban rail transit and conventional bus line network, so that the subway network and bus network can substitute each other and promote the synergistic and integrated development of a subway–bus network [42]. Chen conducted a study based on the double-layer coupling network of subway–bus network synergistic optimization, preventing large-scale cascade failures in urban public transportation networks and planning the key defense strategies for cascade failures of transportation network nodes, so as to improve the network efficiency of the subway–bus transportation network [43]. These studies indicate that the theory of coupling degree can determine the development coordination between systems. This concept can be used to measure the degree of coordinated development between the supply capacity of public transportation networks and the demands of population flow, allowing for quantitative analysis of their coupling coordination relationship. Regarding the research on visualization methods in the field of transportation, some researchers have extracted data related to vehicle trajectories, thus helping port traffic participants make more reasonable management decisions [44]. Some studies used scientometric methods, social network analysis, and Stochastic Actor-oriented Model (SAOM) to visualize and analyze the source journals in order to better understand the current status of spatio-temporal crowd flow prediction research and global cooperation [45]. One study proposed an end-to-end deep learning based dual path framework, i.e., Spatial-Temporal Graph Attention Network (STGAT), for traffic flow forecasting [46]. So, this study collected the actual population flow data as the entry point to visualize the spatio-temporal distribution of passenger flow at each subway and bus station in the morning and evening peaks during snowstorms. Moreover, less research has been done on the ability of subway transportation to better meet people’s commuting needs in the context of snowstorms compared to bus networks. Therefore, the first contribution of this study was to build a coupling model to measure the coupling value of each station in subway and bus networks in the morning and evening peaks during snowstorms, according to its population commuting need and supply capacity, which allows us to further measure the substitution of subways for buses. Furthermore, improving the substitution of subways for buses could meet the population commuting need during snowstorms, which minimizes the impact of snowstorms on the public transportation network. This could also promote the population’s willingness to commute by public transportation during snowstorms, reducing land use while also reducing greenhouse gas emissions, and further achieving low-carbon travel [47]. In addition, most of the previous studies focused on cities with well-developed integrated public transport networks, especially those with well-developed subway networks, and provided little help to the design and planning of integrated public transport networks in developing cities [1,48]. The second contribution of this study was to select a northern Chinese city, Shenyang, as a case study, in which the integrated public transportation network is building. From a practical point of view, Shenyang subway has not yet matured and formed a complete subway network. The location and construction of subway stations will have an impact on the surrounding land. Therefore, the use of land for subway stations will affect the surrounding planning and construction [49]. The network analysis was used to identify the loopholes and key stations in the subway and bus networks, respectively, which could provide guidance for developing cities in China and other countries [50].

2. Data and Method

2.1. Data Sources

To investigate whether the impact of snowstorms on urban public transportation can be reduced by improving the substitution of subways for buses in the morning and evening peaks, we take Shenyang (the capital city of Liaoning Province, China) as an example, and select the central area within the Shenyang 1st Ring Road as the study area. Shenyang is located in Northeast China and is highly susceptible to heavy snowfall. Compared to other cities in Northeast China, the city’s existing subway development is relatively mature. As shown in Figure 1, the study area includes five administrative districts (Heping, Shenhe, Dadong, Huanggu, and Tiexi), with a total area of about 1.48 million square meters, which is the central area of Shenyang. On 7 November 2021, under the influence of frigid air, Shenyang ushered in a robust snowstorm condition, which reached a hefty snowfall level (24 h snowfall ≥ 30 mm), with an average snow depth of 34.1 cm. Therefore, we collected real-time data on urban public transportation and population density during the morning and evening peaks in Shenyang on 7 November 2021 to reflect the impact of the snowstorm on urban public transportation and population commuting. Moreover, we have collected and compiled the operation data of the bus and subway networks within the Shenyang 1st Ring Road.

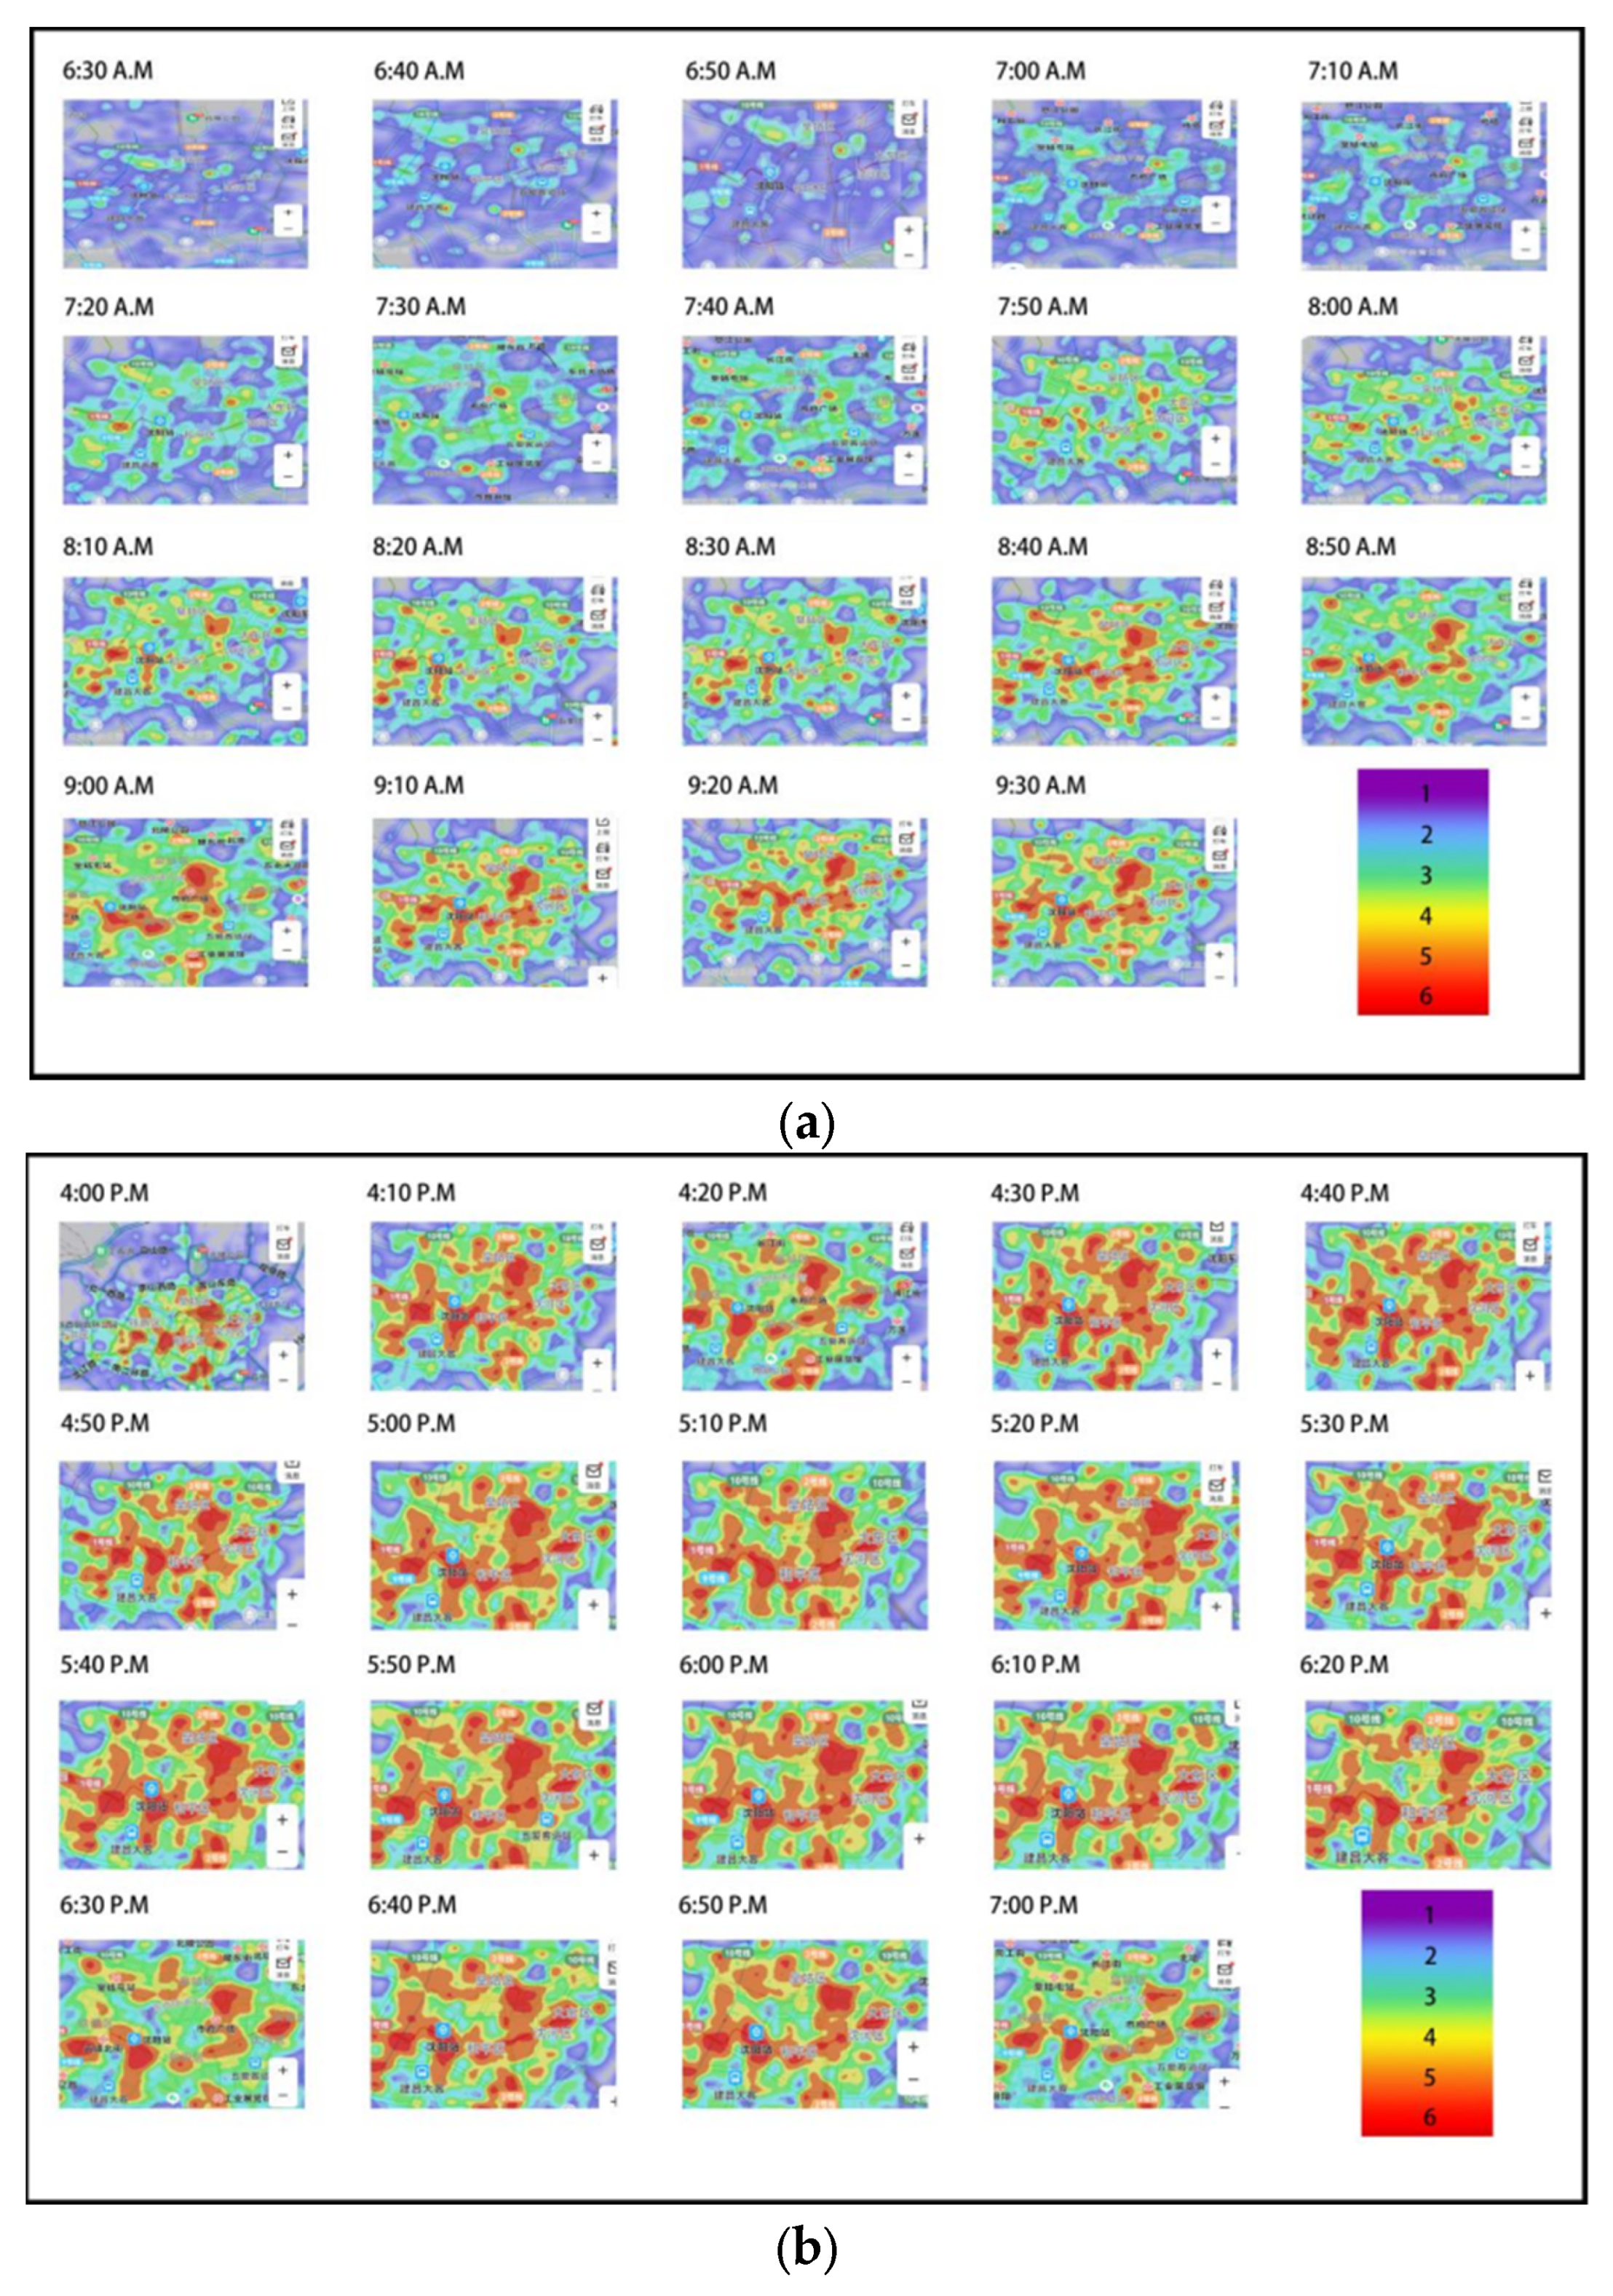
2.1.1. Population Flow Data

Through Baidu Maps (https://map.baidu.com/, accessed on 7 November 2021), this study obtained population density maps during the morning peak (6:30–9:30) and evening peak (16:00–19:00) at the time of the snowstorm on 7 November 2021. As shown in Figure 2, we divide population density into six levels based on the color of the density map (red for the highest population density and purple for the lowest population density). By comparing the color changes of the density map every ten minutes, we obtained the changes of population flow during the morning peak in each region, which reflected the demand distribution of population travel. We obtained the vector latitude and longitude data of 30 subway stations and 571 bus stations by using Taile Map (www.arctiler.com, accessed on 7 November 2021) and imported them into GIS10.2 software for visualization. After that, we matched the population density map of each period during the morning peak and evening peak with the vector layer. Map matching is the critical process of compounding a series of bus and subway stations separately to the corresponding roads on the population density maps. After correcting the vector latitude and longitude data of bus and subway stations, the error is minimal. These matched maps accurately represented the spatio-temporal distribution of actual population flow of each bus or subway station in the morning and evening peaks in Shenyang on 7 November 2021. Next, we marked the density of each station as Di (i = 1,2,3, ……,19) at ten-minute intervals, denoting the density change within ten minutes as D′, then D′ = Di+1Di. The total population density change during the morning peak is marked as Df, then Df = D . In this way, we obtain data on the change of population traffic at each station during the morning peak. Similarly, this is carried out for the population density data during the evening peak.

2.1.2. Subway and Bus Networks Data

Based on the vector latitude and longitude data of subway and bus stations provided by Taile Map, this study constructed the subway and bus network of Shenyang. At the same time, we identified all the bus lines and subway lines within the Shenyang 1st Ring Road according to Baidu Map. By identifying the bus lines and subway lines passing through each station, and based on the departure frequency of each line provided by Baidu map, we calculated the number of trains passing through the station and marked Pi, where i is the line number passing through the station (e.g., if the departure interval of link No.1 was 9 min, then P1 = 6.667 train trips/h). Then, the total number of trains passing through the station during the 3 h morning peak is Pt = 3 × P i . If the rated carrying capacity of the bus is marked as Cb, the total carrying capacity is marked as Cbt, the rated carrying capacity of the subway is marked as Cs, and the total carrying capacity is marked as Cst, then the total carrying capacity during the morning peak period is Cbt = Pt × Cb, Cst = Pt × Cs. Similarly, we can calculate the total carrying capacity of buses and subways during the evening peak.

2.2. Building the Subway and Bus Networks

The bus and subway networks were constructed separately using Pajek1.26 software. The subway network consisted of 4 links and 30 nodes (corresponding to 30 subway stations), and the bus network consisted of 166 links and 571 nodes (corresponding to 571 bus stations) (as shown in Figure 3). Both networks were framed by the interaction relationship between neighboring nodes, and the node relationships determined the connected methods, interrelationships, and connected changes of the stations in the bus or subway network. Since the neighboring nodes in bus and subway lines were connected in both directions, the connected links between stations in the network were also bidirectional. In order to unify the criteria for easy calculation, the frequency of each link was uniformly calculated according to unit hours (e.g., if the departure interval of link No.1 was 9 min, the number of this link passed through a station was 6.667 per hour), which was used to assign the weight of each link. This study converted the inter-node relationships into a pajek-readable 0-n matrix format. In this multi-value matrix, a “0” indicated no connection between two nodes and a “n” indicated the number of passed links between them, which was equal to the total weight of all connected links between two nodes.

2.3. Performing the Network Analysis

Through the “network analytical” approach, scholars have contributed notably to describing and explaining these structural characteristics using such concepts as K-core, degree centrality, and structural hole [51]. The observation units are a set of objects called nodes, positions, or actors, and a set of present or absent relations among these objects referred to as edges, ties, or links [52]. The bus and subway networks were constructed separately using Pajek software, and several indicators were used to measure their critical structural features: (1) K-core was defined as a hierarchical set of nodes based on the number of links and the degree of connections [53,54]. In bus and subway networks, the k-core determined the connected structure and overall relationship between links. The influential sub-groups with the maximum k-core value included the significant nodes, which had well-connected nearest neighbors and shaped the key links in the bus and subway networks, respectively. (2) Degree centrality answered the question, ‘which nodes were central in the network?’ [55]. It measured a node’s real connections in the bus and subway networks, respectively, which could be used to identify nodes with an extensive collaborative activity. Calculating the number of link a node connected determined how well-connected this node was. A node connected more links held a more influential position because it had access to more other nodes. (3) Structural hole was used to identify the intermediary roles that some nodes play in the bus and subway networks, respectively. A node with a higher value means that it has a greater chance of becoming a structural hole, because it has fewer connections to other nodes, or has a more prominent intermediary position in connecting other nodes, and the other nodes connected to it have a higher chance of becoming brokers. The reason why we choose these three indicators to study the structural characteristics of the bus network and subway network is that degree centrality determines the central position and influence of a station in the whole network. A higher degree centrality value indicates that the station holds greater influence within the entire network. The K-core represents the influence of a station in a group, which determines the importance of a station in the local area of the network. A larger K-core indicates that the station is in a more critical position in the local area of the network compared with its connected stations. Through the two indicators of degree centrality and K-core, we can not only find influential stations from the whole network but also identify key stations through local areas in the network, so as to make the study more scientific and complete. The calculation of structural holes can determine the vulnerable stations in the entire network, so that we can find the weak stations in the entire network and can make targeted improvements in the later construction of the public transportation network.

2.4. Building the Coupling Model

The concept of “coupling” was first applied in the practical study of physics, which referred to the entanglement of two or more things or domains with mutual influence and effect. In positive coupling, things acted as facilitators and positively influence each other, thus achieving better-desired results. Negative coupling meant that things were connected in a way that destroys the coupling and orderliness between them, thus making the desired effect worse or losing the coupling relationship. For example, Sun pointed out that in positive coupling, the distribution effect of road transport on railway transport makes the development relationship between them closer, thus improving the efficiency of railway transport. At the same time, the improvement of the efficiency of railway transport will also bring a huge impetus to the development of road transport, thereby improving the efficiency of road transport. The negative coupling is specifically manifested in the slow development speed of a certain mode of transport, insufficient transport capacity, and inability to efficiently cooperate with other modes of transport, thus restricting the entire channel transport efficiency [56]. The coupling degree is a quantitative indicator to reflect the magnitude of benign coupling between the components or subsystems in a complex system. The goodness of the coupling relationship between the components or subsystems could determine a suitable coupling model. If the station is in a decoupling state, it indicates that there is a mismatch between the supply side of the station’s carrying capacity and the demand side of the population, which is likely to cause the following losses: (1) The population demand is greater than the capacity supply, which means that the station cannot meet the commuting demand of the population. In fact, it is a loss to the convenience of population travel. (2) The population demand is less than the capacity supply, which means that the supply of the station is redundant and will cause a waste of social resources. In fact, it is a major loss to the economy.
In this study, the coupling model was built to measure the coupling value of each station in subway and bus networks, according to its population commuting demand and supply capacity, in the morning and evening peaks on 7 November 2021 in Shenyang, respectively. The spatio-temporal distribution of actual population flow among subway or bus stations were defined as the population commuting demand. According to the number of passed links among subway or bus stations, we collected and calculated the full load of passengers, which were defined as the supply capacity of each station in subway and bus networks. According to the “distance-decay effect” and “transit accessibility” [57,58,59], a passenger was comfortable walking 400 m on average to access a subway or bus station. His/her inclination for taking a subway or bus would decrease when the walking distance exceeds 400 m [59]. The accessibility of a city can reflect the efficiency of urban land use and the current status of public transportation development, which can help to improve the overall development of public transportation [60]. Therefore, we combined the subway stations with the surrounding bus stations which were within 400 m to verify whether the subway could effectively substitute the bus in the morning and evening peaks during snowstorms.
By referring to the coupling model between environmental performance and human well-being constructed by Han [61], we build a coupling model between demand side and supply side of traffic stations. The specific calculation possesses were as follows: in the first step, we calculated the coupling between the supply side and the demand side of public transportation network stations.
  C i = f x × f y f x + f y / 2 2
In Equation (1), C i was the original coupling value and C i ∈ (0,1); the greater the coupling degree is, the stronger interaction between the subsystems would be, and vice versa; f x and f y represent the demand date and supply date, respectively. From Chapter 2, we know that f x = Df = D , f y = Cbt = Pt × Cb.
In order to ensure that the value of the f x , f y are between 0 and 1, the data are first “normalized”, which is calculated as follows:
f x = a + ( b a ) × ( X X M i n ) ( X M a x X M i n )
  f y = a + ( b a ) × ( Y Y M i n ) ( Y M a x Y M i n )
In Equations (2) and (3), a = 0.01, b = 0.99, X M a x , Y M a x and X M i n , Y M i n denote the corresponding maximum and minimum values in f x ,   f y , respectively.
The second step was to modify the original coupling value to avoid the “pseudo-coordination”, in which the population travel demand and the supply capacity of a station were both insufficient, while the experimental result incorrectly showed that this station was in a coupling state. Therefore, the original coupling value was modified as follows:
C i = C i × T i
T i = σ f x + τ f y
where C i represents the modified coupling value, C i ∈ (0, 1); T i refers to comprehensive development level. f x and f y represent the demand date and supply date, respectively. σ and τ were the undetermined coefficients, and σ   + τ   = 1, both were equally important. Therefore, we set σ and τ as the value of 0.5.
The modified coupling value ( C ) was in the interval of (0–1). We finally divided it into ten levels from (0.0–0.1) to (0.9–1.0). When the modified coupling value ( C ) of a station was in the level of (0.0–0.1), it indicated that this station was in an extremely decoupled state. When the modified coupling value ( C ) of a station was in the level of (0.9–1.0), it indicated that this station was in the extremely coupled state.

3. Results

3.1. Network Analysis of Subway and Bus Networks

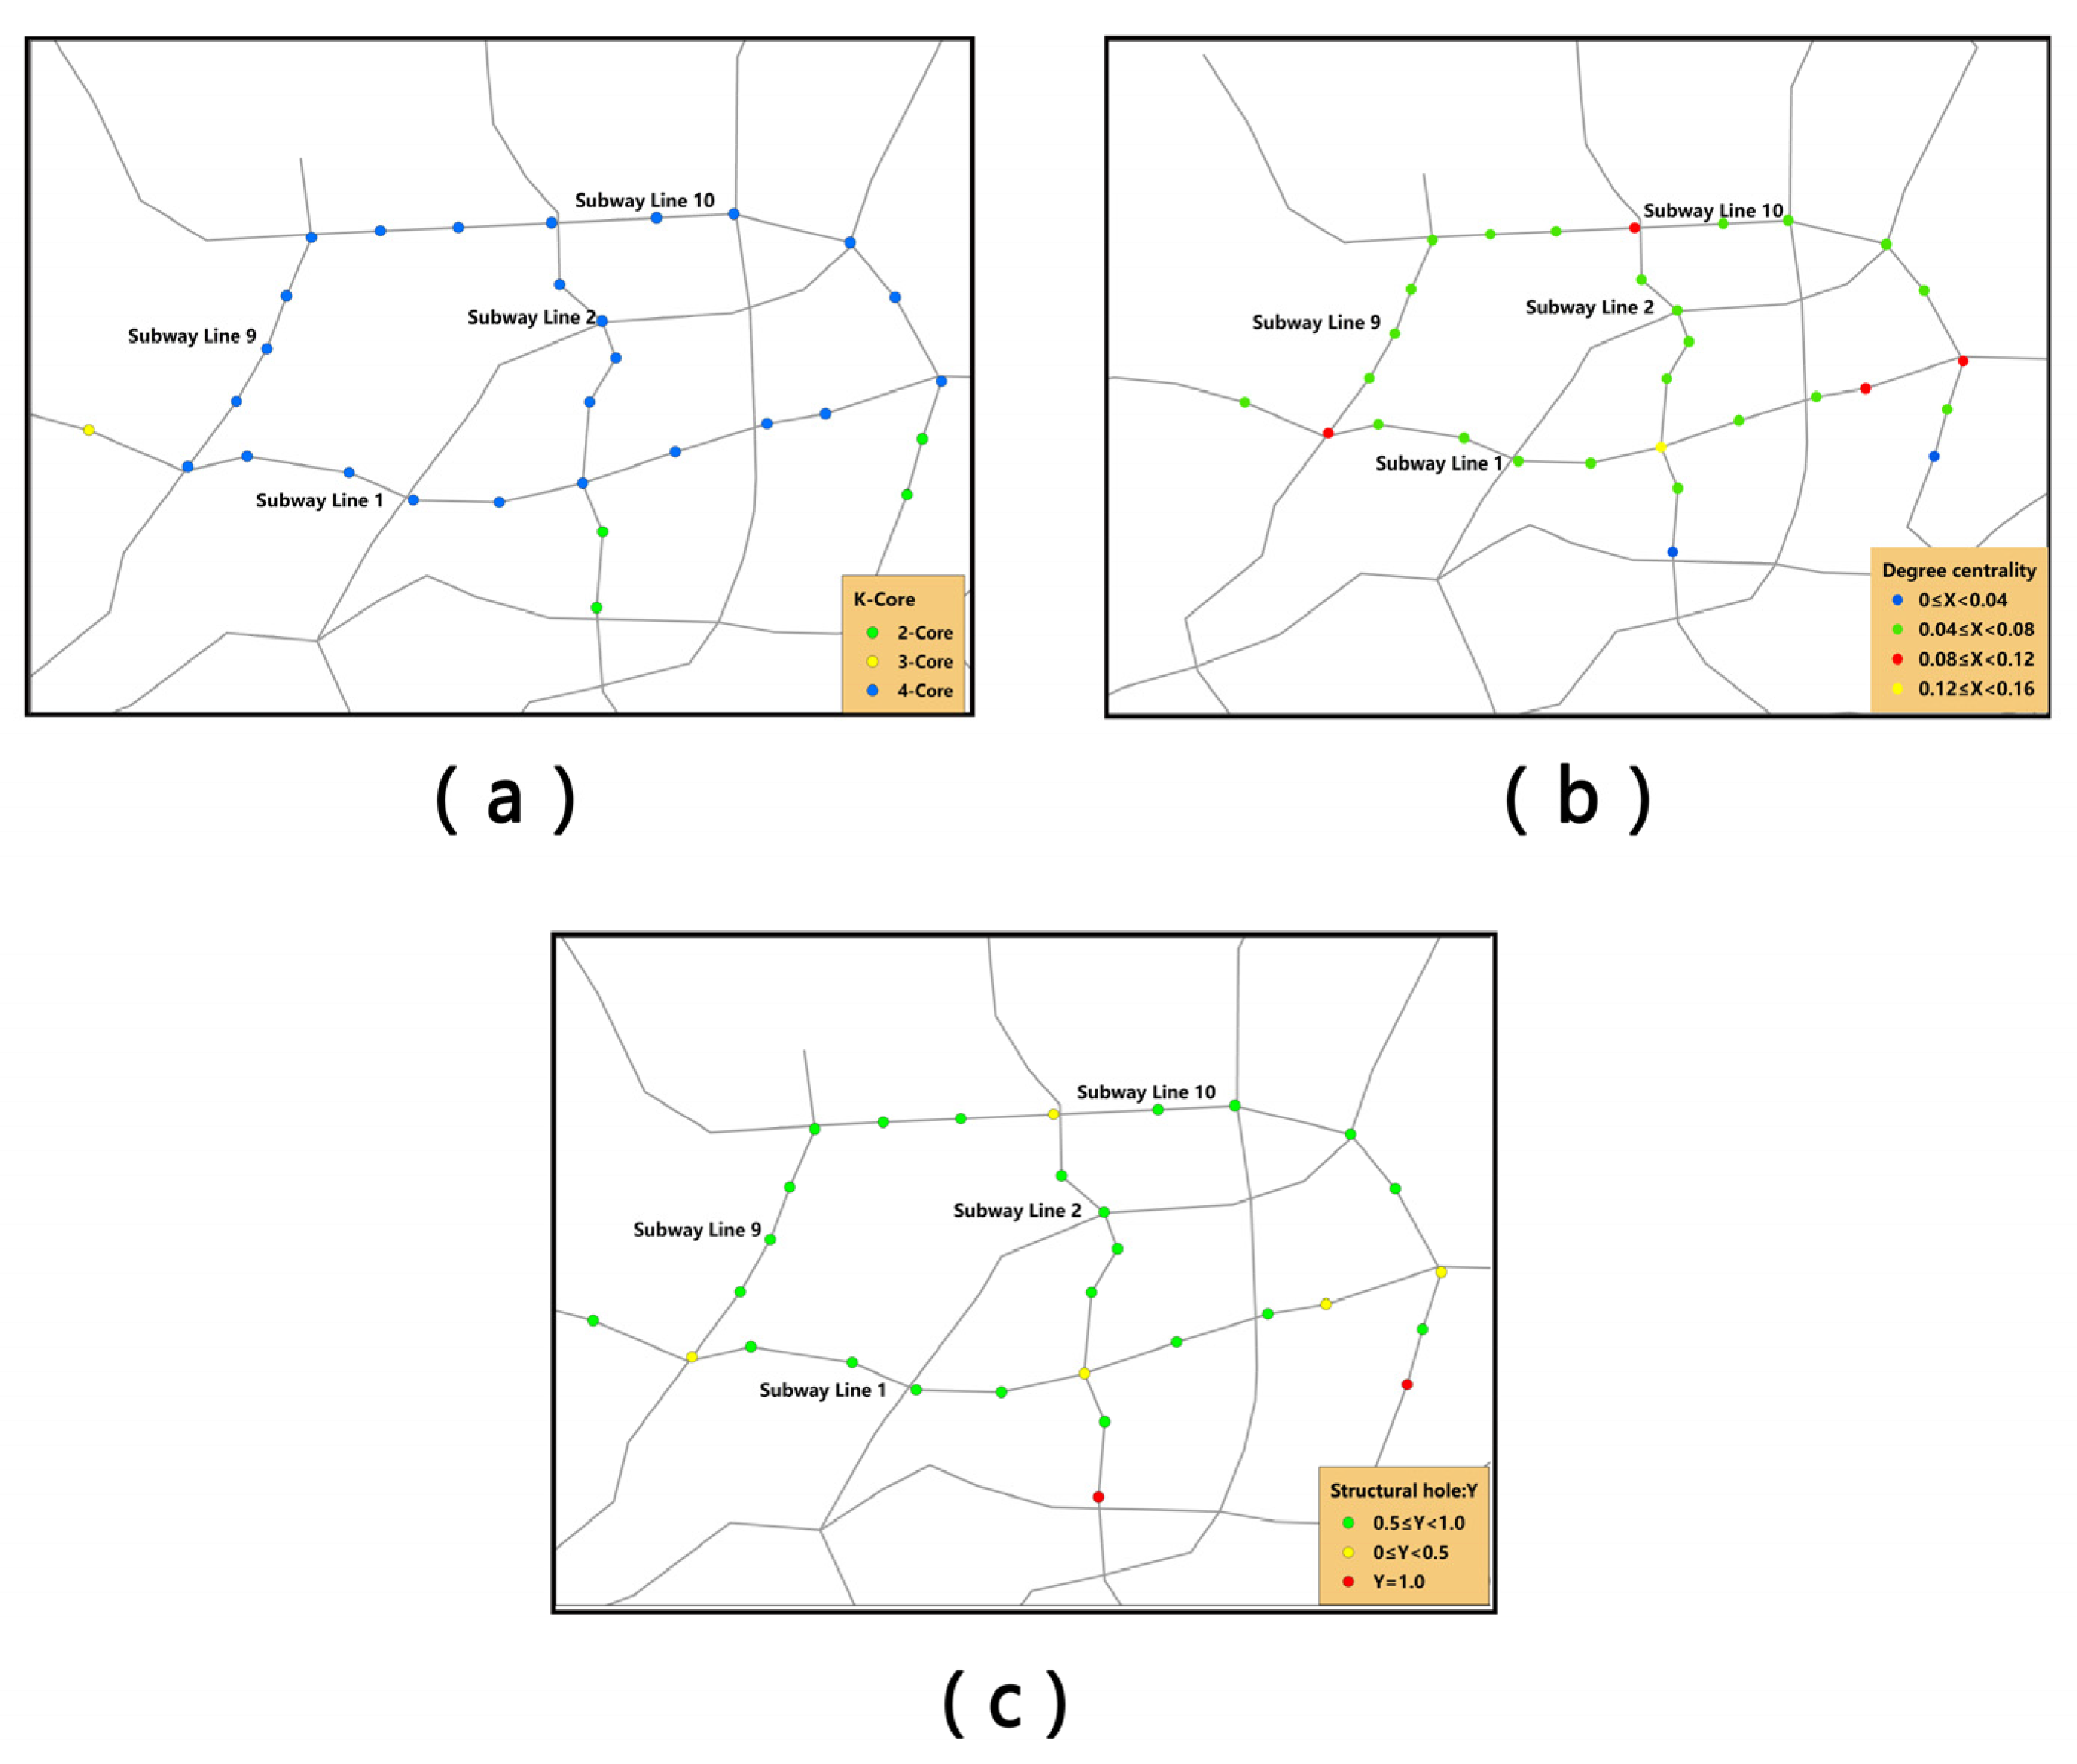
3.1.1. Network Analysis of the Subway Network

As shown in Figure 4a, according to different K-core values, three station subgroups were distinguished by three colors in the subway network. The subgroup with the smallest K-core value (2-core) had four stations, which were located at the edge of the whole subway network. These four stations had a minor influence on the subway links, and their transportation role was relatively small. Therefore, these four stations at the edge of the subway network did not share the transport pressure of other stations. The subgroup with the largest K-core value (4-core) involved 25 stations, which were colored in blue. These stations were more influential, had well-connected near neighbors, and formed the key links of the subway network. This indicated that these stations have more subgroups in the local area of the subway network, have more influence, and are important nodes in the key routes of the subway network. In addition, these stations are all located in the center of Shenyang city, and most of the K-core values of each station are the same, indicating that the stations are more closely connected to each other, the connection between the metro network is more stable, and the planning and construction of the metro network is more reasonable.
As shown in Figure 4b, this study divided the degree centrality value (X) of stations into four levels. There was only one station (Youth Street Station) in the highest level of (0.12 ≤ X < 0.16), which was colored in yellow. This station was located at the intersection of links No.1 and 2, which was the central area of the subway network. As a critical node, if this station was affected during snowstorms, this station would be a fatal blow to the operation of the entire subway network, which would ultimately lead to disruption [62]. Moreover, most stations were in the medium levels of (0.04 ≤ X < 0.08) and (0.08 ≤ X < 0.12), which were colored in green (23 stations) and red (4 stations), respectively. Therefore, in the subway network of Shenyang, most stations were relatively well connected. Only two stations (Industrial Exhibition Hall Station and Wanlian Station) were in the lowest level of (0 ≤ X < 0.04), which were colored in blue. These two stations which were located at the edge of the subway network, were the source of the structural and functional vulnerability of the whole subway network [1]. This showed that most of the subway stations are in the key position of the whole subway network, each station playing an important role in the normal operation of the subway network. And the connection between the stations is close, as there is a high connectivity between the metro lines. In fact, due to the fixed nature of the subway track lines and the certainty of the subway running direction, the failure of any one of the subway stations will have a significant impact on the entire subway network, and may even lead to the paralysis of the entire subway network.
As shown in Figure 4c, this study divided the structural hole value (Y) of stations into three levels. There were two stations (Industrial Exhibition Hall station and Wanlian station) in the highest level of (Y = 1.0), which was colored in red. These two stations, as the most significant structural holes in the subway network, should be targeted to maintain their normal functions during snowstorms, due to the lack of reliable and stable collaboration with other stations, which may further cause quick loss of connection with the entire subway network. Most stations (23 stations) had the medium level of (0.5 ≤ Y < 1.0), which were colored in green. These results indicate that the stations in this subway network were closely connected, although there were two structural holes. The remaining five stations had the lowest level of (0 ≤ Y < 0.5), were located at the intersection of different subway links. These results indicate that these five stations played a more critical role in the connection of subway links. As the transit nodes, these stations should be strengthened to protect them during snowstorms, which would ensure the normal operation of the subway network. The structural hole calculation results showed that the entire subway network is closely linked, but focus is still needed on the stations at the edge of network. These kinds of stations have a greater competitive advantage and development potential, and should be emphasized in the later construction of subway network lines.

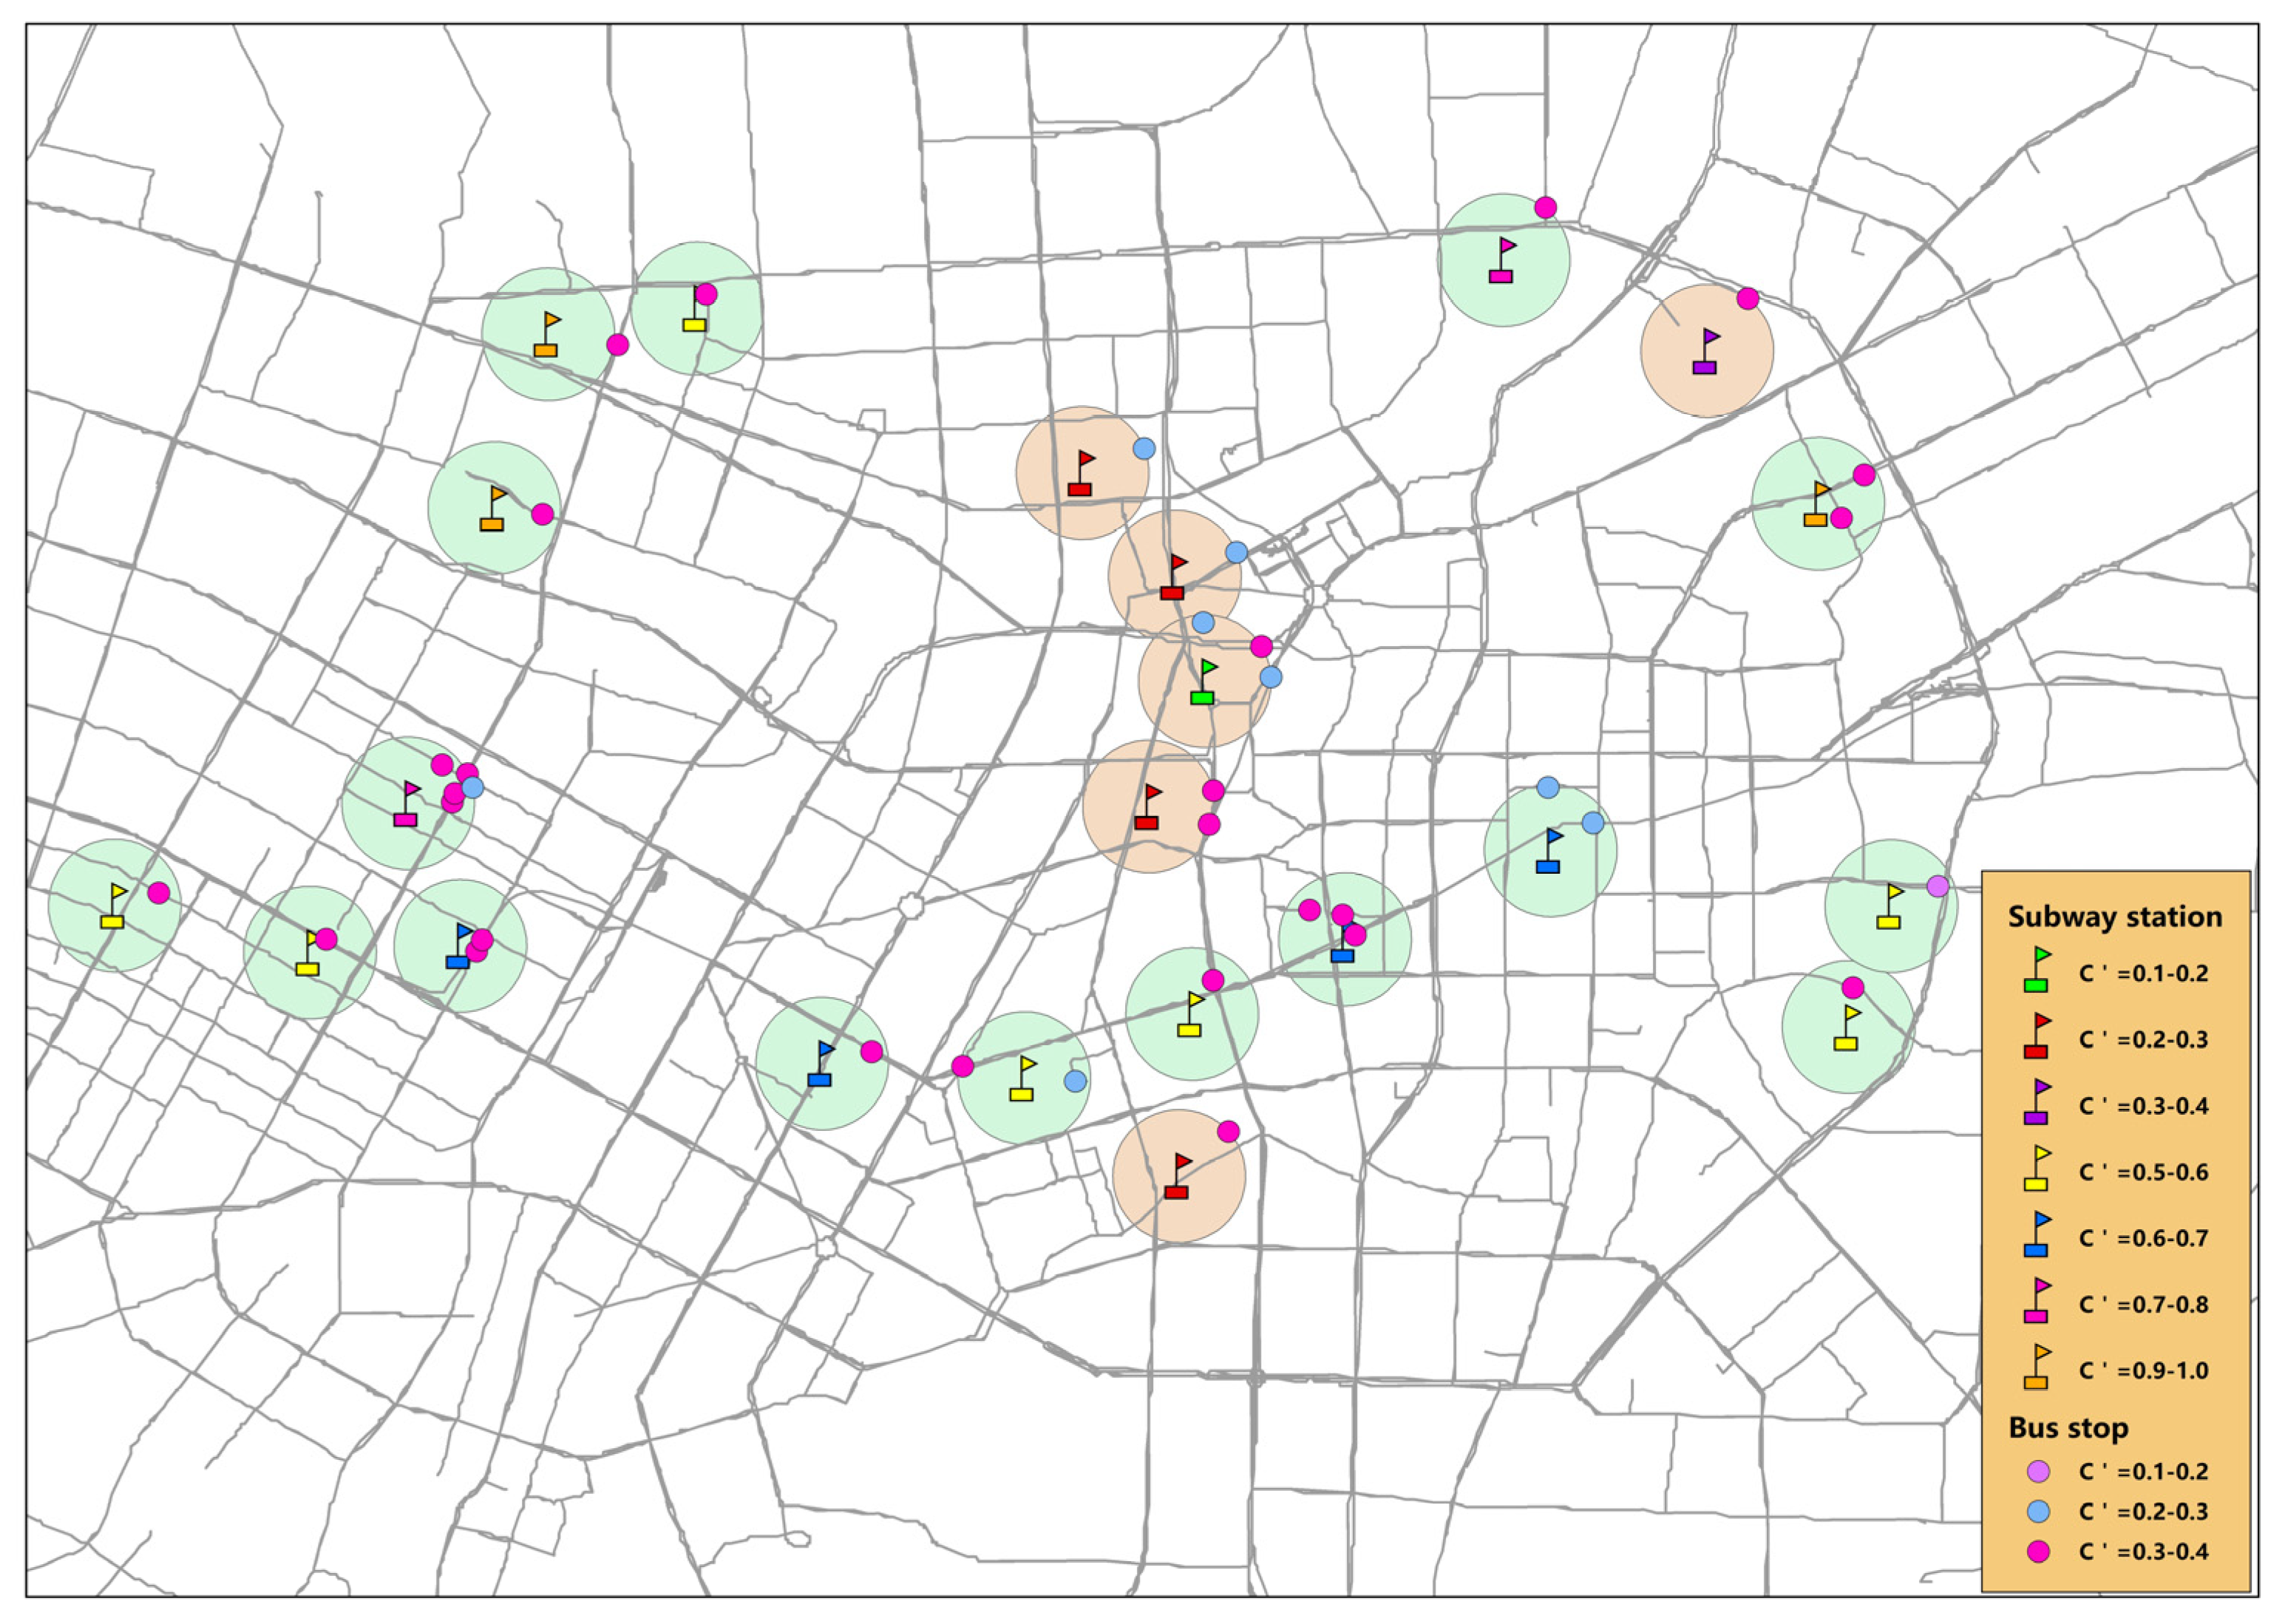
3.1.2. Network Analysis of the Bus Network

Similarly, as shown in Figure 5a, according to different K-core values, four station subgroups were distinguished by four colors in the bus network. The subgroup with the smallest K-core value (0-core) had 20 stations, which were colored in blue. These 20 stations had a minor influence on the bus links, and their transportation role was relatively small. It is worth mentioning that several stations with the smallest K-core value (0-core) were located in the central of the bus network. For example, there were too few bus links passed through Qishan Road Station, Financial Center Station, and City Hall Plaza Station. Moreover, by observing the spatio-temporal distribution of actual population flow in these three stations, their supply capacity struggled to meet the correspondingly population commuting demand. Moreover, the subgroup with the largest K-core value (6-core) involved 179 stations, which were colored in red and accounted for about 1/3 of the total stations (N = 571). As the most significant influential nodes, these stations were more closely connected to other stations and formed the key links in the bus network. The subgroup with the medium K-core value (4-core) involved 325 stations, which were colored in purple and accounted for about 1/2 of the total stations (N = 571). The results of the K-core value calculations showed that despite the complexity of the bus network routes, the importance of the stations varies due to their regional location, with nearly half of the bus stations having numerous subgroups that play an important role in the bus network within their region. These stations with high K-core values are connected to each other to form the key routes of the bus network. It also proved that the composition of the overall bus network is more balanced and the layout of the stations is more reasonable.
As shown in Figure 5b, this study divided the degree centrality value (X) of stations into 11 levels. There were 33 stations in the higher levels of (0.014 < X ≤ 0.016), (0.016 < X ≤ 0.018), and (0.018 < X ≤ 0.021), which were located in the center of the bus network. Furthermore, most stations were located in the level of (0.002 < X ≤ 0.014), which played a more important connecting role for the normal operation of the entire bus network. The stations in the lower levels of (X = 0.000) and (0.000 < X ≤ 0.002) were mainly located in the peripheral part of the bus network, which had relatively less impact on the entire bus network. Based on the results of the degree centrality calculations, we identified key stations that are at the center of the entire bus network. These stations had a significant impact on the entire bus network during the snowstorm and played a key role in transit and connectivity. Therefore, we should focus on these key stations and the bus routes that pass through them during snowstorms to ensure that the bus network can maximize its transportation function.
As shown in Figure 5c, this study divided the structural hole value (Y) of stations into ten levels. There were 331 stations in the lowest level of (0.0 ≤ Y < 0.5), which indicated that these stations located in the central area of Shenyang, were currently more closely connected to each other, and had smaller structural loopholes. However, there were 60 stations in the highest level of (Y = 1.0), which contained most stations located at the edge of the bus network. However, some of these stations were located in the centre of the bus network, such as Taiyuan Street Station and South Market Station. Therefore, these stations, as the structural holes, have more competitive advantages and greater development potential than other stations in the bus network. So, we should focus on planning for these stations in future bus route development.

3.2. Coupling Analysis of Subway and Bus Networks

In this study, we calculated the modified coupling value ( C ) of all stations in the subway and bus networks. As shown in Figure 6, the results showed that there were 16 subway stations in a coupling state ( C = 0 .5–1.0) in the morning peak on 7 November 2021, while the bus stations within 400 m of these subway stations were in a decoupling state ( C = 0 .0–0.4). These subway stations effectively shared the burden of transporting passengers in the morning peak, when the surrounding bus stations were in a decoupling state due to the snowstorm. The most notable station is the Beierlu subway station ( C = 0 .765), in which there were five surrounding bus stations in a decoupling state.
Moreover, it was noteworthy that there were five subway stations in a decoupling state ( C = 0 .0–0.4) in the morning peak on 7 November 2021, and the bus stations within 400 m of these subway stations were also in a decoupling state ( C = 0 .0–0.4). These results suggested that both subway and bus networks in these areas were under great pressure to meet the population commuting demand in the morning peak on 2 November 2021.
Similarly, as shown in Figure 7, there were 14 subway stations in a coupling state ( C = 0 .5–1.0) in the evening peak on 7 November 2021, while the bus stations within 400 m of these subway stations were in a decoupling state ( C = 0 .0–0.4). The results indicate that the substitution of subways for buses was more prominent in the evening peak on 7 November 2021. Compared with the morning peak, there were more bus stations in the decoupling state in the evening peak, which were around the subway stations of Beierlu Station, Tiexi Square Station, Shenyang Station, and Huaiyuanmen Station. Moreover, the coupling value of these subway stations were higher in the evening peak than that in the morning peak. Therefore, these subway stations were in a more coupling state to effectively relieve the pressure on the bus system to meet the population commuting demand when the surrounding bus stations were in a decoupling state due to the snowstorm.
Moreover, it is worth noting that there were six subway stations in a decoupling state ( C = 0 .0–0.4) in the evening peak on 7 November 2021, while the bus stations within 400 m of these subway stations were also in a decoupling state ( C = 0 .0–0.4). The most notable subway station was the Financial Center station ( C = 0 .309), in which six surrounding bus stations were all in a decoupling state. These results indicate that the supply capacity of these six subway stations were more affected in the evening peak on 7 November 2021.

4. Discussion and Conclusions

This study employed network analysis to identify key nodes within the subway and bus networks and utilized a coupling model to calculate the coupling values for each station. The calculation results showed that there were 90 bus stations with high K-core values (K-core = 6) but in a decoupled state (colored in green in Figure 8), and 17 bus stations with high degree centrality values (degree centrality value > 0.01) but in a decoupled state (colored in blue in Figure 8), while 5 subway stations with high K-core values (K-core = 4) were in a decoupled state (colored in red in Figure 8). This suggests that during snowstorms, some of the stations within the public transportation network were unable to meet people’s commuting needs. Since these stations occupy critical positions within the entire transportation network, they are likely to cause the entire network to collapse. Furthermore, the calculation results indicate that 45 bus stations with high structural hole values (structural hole values = 1) were in a decoupled state (colored in yellow in Figure 8). This implies that these stations, as structural holes, have a greater competitive advantages and development potential compared to other stations. Therefore, when planning future bus route development, special attention should be given to these stations.
The detailed findings of our study were as follows: Firstly, by collecting population density data within the Shenyang 1st Ring Road at ten-minute intervals during the morning (6:30–9:30) and evening (16:00–19:00) peaks in Shenyang on 7 November 2021, we showed the spatio-temporal distribution of actual population flow at each subway or bus station, which provided the population commuting demand more accurately and directly. Moreover, we built the subway and bus networks, respectively, and compiled and calculated the operating links, the full load of passengers, and the departure frequency of each subway or bus station, which provided the supply capacity. Secondly, network analysis was used to describe and explain the structural characteristics of subway and bus networks, respectively. For example, according to the K-core results, the findings indicated that some subway (25 stations, colored in blue in Figure 4a) and bus (179 stations, colored in red in Figure 5a) stations, with the largest K-core value, were the most significant influential nodes, having well-connected near neighbors and forming the key links. However, some bus stations (20 stations, colored in blue in Figure 5a), with the smallest K-core value, were located in the central of the bus network but had a minor influence on the bus links and their supply capacity struggled to meet the corresponding population commuting demand. According to the degree centrality results, the findings indicated that some subway (Youth Street Station, colored in yellow in Figure 4b) and bus (33 stations, colored in pink, blue, and green, respectively, in Figure 5b) stations with the highest level of degree centrality were the critical nodes, which played critical roles in link transit and connection and had a significant influence on the entire subway or bus network during snowstorms. However, some subway (Industrial Exhibition Hall Station and Wanlian Station, colored in blue in Figure 4b) stations with the lowest level of degree centrality were the source of the structural and functional vulnerability of the whole subway network during snowstorms. According to the structural hole results, the findings indicated that some subway (Industrial Exhibition Hall station and Wanlian station, colored in red in Figure 4c) and bus (60 stations, colored in light blue in Figure 5c) stations with the highest level of structural hole value were the most significant structural holes, which were mainly at the edge of the subway or bus network, and lacked reliable and stable collaboration with other stations and might lose connection with the entire subway or bus network quickly. Therefore, more “brokers” connected with these structural holes should be targeted and planned in the future, which could fill the loopholes to maintain the normal functions of subway and bus networks during snowstorms. Thirdly, the coupling model was built to verify the substitution of each subway station for its surrounding bus stations (within 400 m) in the morning and evening peaks during snowstorms. According to the modified coupling results, some subway stations (16 stations in the morning peak, colored in blue in Figure 6; 14 stations in the evening peak, colored in blue in Figure 7) were in a coupling state, while their surrounding bus stations were in a decoupling state. These findings indicated that these subway stations maintained their normal operation during snowstorms, which could share the corresponding transport pressure to meet population commuting demands when their surrounding bus stations could not operate normally due to the snowstorm. In contrast, some subway stations (five stations in the morning peak, colored in pink in Figure 6; six stations in the evening peak, colored in pink in Figure 7) and their surrounding bus stations were all in a decoupling state. These findings indicated that these subway stations and their surrounding bus stations were all significantly impacted by the snowstorm, meaning they could not fully play their transportation roles.
Through the subway and bus network structural analysis and the substitution study of the subway network to the bus network, we think that the following measures can mitigate the impact of the snowstorm on the public transportation network and enhance the transportation capacity of the public transportation network. (1) Focus on key stations as well as loophole stations in the subway and bus network. Transportation departments should carry out dynamic monitoring of key stations and central stations during snowstorms. At the same time, increase the snow clearing efforts on the roads around these stations, equipped with adequate snow clearing equipment and snow clearing facilities, to ensure that the stations can operate normally during snowstorms, reducing the chances of failure of the stations. In the development of new routes, we should focus on planning loophole stations, connecting them with more stations, exploring their potential advantages, and improving the integrity of the overall network. (2) Since it is verified that the subway network has the potential to replace the bus network, people can be guided to choose the subway during snowstorms. In order to alleviate the pressure of population flow from the bus network, the subway network should shorten the departure time and increase the frequency of subway departure according to the dynamic change of population flow, so as to improve the transportation capacity of the subway network. (3) Add new subway stations to reduce the impact of snowstorms on the public transportation network. Compared with buses, subways can operate normally without the impact of snowstorms. In order to enhance the ability of public transportation network to cope with snowstorms, new subway stations can be added in the aggregation area of decoupling bus stations according to the coupling results to replace the decoupling bus stations within 400 m. This will allow for the substitution of the entire subway network for the bus network.
Based on the above findings, this study can be used for urban public transport planning and construction in many northern regions of the world to coordinate traffic and land use, optimize the location of public transport stops, achieve efficient use of land resources, and effectively improve the capacity of entire public transportation network to cope with snowstorms. Firstly, through the network analysis, we identified the most critical stations, as the “nerve centers”, in the subway and bus networks, respectively. We also identified some bus and subway stations which quickly lost connection with other stations and were most prone to failures during snowstorms. Therefore, we recommend adding new lines for these subway and bus stations to increase the supply capacity of the whole subway and bus networks. Secondly, through the coupling analysis, we verified the substitution of some subway stations for their surrounding bus stations in the morning and evening peaks during snowstorms, indicating that the subway network has the potential to substitute the bus network. And we identified that some subway stations were also in a decoupling state, as well as their surrounded bus stations. Therefore, improving the substitution of subways for buses could be proven as a significantly and effectively way to reduce the impact of snowstorm on the public transportation network, which could promote the population’s willingness to commute by public transportation during snowstorms, instead of private cars, thus further achieving low-carbon travel. Finally, by proving the substitution of subway stations for bus stations and the effectiveness of subway substitution for bus travel during snowstorms, this work can provide guidance for the development of the urban public transportation network, especially the development of the subway network. It is also possible to add new subway stations in the subsequent study for the uncoupled bus stations gathering area to meet people’s commuting needs during the snowstorm, and at the same time to solve the land use and traffic problems in the process of urban development, which will provide a basis for the subsequent construction of subway stations and the optimization of the land use of the entire subway network. This study is conducive to the rational arrangement of the proportion structure and spatial layout of land use types in the area of metro stations, giving full play to the advantages of land as a core resource in urban development and construction, coordinating the relationship between public transportation and land use development, and realizing the sustainable development of land resources.
Despite the comprehensive findings, this research has several limitations. First, due to the limitations of data accessibility, the population flow data selected in our study were just focused on several days as the specific scenario. Second, we investigated the efficiency of the public transportation network by enhancing the substitution of subway for bus, which could significantly satisfy population commuting demand during snowstorms. However, previous studies had shown that the higher substitution and coupling state between public transportation networks make them more vulnerable to be attacked [63,64]. Therefore, during snowstorms, how to reduce the vulnerability of bus and subway networks with higher substitution and coupling state will be the focus of our next research.

Author Contributions

S.W.: Data collection, Formal analysis, Writing—original draft. J.W.: Investigation, Software. D.L.: Data curation, Visualization. H.A.: Supervision. J.L.: Conceptualization, Funding acquisition, Writing—review and editing. All authors have read and agreed to the published version of the manuscript.

Funding

This work was supported by Natural Science Foundation of Heilongjiang Province of China (No. YQ2020G001), and Scientific Research Foundation for Heilongjiang Postdoctoral (No. LBH-Q21054).

Institutional Review Board Statement

Not applicable.

Informed Consent Statement

Not applicable.

Data Availability Statement

The raw data supporting the conclusions of this article will be made available on request.

Conflicts of Interest

Author Di Lu was employed by the company Investment and Financing Consulting Business Department, China International Engineering Consulting Corporation. The remaining authors declare that the research was conducted in the absence of any commercial or financial relationships that could be construed as a potential risk. The remaining authors declare that the research was conducted in the absence of any commercial or financial relationships that could be construed as a potential conflict of interest.

References

  1. Chopra, S.S.; Dillon, T.; Bilec, M.M.; Khanna, V. A network-based framework for assessing infrastructure resilience: A case study of the London metro system. J. R. Soc. Interface 2016, 13, 20160113. [Google Scholar] [CrossRef]
  2. Handy, S.; Weston, L.; Mokhtarian, P.L. Driving by choice or necessity? Transp. Res. Part A Policy Pract. 2005, 39, 183–203. [Google Scholar] [CrossRef]
  3. Heinen, E.; Van Wee, B.; Maat, K. Commuting by bicycle: An overview of the literature. Transp. Rev. 2010, 30, 59–96. [Google Scholar] [CrossRef]
  4. Mitra, R. Independent mobility and mode choice for school transportation: A review and framework for future research. Transp. Rev. 2013, 33, 21–43. [Google Scholar] [CrossRef]
  5. Camagni, R.; Gibelli, M.C.; Rigamonti, P. Urban mobility and urban form: The social and environmental costs of different patterns of urban expansion. Ecol. Econ. 2002, 40, 199–216. [Google Scholar] [CrossRef]
  6. Newman, P.; Kenworthy, J. Urban design to reduce automobile dependence. Opolis 2006, 2, 35–52. [Google Scholar]
  7. Mu, R.; de Jong, M. Establishing the conditions for effective transit-oriented development in China: The case of Dalian. J. Transp. Geogr. 2012, 24, 234–249. [Google Scholar] [CrossRef]
  8. Morgan, A.; Mannering, F. The effects of road-surface conditions, age, and gender on driver-injury severities. Accid. Anal. Prev. 2011, 43, 1852–1863. [Google Scholar] [CrossRef]
  9. Zhang, J.; Liu, S.; Liang, H.; Wan, W.; Guo, Z.; Liu, B. Using GNSS-IR Snow Depth Estimation to Monitor the 2022 Early February Snowstorm over Southern China. Remote Sens. 2022, 14, 4530. [Google Scholar] [CrossRef]
  10. Hamzeie, R.; Savolainen, P.T.; Gates, T.J. Driver speed selection and crash risk: Insights from the naturalistic driving study. J. Saf. Res. 2017, 63, 187–194. [Google Scholar] [CrossRef]
  11. Molarius, R.; Keränen, J.; Kekki, T.; Jukarainen, P. Developing Indicators to Improve Safety and Security of Citizens in Case of Disruption of Critical Infrastructures Due to Natural Hazards—Case of a Snowstorm in Finland. Safety 2022, 8, 60. [Google Scholar] [CrossRef]
  12. Call, D.A.; Medina, R.M.; Black, A.W. Causes of Weather-Related Crashes in Salt Lake County, Utah. Prof. Geogr. 2019, 71, 253–264. [Google Scholar] [CrossRef]
  13. Knoppers, P.; Muller, T. Optimized transfer opportunities in public transport. Transp. Sci. 1995, 29, 101–105. [Google Scholar] [CrossRef]
  14. Spencer, A.H.; Andong, W. Light rail or busway? A comparative evaluation for a corridor in Beijing. J. Transp. Geogr. 1996, 4, 239–251. [Google Scholar] [CrossRef]
  15. Nie, C.; Wen, H.; Fan, X.-F. The spatial and temporal effect on property value increment with the development of urban rapid rail transit: An empirical research. Geogr. Res. 2010, 29, 801–810. [Google Scholar]
  16. Salon, D.; Wu, J.; Shewmake, S. Impact of bus rapid transit and metro rail on property values in Guangzhou, China. Transp. Res. Rec. 2014, 2452, 36–45. [Google Scholar] [CrossRef]
  17. Tong, H.; Dong, X.; Liu, J. Optimization Method for Land Use of the Xi’an Rail Transit Station Area Based on a Multi-Objective Model. Land 2023, 12, 1705. [Google Scholar] [CrossRef]
  18. Cervero, R. Linking urban transport and land use in developing countries. J. Transp. Land Use 2013, 6, 7–24. [Google Scholar] [CrossRef]
  19. Hou, Q.; Duan, Y.; Ma, R. Collaborative optimization of land use intensity and traffic capacity under hierarchical control rules of regulatory detailed planning. J. Chang. Univ. 2015, 35, 114–121. [Google Scholar]
  20. Astegiano, P.; Tampère, C.M.; Beckx, C. A preliminary analysis over the factors related with the possession of an electric bike. Transp. Res. Procedia 2015, 10, 393–402. [Google Scholar] [CrossRef]
  21. Hiselius, L.W.; Svensson, Å. E-bike use in Sweden–CO2 effects due to modal change and municipal promotion strategies. J. Clean. Prod. 2017, 141, 818–824. [Google Scholar] [CrossRef]
  22. Sun, Q.; Feng, T.; Kemperman, A.; Spahn, A. Modal shift implications of e-bike use in the Netherlands: Moving towards sustainability? Transp. Res. Part D Transp. Environ. 2020, 78, 102202. [Google Scholar] [CrossRef]
  23. Fearnley, N.; Currie, G.; Flügel, S.; Gregersen, F.A.; Killi, M.; Toner, J.; Wardman, M. Competition and substitution between public transport modes. Res. Transp. Econ. 2018, 69, 51–58. [Google Scholar] [CrossRef]
  24. Petit, A.; Lei, C.; Ouyang, Y. Multiline Bus Bunching Control via Vehicle Substitution. Transp. Res. B-Methodol. 2019, 126, 68–86. [Google Scholar] [CrossRef]
  25. Chalermpong, S.; Kato, H.; Thaithatkul, P.; Ratanawaraha, A.; Fillone, A.; Hoang-Tung, N.; Jittrapirom, P. Ride-hailing applications in Southeast Asia: A literature review. Int. J. Sustain. Transp. 2023, 17, 298–318. [Google Scholar] [CrossRef]
  26. Grayling, T.; Glaister, S. A New Fares Contract for London; Institute for Public Policy Research: London, UK, 2000. [Google Scholar]
  27. Castillo-Manzano, J.I.; Pozo-Barajas, R.; Trapero, J.R. Measuring the substitution effects between high speed rail and air transport in Spain. J. Transp. Geogr. 2015, 43, 59–65. [Google Scholar] [CrossRef]
  28. Bigazzi, A.; Wong, K. Electric bicycle mode substitution for driving, public transit, conventional cycling, and walking. Transp. Res. Part D Transp. Environ. 2020, 85, 102412. [Google Scholar] [CrossRef]
  29. Montgomery, B.N. Cycling trends and fate in the face of bus rapid transit: Case study of Jinan, Shandong Province, China. Transp. Res. Rec. 2010, 2193, 28–36. [Google Scholar] [CrossRef]
  30. Mitra, R.; Ziemba, R.A.; Hess, P.M. Mode substitution effect of urban cycle tracks: Case study of a downtown street in Toronto, Canada. Int. J. Sustain. Transp. 2017, 11, 248–256. [Google Scholar] [CrossRef]
  31. Sun, C.; Zhang, W.; Luo, Y.; Xu, Y. The improvement and substitution effect of transportation infrastructure on air quality: An empirical evidence from China’s rail transit construction. Energy Policy 2019, 129, 949–957. [Google Scholar] [CrossRef]
  32. Zhou, Y.; Yu, Y.; Wang, Y.; He, B.; Yang, L. Mode substitution and carbon emission impacts of electric bike sharing systems. Sustain. Cities Soc. 2023, 89, 104312. [Google Scholar] [CrossRef]
  33. Polydoropoulou, A.; Ben-Akiva, M. Combined revealed and stated preference nested logit access and mode choice model for multiple mass transit technologies. Transp. Res. Rec. 2001, 1771, 38–45. [Google Scholar] [CrossRef]
  34. Rich, J.; Mabit, S.L. A long-distance travel demand model for Europe. Eur. J. Transp. Infrastruct. Res. 2012, 12, 10–12. [Google Scholar] [CrossRef]
  35. Strano, E.; Shai, S.; Dobson, S.; Barthelemy, M. Multiplex networks in metropolitan areas: Generic features and local effects. J. R. Soc. Interface 2015, 12, 20150651. [Google Scholar] [CrossRef] [PubMed]
  36. Hu, B.; Xu, A.; Dong, X. Evaluating the Comprehensive Development Level and Coordinated Relationships of Urban Multimodal Transportation: A Case Study of China’s Major Cities. Land 2022, 11, 1949. [Google Scholar] [CrossRef]
  37. Mao, Q.; Li, N. Assessment of the impact of interdependencies on the resilience of networked critical infrastructure systems. Nat. Hazards 2018, 93, 315–337. [Google Scholar] [CrossRef]
  38. Akin, D. Model for Estimating Increased Ridership Caused by Integration of Two Urban Transit Modes: Case Study of Metro and Bus–Minibus Transit Systems, Istanbul, Turkey. Transp. Res. Rec. 2006, 1986, 162–171. [Google Scholar] [CrossRef]
  39. Cheng, X.; Long, R.; Chen, H.; Li, Q. Coupling coordination degree and spatial dynamic evolution of a regional green competitiveness system–A case study from China. Ecol. Indic. 2019, 104, 489–500. [Google Scholar] [CrossRef]
  40. Tang, Z. An integrated approach to evaluating the coupling coordination between tourism and the environment. Tour. Manag. 2015, 46, 11–19. [Google Scholar] [CrossRef]
  41. Xue, F.; He, C.; Huang, Q.; Luo, J. Coordination degree of multimodal rail transit network. J. Jilin Univ. 2021, 51, 2040–2050. [Google Scholar]
  42. Li, X.; Dai, Z.; Li, H.; Hu, J. Joint Optimization of Urban Rail Transit and Local Bus Transit:Continuous Approximation Approach. J. Transp. Syst. Eng. Inf. Technol. 2022, 22, 206–213+246. [Google Scholar]
  43. Chen, X.; Li, Y.; Shen, Q.; Ju, Y. Urban traffic networks collaborative optimization method based on two-layered complex networks. J. Comput. Appl. 2019, 39, 3079–3087. [Google Scholar]
  44. Chen, X.; Wang, Z.; Hua, Q.; Shang, W.-L.; Luo, Q.; Yu, K. AI-Empowered Speed Extraction via Port-Like Videos for Vehicular Trajectory Analysis. IEEE Trans. Intell. Transp. Syst. 2023, 24, 4541–4552. [Google Scholar] [CrossRef]
  45. Xiao, G.N.; Chen, L.; Chen, X.Q.; Jiang, C.M.; Ni, A.N.; Zhang, C.Q.; Zong, F. A Hybrid Visualization Model for Knowledge Mapping: Scientometrics, SAOM, and SAO. IEEE Trans. Intell. Transp. Syst. 2023, 10, 4–14. [Google Scholar] [CrossRef]
  46. Kong, X.Y.; Xing, W.W.; Wei, X.; Bao, P.; Zhang, J.; Lu, W. STGAT: Spatial-Temporal Graph Attention Networks for Traffic Flow Forecasting. IEEE Access 2020, 8, 134363–134372. [Google Scholar] [CrossRef]
  47. Zornoza-Gallego, C. Means of Transport and Population Distribution in Metropolitan Areas: An Evolutionary Analysis of the Valencia Metropolitan Area. Land 2022, 11, 657. [Google Scholar] [CrossRef]
  48. Wang, W.; Yang, S.; Stanley, H.E.; Gao, J. Local floods induce large-scale abrupt failures of road networks. Nat. Commun. 2019, 10, 2114. [Google Scholar] [CrossRef] [PubMed]
  49. Zhao, M.; Tong, H.; Li, B.; Duan, Y.; Li, Y.; Wang, J.; Lei, K. Analysis of Land Use Optimization of Metro Station Areas Based on Two-Way Balanced Ridership in Xi’an. Land 2022, 11, 1124. [Google Scholar] [CrossRef]
  50. Mishalani, R.G.; Goel, P.K.; Westra, A.M.; Landgraf, A.J. Modeling the relationships among urban passenger travel carbon dioxide emissions, transportation demand and supply, population density, and proxy policy variables. Transp. Res. Part D Transp. Environ. 2014, 33, 146–154. [Google Scholar] [CrossRef]
  51. Wasserman, S.; Faust, K. Social Network Analysis: Methods and Applications; Cambridge University Press: Cambridge, UK, 1994. [Google Scholar]
  52. Knoke, D. Political Networks: The Structural Perspective; Cambridge University Press: Cambridge, UK, 1990; Volume 4. [Google Scholar]
  53. Burleson-Lesser, K.; Morone, F.; Tomassone, M.S.; Makse, H.A. K-core robustness in ecological and financial networks. Sci. Rep. 2020, 10, 3357. [Google Scholar] [CrossRef]
  54. Liu, Y.; Tang, M.; Zhou, T.; Do, Y. Core-like groups result in invalidation of identifying super-spreader by k-shell decomposition. Sci. Rep. 2015, 5, 9602. [Google Scholar] [CrossRef]
  55. Ghalmane, Z.; Cherifi, C.; Cherifi, H.; Hassouni, M.E. Centrality in complex networks with overlapping community structure. Sci. Rep. 2019, 9, 10133. [Google Scholar] [CrossRef]
  56. Sun, Q.; Gao, J.; Zou, H.; Zhu, L.; Ma, F.; Song, J. The coupling mechanism and its coordination degree model of transport corridor. J. Chang. Univ. Nat. Sci. Ed. 2014, 34, 84–89. [Google Scholar]
  57. O’Sullivan, D.; Morrison, A.; Shearer, J. Using desktop GIS for the investigation of accessibility by public transport: An isochrone approach. Int. J. Geogr. Inf. Sci. 2000, 14, 85–104. [Google Scholar] [CrossRef]
  58. Malekzadeh, A.; Chung, E. A review of transit accessibility models: Challenges in developing transit accessibility models. Int. J. Sustain. Transp. 2020, 14, 733–748. [Google Scholar] [CrossRef]
  59. Murray, A.T.; Davis, R.; Stimson, R.J.; Ferreira, L. Public transportation access. Transp. Res. Part D Transp. Environ. 1998, 3, 319–328. [Google Scholar] [CrossRef]
  60. Le, J.; Ye, K. Measuring City-Level Transit Accessibility Based on the Weight of Residential Land Area: A Case of Nanning City, China. Land 2022, 11, 1468. [Google Scholar] [CrossRef]
  61. Han, D.; Yu, D.; Qiu, J. Assessing coupling interactions in a safe and just operating space for regional sustainability. Nat. Commun. 2023, 14, 1369. [Google Scholar] [CrossRef]
  62. Kim, Y.; Chen, Y.-S.; Linderman, K. Supply network disruption and resilience: A network structural perspective. J. Oper. Manag. 2015, 33, 43–59. [Google Scholar] [CrossRef]
  63. Büchel, B.; Spanninger, T.; Corman, F. Empirical dynamics of railway delay propagation identified during the large-scale Rastatt disruption. Sci. Rep. 2020, 10, 18584. [Google Scholar] [CrossRef]
  64. Yadav, N.; Chatterjee, S.; Ganguly, A.R. Resilience of urban transport network-of-networks under intense flood hazards exacerbated by targeted attacks. Sci. Rep. 2020, 10, 10350. [Google Scholar] [CrossRef] [PubMed]
Figure 1. The center area map of Shenyang.
Sustainability 16 01486 g001
Figure 2. (a) is the average population density maps at ten-minute intervals during the morning peaks (6:30–9:30) in Shenyang on 7 November 2021; (b) is the average population density maps at ten-minute intervals during the evening peaks (16:00–19:00) in Shenyang on 7 November 2021. The darker the color, the higher the average population density.
Sustainability 16 01486 g002
Figure 3. The vector layer. (a) is the composite layer of Shenyang’s geographical location map and central road network map; (b) is the composite layer of Shenyang’s central road network map and subway and bus network map.
Sustainability 16 01486 g003aSustainability 16 01486 g003b
Figure 4. (a) K-core values of stations in the subway network; (b) degree centrality values of stations in the subway network; (c) structural hole values of stations in the subway network.
Sustainability 16 01486 g004
Figure 5. (a) K-core values of stations in the bus network; (b) degree centrality values of stations in the bus network; (c) structural hole values of stations in the bus network.
Sustainability 16 01486 g005
Figure 6. Coordinated and decoupling subway stations with decoupling bus stop within 400 m of them during the morning peak.
Sustainability 16 01486 g006
Figure 7. Coordinated and decoupling subway stations with decoupling bus stop within 400 m of them during the evening peak.
Sustainability 16 01486 g007
Figure 8. Decoupling bus and subway stations with large k-core values or structural hole values.
Sustainability 16 01486 g008
Disclaimer/Publisher’s Note: The statements, opinions and data contained in all publications are solely those of the individual author(s) and contributor(s) and not of MDPI and/or the editor(s). MDPI and/or the editor(s) disclaim responsibility for any injury to people or property resulting from any ideas, methods, instructions or products referred to in the content.

