Article

Evolutionary Multi-Objective Feature Selection Algorithms on Multiple Smart Sustainable Community Indicator Datasets

by
Mubarak Saad Almutairi
College of Computer Science and Engineering, University of Hafr Al Batin, Hafar Al Batin 39923, Saudi Arabia
Sustainability 2024, 16(4), 1511; https://doi.org/10.3390/su16041511
Submission received: 24 October 2023 / Revised: 4 February 2024 / Accepted: 7 February 2024 / Published: 10 February 2024

Abstract

:
The conceptual fusion of smart city and sustainability indicators has inspired the emergence of the smart sustainable city (SSC). Given the early stage of development in this field, most SSC studies have been primarily theoretical. Notably, existing empirical studies have overlooked the crucial aspect of feature engineering in the context of SSC, despite its significance in advancing SSC initiatives. This paper introduces an approach advocating for feature subset selection to maximize prediction accuracy and minimize computational time across diverse SSC indicators encompassing socio-cultural, economic, environmental, and governance categories. The study systematically collected multiple datasets on SSC indicators, covering various themes within the SSC framework. Employing six carefully chosen multiple-objective evolutionary feature selection algorithms, the research selected feature subsets. These subsets were then utilized in modeling algorithms to predict SSC indicators. The proposal enhanced prediction accuracy for life expectancy, online shopping intentions, energy consumption, air quality, water quality, and traffic flow for a smart and sustainable city by minimizing the subset features. The findings underscore the efficacy of feature subset selection in generating minimal features, thereby enhancing both prediction accuracy and computational efficiency in the realm of SSC indicators. For researchers aiming to develop sustainable systems for real-time data monitoring within SSC, the identified subset features offer a valuable resource, negating the necessity for extensive dataset collection. The provided SSC datasets are anticipated to serve as a catalyst, inspiring researchers to embark on empirical studies that explore SSC development from diverse perspectives, ultimately contributing to a more profound understanding of the SSC dynamics.

1. Introduction

Ref. [1] asserted that the growing demands for sanitation, water, energy, education, healthcare delivery, housing, transportation, and public services are exerting pressure on limited city infrastructures. The smart city initiative has emerged as a response to ensure the optimal utilization of these constrained urban resources. This initiative equips authorities and policymakers with innovative tools to enhance municipal functions. A paradigm shift is anticipated in the future, and urbanization is expected to be a consequence of the smart city initiative [2].
The evolution of the smart city begins with Smart City 1.0, representing the first generation of smart cities primarily reliant on technology for managing urban activities, including energy optimization, healthcare, government services, the economy, mobility, and the environment. Smart City 2.0 differs from the first generation by deploying advanced high technology for city operations in a controlled manner. Smart City 3.0 takes the involvement of residents into consideration, addressing issues concerning the city and evaluating the performance of city managers [3].
The nexus between smart cities and sustainability lies in the consideration of reducing the impact of urban environmental activities, optimizing energy utilization, and innovatively designing services to address citizens’ needs [4]. The impetus behind the development of smart sustainable cities by researchers and policymakers stems from the smart city initiative [5]. This is driven by the recognition that many smart city indicators are inherently aligned with sustainable development initiatives, either directly or indirectly. Not every smart city qualifies as a smart sustainable city, but the fundamental principles guiding smart community development align with the goals of sustainable development. Consequently, combining smart city indicators with sustainable indicators enables city managers, academia, and urban planners to focus on constructing smart communities that enhance the quality of life [3]. The increasing emphasis on smart sustainable cities is justified by encompassing all the benefits of smart cities [5]. This growing interest from researchers, educators, policymakers, and businesses reflects a societal-wide commitment to sustainable city initiatives [5]. As experts concentrate on smart sustainable cities, this focus is expected to intensify in the years ahead, projecting continued development and advancement in the field [6].
The smart sustainable cities initiative has taken center stage, rapidly gaining global acceptance as a strategic response to address urban sustainability challenges, particularly in ecologically and technologically developed countries [7]. The progress in data science, driven by technological advancements, has triggered an extraordinary transformation in sustainable cities [8]. Data in smart sustainable cities are primarily generated through the operations of IoT-enabled urban systems, utilizing automatic sensing ubiquitously [9]. Ref. [8] contends that data sources in smart sustainable cities include IoT sensor devices embedded in the environment, thereby generating large volumes of datasets.
Datasets often comprise features that can extend into hundreds of millions of records [10]. The real-world environment generates data on a very large scale, resulting in complexity during processing due to the inclusion of numerous features. Among these features, many are irrelevant and redundant, offering little meaningful information to researchers and consequently impairing algorithm performance. Feature engineering plays a crucial role in eliminating redundant and irrelevant features while preserving data quality [11]. The elimination of redundant and irrelevant features through feature selection enhances algorithm performance and deepens the understanding of acquired knowledge [12]. Various approaches exist for conducting feature selection to identify the best subset of features, including random search, exhaustive search, and greedy search. However, these conventional approaches face challenges such as premature convergence and high processing costs. In contrast, nature-inspired meta-heuristic algorithms offer a promising solution to overcome these challenges in feature selection [11]. On the other hand, statistical methods for features selection exist, such as correlation-coefficient-based methods like Spearman’s and Pearson’s, mutual information, analysis of variance, etc., which fall under the category of filter-based feature selection methods [13,14]. However, these filter methods depend on assumptions and some statistical measures. They operate independently from the prediction model, and as such ignore the characteristics of the learning algorithm [15].
Almost all of the filter methods illustrated in Figure 1 were originally crafted for discrete data, and their performance may degrade when applied to continuous data, a common occurrence in many real-world problems [16]. The data used to depict the visual representation are gathered from the study conducted by [16]. However, a recent study suggested that the trend observed in the studies on evolutionary algorithms for feature selection, as depicted by [17], suggests a significant rising interest in multi-objective feature selection. Hence, employing multi-objective evolutionary algorithms is appropriate for overcoming the constraints associated with filter statistical-based methods in feature selection, as noted by [17].
Numerous datasets related to smart sustainable cities are available, yet, as far as the authors are aware, no studies have been conducted on feature selection for smart sustainable city indicators. The objective would be to identify subsets of features that could facilitate researchers in streamlining data collection processes to enhance the operations of smart sustainable cities. Currently, many solutions addressing the intersection of smart cities and sustainability are primarily theoretical. There is a critical need for practical solutions to provide guidance for real-world applications in smart sustainable cities [9].
This paper proposes employing multi-objective evolutionary algorithms to conduct feature selection on datasets encompassing various smart sustainable city indicators across socio-cultural, economic, environmental, and governance categories.
Which evolutionary algorithm can select the optimal minimum subset features with a high level of accuracy across the multiple smart sustainable city indicator datasets, cutting across socio-cultural, economic, environmental, and governance areas? Can smart sustainable city indicators be predicted with minimal subset features?
The summary of the study contributions is presented as follows:
Introduction of multiple-objective evolutionary algorithms along with learning algorithms for the dual purpose of feature selection and predicting smart sustainable city indicators to achieve predictions with minimal subset features while maximizing accuracy.
The paper found minimal optimal subset features for predicting life expectancy, shopper’s online intention, energy consumption, air quality, water quality, and traffic flow in smart sustainable city.
The study reveals that NSGA3 consistently outperforms various other multi-objective evolutionary algorithms, including Strength Pareto Evolutionary Algorithm 2 (SPEA2), Niched Pareto Genetic Algorithm (NPGA), Multi-Objective Genetic Algorithm (MOGA), Pareto Envelop-Based Selection Algorithm II (PESA2), and Multi-Objective Evolutionary Algorithms (MOEA). This superiority is observed across multiple datasets pertaining to smart sustainable city indicators in most instances.
We believe that the datasets provided in this study can motivate many researchers to conduct empirical study for developing smart sustainable city from different perspectives, leading to a better understanding of the smart sustainable city.

2. Theoretical Background to Smart Sustainable Cities

This section provides theoretical insights into the concept of the smart sustainable city before delving into related works.
In 2015, member countries of the United Nations collectively embraced the 2030 sustainable development agenda, setting the target year for accomplishing the outlined goals. A total of seventeen sustainable development goals were established, urging both developed and developing nations to collaboratively take urgent actions to meet the set objectives. The overarching aim of these sustainable development goals is to foster global peace and prosperity, with a primary focus on addressing both current challenges and future considerations. Notably, the 11th goal among these targets is “Sustainable Cities and Communities” [18]. The concept of sustainability traces back to the 18th century, rooted in the ideas of Thomas Malthus. Malthus argued that the world’s population might surpass the available human and natural resources due to overpopulation. He proposed the efficient and optimal utilization of technological advancements as a solution to support the growing population [19]. The smart city initiative is identified as having the potential to contribute significantly to the achievement of many sustainable development goals [20].
The smart city initiative is regarded as the catalyst for the emergence of 21st-century sustainability and the ideal urban model [21,22]. This study specifically focuses on the 11th goal of the UN Sustainable Development Goals—the smart sustainable city. Sustainability, in essence, entails the ability to maintain or support a process over an extended period. For instance, it involves the careful management of physical resources to prevent their depreciation, ensuring their availability for an extended duration. The three primary pillars of sustainability encompass the economic, environmental, and social aspects. To progress towards sustainability, governments worldwide actively engage in initiatives to reduce environmental impact and conserve resources. Investors are increasingly promoting and embracing sustainable investment practices, such as green investments [23]. The escalating urban population poses challenges related to resource consumption in cities, necessitating a shift in the operational paradigms of cities, particularly in terms of sustainability [21].
Addressing the issue of environmental sustainability in cities is crucial, given the challenges posed by scarce resources and environmental degradation. Cities can become cleaner and more enjoyable places to live if concerns such as pollution, efficient water management, the promotion of green building practices, and energy efficiency leading to reduced energy bills are effectively dealt with [24]. The quality of the environment, providing essential services to the ecosystem, plays a pivotal role in achieving sustainable development in urban areas. Technological symbiosis and thoughtful planning provide a roadmap for innovations within intelligent environmental planning, fostering synergy for the effective functioning of complex systems [25]. The concept of sustainability began gaining traction in academic discourse in the mid-1980s and has since evolved. Even in the United States of America, where the idea of sustainability may not enjoy widespread acceptance, there is a significant interest in promoting and applying sustainability principles [19]. Sustainable development is perceived as development that meets the current needs of citizens without adversely impacting future generations [19].
The 20th century commenced with approximately 200 million people residing in cities. Over the course of 100 years, this figure surged to 3.6 billion people, with expectations of further increases in the near future due to ongoing population growth. Concurrently, global expectations foresee continued rural-to-urban migration, contributing to a significant rise in urban populations over the next four decades [5]. Growing awareness and concern for the environment, coupled with urbanization and technological advancements, have prompted a pressing need and opportunity for the redesign, reconstruction, and innovative management of cities. The intersection of these challenges spurred the conceptualization of the smart sustainable city [5].

2.1. Smart Sustainable City Indicators

Smart sustainable indicators serve as metrics to assess the effectiveness and performance of a smart sustainable city, ultimately influencing its overall quality. Various researchers have proposed numerous smart sustainable indicators in the literature. The emergence of sustainability and sustainable development initiatives in urban planning and design since the early 1990s has given rise to the concept of urban sustainability. This approach aims to achieve a long-term policy framework that balances environmental integration, economic development, and regeneration, as well as social justice and equality in cities. Urban sustainability endeavors to create cities that foster health, livability, and environments with minimal reliance on resources such as energy and materials, while also minimizing the impact of toxic materials like waste, air and water pollution, and hazardous chemicals [7,26].
The data-centric capabilities enabled by IoT devices in smart sustainable cities are highly relevant across different domains, including transportation, power management, infrastructure monitoring, urban design and planning, environment, traffic, mobility, and energy [27,28]. Air quality is a critical concern for environmental sustainability, and real-time data collection and the analysis of air pollution play a vital role in smart city initiatives. However, the high cost associated with building and maintaining air pollution monitoring stations necessitates cost-effective approaches [9]. Different scholars propose different sets of smart sustainable city indicators. Ref. [29] suggest accessibility, flexibility, functionality, and minimum service provided. Ref. [30] propose indicators such as environment/natural resources, energy, economy, safety, health, comfort, and satisfaction. Research often emphasizes energy, environment, air quality, and water quality [31]. Ref. [3] introduces indicators that span socio-cultural, environmental, governance, and economic aspects, with twenty-eight associated categories. This unique combination of indicators provides a comprehensive guide for developing smart sustainable communities [3].

2.2. Futuristic Smart Sustainable Cities across the World

A summary of some selected smart sustainable cities projects across the world is presented in this section for the readers to appreciate the studies on smart sustainable cities and be conversant with different location of the projects. The next paragraph provides the discussion.
The Neom project in Saudi Arabia will be home to a 170 km skyscraper referred to as The Line, expected to cost USD 500 billion. There will be no cars and carbon emissions will be zero, and 20 min will be enough time to go to anywhere in the city using the high speed connected transportation system. In Malaysia, the smart sustainable city is called BiodiverCity, comprising three islands. The structures in the city will be built from purely natural materials. There will be a 4.6 km span of public beaches and parks occupying 242 hectares and a 25 km waterfront. The city is planned to be a car-free environment with autonomous public transportation systems. The Chengdu future city in China proposes transportation mobility networks, mainly with autonomous vehicles. The pedestrians can enjoy fast movement within 10 min among the zones. Telosa is a proposed city in the USA where commuting within the city to access services will take a maximum of 15 min and no fossil-fuel-powered vehicle will be allowed in the sustainable city. The Akon city in Senegal is proposed to stimulate the economy based on blockchain and cryptocurrency and to be built along the Atlantic coast of Dakar, and will be powered by renewable energy. The Woven city, Japan, under construction at the base of Mount Fuji, is proposed to be fully automated and powered by artificial intelligence technologies. The city is expected to be fully sustainable, with renewable energy and hydrogen fuel cells powering the city. The city is designed to be a bed for testing new technologies in real world environments. The floating city project in the Maldives is designed to float and be resistant to climate changes, and the city can rise with the sea level. The houses will be low-rise floating houses, hexagonal in structure [32]. The summary is presented in Table 1.

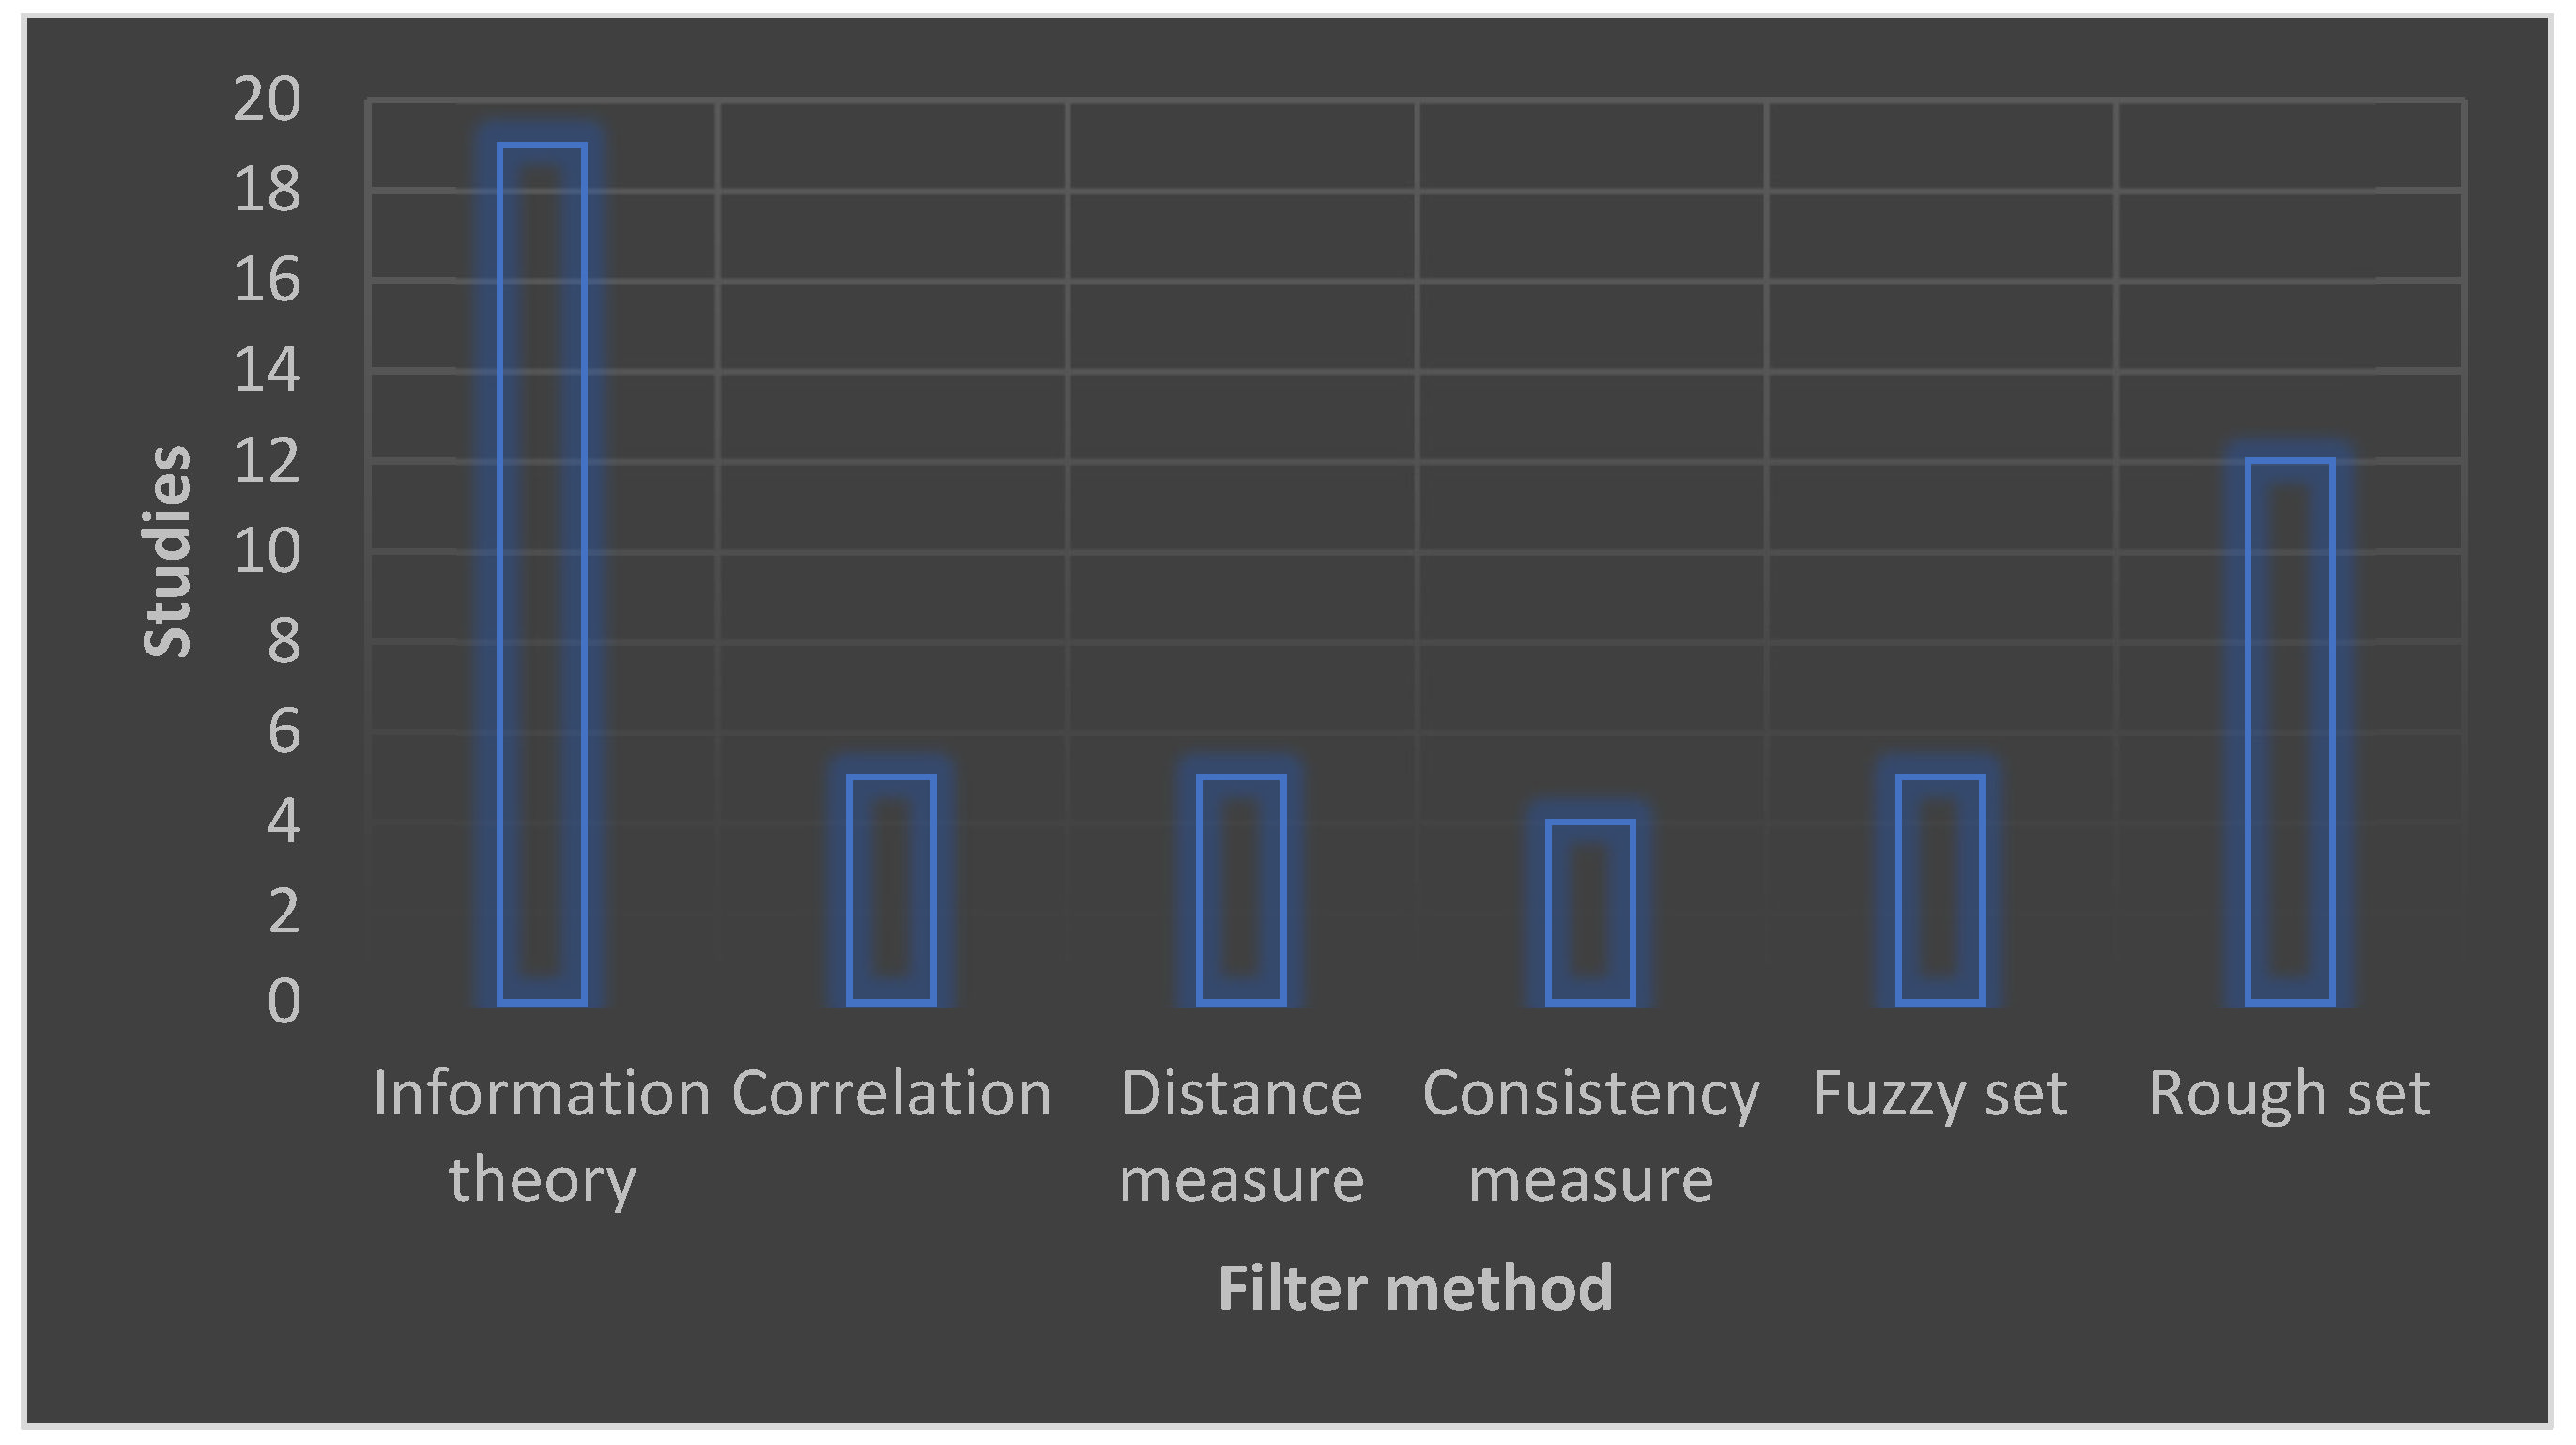
3. Related Research Works

Many research works exist for feature selection in the literature in different domains. This section mainly focuses on the empirical studies related to smart sustainable cities. However, some selected works on feature selection from different domains were presented before the paper and present empirical works related to smart sustainable cities to show the lack of feature selection works in a smart sustainable city. Literature surveys on feature selection based on evolutionary and swarm intelligent algorithms have been published in the literature (e.g., [33,34,35,36]. The published literature surveys cover different domains, with the exception of smart sustainable cities. In another study, the outlier in datasets distorts the quality of the data to the extent of producing poor quality output if the outliers were not removed from the data through feature selection methods. Bio-inspired optimization algorithms such as the GA and variants of the PSO were explored to detect outliers in order to improve the quality of the data for quality output [37]. In another study, a combined GA as the feature selection algorithm with different types of shallow machine learning algorithms like the XGBoost, decision tree, logistic regression, Gaussian Naive Bayes, extra trees, and Bernoulli Naive Bayes, among others, were used for predicting the risk of overweight and obesity, selecting Madrid as the case study for conducting the research. The GA was able to improve the performance of the shallow algorithms as a result of selecting the optimal features for the modeling of the algorithms to predict the risk of overweight and obesity [38]. Ref. [39] selected GA as the evolutionary algorithm for feature selection. The features selected by the GA were used for the modeling of random forests as the classification algorithm for the improvement of computing processes and the recognition of stress. Ref. [40] adopted the following nature-inspired meta-heuristic algorithms; Bat algorithm, particle swarm optimization, cuckoo search algorithm, dragonfly algorithm, Grey Wolf optimization, Whale optimization algorithm, moth–flame optimization algorithm, manta rays foraging optimization algorithm, and ant colony optimization were combined for the selection of features on multiple datasets. The features selected were fed into Naïve Bayes, support vector machine, and k Nearest Neighbor as the machine learning algorithms for modeling. It has been found that the combined swarm based optimization algorithms performs better than the constituent algorithms on most of the datasets. Ref. [41] proposed bi-objective GA for the selection of microbiome subsets features. It was found that the bi-objective fitness function successfully selected subset features of the bacteria that were significant, leading to an understanding of the diseases. The next section presents the empirical works on smart sustainable cities.

Review of Related Works on Intelligent Frameworks in Smart Sustainable Cities

Numerous researchers have made efforts to develop practical intelligent frameworks for smart sustainable cities, each contributing unique insights. Ref. [42] introduced an urban framework integrating intelligent search algorithms, design thinking, simulation, and citizen participation to enhance decision-making in smart sustainable cities. Ref. [43] proposed a deep learning IoT-based framework for remote health data monitoring, utilizing real-time patient healthcare data collected through medical network sensors. The embedded deep learning algorithm at the fog platform analyzed the data, offering real-time evaluations and recommendations for patients in critical conditions. Ref. [44] conducted a case study in Brazil, evaluating smart sustainability and community sense within a specific region. Through resident interviews and data analysis, the study considered public services, facilities, environment, and materials. Findings indicated a notable satisfaction rate, with over 40% expressing contentment, emphasizing the importance of community sense in smart sustainable city policies. Ref. [45] explored the impact of citizen participation on smart sustainable cities, utilizing mixed research methods including qualitative and quantitative approaches. Data collected through questionnaires and interviews were analyzed to understand the outcomes of citizen involvement. Ref. [46] presented a survey on machine learning and data mining frameworks for classifying network traffic in smart sustainable cities. The study addressed dataset complexity and proposed future directions for research in the context of smart sustainable cities. The role of smart cities in contributing to smart sustainable communities, aligned with the United Nations Sustainable Development Goals, was discussed by [31]. Ref. [47] delved into the roles of geoinformation and computing in creating smart sustainable communities, using Saudi Arabia as a case study. The study utilized various sources, including government websites, newspapers, literature, and official documents, to develop a framework for implementing geoinformation and computing in smart sustainable cities. Ref. [48] provided guidelines for developing countries to attain smart sustainability, using Ghana as a case study. Refs. [27,28] proposed a theoretical framework for smart sustainable city development, considering the built environment, disciplinary, discursive, and synergy dimensions. Another theoretical framework presented by [27,28] offers potential for replication, testing, and evaluation, serving as a practical guide for analytical insights in future smart sustainable cities. Ref. [49] explored theoretical aspects of sustainable cities in three European cities—Florence, Helsinki, and Cagliari—before identifying pollution issues. Ref. [6] conducted a survey on ride-sharing in smart sustainable cities using nature-inspired algorithms, addressing challenges and discussing the significance of such algorithms in this context. Ref. [50] proposed deep auto-encoders based on fuzzy c-means for analyzing research trends in smart sustainable cities across dimensions like transportation, environment, human capital, welfare, e-governance, technology, and energy. Ref. [51] conducted a comparative analysis of smart sustainability city indicators against conceptual urban focuses, domains of application, and indicator types, revealing distinctions between standard indicators for implementation evaluation and sustainability standards focused on assessment. Ref. [52] highlighted growth issues in smart cities for sustainability, including energy aspects, ecosystem preservation, waste management, citizen participation, privacy, infrastructure, and discouraging car usage. Ref. [8] proposed a framework spanning social, economic, and environmental dimensions to balance sustainability considerations, emphasizing data-driven smart city components. Finally, ref. [53] studied factors contributing to smart sustainable cities, focusing on improvements in energy efficiency, public services, and transportation. Ref. [54] devised a system employing parsimonious preference information and spherical fuzzy to offer sustainable and efficient solutions for improving the public bus transport system. Ref. [55] utilized ANN to forecast solar radiation in an urban environment, contributing to sustainable city planning. The results emphasized the crucial link between solar radiation and sustainable urban development, providing urban planners and researchers with valuable strategies to enhance energy efficiency and ecological balance. Ref. [56] conducted a thorough review, delving into the crucial role of intelligent systems and expert knowledge in propelling the evolution of smart homes towards smart sustainable cities. Through meticulous analysis and the consolidation of various contemporary techniques applied in smart homes, this paper makes significant contributions to the convergence of urban development and technological innovation. Ref. [57] provided insights into the advancement of artificial intelligence in the field of sustainable energy management. It is evident from the preceding paragraphs that empirical works focused on constructing intelligent frameworks to enhance smart sustainable cities are gaining popularity within the research community. However, a noticeable gap in the literature pertains to the absence of feature selection studies within the context of smart sustainable cities. This gap is noteworthy considering the importance of feature engineering in machine learning, and particularly in dimension reduction, optimizing computational time, and enhancing accuracy.

4. Feature Selection Algorithms

Problems in real-world scenarios have multiple objectives competing simultaneously because of the conflicting nature of the objectives. In this type of multi-objective optimization problem, the solutions are not one but a set of solutions commonly referred to as the Pareto front, as it is a multi-objective space. The multi-objective problems are suited to solving using evolutionary algorithms because of their population characteristics that uses natural selection as the search engine. The evolutionary algorithms’ population-based characteristic allows approximate Pareto front to be achieved at a single run. The multi-objective evolutionary algorithms have been applied for solving multi-objective problems. The evolutionary algorithms have three similar characteristics, namely convergence, uniformity, and extensity [58]. This study uses evolutionary algorithms for solving multi-objective problems for multi-objective feature selection on smart sustainable city indicator multiple datasets. The selected evolutionary algorithms are as follows: SPEA2, NPGA, MOGA, PESA2, MOEA, and NSGA3. The next section discusses the theoretical bases of each selected algorithm.

4.1. Non-Dominated Sorted Genetic Algorithm III

The operation of NSGA3 typically starts with the description of the set of reference. The current population of the parent of a generation creates offspring using the genetic operators. The population is sorted out to find non-domination at the different level. Not all the population can be accommodated to be saved in the last front, while other members will be rejected. Thus, the selected members move to the next generation, whereas other members are selected from the last front. Systematic analysis of the set members is used for selection with respect to the reference point. Normalization is typically used for the identification of range objective values and the reference point supplied, whereby the zero vector becomes the normalized point for the sets. Each of the members of the set is associated with the point reference according to the proximity of the reference line linking the normal point and the reference point. It has been proven that the method normally helps in the determination of the number and the population indices for the associated members with reference points. As such, the niching method is used in selecting the population members that are not represented in the set. The lowest amount of association in the reference points searches for the point that is associated with it. The population keeps increasing by continuously adding members one by one until the population is filled [59].

4.2. Pareto-Envelop-Based Selection Algorithm II

The PESA2 is an evolutionary multi-objective algorithm widely used in different studies. One of the main attractive features of the PESA2 is the grid-based fitness strategy assignment in the environmental selection. The PESA2 use the principles of the standard evolutionary algorithms in maintaining both internal and external population; that is, fixed size and non-fixed size, respectively, after which the new solutions are stored in the internal population after been generated from the archives using the variation operations. The set of non-dominated solutions found during the search is contained in the archive. Diversity in the PESA2 is created by introducing the grid division objective space. In the two crucial stages of the evolutionary multi-objective optimization algorithms, namely, mating and environmental selections, the density of the hyperbox (the number of solutions in the hyperbox) is used for differentiating the solutions. The mating selection in the PESA2 is executed in a region-based manner in place of individual as it is the typical process in the conventional PESA and in most of the other evolutionary multi-objective optimization algorithms. This means that the hyperbox is selected first, before the resulting individual is selected randomly for the genetic operations. Less crowded hyperboxes contribute more individuals compared to the highly crowded hyperboxes. The grid environment is updated by the environmental selection process where the internal population in the set of archives is inserted one after the other. A candidate that is non-dominated within the internal population and with no current member dominating it may go into the archive. The archive is adjusted and grid environment is executed once the candidate has entered the archive [60]. The PESA2 is used in the supply chain [61].

4.3. Multi-Objective Genetic Algorithm

The MOGA starts operation by generating an initial population comprising a number of strings in every population. The values of the objective functions are computed for each of the generated strings. The Pareto optimal solutions are updated tentatively. Random weight is used for the computation of each of the strings. A pair of strings is selected from the current population using selection probability. This stage is repeated for half of the strings in the current population pair selected. Crossover is applied on each of the selected pair of strings to generate two new strings. The new population is generated by the crossover operations. Predefined mutation probability is applied on each of the strings generated by the crossover. From the set of the population, the elicit is randomly removed and replaced with the set of tentative Pareto optimal solutions. If the predefined stoppage criterion is satisfied, the MOGA will stop running; otherwise, the algorithm keeps running repeatedly from the initial stage [62]. The MOGA has been applied to solve optimization problems in supply chains [63], machine processes [64], and fuel [65].

4.4. Niched Pareto Genetic Algorithm

The NPGA is developed by introducing speciation with the theory of spatially searching space ordered with the intention of introducing multi-objectivity by using the Pareto domination ranking and fitness. The exploitation of the whole Pareto set of optimal solutions is to maximize the pressure selection that is induced based on the tournament competitions and Pareto ranking. The diversity of the NPGA is maintained by fitness sharing. To deviate from the challenge of finding while maintaining the tradeoff curve during the process of optimization, a sharing function is added. This approach is reliable for solving multi-objective problems of its adaptive ability to search non-linear search space and discontinue search space characteristics. The search does not rely on the continuous first and the second derivatives. The NPGA is extended by adding Pareto domination ranking and updating fitness sharing continuously. These two operators added to the NPGA alter the selection mechanism in the traditional genetic algorithm by a partial ordering of the population while maintaining diversification in the population via consecutive generations. The two principal genetic pressures controlling the evolution stages in the algorithm were created by the tournament competition and fitness sharing. The tournament size controls the selection pressure and disseminates it towards the optimum frontier. Greater selection pressure is induced by a large-sized tournament. The search conducted by the NPGA is contingent on the population size and selection level pressure that is used. The selection process in the NPGA is initiated by each individual in the population, assigned to the rank that is equal to the Pareto dominance as experience [66]. The NPGA has been applied in feature selection [67,68].

4.5. Strength Pareto Evolutionary Algorithm 2

The SPEA2 has been introduced to improve the performance of the Strength Pareto evolutionary algorithm by introducing an improved fitness assignment scheme that takes into account the number of individuals dominated and the once-dominated. The SPEA2 incorporated the nearest neighbor density estimation technique to give room for a more precise guide on the searching process. The preservation of the boundary solution in SPEA2 is guaranteed by the introduction of new archive truncation methods. The stages involved in running the SPEA2 are given as follows: at the initialization stage, the initial population is generated and the empty archive is created. At the stage of fitness assignment, the fitness value of the individual is computed. The non-dominated individuals are copied at the environmental selection stage. The algorithm stops running if it has satisfied the stoppage criterion. Binary tournament selection is performed to fill the mating pool at the mating selection stage. Experimental comparative study indicates that the SPEA2 has improved the performance of the basic Strength Pareto evolutionary algorithm and outperformed the Pareto envelop-based selection algorithm and non-dominating sorting genetic algorithm II [69]. The SPEA2 has been applied for feature selection with success. In the study conducted by [70], the SPEA2 filter-based feature selection approach was used for feature selection and prediction accuracy. It was found to perform better with the feature selection compared to the prediction without any feature selection. Ref. [71] used SPEA for gene feature selection and recorded a good performance. The SPEA2 has been applied to solve problems in (but not limited to) the following: machine learning [72], image processing [73], optimization [74], and selection [75].

5. Formulation of the Optimization Problem
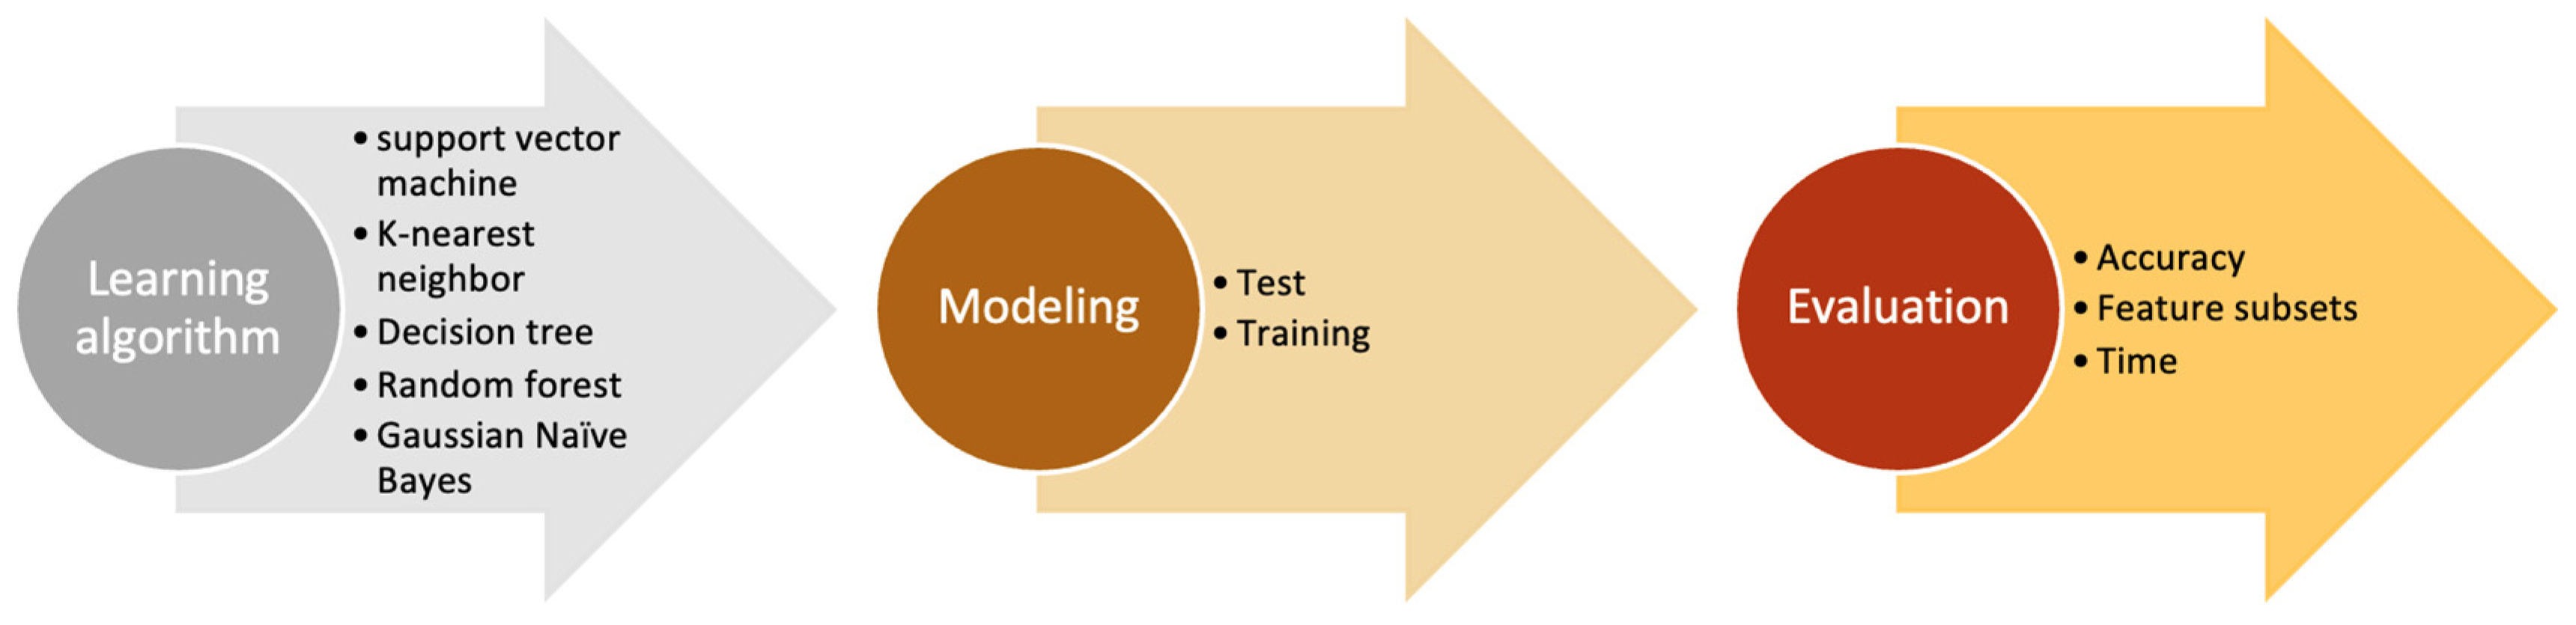
In essence, feature selection is a complex task with multiple objectives. Its primary goals are to enhance prediction performance by maximizing accuracy and simultaneously reduce the number of features. These two objectives often clash with each other, presenting a tradeoff that necessitates optimal decision-making. Approaching feature selection as a multi-objective problem enables the identification of a range of non-dominated feature subsets, catering to different requirements in real-world applications [76]. The approach in this paper employs multi-objective evolutionary algorithms and learning algorithms. In the context of smart sustainable city feature selection, multi-objective evolutionary algorithms, and learning algorithms, these objectives include maximizing accuracy and minimizing the number of features selected for any of the six smart sustainable city indicator datasets. The feature selection is to be performed by the evolutionary algorithms before inputting to the learning algorithms.
First objective: Maximizing accuracy.
Second objective: Minimization of feature subsets.
The binary decision variables: x i ∈ {0, 1} for i = 1, 2, ..., N
Minimization:
i = 1 N x i M a x F
i β x i γ
where β is the significant feature in the dataset, γ is the minimum significant features, MaxF is the maximum number of features in the smart sustainable city indicators datasets, N is the total number of features in the dataset, and x i is the binary decision variable indicating the selection of the feature with 1 or 0 indicating non-selection of a feature.
Maximize accuracy:
M a x i m i z e   f x = a c c u r a c y
Subject to the following constraint.
Minimize:
i = 1 N x i
where is the parameter that balances between the accuracy and the feature selection subsets and measures the significance of the features selected. The formulation reflects the multi-objectives in view of the fact that the accuracy is maximizing penalizing the inputting of redundant features or unnecessary features in the learning algorithms. The adjusting allows the control of the feature selection subsets side by side with the accuracy.

6. Methodology

6.1. Data Collection

The datasets used in this study were collected based on the indicators of the smart sustainable city, as described in Section 2.1, to give a mixed of representation, as already discussed in the preceding section. The datasets on life expectancy, air quality, energy, online shopping intention, traffic flow, and water quality were collected from different sources. The summary of the dataset descriptions is presented in Table 2.

6.2. The Proposed Framework for the Study

The six smart sustainable city indicator datasets displayed in Table 2 were utilized in the experiment, showcasing their diverse features and instances that aligned with socio-cultural, economic, environmental, and governance categories, suitable as representation of the indicators for addressing evolutionary algorithms. Each of the six datasets were randomly partitioned into 70% for training and 30% for testing. Each of the evolutionary algorithms—SPEA2, NPGA, MOGA, PESA2, MOEA, and NSGA3—was trained with the 70% dataset portion. Post-training, the selected feature subsets were evaluated on the remaining 30% test dataset for each of the six datasets, computing the accuracy using the specified formula:
A c c u r a c y = T P + T N T P + T N + F P + F N
Here, TP denotes true positives, TN denotes true negatives, FP denotes false positives, and FN denotes false negatives. All six algorithms, namely SPEA2, NPGA, MOGA, PESA2, MOEA, and NSGA3, employed a wrapper-based approach. This approach necessitates a learning algorithm to train each of the mentioned evolutionary algorithms for evaluating the feature subsets they selected. For the evaluation of the feature subsets, the following learning algorithms were employed: Support Vector Machine (SVM), Artificial Neural Network (ANN), k-Nearest Neighbors (KNN), Random Forest (RFC), and Gaussian Naïve Bayes (GNB). The feature subsets generated by each evolutionary algorithm for the six datasets served as inputs for the respective learning algorithms. The experiments were conducted on the hardware platform featuring the Mac M2 chip, which includes an 8-core CPU, 10 cores, and GPU with a 16-core Neural engine. The chosen software framework was Anaconda Python (2022.05). The values for hyper-parameter settings were adopted from the existing literature, as they are commonly employed in similar contexts. The algorithm hyper-parameters for each evolutionary algorithm are detailed as follows: SPEA2: Population Size (N): 150; Maximum Number of Generations (GM): 500; Tournament Size (T): 3 [78]; Archive Size (K): 2 N; Crossover Rate (CR): 1; Mutation Rate (MR): 0.01; Archive Truncation (Epsilon): 3; [79]. NPGA: N: 150; MR: 0.01; Niche Radius (σ): 150; GM: 500 [80]; CR: 1; T: 3 [81]. MOGA: N: 200; CR: 1; MR: 0.1; T: 4; Elitism: 2; GM: 500 [64]. PESA2: N: 150; MR: 0.01; T: 3; Epsilon: 4 [82]; K: 2 N; GM: 500 [61]; CR: 0.8 [60]. NSGA3: N: 200; CR: 0.9; MR: 0.2; T: 4; GM: 500 [83]. The individual’s representation is encoded using an n-binary string, a conventional method employed in GA for feature selection. Here, n denotes the number of features present in the datasets outlined in Table 2 and varies across the six datasets. A binary value of “1” signifies the selection of a feature in the subset, while “0” indicates its exclusion.
In the experiment, each of the algorithms was run on each of the six smart sustainable city indicator datasets and all were multi-objective feature selection algorithms for evaluating the group of features contained in each of the datasets concurrently. Each of the evolutionary multi-objective algorithms was used for the selection of the feature subsets in each smart sustainable city dataset to produce the optimal subset, accuracy, and convergence time. In the experiment procedure, the study minimized the number of informative features with a significant contribution, and maximized accuracy on each of the dataset because of the multi-objective nature of the study.
The SPEA2, NPGA, MOGA, PESA2, MOEA, and NSGA3 were run on each dataset to find out the optimal algorithm for each dataset as algorithm performance varies across multiple datasets. The stepwise refinement feature selection method was used together with each of the evolutionary algorithms for feature selection. For accuracy, the feature subsets selected by the SPEA2, NPGA, MOGA, PESA2, and NSGA3, as presented in Figure 2, were fed into the learning algorithms, as shown in Figure 3. The learning algorithms were responsible for the classification/prediction based on the feature subsets generated by the feature selection algorithms. The complete graphical representation of the procedure for the complete methodology is presented in Figure 2 and Figure 3.

7. Result and Discussion

In this section, the results obtained from the implementation of the framework are provided and discussed for better understanding by the reader. Distinct feature subsets and corresponding accuracy results were attained for each of the six datasets. The outcomes from the multi-objective algorithms were non-dominated across each dataset. The presentation of results is organized into six tables, Table 3, Table 4, Table 5, Table 6, Table 7 and Table 8, each corresponding to a specific combination of an evolutionary algorithm and a learning algorithm, as all six evolutionary algorithms were executed on each of the six datasets. Table 3, Table 4, Table 5, Table 6, Table 7 and Table 8 consist of four columns, each with identical heading labels. The initial column comprises a list of evolutionary algorithms applied for feature selection. The second column specifies the learning algorithm employed for predicting the smart sustainable city indicator, such as air quality. The third column displays the feature subsets selected by the evolutionary algorithm and the corresponding prediction accuracy of the smart city sustainable indicator (e.g., air quality) enclosed in brackets. Finally, the fourth column denotes the accuracy of a smart sustainable city indicator without feature selection, indicating the use of all features to predict the indicator, for instance air quality. The bold values in Table 3, Table 4, Table 5, Table 6, Table 7, Table 8 and Table 9 indicate superiority. The accuracy and feature subsets selected by each of the algorithm is presented, as well as the accuracy of the complete features. Table 3 indicates that NSGA3 performed the best among all the algorithms in terms of accuracy and the minimal number of feature subsets required to predict air quality in smart sustainable cities. It is clearly shown that feature subsets produce better performance compared to the complete/full features of air quality.
It is found in Table 4 that NSGA3 outperformed other algorithms in accuracy. The NSGA3 was able to reduce the 20 features for determining water quality to 7 feature subsets.
Table 5 presents the feature subsets for life expectancy in smart sustainable cities selected by the evolutionary algorithms and the prediction accuracy of c16. Out of the evolutionary algorithms applied to select the feature subsets and predict c16, it was found that the NSGA3 performed better than the compared algorithms. It had the best accuracy. All the c16 features are not required to predict c16 in smart sustainable cities.
Table 6 presents the results of predicting traffic volume in smart sustainable cities. It is shown that NSGA3 has the best performance with ANN among the algorithms compared in the study. The performance supersedes the algorithm that uses all the features without selection for the prediction of traffic volume in the smart sustainable city. It is observed that MOEA is the second best in terms of the performance after NSGA3. Both MOEA and NSGA3 algorithms recorded the best performance with minimal feature subsets with ANN as the learning algorithm.
Table 7 presents the results of predicting online shopping intention in smart sustainable cities. It is shown that NSGA3 has the best performance with SVM among the algorithms compared. The performance supersedes the algorithm that uses all the features without selection for the prediction of online shoppers’ intention in the smart sustainable city, as observed in Table 3, Table 4, Table 5 and Table 6. It is observed that MOEA is the second best in terms of performance, after NSGA3. The MOEA recorded its best performance with SVM similar to the NSGA3 algorithm, which recorded its best performance with minimal feature subsets with SVM as the learning algorithm.
As presented in Table 8, it is shown that NSGA3 has the best performance with ANN compared to the other algorithms. It outperformed the algorithms that used all the features without selection for the prediction of energy consumption in smart sustainable cities, as observed in previous results. It can be observed that the MOEA is the second best in terms of the performance after NSGA3. The MOEA recorded its best performance with SVM, contrary to the NSGA3 algorithm, which recorded its best performance with minimal feature subsets with ANN as the learning algorithm.

7.1. Computational Time

The computational time required by each of the algorithms to converge to the optimum solutions for each dataset are recorded in Table 9. It can be observed that the computational time varies across the six different datasets. However, this phenomenon is expected because the datasets have different characteristics, as can be observed in Table 2. For the air quality dataset, it can be observed that the fastest learning algorithm was SVM with the evolutionary algorithm as MOEA, followed by GNB of the NSGA3. It can be observed that for the life expectancy dataset, the MOEA with SVM is the fastest algorithm to converge to optimum solutions, followed by the NSGA3 with SVM, in predicting life expectancy. The NSGA3 recorded the lowest convergence time, with three different learning algorithms, SVM, KNN, and GNB, on the traffic volume dataset, followed by the MOEA with two different learning algorithms, SVM and KNN. For the online shopping intention datasets, it was found that the NSGA3 converged to the optimum solutions in predicting shoppers’ online shopping intentions faster compared to the other algorithms, followed by the MOEA. SVM is the learning algorithm that recorded the fastest time in both NSGA3 and MOEA evolutionary feature selection algorithms. The performance of the NSGA3 on the energy consumption dataset indicates that the NSGA3 with learning algorithms SVM and GNB converges faster compared to the other evolutionary algorithms in predicting energy consumption. For the water quality dataset, the NSGA3 with SVM was observed to be faster than the compared algorithms in predicting water quality in smart sustainable cities. Generally, it is observed that in all the categories, in most cases SVM stood out as the fastest algorithm compared to the competitive algorithms. Only in a few cases, GND and one case of KNN, was a better performance found than the SVM in terms of computational speed.

7.2. Discussion

This study presents an attempt at an empirical study in smart sustainable cities to enable researchers to gain a better understanding of different smart sustainable city indicators, with multiple numbers of datasets cutting across different sustainability themes such as c16, air quality, energy, online shopping intention, traffic, and water quality. It was found that evolutionary algorithms can be used in selecting feature subsets across multiple datasets before feeding into the learning algorithms for modelling to predict a smart sustainable city indicator.
The study reveals that an intelligent model can effectively predict life expectancy, air quality, energy consumption, online shopping intention, traffic flow, and water quality in a smart sustainable city. This prediction is achieved with minimal feature subsets, ensuring a high prediction accuracy and fast computational times. Notably, the NSGA3 and SVM outperformed other compared feature selection evolutionary algorithms in this context. The research findings indicate that for predicting air quality in a smart sustainable city, only three feature subsets are necessary, eliminating the need for collecting an extensive array of features that could strain computing resources. Similarly, the prediction of water quality in a smart sustainable city can be accomplished with seven feature subsets, discarding less significant information. For life expectancy prediction, a dataset with ten feature subsets proved sufficient. In the case of predicting traffic flow in a smart sustainable city, the study identifies that four feature subsets are optimal. Online shopping intention, a crucial indicator in smart sustainable cities, can be predicted with a model incorporating 17 feature subsets instead of 18. This implies that almost all features for predicting online shopping intention in a smart sustainable city are significant, except for one. For energy consumption prediction in a smart sustainable city, the study concludes that seven feature subsets from the dataset are suitable. In essence, the evolutionary algorithms employed successfully reduce the number of features required to model algorithms for predicting smart sustainable city indicators.
This study has successfully suggested that feature subsets to be used in the future to carry out a study about life expectancy, air quality, energy, online shopping, traffic, and water quality in smart sustainable city. The number of the feature subsets in each of the domains was found to be reduced to a minimal number. The study has indicated that many of the features were not relevant in the study because the accuracy increases as the irrelevant/redundant features were removed by the evolutionary feature selection algorithms. In each of the domains studied in this research, researchers can have the opportunity to better understand the significant feature subsets required to perform analysis and develop models for practical implementation in real-world smart sustainable city projects.
The use of smart sustainable city data can help in systems for smart sustainable city indicators. The systems in the smart sustainable city can use the real-time data for optimizing energy consumption, measuring life expectancy, optimizing the use of quality water, planning the purification of air, planning effective transportation systems, and understanding the behavior of citizens towards intentions to shop online.
Researchers intending to develop systems in smart sustainable cities for monitoring real-time data can use the feature subsets as found in this study to develop the system without the need to collect large amounts of data. As such, this can save human efforts, energy, and computational costs. Therefore, this research can guide researchers, policy makers, educationists, and practitioners in the future to avoid the collection of high volumes of data containing redundant/irrelevant features that can consume computing resources unnecessarily in developing real-time systems in smart sustainable cities.
We believe that the datasets provided in this study can motivate many researchers to conduct empirical studies for developing smart sustainable cities from different perspectives, leading to a better understanding of the smart sustainable city. The concept of smart sustainable cities is emerging, requiring extensive study to provide insight into the concept.
Suggestions for future works: the self-adaptive fast fireworks algorithm has demonstrated its effectiveness in optimizing policy ANN for reinforcement learning, highlighting its potential in addressing real-world problems. Consequently, there is an intriguing opportunity to explore this algorithm for the creation of a smart sustainable Internet of Vehicles collision protection alarm device, to alert drivers in advance of potential collisions. This can then be compared with both exact and heuristic safety methods outlined in [84]. Moreover, the data pertaining to scheduling problems can be depicted in a graph format. Subsequently, one can employ the adaptive Polyploid memetic algorithm by [85] to investigate the utilization of graph neural networks in crafting intelligent and sustainable scheduling decision systems. The diffused memetic optimizer for reactive berth allocation introduced in [86] demonstrates promising performance. Therefore, this study suggested its potential exploration for feature engineering in future smart sustainable applications. An intriguing prospect lies in examining the methodologies employed in this research in contrast to the ant-based generation constructive hyper-heuristic proposed by [87] for achieving sustainable solutions in the optimization of renewable energy.

8. Conclusions

The paper proposes an empirical study focusing on selecting features from multiple smart sustainable city datasets to predict life expectancy, air quality, energy consumption, online shopping intention, traffic flow, and water quality. Multiple smart sustainable city indicator datasets were gathered for analysis. The findings revealed that NSGA3 consistently outperformed SPEA2, NPGA, MOGA, PESA2, and MOEA across most cases. This research can serve as a guide for researchers, policymakers, educators, and practitioners. Researchers can use the study to avoid collecting large volumes of data, thereby conserving computing resources, efforts, and energy, especially in a situation where there are constrained resources. The datasets presented in this study can inspire practical frameworks for developing smart sustainable city solutions from diverse perspectives. Looking to the future, there is a compelling opportunity for investigating the efficacy and effectiveness of various optimization algorithms in feature engineering within the context of a smart sustainable city. This includes but is not limited to multi-objective algorithms like HV, IDG, hybrid heuristics, and metaheuristics, adaptive algorithms, self-adaptive algorithms, island algorithms, polyploid algorithms, and hyperheuristics. Subsequently, subjecting these optimization algorithms to comparative analysis within the context of smart sustainable cities will provide valuable insights.

Funding

This research received no external funding.

Institutional Review Board Statement

Not applicable.

Informed Consent Statement

Not applicable.

Data Availability Statement

Data is contained within the article.

Conflicts of Interest

The author declares no conflict of interest.

References

  1. Estevez, E.; Lopes, N.; Janowski, T. Smart Sustainable Cities: Reconnaissance Study. 2016. Available online: http://collections.unu.edu/eserv/UNU:5825/Smart_Sustainable_Cities_v2final.pdf (accessed on 17 June 2023).
  2. Law, K.H.; Lynch, J.P. Smart city: Technologies and challenges. IT Prof. 2019, 21, 46–51. [Google Scholar] [CrossRef]
  3. Pira, M. A novel taxonomy of smart sustainable city indicators. Humanit. Soc. Sci. Commun. 2021, 8, 197. [Google Scholar] [CrossRef]
  4. Belli, L.; Cilfone, A.; Davoli, L.; Ferrari, G.; Adorni, P.; Di Nocera, F.; Dall’Olio, A.; Pellegrini, C.; Mordacci, M.; Bertolotti, E. IoT-enabled smart sustainable cities: Challenges and approaches. Smart Cities 2020, 3, 1039–1071. [Google Scholar] [CrossRef]
  5. Höjer, M.; Wangel, J. Smart sustainable cities: Definition and challenges. In ICT Innovations for Sustainability; Springer International Publishing: Cham, Switzerland, 2015; pp. 333–349. [Google Scholar]
  6. Martins, L.D.C.; de la Torre, R.; Corlu, C.G.; Juan, A.A.; Masmoudi, M.A. Optimizing ride-sharing operations in smart sustainable cities: Challenges and the need for agile algorithms. Comput. Ind. Eng. 2021, 153, 107080. [Google Scholar] [CrossRef]
  7. Bibri, S.E.; Krogstie, J. Smart sustainable cities of the future: An extensive interdisciplinary literature review. Sustain. Cities Soc. 2017, 31, 183–212. [Google Scholar] [CrossRef]
  8. Bibri, S.E. Data-driven smart sustainable cities of the future: An evidence synthesis approach to a comprehensive state-of-the-art literature review. Sustain. Futures 2021, 3, 100047. [Google Scholar] [CrossRef]
  9. Hashem, I.A.T.; Usmani, R.S.A.; Almutairi, M.S.; Ibrahim, A.O.; Zakari, A.; Alotaibi, F.; Alhashmi, S.M.; Chiroma, H. Urban Computing for Sustainable Smart Cities: Recent Advances, Taxonomy, and Open Research Challenges. Sustainability 2023, 15, 3916. [Google Scholar] [CrossRef]
  10. Krishnaveni, N.; Radha, V. Feature selection algorithms for data mining classification: A survey. Indian J. Sci. Technol. 2019, 12, 2–11. [Google Scholar] [CrossRef]
  11. Agrawal, P.; Abutarboush, H.F.; Ganesh, T.; Mohamed, A.W. Metaheuristic Algorithms on Feature Selection: A Survey of One Decade of Research (2009–2019). IEEE Access 2021, 9, 26766–26791. [Google Scholar] [CrossRef]
  12. Khalid, S.; Khalil, T.; Nasreen, S. A survey of feature selection and feature extraction techniques in machine learning. In Proceedings of the 2014 Science and Information Conference, London, UK, 27–29 August 2014; pp. 372–378. [Google Scholar]
  13. Bhuyan, H.K.; Chakraborty, C.; Pani, S.K.; Ravi, V. Feature and subfeature selection for classification using correlation coefficient and fuzzy model. IEEE Trans. Eng. Manag. 2021, 70, 1655–1669. [Google Scholar] [CrossRef]
  14. Savić, M.; Kurbalija, V.; Ivanović, M.; Bosnić, Z. A feature selection method based on feature correlation networks. In Model and Data Engineering: 7th International Conference, MEDI 2017, Barcelona, Spain, 4–6 October 2017; Proceedings 7; Springer International Publishing: Berlin/Heidelberg, Germany, 2017; pp. 248–261. [Google Scholar]
  15. Freeman, C.; Kulić, D.; Basir, O. An evaluation of classifier-specific filter measure performance for feature selection. Pattern Recognit. 2015, 48, 1812–1826. [Google Scholar] [CrossRef]
  16. Xue, B.; Zhang, M.; Browne, W.N.; Yao, X. A survey on evolutionary computation approaches to feature selection. IEEE Trans. Evol. Comput. 2015, 20, 606–626. [Google Scholar] [CrossRef]
  17. Jiao, R.; Nguyen, B.H.; Xue, B.; Zhang, M. A survey on evolutionary multiobjective feature selection in classification: Approaches, applications, and challenges. IEEE Trans. Evol. Comput. 2023; early access. [Google Scholar] [CrossRef]
  18. United Nations. Sustainable Development Goals. 2018. Available online: https://www.un.org/sustainabledevelopment/sustainable-development-goals (accessed on 13 September 2023).
  19. Portney, K.E. Sustainability; MIT Press: Cambridge, MA, USA, 2015. [Google Scholar]
  20. Corbett, J.; Mellouli, S. Winning the SDG battle in cities: How an integrated information ecosystem can contribute to the achievement of the 2030 sustainable development goals. Inf. Syst. J. 2017, 27, 427–461. [Google Scholar] [CrossRef]
  21. Toli, A.M.; Murtagh, N. The concept of sustainability in smart city definitions. Front. Built Environ. 2020, 6, 77. [Google Scholar] [CrossRef]
  22. Yigitcanlar, T.; Kamruzzaman, M. Does smart city policy lead to sustainability of cities? Land Use Policy 2018, 73, 49–58. [Google Scholar] [CrossRef]
  23. Mollenkamp, D.T. What Is Sustainability? How Sustainabilities Work, Benefits, and Example. 2023. Available online: https://www.investopedia.com/terms/s/sustainability.asp (accessed on 21 October 2023).
  24. Barrionuevo, J.M.; Berrone, P.; Ricart, J.E. Smart cities, sustainable progress. IESE Insight 2012, 14, 50–57. [Google Scholar] [CrossRef]
  25. Ramirez Lopez, L.J.; Grijalba Castro, A.I. Sustainability and resilience in smart city planning: A review. Sustainability 2020, 13, 181. [Google Scholar] [CrossRef]
  26. Bibri, S.E. ICT for Sustainable Urban Development in the European Information Society: A Discursive Investigation of Energy Efficiency Technology; School of Culture and Society, Malmö University: Malmö, Sweden, 2013. [Google Scholar]
  27. Bibri, S.E. A foundational framework for smart sustainable city development: Theoretical, disciplinary, and discursive dimensions and their synergies. Sustain. Cities Soc. 2018, 38, 758–794. [Google Scholar] [CrossRef]
  28. Bibri, S.E. The IoT for smart sustainable cities of the future: An analytical framework for sensor-based big data applications for environmental sustainability. Sustain. Cities Soc. 2018, 38, 230–253. [Google Scholar] [CrossRef]
  29. Garau, C.; Pavan, V.M. Evaluating urban quality: Indicators and assessment tools for smart sustainable cities. Sustainability 2018, 10, 575. [Google Scholar] [CrossRef]
  30. Hara, M.; Nagao, T.; Hannoe, S.; Nakamura, J. New key performance indicators for a smart sustainable city. Sustainability 2016, 8, 206. [Google Scholar] [CrossRef]
  31. Ismagiloiva, E.; Hughes, L.; Rana, N.; Dwivedi, Y. Role of smart cities in creating sustainable cities and communities: A systematic literature review. In ICT Unbounded, Social Impact of Bright ICT Adoption: IFIP WG 8.6 International Conference on Transfer and Diffusion of IT, TDIT 2019, Accra, Ghana, 21–22 June 2019, Proceedings; Springer International Publishing: Berlin/Heidelberg, Germany, 2019; pp. 311–324. [Google Scholar]
  32. Jalal, M. 12 Futuristic Cities Being Built around the World, from Saudi Arabia to China. 2022. Available online: https://thenationalnews.com/arts-culture/2022/08/02/12-futuristic-cities-being-built-around-the-worldfrom-saudi-arabia-to-china (accessed on 13 September 2023).
  33. Abdel-Basset, M.; Abdel-Fatah, L.; Sangaiah, A.K. Metaheuristic algorithms: A comprehensive review. In Computational Intelligence for Multimedia Big Data on the Cloud with Engineering Applications; Academic Press: Cambridge, MA, USA, 2018; pp. 185–231. [Google Scholar]
  34. Abiodun, E.O.; Alabdulatif, A.; Abiodun, O.I.; Alawida, M.; Alabdulatif, A.; Alkhawaldeh, R.S. A systematic review of emerging feature selection optimization methods for optimal text classification: The present state and prospective opportunities. Neural Comput. Appl. 2021, 33, 15091–15118. [Google Scholar] [CrossRef] [PubMed]
  35. Diao, R.; Shen, Q. Nature inspired feature selection meta-heuristics. Artif. Intell. Rev. 2015, 44, 311–340. [Google Scholar] [CrossRef]
  36. Sharma, M.; Kaur, P. A comprehensive analysis of nature-inspired meta-heuristic techniques for feature selection problem. Arch. Comput. Methods Eng. 2021, 28, 1103–1127. [Google Scholar] [CrossRef]
  37. Larabi-Marie-Sainte, S. Outlier detection based feature selection exploiting bio-inspired optimization algorithms. Appl. Sci. 2021, 11, 6769. [Google Scholar] [CrossRef]
  38. Parra, D.; Gutiérrez-Gallego, A.; Garnica, O.; Velasco, J.M.; Zekri-Nechar, K.; Zamorano-León, J.J.; Heras, N.D.L.; Hidalgo, J.I. Predicting the Risk of Overweight and Obesity in Madrid—A Binary Classification Approach with Evolutionary Feature Selection. Appl. Sci. 2022, 12, 8251. [Google Scholar] [CrossRef]
  39. Hazer-Rau, D.; Arends, R.; Zhang, L.; Traue, H.C. Feature Selection Based on Evolutionary Algorithms for Affective Computing and Stress Recognition. Eng. Proc. 2021, 10, 42. [Google Scholar]
  40. Han, Y.; Huang, L.; Zhou, F. Zoo: Selecting transcriptomic and methylomic biomarkers by ensembling animal-inspired swarm intelligence feature selection algorithms. Genes 2021, 12, 1814. [Google Scholar] [CrossRef]
  41. Leske, M.; Bottacini, F.; Afli, H.; Andrade, B.G. BiGAMi: Bi-Objective Genetic Algorithm Fitness Function for Feature Selection on Microbiome Datasets. Methods Protoc. 2022, 5, 42. [Google Scholar] [CrossRef]
  42. Quan, S.J.; Park, J.; Economou, A.; Lee, S. Artificial intelligence-aided design: Smart design for sustainable city development. Environ. Plan. B Urban Anal. City Sci. 2019, 46, 1581–1599. [Google Scholar] [CrossRef]
  43. Nagarajan, S.M.; Deverajan, G.G.; Chatterjee, P.; Alnumay, W.; Ghosh, U. Effective task scheduling algorithm with deep learning for Internet of Health Things (IoHT) in sustainable smart cities. Sustain. Cities Soc. 2021, 71, 102945. [Google Scholar] [CrossRef]
  44. Macke, J.; Sarate, J.A.R.; de Atayde Moschen, S. Smart sustainable cities evaluation and sense of community. J. Clean. Prod. 2019, 239, 118103. [Google Scholar] [CrossRef]
  45. Alamoudi, A.K.; Abidoye, R.B.; Lam, T.Y. The Impact of Citizens’ Participation Level on Smart Sustainable Cities Outcomes: Evidence from Saudi Arabia. Buildings 2023, 13, 343. [Google Scholar] [CrossRef]
  46. Shafiq, M.; Tian, Z.; Bashir, A.K.; Jolfaei, A.; Yu, X. Data mining and machine learning methods for sustainable smart cities traffic classification: A survey. Sustain. Cities Soc. 2020, 60, 102177. [Google Scholar] [CrossRef]
  47. Aina, Y.A. Achieving smart sustainable cities with GeoICT support: The Saudi evolving smart cities. Cities 2017, 71, 49–58. [Google Scholar] [CrossRef]
  48. Antwi-Afari, P.; Owusu-Manu, D.G.; Simons, B.; Debrah, C.; Ghansah, F.A. Sustainability guidelines to attaining smart sustainable cities in developing countries: A Ghanaian context. Sustain. Futures 2021, 3, 100044. [Google Scholar] [CrossRef]
  49. Garau, C.; Nesi, P.; Paoli, I.; Paolucci, M.; Zamperlin, P. A big data platform for smart and sustainable cities: Environmental monitoring case studies in Europe. In Computational Science and Its Applications—ICCSA 2020: 20th International Conference, Cagliari, Italy, 1–4 July 2020; Proceedings, Part VII 20; Springer International Publishing: Berlin/Heidelberg, Germany, 2020; pp. 393–406. [Google Scholar]
  50. Parlina, A.; Ramli, K.; Murfi, H. Exposing emerging trends in smart sustainable city research using deep autoencoders-based fuzzy c-means. Sustainability 2021, 13, 2876. [Google Scholar] [CrossRef]
  51. Huovila, A.; Bosch, P.; Airaksinen, M. Comparative analysis of standardized indicators for Smart sustainable cities: What indicators and standards to use and when? Cities 2019, 89, 141–153. [Google Scholar] [CrossRef]
  52. Paes, V.D.C.; Pessoa, C.H.M.; Pagliusi, R.P.; Barbosa, C.E.; Argôlo, M.; de Lima, Y.O.; Salazar, H.; Lyra, A.; de Souza, J.M. Analyzing the Challenges for Future Smart and Sustainable Cities. Sustainability 2023, 15, 7996. [Google Scholar] [CrossRef]
  53. Haarstad, H. Constructing the sustainable city: Examining the role of sustainability in the ‘smart city’ discourse. J. Environ. Policy Plan. 2017, 19, 423–437. [Google Scholar] [CrossRef]
  54. Moslem, S. A novel parsimonious spherical fuzzy analytic hierarchy process for sustainable urban transport solutions. Eng. Appl. Artif. Intell. 2024, 128, 107447. [Google Scholar] [CrossRef]
  55. Tehrani, A.A.; Veisi, O.; Fakhr, B.V.; Du, D. Predicting solar radiation in the urban area: A data-driven analysis for sustainable city planning using artificial neural networking. Sustain. Cities Soc. 2024, 100, 105042. [Google Scholar] [CrossRef]
  56. Huda, N.U.; Ahmed, I.; Adnan, M.; Ali, M.; Naeem, F. Experts and intelligent systems for smart homes’ Transformation to Sustainable Smart Cities: A comprehensive review. Expert Syst. Appl. 2024, 238, 122380. [Google Scholar] [CrossRef]
  57. Biswas, C.; Chakraborti, A.; Majumder, S. Recent Advancements in Artificial Intelligence and Machine Learning in Sustainable Energy Management. In Sustainable Energy Solutions with Artificial Intelligence, Blockchain Technology, and Internet of Things; CRC Press: Boca Raton, FL, USA, 2024; pp. 35–46. [Google Scholar]
  58. Deb, K. Multi-Objective Optimization Using Evolutionary Algorithms; John Wiley: New York, NY, USA, 2001. [Google Scholar]
  59. Ishibuchi, H.; Imada, R.; Setoguchi, Y.; Nojima, Y. Performance comparison of NSGA-II and NSGA-III on various many-objective test problems. In Proceedings of the 2016 IEEE Congress on Evolutionary Computation (CEC), Vancouver, BC, Canada, 24–29 July 2016; pp. 3045–3052. [Google Scholar]
  60. Corne, D.W.; Jerram, N.R.; Knowles, J.D.; Oates, M.J. PESA-II: Region-based selection in evolutionary multiobjective optimization. In Proceedings of the 3rd Annual Conference on Genetic and Evolutionary Computation, San Francisco, CA, USA, 7–11 July 2001; pp. 283–290. [Google Scholar]
  61. Goodarzian, F.; Ghasemi, P.; Gonzalez, E.D.S.; Tirkolaee, E.B. A sustainable-circular citrus closed-loop supply chain configuration: Pareto-based algorithms. J. Environ. Manag. 2023, 328, 116892. [Google Scholar] [CrossRef]
  62. Murata, T.; Ishibuchi, H. MOGA: Multi-objective genetic algorithms. IEEE Int. Conf. Evol. Comput. 1995, 1, 289–294. [Google Scholar]
  63. Yeh, W.C.; Chuang, M.C. Using multi-objective genetic algorithm for partner selection in green supply chain problems. Expert Syst. Appl. 2011, 38, 4244–4253. [Google Scholar] [CrossRef]
  64. Zolpakar, N.A.; Lodhi, S.S.; Pathak, S.; Sharma, M.A. Application of multi-objective genetic algorithm (MOGA) optimization in machining processes. In Optimization of Manufacturing Processes; Springer Nature: Cham, Switzerland, 2020; pp. 185–199. [Google Scholar]
  65. Li, H.; Xu, B.; Lu, G.; Du, C.; Huang, N. Multi-objective optimization of PEM fuel cell by coupled significant variables recognition, surrogate models and a multi-objective genetic algorithm. Energy Convers. Manag. 2021, 236, 114063. [Google Scholar] [CrossRef]
  66. Horn, J.; Nafpliotis, N.; Goldberg, D.E. A niched Pareto genetic algorithm for multiobjective optimization. In Proceedings of the First IEEE Conference on Evolutionary Computation. IEEE World Congress on Computational Intelligence, Orlando, FL, USA, 27–29 June 1994; pp. 82–87. [Google Scholar]
  67. Baraldi, P.; Pedroni, N.; Zio, E. Application of a niched Pareto genetic algorithm for selecting features for nuclear transients classification. Int. J. Intell. Syst. 2009, 24, 118–151. [Google Scholar] [CrossRef]
  68. Zio, E.; Baraldi, P.; Pedroni, N. Feature selection for transients classification by a niched Pareto genetic algorithm. In Applied Artificial Intelligence; Taylor and Francis: Abingdon, UK, 2006; pp. 938–945. [Google Scholar]
  69. Zitzler, E.; Laumanns, M.; Thiele, L. SPEA2: Improving the strength Pareto evolutionary algorithm. TIK Rep. 2001, 103, 1–22. [Google Scholar]
  70. Xue, B.; Cervante, L.; Shang, L.; Browne, W.N.; Zhang, M. Multi-objective evolutionary algorithms for filter based feature selection in classification. Int. J. Artif. Intell. Tools 2013, 22, 1350024. [Google Scholar] [CrossRef]
  71. Basu, S.; Das, S.; Ghatak, S.; Das, A.K. Strength pareto evolutionary algorithm based gene subset selection. In Proceedings of the 2017 International Conference on Big Data Analytics and Computational Intelligence (ICBDAC), Chirala, India, 23–25 March 2017; pp. 79–85. [Google Scholar]
  72. Mohanty, R.; Das, S.K.; Mohanty, M. Shear Wave Velocity-Based Liquefaction Susceptibility of Soil Using Extreme Learning Machine (ELM) with Strength Pareto Evolutionary Algorithm (SPEA 2). In Earthquake Geotechnics: Select Proceedings of 7th ICRAGEE 2021; Springer: Singapore, 2022; pp. 33–44. [Google Scholar]
  73. Kaur, M.; Singh, D.; Singh Uppal, R. Parallel strength Pareto evolutionary algorithm-II based image encryption. IET Image Process. 2020, 14, 1015–1026. [Google Scholar] [CrossRef]
  74. Mehrdad, S.; Dadsetani, R.; Amiriyoon, A.; Leon, A.S.; Reza Safaei, M.; Goodarzi, M. Exergo-economic optimization of organic rankine cycle for saving of thermal energy in a sample power plant by using of strength pareto evolutionary algorithm II. Processes 2020, 8, 264. [Google Scholar] [CrossRef]
  75. Gu, Q.; Chen, S.; Jiang, S.; Xiong, N. Improved strength Pareto evolutionary algorithm based on reference direction and coordinated selection strategy. Int. J. Intell. Syst. 2021, 36, 4693–4722. [Google Scholar] [CrossRef]
  76. Xue, B.; Zhang, M.; Browne, W.N. Particle swarm optimization for feature selection in classification: A multi-objective approach. IEEE Trans. Cybern. 2012, 43, 1656–1671. [Google Scholar] [CrossRef] [PubMed]
  77. De Vito, S.; Massera, E.; Piga, M.; Martinotto, L.; Di Francia, G. On field calibration of an electronic nose for benzene estimation in an urban pollution monitoring scenario. Sens. Actuators B Chem. 2008, 129, 750–757. [Google Scholar] [CrossRef]
  78. Song, Y.; Fang, X. An Improved Strength Pareto Evolutionary Algorithm 2 with Adaptive Crossover Operator for Bi-Objective Distributed Unmanned Aerial Vehicle Delivery. Mathematics 2023, 11, 3327. [Google Scholar] [CrossRef]
  79. Sheng, W.; Liu, Y.; Meng, X.; Zhang, T. An Improved Strength Pareto Evolutionary Algorithm 2 with application to the optimization of distributed generations. Comput. Math. Appl. 2012, 64, 944–955. [Google Scholar] [CrossRef]
  80. Tongur, V.; Ülker, E. B-spline curve knot estimation by using niched pareto genetic algorithm (npga). In Intelligent and Evolutionary Systems: The 19th Asia Pacific Symposium, IES 2015, Bangkok, Thailand, 22–25 November 2015, Proceedings; Springer International Publishing: Berlin/Heidelberg, Germany, 2016; pp. 305–316. [Google Scholar]
  81. Wu, H.; Li, X.; Yang, X. Dimensional synthesis for multi-linkage robots based on a niched Pareto genetic algorithm. Algorithms 2020, 13, 203. [Google Scholar] [CrossRef]
  82. Omidi Brojeni, P.; Abazari, S.; Madani, M. Pesa ii algorithm-based optimal coordination of directional overcurrent relays in microgrid. Comput. Intell. Electr. Eng. 2022, 13, 51–64. [Google Scholar]
  83. Kumar, H.; Yadav, S.P. Using reference point-based NSGA-II to system reliability. Constraints 2017, 1, 7–14. [Google Scholar] [CrossRef]
  84. Singh, P.; Pasha, J.; Moses, R.; Sobanjo, J.; Ozguven, E.E.; Dulebenets, M.A. Development of exact and heuristic optimization methods for safety improvement projects at level crossings under conflicting objectives. Reliab. Eng. Syst. Saf. 2022, 220, 108296. [Google Scholar] [CrossRef]
  85. Dulebenets, M.A. An Adaptive Polyploid Memetic Algorithm for scheduling trucks at a cross-docking terminal. Inf. Sci. 2021, 565, 390–421. [Google Scholar] [CrossRef]
  86. Dulebenets, M.A. A Diffused Memetic Optimizer for reactive berth allocation and scheduling at marine container terminals in response to disruptions. Swarm Evol. Comput. 2023, 80, 101334. [Google Scholar] [CrossRef]
  87. Singh, E.; Pillay, N. A study of ant-based pheromone spaces for generation constructive hyper-heuristics. Swarm Evol. Comput. 2022, 72, 101095. [Google Scholar] [CrossRef]
Figure 1. Popularity of filter-based methods in feature selection.
Sustainability 16 01511 g001
Figure 2. Generating the feature subsets for each of the smart sustainable city indicators. The Figure visualizes the feature selection procedure, showing the datasets, feature selection algorithms, and the subsets generated.
Sustainability 16 01511 g002
Figure 3. Evaluation of the learning algorithms based on the feature subsets selected from smart sustainable city indicator datasets by the evolutionary algorithms. This Figure depicts the evaluation of the feature subsets where the learning algorithms were employed. The feature subsets generated by each evolutionary algorithm for the six datasets served as inputs for the respective learning algorithms.
Sustainability 16 01511 g003
Table 1. Summary of the proposed smart sustainable cities under development across the world.
RegionCountryNameKey Features
AsiaMalaysiaBiodiverCityThe city is planned to be a car-free environment with autonomous public transportation systems
AsiaJapanWoven cityFully automated, powered by artificial intelligence technologies
North AmericaUSATelosaCommuting within the city to access services will take a maximum of 15 min and no fossil-fuel-powered vehicle will be allowed in the city
AsiaSaudi ArabiaNEOM—The LineThere will be no cars and carbon emissions will be zero; 20 min will be enough to go to anywhere in the city
AsiaMaldivesFloating cityDesigned to float on water and be resistant to climate changes
AsiaChinaChengdu future cityThe city will mainly utilize autonomous vehicles
AfricaSenegalAkon CityThe economy of the city will be based on blockchain and cryptocurrency
Table 2. Smart sustainable city indicator datasets with description.
Sustainability ThemeIndicator DatasetDescriptionFeaturesSource
HealthLife expectancyThe datasets contained 19 features with real values of life expectancy determinant factors Adult Mortality (c1), infant deaths (c2), alcohol (c3), percentage expenditure (c4), hepatitis B (c5), measles (c6), BMI, under-five deaths (c7), polio (c8), total expenditure (c9), diphtheria (c10), HIV/AIDS (c11), GDP, population, thinness 1–19 years (c13), thinness 5–9 years (c14), income composition of resources (c15), schooling, life expectancy (c16) Kaggle (publicly available)
Atmosphere Air quality The datasets contained 9358 instances of responses for hourly averages from sensors embedded in an air quality device. It has 15 features.CO (GT) (a1), PT08.S1 (CO) (a2), NMHC (GT) (a3), C6H6 (GT) (a4), PT08.S2 (NMHC) (a5), NOx (GT) (a6), PT08.S3 (NOx) (a7), NO2 (GT) (a8), PT08.S4 (NO2) (a9), PT08.S5 (O3) (a10), T, RH, AH[77] (publicly available)
Consumption and production patternsEnergy consumption The data were collected from smart steel industry located in South Korea. The data contained 11 features with 35,040 instances. Usage_kWh (E1), Lagging_Current_Reactive.Power_kVarh (E2), Leading_Current_Reactive_Power_kVarh (E3), CO2 (tCO2) (E4), Lagging_Current_Power_Factor (E5), Leading_Current_Power_Factor (E6), NSM, Day_of_week (E7), Load_Type (E8)UCL repository (publicly available)
Online services Online shoppers’ intentions The data contained 12,330 instances of sessions in which 10,422 were negative classes while 1908 were positive. The number of features in the dataset is 18.Administrative, Administrative_Duration (D1), Informational (D17), D17_Duration (D2), ProductRelated (D4), ProductRelated_Duration (D5), BounceRates (D6), ExitRates (D7), PageValues (D8), SpecialDay (D9), Month, OperatingSystems (D10), Browser, Region (D15), TrafficType (D11), Weekend (D12), Revenue, Customer_Retention (D13)UCL repository (publicly available)
Consumption and production patterns Traffic flow The datasets contained 48,204 instances of records with 9 features. The interstate data were collected on hourly bases. Includes weather and holiday features.Temp, 3_1h, 8_1h, 1_all, weather_main, traffic_volumeUCL Repository (publicly available)
Fresh water Water quality The data contained 20 features with 400,000 instances taken from a water base. ResultMeanValue (b20), PopulationDensity (B1), TerraMarineProtected_2016_2018 (B2), TouristMean_1990_2020 (B3), VenueCount (B19), netMigration_2011_2018 (B4), droughts_floods_temperature (B5), literacyRate_2010_2018 (B6), combustibleRenewables_2009_2014 (B7), gdp (B8), composition_food_organic_waste_percent (B9), composition_glass_percent (B10), composition_metal_percent (B11), composition_other_percent (B12), composition_paper_cardboard_percent (B13), composition_plastic_percent (B14), composition_rubber_leather_percent (B15), composition_wood_percent (B16), composition_yard_garden_green_waste_percent (B17), waste_treatment_recycling_percent (B18) Kaggle (publicly available)
Table 3. Feature subsets selected by the NSGA3 and accuracy for the air quality dataset.
Evolutionary AlgorithmLearning Algorithm Selected Features (Accuracy)Accuracy on All Features
NSGA3SVMA6, A7, A8 and A10, T (92.75%)90.15%
KNNA3, A6, A7, A8 and A10 (92.34%)89.40%
GNBA1, A2, A3, A4, A6, A7, A8 and RH (92.34%)88.94%
RFCA3, A4, A5, A6, A7, A8, A9 and A10 (93.37%)90.40%
ANNA6, A7 and A8 (94.22%)91.22%
MOEASVMA6, A7, A8 and A10, T (93.51%)90.54%
KNNA3, A6, A7, A8 and A10 (93.32%)90.34%
GNBA1, A2, A3, A4, A6, A7, A8 and RH (93.41%)90.44%
RFCA3, A4, A5, A6, A7, A8, A9, and A10 (93.41%)90.53%
ANNA6, A7 and A8 (93.51%)90.53%
SPEA2SVMA1, A2, A3, A4, A5, A6, A7, A8, A9, A10, T, RH, AH (87.37%)87.37%
KNNA3, A4, A5, A6, A7, A8, A9, A10 (87.37%)87.18%
GNBA3, A4, A5, A6, A7, A8, A9, A10 (87.37%)87.27%
RFCA3, A4, A5, A6, A7, A8, A9, A10 (87.66%)87.36%
ANNA1, A3, A4, A5, A6, A7, A8, A9, A10 (87.45%)87.36%
NPGASVMA4, A5, A3, A5, A6, A7, A8, A9, A10 (84.04%)83.44%
KNNA4, A5, A3, A5, A6, A7, A8, A9, A10 (85.22%)83.26%
GNBA4, A5, A3, A5, A6, A7, A8, A9, A10 (84.00%)83.35%
RFCA4, A5, A3, A5, A6, A7, A8, A9, A10 (86.75%)83.43%
ANNA5, A3, A4, A5, A6, A7, A8, A9, A10 (84.02%)83.43%
MOGASVMA4, A5, A3, A5, A6, A7, A8, A9, A10 (82.65%)89.86%
KNNA4, A5, A3, A5, A6, A7, A8, A9, A10 (88.86%)89.66%
GNBA4, A5, A3, A5, A6, A7, A8, A9, A10 (88.65%)89.76%
RFCA4, A3, A5, A6, A7, A8, A9, A10 (89.65%)89.85%
ANNA5, A3, A4, A5, A6, A7, A8, A9, A10 (85.85%)89.85%
PESA2SVMA1, A2, A3, A4, A5, A6, A7, A8, A9, A10, T, RH, AH (87.37%)85.84%
KNNA4, A5, A3, A5, A6, A7, A8, A9, A10 (86.00%)85.65%
GNBA1, A2, A3, A4, A5, A6, A7, A8, A9, A10, T, RH, AH (86.25%)85.75%
RFCA5, A3, A4, A5, A6, A7, A9, A10 (85.83%)85.83%
ANNA4, A5, A3, A4, A5, A6, A7, A8, A9, A10 (85.83%)85.83%
Table 4. Algorithm accuracy and feature subset selection for water quality based on the evolutionary algorithms.
Evolutionary
Algorithm
Learning AlgorithmSelected Features (Accuracy)Accuracy on All Features
NSGA3SVMb20, b1, b2, b3, b4, b6, b9, b12, b13, b14, b16, b17, b18 (92.66)90.33%
KNNb20, b1, b2, b3, b4, b6, b9, b12, b13, b14, b17, b18 (94.32)87.65%
GNBb20, b1, b2, b9, b12, b13, b14, b17, b18 (89.77)93.65%
RFCb20, b1, b9, b12, b13, b14, b17, b18 (94.32)90.65%
ANNb20, b9, b12, b13, b14, b17, b18 (95.62)95.01%
MOEASVMb20, b1, b2, b3, b4, b6, b9, b12, b13, b14, b16, b17, b18 (92.48)88.98%
KNNb20, b1, b6, b9, b12, b14, b17, b18 (88.89)86.47%
GNBb20, b1, b2, b9, b12, b13, b14, b17, b18 (93.33)92.67%
RFCb20, b1, b9, b12, b13, b14, b17, b18, gdp (90.73)89.61%
ANNb20, b9, b12, b13, b14, b18 (94.90)94.30%
SPEA2SVMb20, b1, b2, b5, b6, b7, gdp, b9, b10, b11, b12, b13, b14, b15, b16, b17 (81.72%)85.87%
KNNb20, b1, b2, b5, b6, b7, gdp, b9, b10, b11, b12, b13, b14, b15, b16, b17 (81.72%)83.44%
GNBb20, b1, b2, b3, b19, b4, b5, b6, b7, gdp, b9, b10, b11, b12, b13, b14, b15, b16, b17 (81.72%)89.43%
RFCb20, b1, b2, b5, b6, b7, gdp, b9, b10, b11, b12, b13, b14, b15, b16, b17 (81.72%)86.47%
ANNb20, b1, b2, b5, b6, b7, gdp, b9, b10, b11, b12, b13, b14, b15, b16, b17 (81.72%)91.00%
NPGASVMb20, b1, b2, b3, b19, b4, b5, b6, b9, b10, b11, b12, b13, b14, b15, b16, b17 (77.49%)82.00%
KNNb20, b1, b2, b3, b19, b4, b5, b6, b9, b10, b11, b12, b13, b14, b15, b16, b17 (77.49%)79.69%
GNBb20, b1, b2, b3, b19, b4, b5, b6, b9, b10, b11, b12, b13, b14, b15, b16, b17 (77.49%)85.40%
RFCb1, b2, b3, b19, b4, b5, b6, b7, gdp, b9, b10, b11, b12, b13, b14, b15, b16, b17 (77.49%)82.58%
ANNb1, b2, b3, b19, b4, b5, b6, b7, gdp, b9, b10, b11, b12, b13, b14, b15, b16, b17 (77.49%)86.90%
MOGASVMb20, b1, b2, b3, b19, b4, b5, b6, b7, gdp, b9, b10, b11, b13, b14, b15, b16, b17 (84.33%)88.31%
KNNb20, b1, b2, b3, b19, b4, b5, b6, b7, gdp, b9, b10, b11, b13, b14, b15, b16, b17 (84.33%)85.82%
GNBb20, b1, b2, b3, b19, b4, b5, b6, b7, gdp, b9, b10, b11, b13, b14, b15, b16, b17 (84.33%)91.97%
RFCb20, b1, b2, b3, b19, b4, b5, b6, b7, gdp, b9, b10, b11, b12, b13, b14, b15, b16, b17 (84.33%)88.94%
ANNb20, b1, b2, b3, b19, b4, b5, b6, b7, gdp, b9, b10, b11, b13, b14, b15, b16, b17 (84.33%)93.59%
PESA-IISVMb1, b2, b3, b19, b4, b5, b6, b7, gdp, b9, b10, b11, b12, b13, b14, b15, b16, b17 (83.62%)84.36%
KNNb20, b1, b2, b3, b19, b4, b5, b6, gdp, b9, b10, b11, b12, b13, b14, b15, b16, b17 (83.62%)81.98%
GNBb20, b1, b2, b3, b19, b4, b5, b6, b7, gdp, b9, b10, b11, b12, b13, b14, b17 (83.62%)87.86%
RFCb20, b1, b2, b3, b19, b4, b5, b6, b7, gdp, b9, b10, b11, b12, b13, b14, b15, b16 (83.62%)84.96%
ANNb20, b1, b2, b5, b6, b7, gdp, b9, b10, b11, b12, b13, b14, b15, b16, b17 (83.62%)89.41%
Table 5. Life-expectancy feature subsets’ selection and prediction accuracy.
Evolutionary AlgorithmLearning AlgorithmSelected Features (Accuracy)Accuracy on All Features
NSGA3SVMC1, C2, C3, C5, Meailes, BMI, C8, C10 (90.52)89.59%
KNNC1, C2, C5, Meailes, BMI, C7, C8, C10, C13 (87.19)87.19%
GNBC2, C3, C5, Meailes, BMI, C8, C10, C14 (89.66)87.25%
RFCC1, C2, C3, C5, Meailes, BMI, C7, C8, C10, C14 (88.33)86.45%
ANNC1, C2, C3, C5, Meailes, BMI, C8, C10, C13, C14 (92.75)89.75%
MOEASVMC1, C2, C3, C5, Meailes, BMI, C8, C10 (89.66)88.74%
KNNC1, C2, C3, C5, Meailes, C7, C8, C10, C13 (86.34)86.34%
GNBC1, C2, C3, C5, Meailes, BMI, C7, C8, C10, C13, C14 (88.79)86.40%
RFCC1, C2, C3, C5, C6, C7, C8, C10, C13 (87.56)85.70%
ANNC1, C2, C3, C5, Meailes, BMI, C7, C8, C10 (91.92)88.95%
SPEA2SVMC1, C2, C3, C4, C5, C6, BMI, C7, C8, C9, C10, C11, GDP, Population, C13, C14, C15, Schooling, C16 (85.63)85.63%
KNNC2, C3 C4, C5, C6, BMI, C7, C8, C9, C10, C11, GDP, Population, C13, C14, C15, Schooling, C16 (85.63)83.32%
GNBC1, C2, C3, C4, C5, C6, BMI, C7, C8, C9, C10, C11, GDP, Population, C13, C14, C16 (85.63)83.38%
RFCC1, C2, C3, C4, C5, C6, BMI, C8, C9, C10, C11, GDP, Population, C13, C14, C15, Schooling, C16 (85.63)82.70%
ANNC2, C3, C4, C5, C6, BMI, C7, C8, C9, C10, C11, GDP, Population, C13, C14, C15, Schooling, C16 (85.63)85.84%
NPGASVMC1, C2, C3, C4, C5, C6, BMI, C7, C8, C9, C10, C11, GDP, Population, C13, C14, C15, Schooling, C16 (78.65%)81.78%
KNNC2, C3, C4, C5, C6, BMI, C7, C8, C9, C10, C11, GDP, Population, C13, C14, C15, Schooling, C16 (78.65%)79.57%
GNBC1, C2, C3, C4, C5, C6, BMI, C7, C8, C9, C10, C11, GDP, Population, C13, C14, C15, Schooling, (78.65%)79.62%
RFCC1, C2, C3, C4, C5, C6, BMI, C7, C8, C9, C10, C11, GDP, Population, C13, C14, C15, Schooling, C16 (78.65%)78.98%
ANNC1, C2, C3, C4, C5, C6, BMI, C7, C8, C9, C10, C11, GDP, Population, C13, C14, C15, Schooling, C16 (78.65%)81.97%
MOGASVMc2, C3, c4, C5, C6, BMI, c7, C8, C9, C10, C11, GDP, Population, c13, c14, C15, Schooling, C16 (87.65)88.07%
KNNC1, c2, C3, c4, C5, C6, BMI, c7, C8, C9, C10, C11, GDP, Population, c13, c14, C15, Schooling, C16 (87.65)85.69%
GNBC1, c2, C3, c4, C5, C6, BMI, c7, C8, C9, C10, C11, GDP, Population, c13, c14, C15, Schooling, C16 (87.65)85.75%
RFCC1, c2, C3, c4, C5, C6, BMI, c7, C10, C11, GDP, Population, c13, c14, C15, Schooling, C16 (87.65)85.06%
ANNC1, c2, C3, c4, C5, C6, BMI, c7, C8, C9, C10, C11, GDP, Population, c13, c14, C15, Schooling, C16 (87.65)88.28%
PESA2SVMC1, c2, C3, c4, C5, C6, BMI, c7, C8, C9, C10, C11, GDP, Population, c13, c14, C15, Schooling, C16 (81.22%)84.14%
KNNC1, c2, C5, C6, BMI, c7, C8, C9, C10, C11, GDP, Population, c13, c14, C15, Schooling, C16 (81.22%)81.86%
GNBC1, c2, C3, c4, C5, C6, BMI, c7, C8, C9, C10, C11, GDP, Population, c13, c14, C15, Schooling, C16 (81.22%)81.92%
RFCc2, C3, c4, C5, C6, BMI, c7, C8, C9, C10, C11, GDP, Population, c13, c14, C15, Schooling, C16 (81.22%)81.25%
ANNC1, c2, C3, c4, C5, C6, BMI, c7, C8, C9, C10, C11, GDP, Population, c13, c14, C15, C16 (81.22%)84.33%
Table 6. Results of state traffic flow prediction based on the evolutionary algorithms.
Evolutionary AlgorithmLearning AlgorithmSelected Features (Accuracy)Accuracy on All Features
NSGA3SVMtemp, 3_1h, 8_1h, weather_main, traffic_volume (96.88)94.66%
KNNtemp, 8_1h, 1_all, weather_main, traffic_volume (93.45)95.89%
GNBtemp, 1_all, weather_main, traffic_volume (94.22)93.75%
RFCtemp, 3_1h, 1_all, weather_main, traffic_volume (95.45)94.65%
ANNtemp, 1_all, weather_main, traffic_volume (98.14)96.56%
MOEASVMtemp, 3_1h, 8_1h, weather_main, traffic_volume (95.96)93.76%
KNNtemp, 3_1h, 1_all, weather_main, traffic_volume (92.66)95.07%
GNBtemp, 8_1h, 1_all, weather_main, traffic_volume (93.39)92.93%
RFCtemp, 3_1h, 1_all, weather_main, traffic_volume (94.71)93.91%
ANNtemp, 3_1h, 1_all, weather_main, traffic_volume (97.28)95.71%
SPEA2SVMtemp, 3_1h, 1_all, weather_main, traffic_volume (89.28%)90.48%
KNNtemp, 3_1h, 1_all, weather_main, traffic_volume (89.28%)91.74%
GNBtemp, 3_1h, 1_all, weather_main, traffic_volume (89.28%)89.68%
RFCtemp, 3_1h, 1_all, weather_main, traffic_volume (89.28%)90.62%
ANNtemp, 3_1h, 1_all, weather_main, traffic_volume (89.28%)92.36%
NPGASVMtemp, 3_1h, 1_all, weather_main, traffic_volume (85.75%)86.41%
KNNtemp, 3_1h, 1_all, weather_main, traffic_volume (85.75%)87.61%
GNBtemp, 3_1h, 1_all, weather_main, traffic_volume (85.75%)85.64%
RFCtemp, 3_1h, 1_all, weather_main, traffic_volume (85.75%)86.55%
ANNtemp, 3_1h, 1_all, weather_main, traffic_volume (85.75%)88.20%
MOGASVMtemp, 3_1h, 1_all, weather_main, traffic_volume (90.55%)93.06%
KNNtemp, 3_1h, 1_all, weather_main, traffic_volume (90.55%)94.36%
GNBtemp, 3_1h, 1_all, weather_main, traffic_volume (92.23%)92.23%
RFCtemp, 3_1h, 1_all, weather_main, traffic_volume (90.55%)93.21%
ANNtemp, 3_1h, 1_all, weather_main, traffic_volume (90.55%)94.99%
PESA2SVMtemp, 3_1h, 1_all, weather_main, traffic_volume (87.65%)88.90%
KNNtemp, 3_1h, 1_all, weather_main, traffic_volume (87.65%)90.14%
GNBtemp, 3_1h, 1_all, weather_main, traffic_volume (87.65%)88.11%
RFCtemp, 3_1h, 1_all, weather_main, traffic_volume (89.25%)89.04%
ANNtemp, 3_1h, 1_all, weather_main, traffic_volume (87.25%)90.74%
Table 7. The results of predicting online shoppers’ intention in smart sustainable cities.
Evolutionary AlgorithmLearning AlgorithmSelected Features (Accuracy)Accuracy on All Features
NSGA3SVMAdministrative, D1, D17, D2, D4, D5, D6, D7, D8, D9, Month, D10, Browser, D15, D11, Revenue, D13 (94.96)92.02%
KNND1, D2, D4, D5, D7, D8, D9, Month, Browser, D15, D11 (92.66)92.19%
GNBD1, D17, D2, D4, D5, D6, D7, D8, D9, Month, Browser, D15, D11 (94.34)90.65%
RFCD1, D17, D2, D4, D5, D6, D7, D8, D9, Month, Browser, D15, D11 (93.65)93.03%
ANND1, D17, D2, D4, D6, D7, D8, D9, Month, Browser, D15, D11 (92.15)92.03%
MOEASVMAdministrative, D1, D17, D2, D4, D5, D6, D7, D8, D9, Month, D10, Browser, D15, D11, Revenue, D13 (92.41)87.88%
KNND1, D2, D4, D5, D7, D8, D9, Month, Browser, D15, D11 (90.09)88.04%
GNBD1, D17, D2, D4, D5, D6, D7, D8, D9, Month, Browser, D15, D11 (88.49)86.57%
RFCD1, D17, D2, D4, D5, D6, D7, D8, D9, Month, Browser, D15, D11 (89.54)88.83%
ANND1, D17, D2, D4, D6, D7, D8, D9, Month, Browser, D15, D11 (88.00)87.89%
SPEA2SVMAdministrative, D1, D17, D2, D4, D5, D6, D7, D8, D9, Month, D10, Browser, D15, D11, D12, Revenue, (80.45%)84.80%
KNNAdministrative, D1, D17, D2, D4, D5, D6, D7, D8, D9, Month, D10, Browser, D15, D11, D12, Revenue, (80.45%)84.96%
GNBAdministrative, D1, D17, D2, D4, D5, D6, D7, D8, D9, Month, D10, Browser, D15, D11, D12, (80.45%)83.54%
RFCAdministrative, D1, D17, D2, D4, D5, D6, D7, D8, D9, Month, D10, Browser, D15, D11, D12, (80.45%)85.72%
ANNAdministrative, D1, D17, D2, D4, D5, D6, D7, D8, D9, Month, Browser, D15, D11, (80.45%)84.81%
NPGASVMD1, D17, D2, D4, D5, D6, D7, D8, D9, Month, D10, Browser, D15, D11, D12, Revenue, D13 (80.45%)80.99%
KNND1, D17, D2, D4, D5, D6, D7, D8, D9, Month, D10, Browser, D15, D11, D12, Revenue, (80.45%)81.14%
GNBD1, D17, D2, D4, D5, D6, D7, D8, D9, Month, D10, Browser, D15, D11, D12, Revenue, D13 (80.45%)79.78%
RFCAdministrative, D1, D17, D2, D4, D5, D6, D7, D8, D9, Month, D10, Browser, D15, D11, D12, Revenue (80.45%)81.86%
ANND1, D17, D2, D4, D5, D6, D7, D8, D9, Month, D10, Browser, D15, D11, D12, Revenue (80.45%)81.00%
MOGASVMD17, D2, D4, D5, D6, D7, D8, D9, Month, D10, Browser, D15, D11, D12, (82.45%)87.22%
KNND17, D2, D4, D5, D6, D7, D8, D9, Month, D10, Browser, D15, D11, D12, (82.45%)87.38%
GNBD17, D2, D4, D5, D6, D7, D8, D9, Month, D10, Browser, D15, D11, D12, (82.45%)85.92%
RFCD17, D2, D4, D5, D6, D7, D8, D9, Month, D10, Browser, D15, D11, D12, (82.45%)88.16%
ANND17, D2, D4, D5, D6, D7, D8, D9, Month, D10, Browser, D15, D11, D12, (82.45%)87.23%
PESA2SVMD4, D5, D6, D7, D8, D9, Month, D10, Browser, D15, D11, D12, Revenue, D13 (80.45%)83.32%
KNND17, D2, D4, D5, D6, D7, D8, D9, Month, D10, Browser, D15, D11, D12, Revenue, D13 (80.45%)83.47%
GNBD1, D17, D2, D4, D5, D6, D7, D8, D9, Month, D10, Browser, D15, D11, (80.45%)82.08%
RFCD1, D4, D5, D6, D7, D8, D9, Month, D10, Browser, D15, D11, D12, Revenue, D13 (80.45%)84.22%
ANND17, D2, D4, D5, D6, D7, D8, D9, Month, D10, Browser, D15, D11, D12, Revenue (80.45%)83.33%
Table 8. Results for energy consumption feature subsets’ selection and prediction.
Evolutionary AlgorithmLearning AlgorithmSelected Features (Accuracy)Accuracy on All Features
NSGA3SVME1, E2, E3, E5, E6, NSM, E7, E8 (97.68)95.33%
KNNE1, E2, E3, E5, E6, NSM, E7, E8 (97.65)96.75%
GNBE1, E2, E3, E5, E6, E7, E8 (97.22)94.66%
RFCE1, E2, E3, E5, E6, E7, E8 (96.75)97.03%
ANNE1, E2, E3, E5, NSM, E6, E7, E8 (98.17)97.59%
MOEASVME1, E2, E3, E5, E6, NSM, E7, E8 (96.21)96.21%
KNNE1, E2, E3, E5, E6, NSM, E7, E8 (90.87)90.87%
GNBE1, E2, E3, E5, E6, E7, E8 (94.86)93.00%
RFCE1, E2, E3, E5, E6, E7, E8 (95.81)95.62%
ANNE1, E2, E3, E5, NSM, E6, E7, E8 (92.47)90.56%
SPEA2SVME1, E2, E3, E4, E5, E6, NSM, E7, E8 (90.44%)92.84%
KNNE1, E2, E3, E5, E6, NSM, E7, E8 (90.44%)87.69%
GNBE1, E2, E3, E5, E6, NSM, E7, E8 (90.44%)89.75%
RFCE1, E2, E3, E5, E6, NSM, E7, E8 (90.44%)92.27%
ANNE1, E2, E3, E5, E6, NSM, E7, E8 (90.44%)87.39%
NPGASVME1, E2, E3, E4, E5, E6, NSM, E8 (80.64%)88.66%
KNNE1, E2, E3, E4, E5, E6, NSM, E8 (80.64%)83.74%
GNBE1, E2, E3, E4, E5, E6, NSM, E8 (80.64%)85.71%
RFCE1, E2, E3, E4, E5, E6, NSM, E8 (80.64%)88.12%
ANNE1, E2, E3, E4, E5, E6, NSM, E8 (80.64%)83.46%
MOGASVME1, E2, E3, E5, E6, NSM, E8 (89.84%)95.49%
KNNE1, E2, E3, E5, E6, NSM, E8 (89.84%)90.19%
GNBE1, E2, E3, E5, E6, NSM, E8 (89.84%)92.30%
RFCE1, E2, E3, E5, E6, NSM, E8 (89.84%)94.90%
ANNE1, E2, E3, E5, E6, NSM, E8 (89.84%)89.88%
PESA2SVME1, E2, E3, E5, E6, NSM, E7, E8 (90.44%)91.22%
KNNE1, E2, E3, E4, E5, E6, NSM, E8 (90.44%)86.15%
GNBE1, E2, E3, E4, E5, E6, NSM, E7, E8 (90.44%)88.17%
RFCE1, E2, E3, E4, E5, E6, NSM, E7, E8 (90.44%)90.66%
ANNE1, E2, E3, E5, E6, NSM, E8 (90.44%)85.86%
Table 9. Computing time for each of the evolutionary algorithms to converge to the optimum solution.
Evolutionary AlgorithmLearning AlgorithmAir QualityLife ExpectancyTraffic VolumeOnline Shoppers’ IntentionEnergy Consumption Water QualityAverage
NSGA3SVM0.9870.7890.2341.2560.5670.7681.341
KNN0.9230.7950.2341.2660.5970.7751.347
GNB0.9190.8010.2341.2750.5670.7831.352
RFC1.0870.8070.2351.2850.5690.7901.386
ANN1.0110.8130.2681.2950.5670.7981.390
MOEASVM0.8950.6890.2691.2620.6780.8761.527
KNN0.9960.9990.2691.2730.6780.8831.595
GNB0.9321.4490.2701.2840.6980.8901.662
RFC0.9282.1010.2701.2950.6880.8971.762
ANN1.0973.0460.2711.3060.6890.9041.931
SPEA2SVM1.8970.9890.4563.3450.7890.9672.633
KNN1.9110.9960.4593.3700.7950.9742.653
GNB1.9261.0040.4633.3950.8010.9822.672
RFC1.9401.0110.4663.4210.8070.9892.693
ANN1.9551.0190.4703.4460.8130.9962.713
NPGASVM2.0142.2340.5123.9850.9200.9992.793
KNN2.0272.2510.5164.0150.9271.0062.814
GNB2.0402.2680.5204.0450.9341.0142.835
RFC2.0542.2850.5244.0750.9411.0222.856
ANN2.0672.3020.5284.1060.9481.0292.877
MOGASVM2.0012.4520.6243.8940.8840.9942.728
KNN2.0002.4700.6293.9230.8911.0012.746
GNB1.9992.4890.6333.9530.8971.0092.764
RFC1.9972.5080.6383.9820.9041.0172.783
ANN1.9962.5260.6434.0120.9111.0242.801
PESA-IISVM1.9812.1890.7824.1230.9061.0242.864
KNN1.9832.2050.7884.1540.9131.0322.884
GNB1.9852.2220.7944.1850.9201.0392.904
RFC1.9872.2390.8004.2160.9271.0472.924
ANN1.9892.2550.8064.2480.9331.0552.944
Disclaimer/Publisher’s Note: The statements, opinions and data contained in all publications are solely those of the individual author(s) and contributor(s) and not of MDPI and/or the editor(s). MDPI and/or the editor(s) disclaim responsibility for any injury to people or property resulting from any ideas, methods, instructions or products referred to in the content.

