Abstract
With the proposal of the Beijing–Hangzhou Grand Canal Cultural Belt, the Beijing–Hangzhou Grand Canal has become an indispensable component of China’s economic development pattern. Despite relatively high regional-economic-development levels along the canal, there still exists a common imbalance in regional development which will hinder the high-quality collaborative development of the region, highlighting the importance of measuring this disparity. This study adopts the district and county as spatial scales and selects five dimensions: economic growth, livelihood benefits, green ecology, innovation drive, and food guarantee in order to construct a comprehensive socio-economic index. Entropy weight method, Moran index, and Theil index analyses are used to examine the recent ten-year evolution laws in regional socio-economic spatial patterns along the Beijing–Hangzhou Grand Canal. Results indicate that socio-economic indicators designed for each dimension effectively measure both individual districts’ and counties’ economic situations as well as those of entire regions. In 2021, limited significance was observed regarding the level of regional economic agglomeration along the Grand Canal region, suggesting a tendency towards fragmented development rather than forming a well-coordinated model. Over the decade from 2011 to 2021, there was an increase in social and economic agglomeration. From a city unit perspective, developmental disparities among districts and counties within cities follow three distinct patterns. Cities at different stages of development can learn from each other’s models to enhance integration cooperation and collectively promote high-quality economic advancements in the Grand Canal region.
1. Introduction
The spatial pattern of regional economic space reflects the distribution and interrelationships of economic elements within a specific region. Regional-development disparities are a prevalent phenomenon, characterized by differentiation or imbalances in geographical space among regional economic activities. Appropriate regional disparities can drive development, while excessive disparities may lead to polarization and impede the overall regional momentum for development [1]. Therefore, studying the spatial pattern of regions and measuring the differentiation pattern of regional economic space can provide a more scientifically grounded basis for optimizing the spatial layout of regional economies, promoting coordinated and balanced development, as well as ensuring long-term sustainability.
The study of regional economic disparities has yielded numerous findings, utilizing research methods such as the Gini index, coefficient of variation, and Theil index [2,3]. Additionally, exploratory spatial analysis, spatial regression models, and geographically weighted regression models have been employed [4]. Over time, the focus of research has shifted from administrative divisions like countries and provinces to more specific economic geographical levels such as economic belts and river basins [5,6,7,8,9,10]. While provinces, cities, and counties are often the primary units of analysis in studies at these levels; limited research has been conducted on the districts and counties along the river basin. Canals have played a significant role in production and daily life as a testament to human ingenuity. Some international research has been conducted on canal-based economic spatial patterns [11]. China’s Grand Canal (Beijing–Hangzhou) holds a crucial position within China’s spatial pattern as an increasingly important economic belt. Consequently, social–economic studies focusing on it have emerged as an essential area of research within regional spatial patterns.
Research on the social and economic pattern of the Beijing–Hangzhou Grand Canal region primarily focuses on various aspects, encompassing tourism resources, green ecology, livelihood construction, cultural heritage, and innovative patterns [12,13,14,15,16,17,18]. Additionally, there are studies investigating the interrelationships between these aspects, such as comprehensive research on cultural heritage tourism, ecological–cultural coupling research, tourism–ecology coupling research, regional cultural research, and economic innovation coupling [19,20,21,22]. However, these studies have yet to fully integrate diverse dimensions of social and economic measurement while lacking a comprehensive perspective.
The inclusion of the Grand Canal of China on the World Heritage List in 2019 signifies its recognition as a site of outstanding universal value. The Beijing–Hangzhou Grand Canal connects the two most energetic economic zones in China, the Coastal Economic zone and the Yangtze River Economic zone, and the two economic circles, the Yangtze River Delta Economic Circle and the Bohai Economic Circle. It has the important function of bridging the development of China’s north and south, and transferring the development energy of the eastern region to the central and western regions. The proposal of the Grand Canal Cultural Belt has introduced new elements into China’s regional spatial pattern, rendering the areas along the Beijing–Hangzhou Grand Canal an indispensable and pivotal component of China’s economic development. Despite its relatively high overall economic affluence level, this region still exhibits widespread imbalances in spatial development, which pose significant obstacles to achieving coordinated and high-quality development within the Grand Canal region. Quantitative research on these imbalances serves as a scientific foundation for constructing the Grand Canal Cultural Belt and represents a crucial measure in addressing issues related to unbalanced and inadequate regional development in China.
The Fourteenth Five-Year Plan in China (2021–2025) serves as a framework to assess the comprehensive indicators for economic and social development, reflecting the current socio-economic landscape of China. The construction of the Grand Canal Cultural Belt aligns with the development concept outlined in the Fourteenth Five-Year Plan in China (2021–2025), thereby facilitating a reconfiguration of China’s regional spatial pattern [23]. This article utilizes this plan as a reference to establish evaluation indicators for comprehensively assessing the socio-economic conditions along the Grand Canal at the county level. It investigates the spatial distribution of the socio-economic status in the Grand Canal region, examines its temporal evolution over the past decade, and draws holistic conclusions based on comprehensive economic indicators. This research provides a scientific foundation for promoting spatial optimization and the integration of economic development in regions along the Grand Canal.
2. Literature Review
There has been extensive research on the spatial pattern of regional social economy, such as numerous studies on the whole country, some provinces and counties, economic belts, and river basins, using methods such as the Gini index, coefficient of variation and Theil index, exploratory spatial analysis, spatial regression model, geographical weighted regression model, etc. [2,3,4]. With the development of high-quality methods, the comprehensive evaluation of the social and economic spatial pattern of a region has become a more scientific evaluation method. Hua et al. investigated the efficiency of China’s high-quality development pattern, total factor productivity, and their influencing factors in conjunction with the Chinese government’s concept of high-quality development [24]. Previous studies have predominantly focused on singular aspects of advanced development. The dimensions of green and low-carbon development are taken into account, integrating carbon emission, carbon intensity, and other indicators as references for evaluating regional industrial development. Suggestions and countermeasures are provided to promote high-quality urban development in the Chengdu–Chongqing region [25]. The indicators of green high-quality development in Chinese cities were described by collecting data on green patent, energy consumption, and policy text [26].
From the perspective of factors influencing and facilitating development, actively preserving China’s exceptional traditional culture can effectively promote the high-quality advancement of regional economic, political, and social infrastructure [27]. The study conducted by Wang et al. revealed a significant interaction between fiscal decentralization and high-quality regional development, demonstrating an inverted U-shaped relationship particularly evident in three key dimensions: innovation, environmental sustainability, and economic openness [28]. System analysis is used to compound the evaluation dimensions, and multiple factors such as resources and the environmental carrying capacity and regional high-quality development potential are taken as composite indicators to describe regional-development quality [29]. Throughout the literature, there are few studies on the region along the Grand Canal as the object of high-quality social development.
With the proposal of the Beijing–Hangzhou Grand Canal cultural Belt, the region along the Grand Canal has become an important part of China’s economic belt, and the integration development of the region has become an intriguing trend. The Beijing–Hangzhou Grand Canal is a renowned hydraulic engineering project in Chinese history, representing a valuable cultural and spiritual heritage for water conservation for modern China. Since the 1980s, there has been an increasing demand for water transportation along the Beijing–Hangzhou Grand Canal. In recent years, the Chinese government has implemented a comprehensive strategy for canal culture development, leading to a significant revival of the Grand Canal of China [30].
China’s Grand Canal has generated substantial economic benefits for the cities situated along its route. These cities have developed a distinct spatial pattern as a result of the numerous connections facilitated by the canal, earning them the designation of “canal cities”. Extensive research has been conducted on the urban patterns shaped by canals. Chun et al. examined the temporal and spatial changes in these urban spatial patterns through an analysis of remote sensing images [31]. Shi et al. investigate spatial temporal variations in urban expansion along China’s Grand Canal by selecting 35 cities as research subjects [30]. Using spatial techniques such as geographical weighted regression, Li et al. examined the correlation between land urbanization and social and economic benefits in 21 cities connected by the Beijing–Hangzhou Grand Canal from 1990 to 2015 [32]. There is an increasing body of research on the social and economic pattern of the Beijing–Hangzhou Grand Canal region, but the content is mostly focused on certain aspects, including tourism, ecology, people’s livelihood construction, cultural heritage, the innovation pattern, etc.
The research has also focused on investigating the law of reaction space for two or more interconnected evaluation indexes. By employing a coupled coordination model, this study evaluates the development of regional water-economy-innovation linkages and reveals significant spatial disparities with a relatively low overall level of water-economy-innovation linkages. Moreover, central cities demonstrate notably superior levels of coupled coordination compared to other cities [22]. In order to assess the degree of coupling and coordination between the tourism industry and the ecological environment in the Beijing–Hangzhou Grand Canal basin while identifying inhibiting factors [19], it is imperative to organically integrate all dimensions of social and economic aspects. The content of these studies does not cover the evaluation of the high-quality development of a social economy well.
In general, this paper focuses on proposing the Grand Canal cultural belt in conjunction with research on high-quality social development and guidance for social and economic development in the Fourteenth Five-Year Plan in China (2021–2025), providing innovative practical value for this field.
3. Materials and Methods
3.1. Data Sources
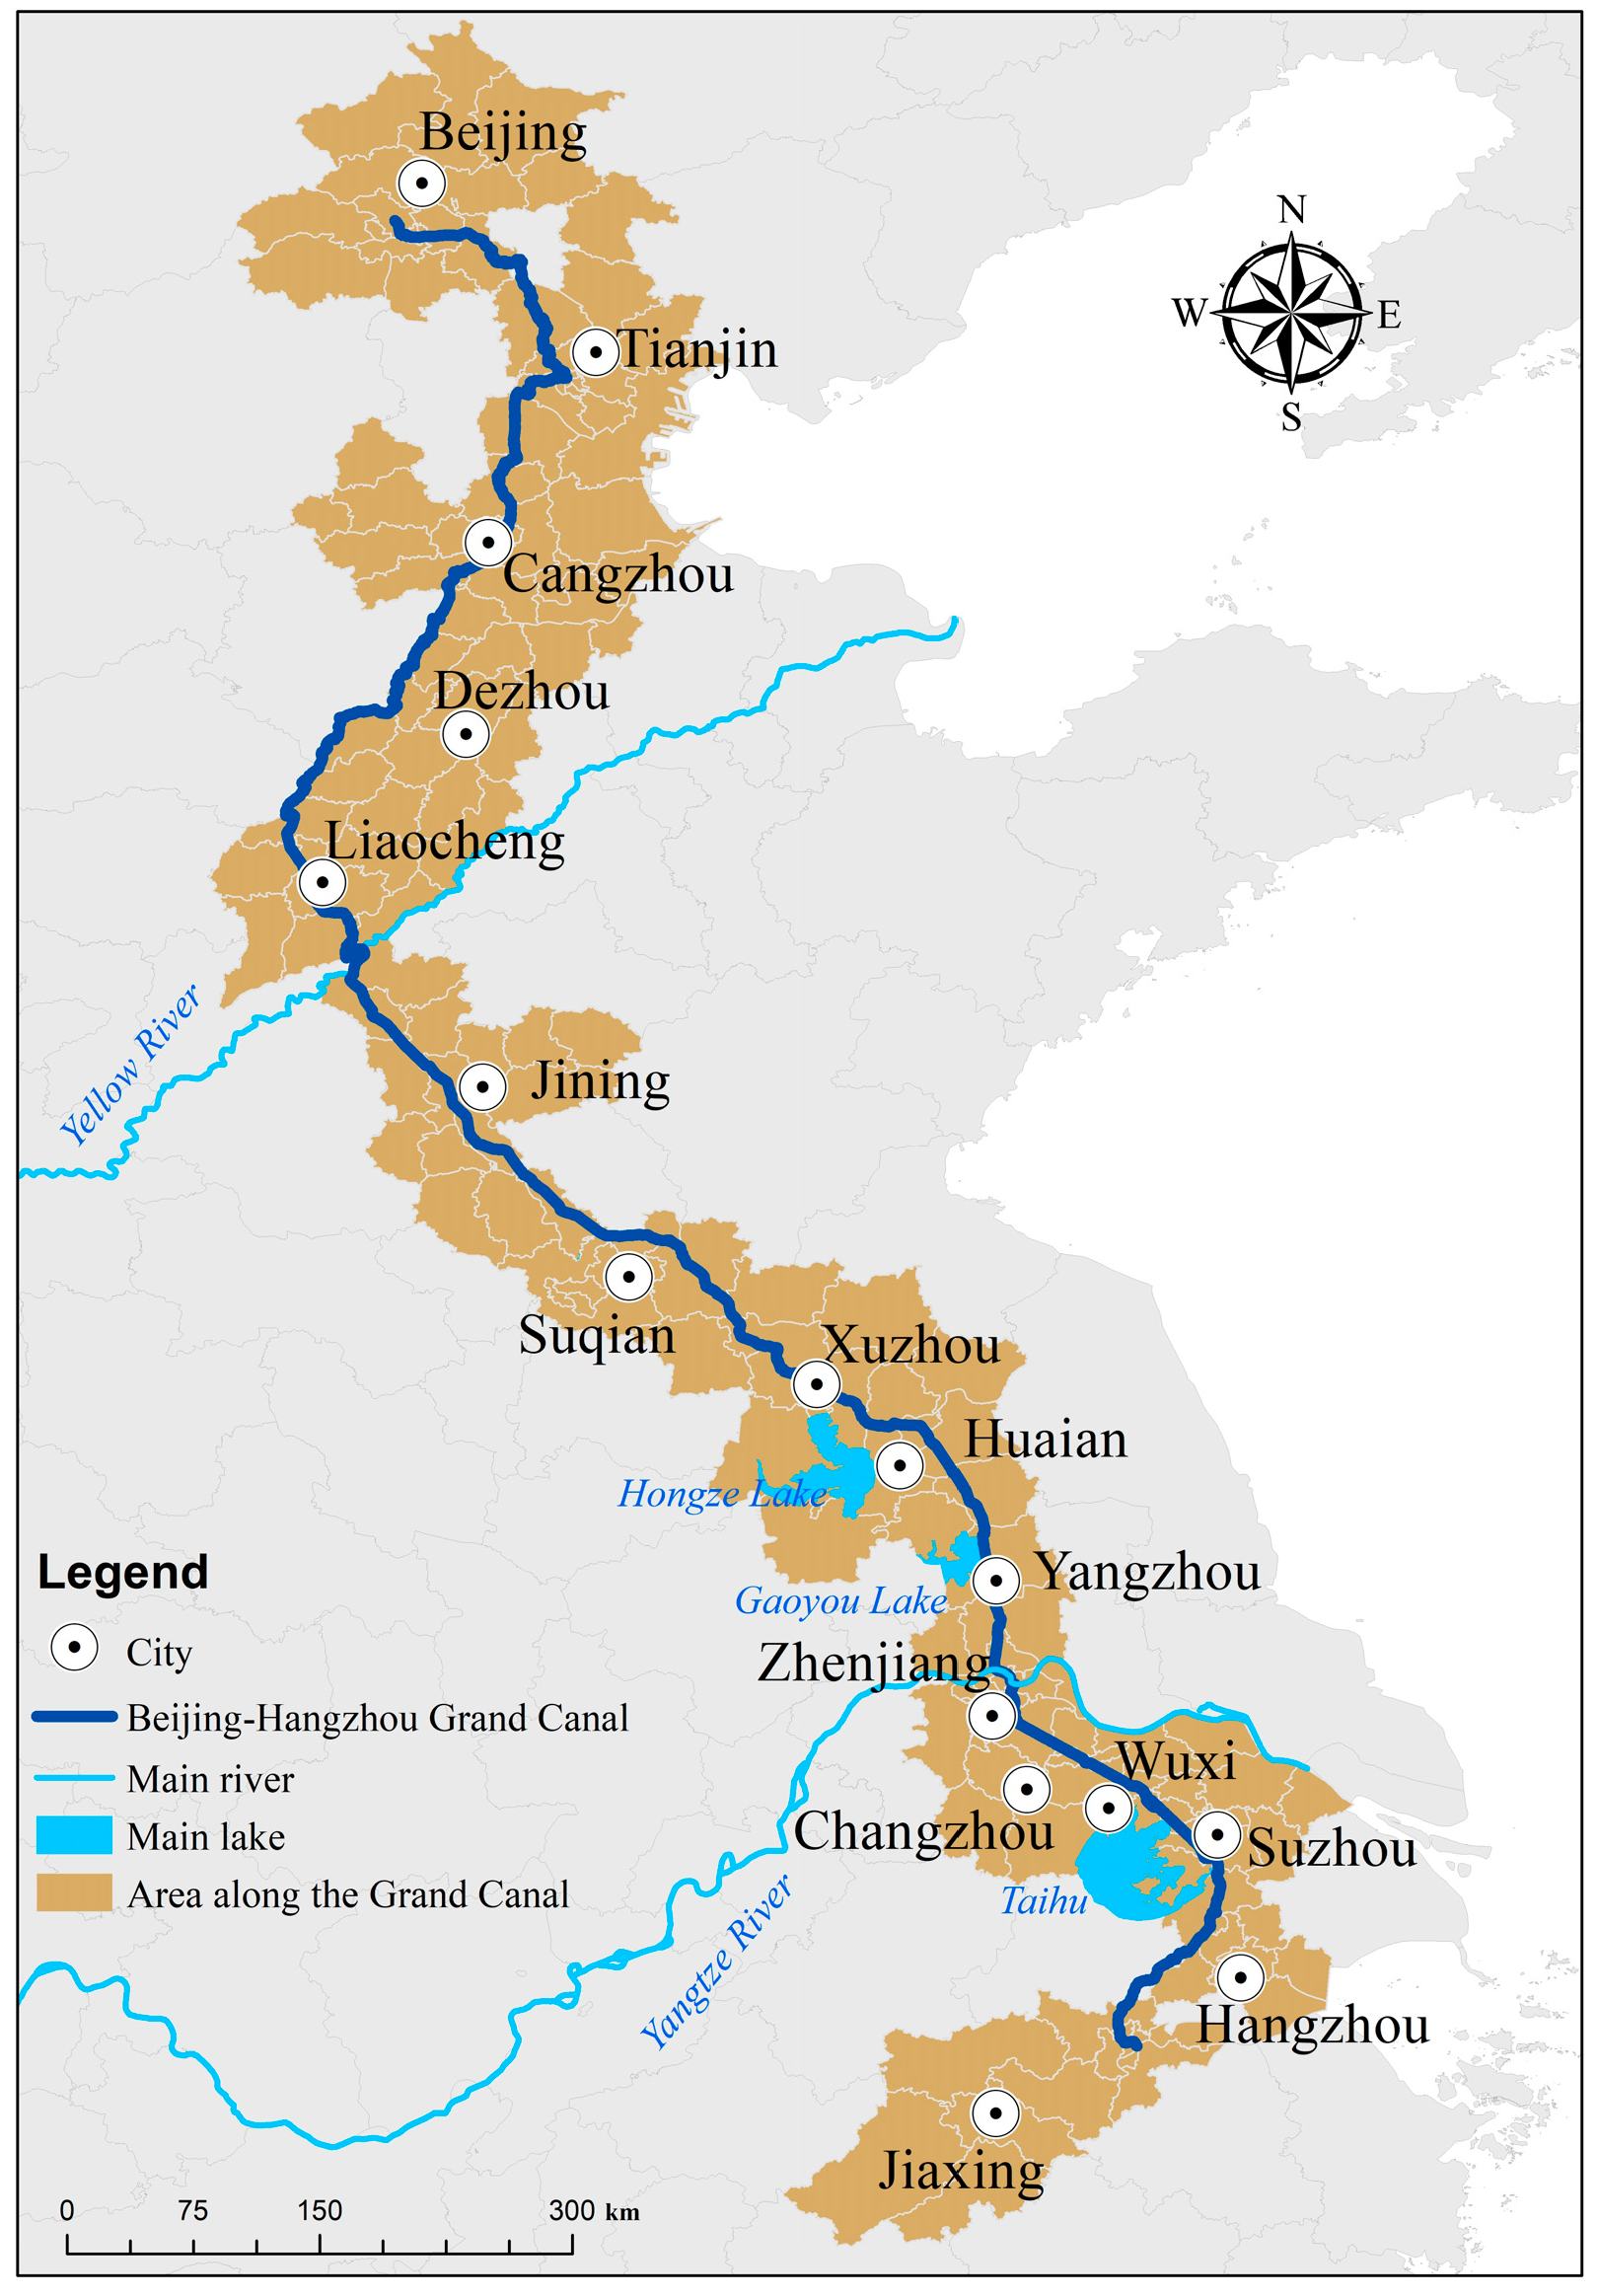
The study area for this paper encompasses the counties situated along the Beijing–Hangzhou Grand Canal, as depicted in Figure 1. It includes all the districts and counties of Beijing, Tianjin, Cangzhou, Dezhou, Liaocheng, Jining, Xuzhou, Suqian, Huai’an, Yangzhou, Zhenjiang, Wuxi, Changzhou, Suzhou, Jiaxing, and Hangzhou, as well as Dongping County in Tai’an City and Taierzhuang District in Zaozhuang City, for a total of 155 districts and counties. The following district and county administrative units had been merged or abolished, and are now unified as units in 2021: the Chong’an District, Nanchang District, and Beitang District of Wuxi City were merged to form the Liangxi District in 2015; the Qinghe District and Qingpu District of Huai’an City were merged to form the Qingjiangpu District in 2016; and the Shangcheng District and Jianggan District of Hangzhou City were merged to form the Jianggan District in 2021.
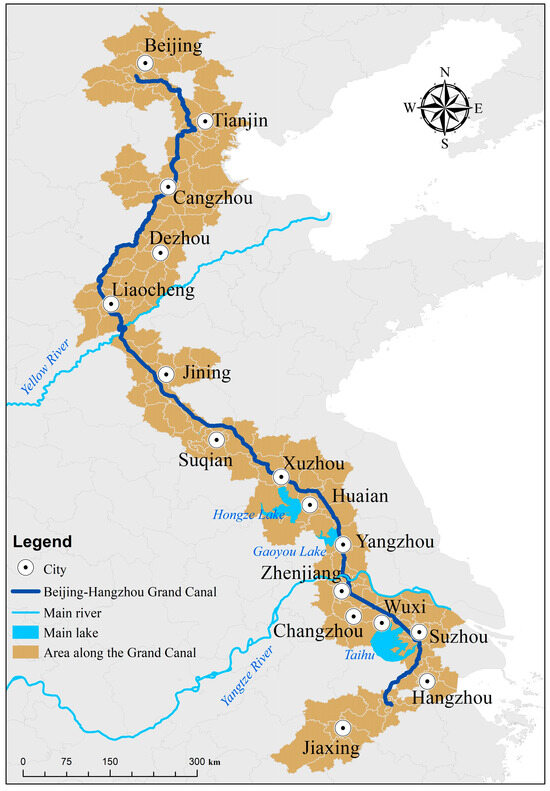
Figure 1.
Study area.
In this paper, the social and economic data of 155 districts and counties in 2011, 2016, and 2021 are collected to construct the indicator system. The data types are categorized into statistical yearbook data and luminous remote sensing data, which are mainly selected from the Statistical Yearbook, government work report, census data website, and the official website of the Bureau of Energy of each prefecture-level city, etc. The interpolation method is used to supplement the missing data of a very few areas and years. NPP-VIIRS luminous remote sensing data were obtained from the National Oceanic and Atmospheric Administration’s NOAA-affiliated NCEI National Earth Observation Group, an environmental information center under NOAA of the National Oceanic and Atmospheric Administration of the U.S.A. After removing outliers, correcting and cropping the data, the average of the pixel values of the night-light remote sensing in each district and county was obtained to reflect the level of economic development.
3.2. Methods
This study aims to investigate the application of Moran’s index and the Theil index in assessing spatial disparities within social–economic contexts. Moran’s index is a widely utilized measure of spatial auto-correlation, which evaluates patterns of data distribution in geographic space and reveals the level of interdependence among spatial units. Conversely, the Theil index is an indicator employed to quantify income inequality, commonly used to describe economic disparities between different regions or groups. As extensively recognized indicators in both spatial statistics and economics, they serve as effective tools for measuring social–economic spatial disparities.
3.2.1. Entropy Weight Method
In information theory, information entropy is used to measure the size of an uncertainty, and the entropy weighting method is a concept formed on this basis. An entropy weighting method can be used to deal with multi-indicator decision-making problems, especially in the case of mutual constraints or influences between the indicators, which can better reflect the importance and weight of each indicator. In this paper, the entropy weight method is utilized to weight the evaluation indexes, and the value of each index is regarded as a random variable, so as to find out the information entropy of the index. The calculation formula is as follows [33].
In Formulas (1) and (2), K is the number of normal, and n refers to the number of districts and counties, and the value of each district’s standardized indicator as a percentage of the sum of all district and county indicators. S takes the largest value when the probability of occurrence of each piece of information is equal, at which point entropy is maximized.
3.2.2. Moran Indices
In this paper, the spatial auto correlation analysis of ESDA is applied to describe the synergy and differences of the economies of the districts and counties in the region along the Grand Canal, and to explore the influence of spatial factors on regional inequality, and, on the basis of which, it is measured using global and local Moran indices. Global spatial auto correlation analysis is used to study the spatial distribution characteristics of the parameters in each spatial element, and the overall regional spatial correlation and spatial differences can be analyzed by calculating the global Moran’s index. The formula is as follows [34].
In Formula (3), is the observed value at district and county i, is the arithmetic mean of , and is the spatial weighted value. is positive for the spatial clustering of similar values (high or low), and negative for the spatial clustering of different values. In this paper, it is necessary to analyze the local auto correlation of the region because the positive and negative correlations of the districts and counties within the Grand Canal region may cancel each other out, and this situation may hide some factual patterns. This method can measure the local spatial correlation between each district and its surrounding districts. The formula is as follows.
In Formula (4), is the observed value at district county i and is the spatial weight matrix indicating the interaction between districts i and j. If is significantly greater than 0, it indicates that district county i has significantly less spatial inequality with its neighboring districts, and vice versa.
3.2.3. Theil Index
The Theil index, also derived from the concept of entropy in information theory, is a measure of differences within a group. It is usually used to measure the degree of inequality in the distribution of income or wealth within different regions, social groups, and economic sectors. This paper introduces the Tel index to quantify the development difference between the districts and counties within the city and the development difference of the region along the Grand Canal as a whole, and the closer its value is to one, the greater the difference and the higher the degree of inequality. The formula for calculating the Tel index is as follows [35].
In Formulas (5)–(9), and denote the overall Tel index and inter-regional and extra-regional indices, respectively; and denote the total population and combined social–economic indicators of the m district and county, respectively; Y and X denote the sum of the total population and combined indicators of all the districts and counties of the Grand Canal region, respectively; and denote the sum of the total population and combined indicators within the j district and county, respectively.
3.3. Indicator Construction
The measurement indicators for socio-economic development during the Fourteenth Five-Year Plan in China’s (2021–2025) period serve as a reliable reference for comprehensively analyzing the current state of China’s socio-economy. Considering data availability challenges and the specific circumstances in the Grand Canal region, this article has made necessary adjustments and modifications to these indicators, resulting in the refined set of indicators presented in this paper. The indicators are divided into three levels, in which the first level is defined as the comprehensive strength index of the regional economy; the second level sets the main dimensions for evaluating the regional economic and social developments in accordance with the five major parts of economic growth, livelihood benefits, green ecology, innovation drive and food guarantee; the third level is the sub-indicator level, i.e., the basic indicators, which includes thirteen indicators, such as the GDP growth rate, etc. The index system is obtained using the entropy weight method to calculate the weights of the indicators. After calculating the weights of the indicators using the entropy weighting method, the indicator system is obtained, and an example of the indicator system in 2021 is shown in Table 1 below.

Table 1.
Indicator of year 2021.
4. Analysis of the Spatial Pattern of The Current Social–Economic Situation in the Region along the Grand Canal
4.1. Characteristics of the Current Social–Economic Situation
The final values of the five sub-indicators and the total indicator values are calculated using the linear weighted summation method. The results of the indicators in 2021 are shown in Table 2.
Table 2.
Result of 2021 Year.
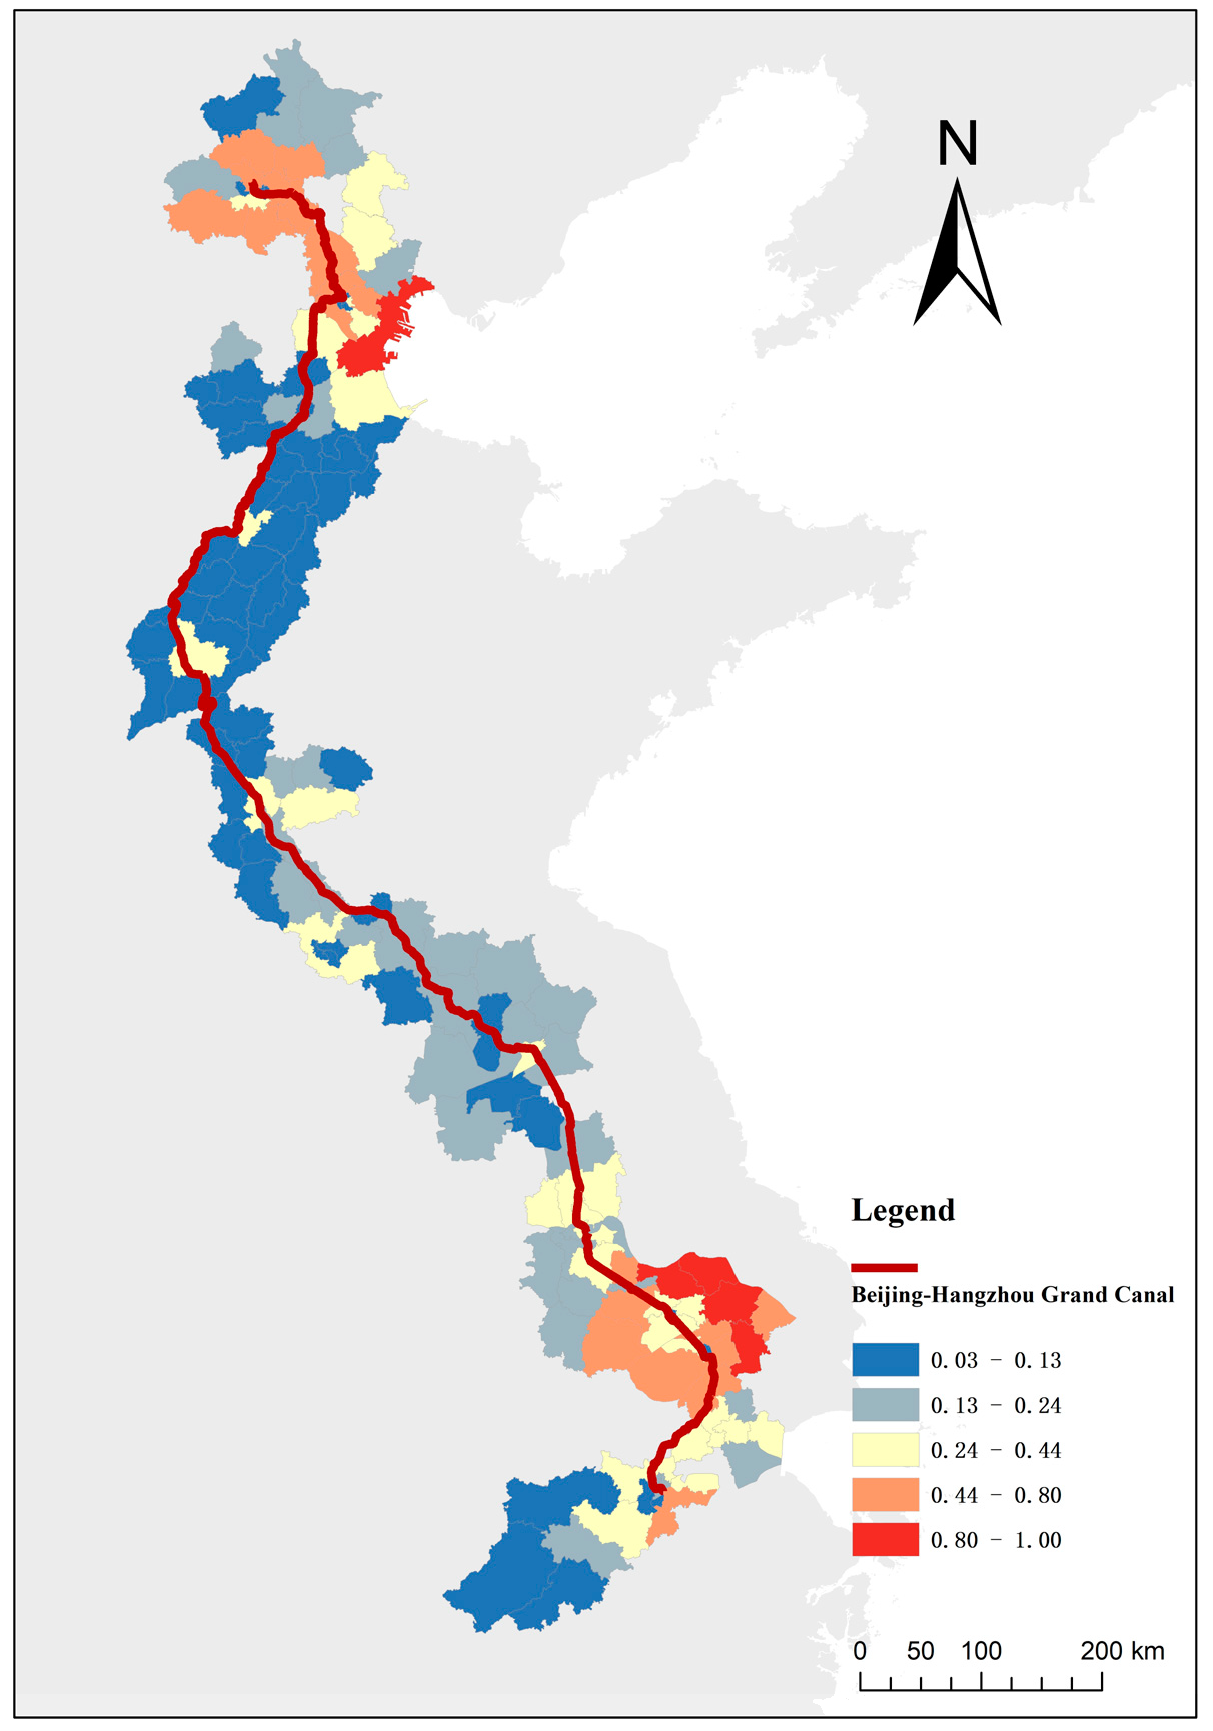
A thematic map of the distribution of total indicators for 2021 is shown in Figure 2.

Figure 2.
Thematic map of the distribution of total indicators for 2021.
In terms of comprehensive social and economic indicators, districts and counties with higher total indicators over the years are concentrated in Beijing, Tianjin, Jiangsu, and Zhejiang. Most districts and counties have a high correlation between the sub-indicators and the total indicators, i.e., districts and counties with the highest values of the total indicators also have higher values of sub-indicators, such as most districts and counties in Beijing and some districts and counties in southern Jiangsu. There are also some districts and counties where the total indicators are not outstanding, but the sub-indicators are ranked at the top, such as Tonglu County, Zhejiang Province, where the degree of greening is more prominent.
4.2. Relevance of Regional Social–Economic Status
Calculating the global Moran index for the five sub-indicators of economic growth, livelihood benefits, green ecology, innovation drive and food guarantee, as well as the total social and economic indicators is shown in Table 3 below.
Table 3.
The global Moran index for the five sub-indicators.
According to Table 3, it can be found that the Z-value of each index is greater than 1.96, which passes the test of significance, among which the Moran index of livelihood welfare is as high as 3.64, and the P-value is less than 0.01, and the Z-value is greater than 2.58, which indicates that the spatial clustering of this index is obvious, and similarly the clustering of the rest of the indexes is not obvious; however, when we look at the value of global Moran index of all the indexes, it can be found that all of them have a positive value. However, looking at the global Moran index values of all the indicators, it can be found that they are all positive, so the regional social–economic development as a whole does not show a completely stochastic state, and thus further local Moran index analyses can be carried out.
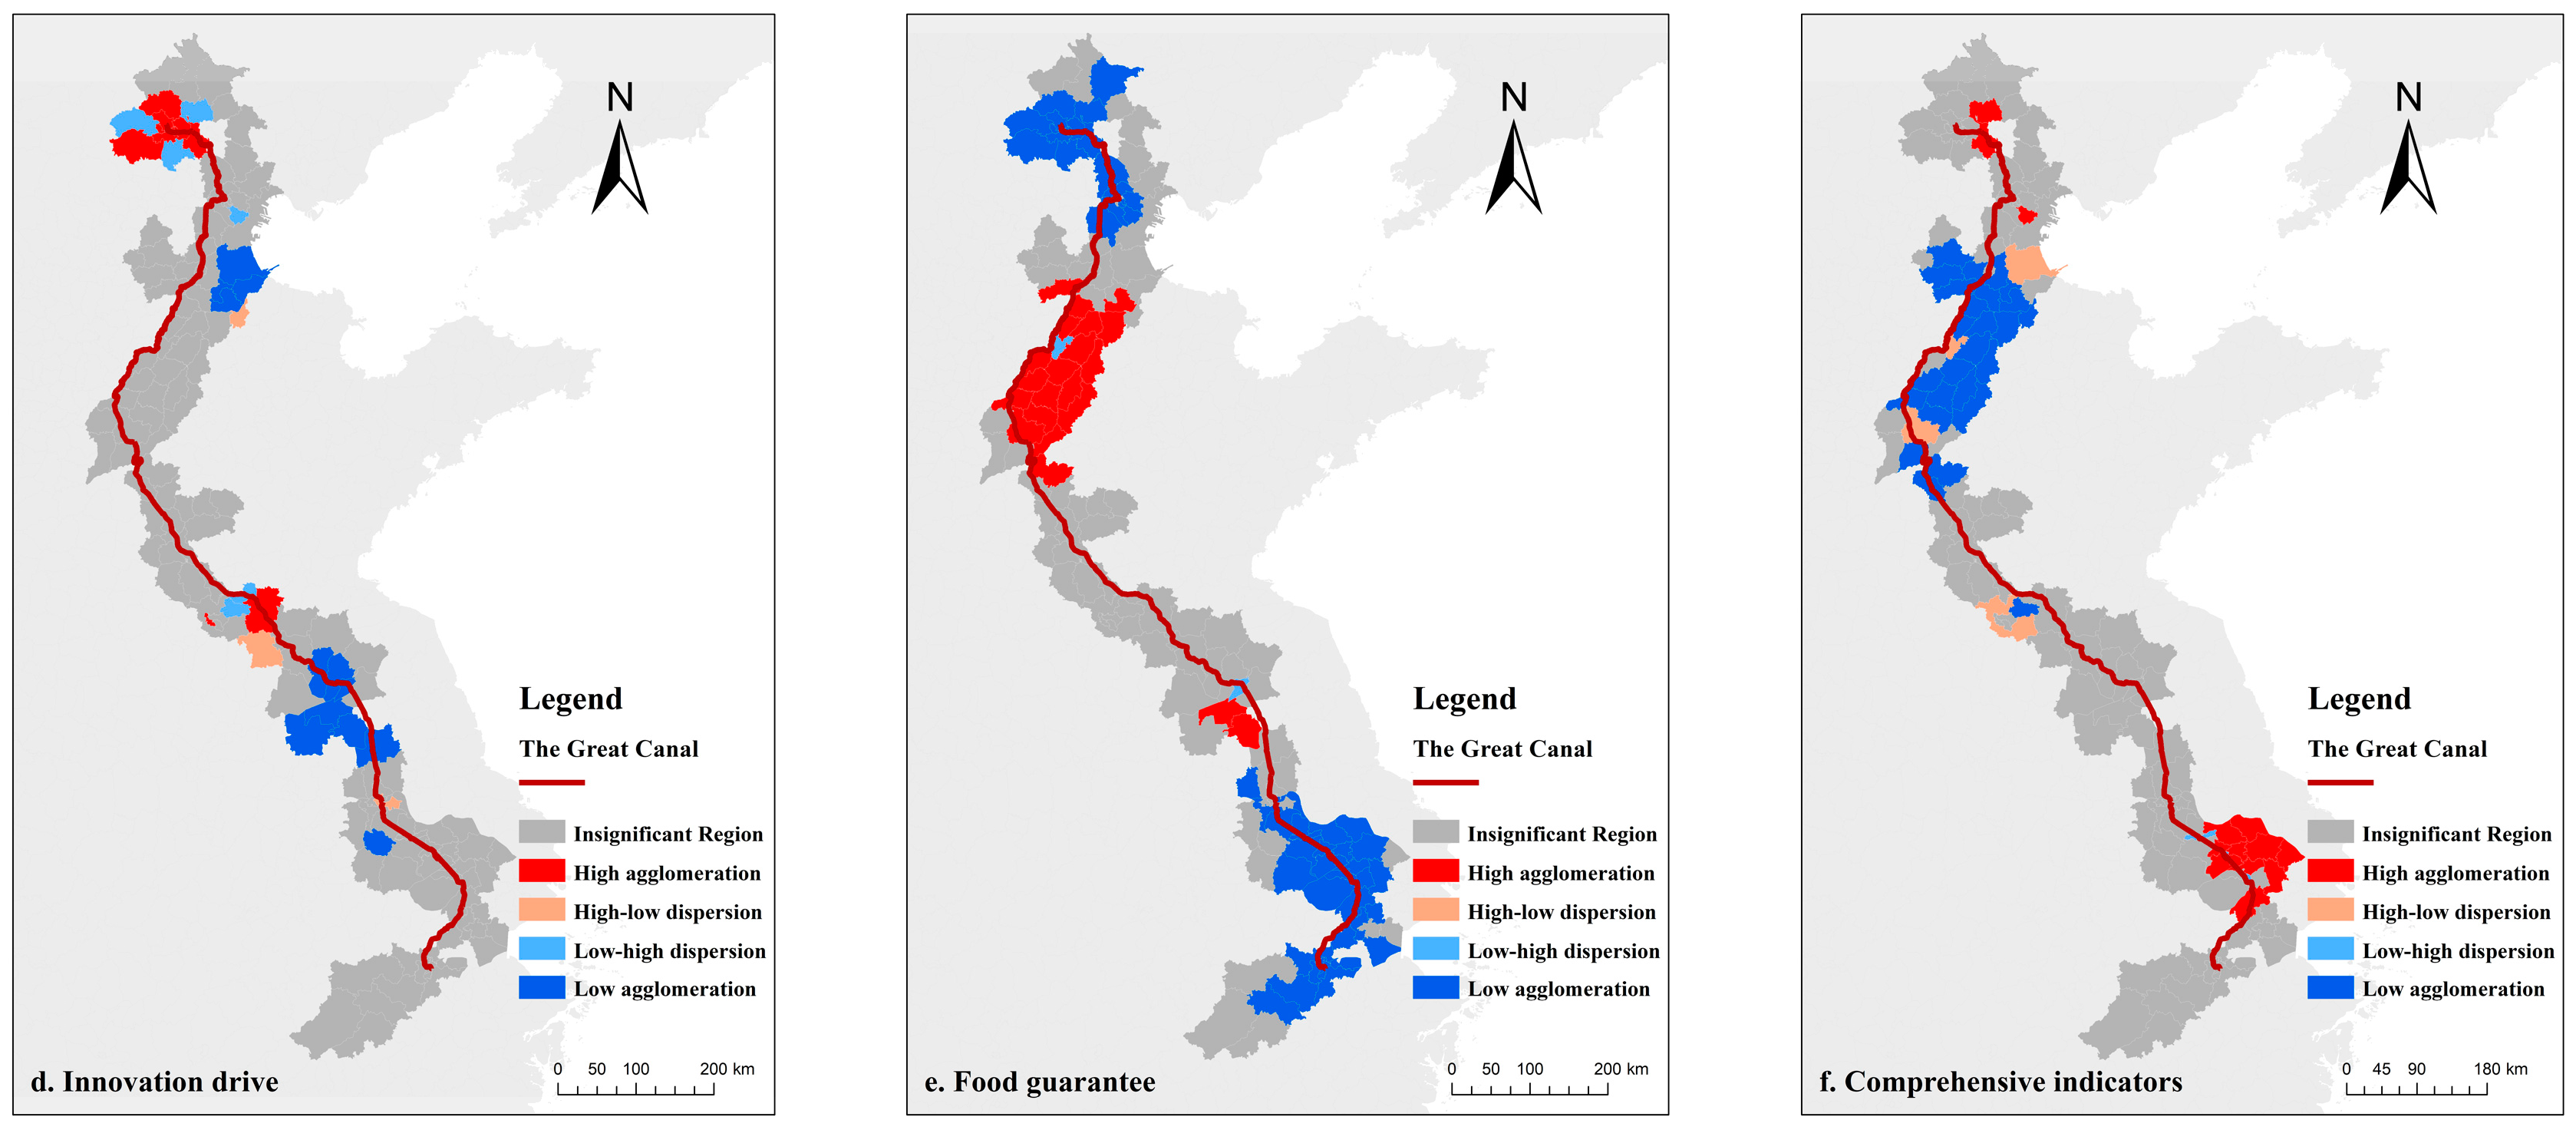
Calculation of the distribution of local Moran index for the five sub-indicators is listed in Figure 3 below. There are four different spatial auto correlation patterns: high aggregation: i.e., an area with a high value is also surrounded by an area with a high value, which is often the “focal point” of a certain geographical area, representing the existence of a significant geographical aggregation in a certain geographical area; “low aggregation”: i.e., an area with a low value is also surrounded by an area with a high value. “: that is, a smaller value of the unit and its neighboring units are also smaller; “high–low dispersion”: a higher value of the element is surrounded by a lower value of the element, this kind of spatial unit is generally the boundary of a geographical area, reflecting the existence of a significant non-uniformity of geographical phenomenon; “low–high dispersion”: this pattern is the opposite of the previous one, and this type of spatial unit is usually a transition zone within an area, reflecting the existence of significant geographical non-equilibrium in the territory.
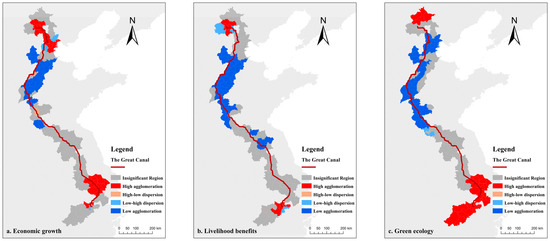
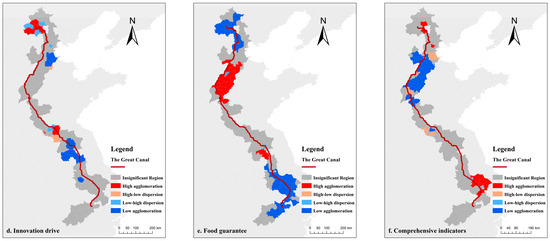
Figure 3.
Thematic map of the localized Moran index in 2021 for sub-indicators and aggregate indicators. (a) Economic growth, (b) livelihood benefits, (c) green ecology, (d) innovation drive, (e) food guarantee, and (f) comprehensive index.
From the results of the local Moran index in Figure 3. and Table 4. above, it is known that the hotspots for economic development are mainly located in the southern Suzhou (Suzhou-Wuxi junction area) and Beijing; the sub-hotspots are more widely distributed, mainly in the Xuzhou and Yangzhou–Zhenjiang junction area, and they show a pattern of diffusion; the cold spots are mainly located in the northern part of the Dezhou, Liaocheng, and Cangzhou; the hotspots for livelihood benefits are centered in Beijing and Tianjin, with cold spots in Cangzhou City in the southeast part of the district and some counties in the north of Jiangsu Province; green ecology hotspots are concentrated in the two cities in southern Jiangsu Province, Zhejiang province, and Beijing, and cold spots are distributed in the south of Tianjin and Jiangsu Province, north of the majority of districts and counties; innovation-driven hotspots are concentrated in Hangzhou, Zhejiang province, and Beijing City, and their cold spots are distributed in the south of Tianjin and Jiangsu province north of the majority of districts and counties; food guarantee hotspots concentrated in Shandong province and Hebei province, and their cold spots zones are concentrated in Beijing and Tianjin and some districts and counties in southern Zhejiang and Suzhou.
Table 4.
The local Moran index.
From Figure 3, from the distribution pattern of hot and cold spots in indicator values, it is evident that the districts and counties identified as hot and cold spots for food guarantee indicators exhibit opposite results to the remaining four indicators. The distribution of hot and cold spots for economic development, green ecology, and comprehensive indicators are most similar, indicating their relevance to the total indicator. This suggests that with increasing promotion of green ecological policies such as a “dual-carbon strategy,” green development has become a crucial element supporting scientific and high-quality socio-economic growth in 2021.
From the distribution pattern of districts and counties, districts and counties in Beijing, Tianjin, Southern Jiangsu, and Zhejiang are distributed as hotspots in most indicators, while districts and counties in Shandong, Hebei, and Northern Jiangsu are mostly distributed as cold spots, which indicates that Beijing–Tianjin and the Yangtze River Delta urban agglomeration are still playing a significant positive economic radiation-driven role, while the positive driving role of other areas is not obvious.
Combined with the distribution patterns of hot and cold spots for the above indicators and counties, many areas in the Hebei and Shandong provinces are livelihood-benefit cold-spot areas, and they will need to improve people’s health and lives in the future by improving early-childhood education, the public health system, expanding health insurance coverage, and deepening pharmaceutical reforms. In addition, in the 14th Five-Year Plan’s discussion on urban green ecology, promoting the green and low-carbon development of urban agglomerations, strengthening ecological environmental protection, resource conservation and utilization, and realizing the sustainable development of urban agglomerations are promoted. In the above results, it can be concluded that the green development indicators of other areas except Beijing, Zhejiang, and Southern Jiangsu are all cold-point areas, and the corresponding areas should increase the regulation of their energy structure, develop environmentally friendly industries, and accelerate their development of an environmentally friendly economy so as to make the development of the economy, society, and ecology promote one another.
5. Analysis of the Spatial and Temporal Evolution of Regional Social–Economics along the Grand Canal
5.1. Analysis of Regional Correlation Evolution
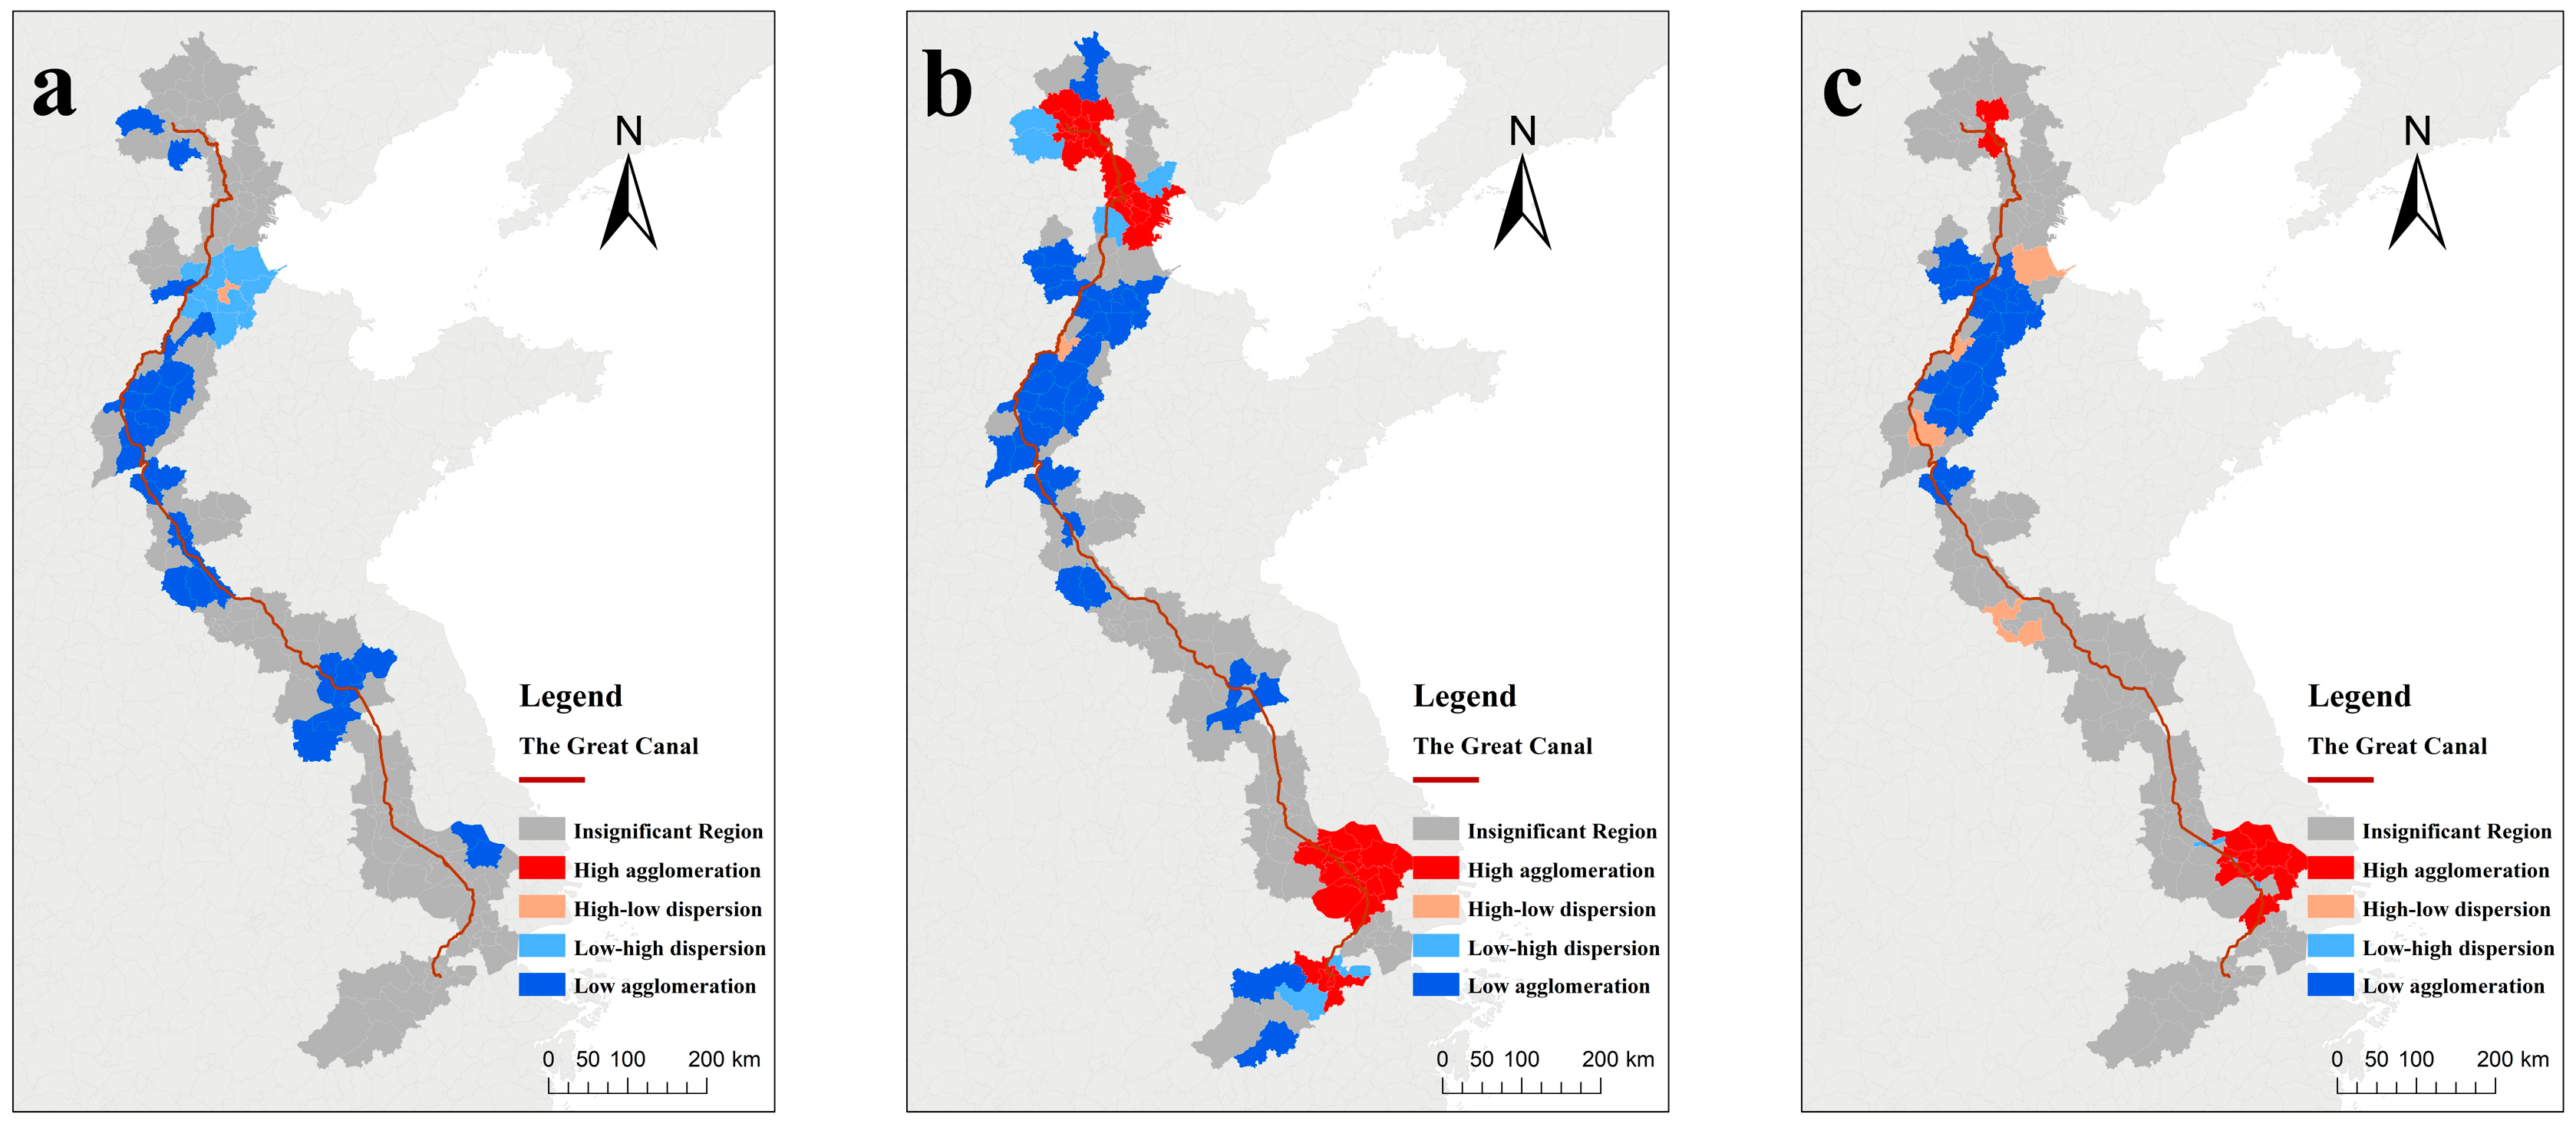
The scores of the global and local Moran index of the comprehensive index of each district and county are shown in Table 5 and Figure 4 below, which show that the global Moran index shows a rising trend year by year, indicating that the degree of aggregation of regional social–economic development along the Grand Canal has been gradually strengthened, but the significance of aggregation fluctuates greatly, and there is no obvious trend of enhancement.
Table 5.
Calendar year global Moran index values.
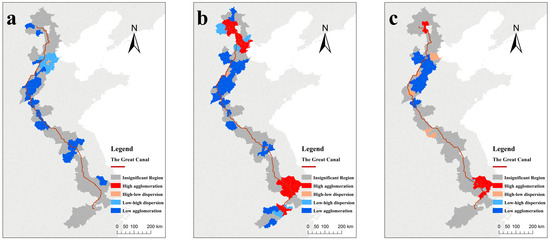
Figure 4.
Thematic maps of localized Moran’s index for total indicators over the years: (a) localized Moran’s index for 2011, (b) localized Moran’s index for 2016, and (c) localized Moran’s index for 2021.
In terms of the local Moran index, the number of districts and counties with “high–high” and “low–low” types of economic development patterns along the Grand Canal is relatively large. In the three years of 2011, 2016 and 2021, the “high–high” type of districts and counties accounted for about 0.7%, 11.2%, and 21.2% of the total number of districts and counties, respectively, with a clear trend of an increase in number; the “low–low” type of districts and counties accounted for about 24.2%, 21.2%, 21.2%, 21.2%, and 24.2%, respectively, of the total number of districts and counties, respectively. In total, 24.2%, 21.2%, and 16.7% of the total number of “low–low”-type zones, respectively, with an obvious decreasing trend. In terms of the localized spatial distribution structures, “high–high”-type areas are mainly distributed in Hebei province, and the spatial pattern of this part of the area has not changed much, while Cangzhou City and Suqian City have a better momentum of economic development, and their correlation with the surrounding areas has obviously increased. The higher the comprehensive economic indicators, the higher the rate of economic development, and the more obvious the diffusion effect is on the surrounding areas. Therefore, the areas with agglomeration development show stronger economic radiation and a driving effect on the surrounding areas, thus constituting a pattern of co-development, and the more developed the area, the more it tends to agglomerate. The “low–low”-type areas are mainly distributed in the south of Liaocheng and Dezhou City, accounting for about 20.7%, 19.3%, and 16.8% of the total number of areas in the three years of 2011, 2016, and 2021, respectively, with a clear trend of reduction in terms of the number of areas, which indicates that the situation of agglomeration in areas with a lower level of economic development has improved.
5.2. Analysis of the Evolution of Regional Differences
We calculated the Theil index of five sub-indicators and the total indicators of the districts and counties along the Grand Canal in 2011, 2016, and 2021, and we analyzed the regional differences of the 16 cities as 16 areas, and we found the differences between the areas, the differences within the areas, and the overall differences over the three years. The results are shown in Table 6 below.
Table 6.
The Theil index values.
Considering the current state of urban agglomerations in China and their geographical locations, the study area will be divided into three areas for analysis using the Theil index here. Analyzing using the total index of the Theil index, it is easy to find that, in terms of different areas, the counties in the Beijing–Tianjin–Hebei area generally show a trend of “falling to rising, but generally declining”, i.e., the Theil index in 2011–2016 shows a declining trend, while the Theil index in 2016–2021 shows an upward trend, which indicates that the differences in the level of comprehensive social and economic development between different counties within the Beijing–Tianjin–Hebei area narrow in one period and expand in the latter period. This indicates that the difference in the level of comprehensive social–economic development between different districts and counties within the Beijing–Tianjin–Hebei area narrows in the first period of time, while the difference in the level of the latter period of time expands. The pattern shown using the Theil index can be verified with the raw indicators.
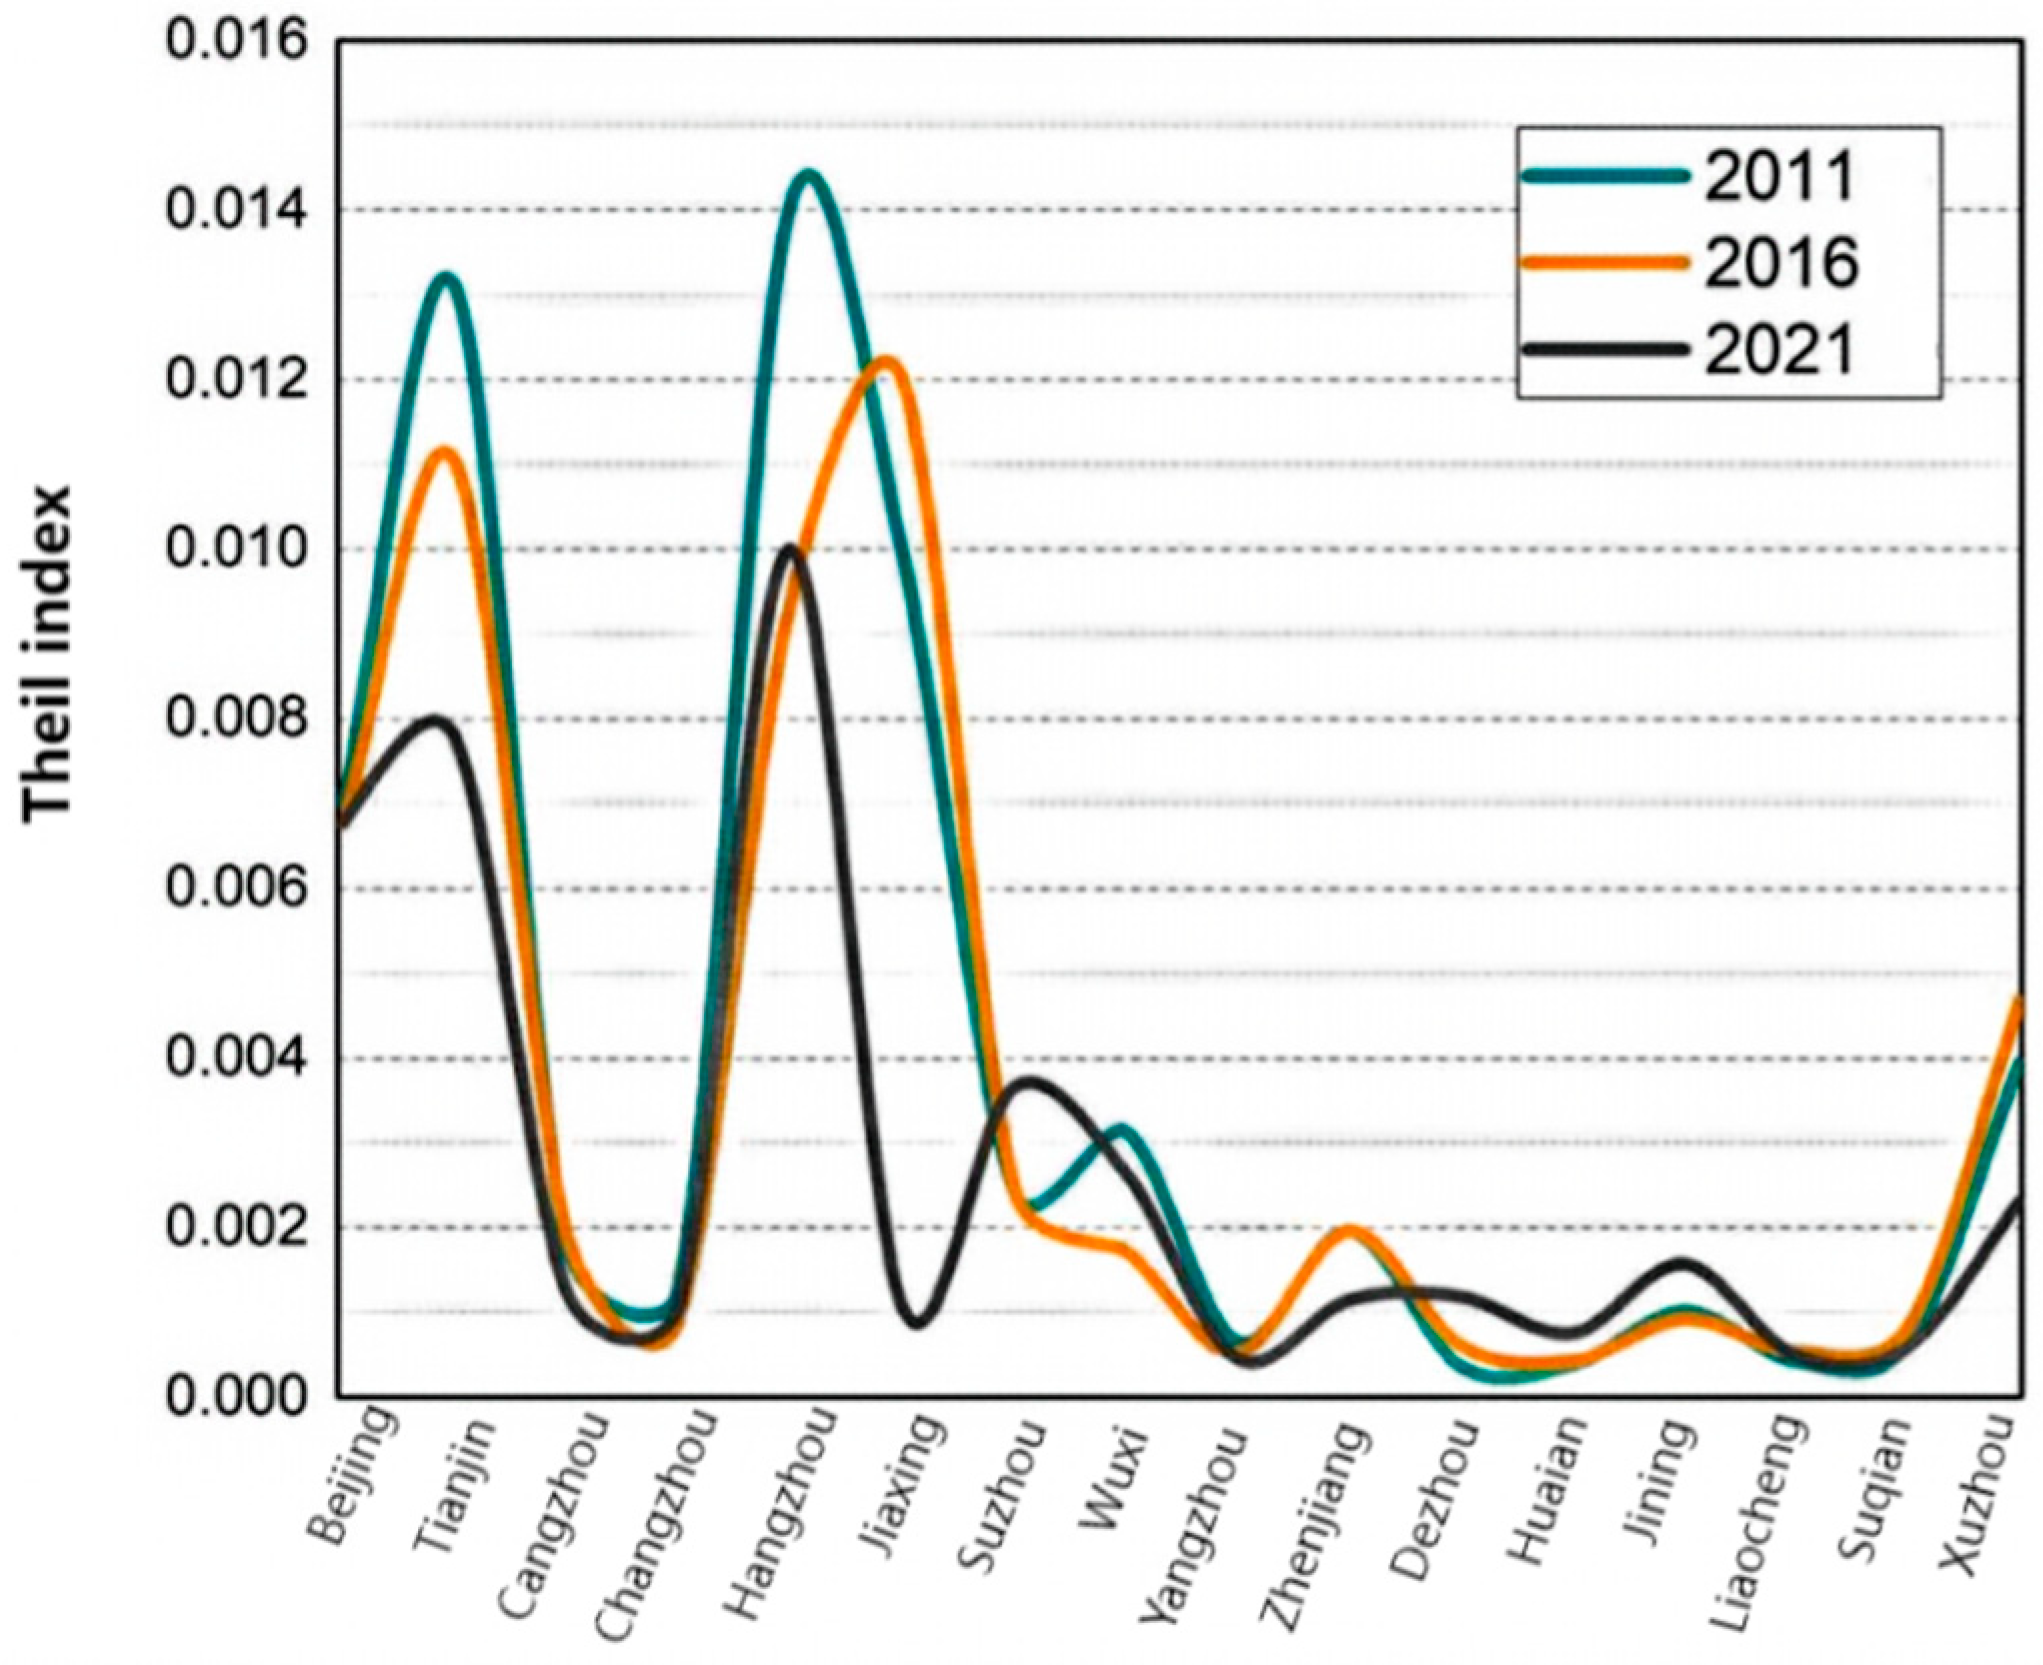
In 2011, the highest district in the Beijing–Tianjin–Hebei was about 16 times higher than the lowest district in the index, while in 2016 it was 9 times higher, and in 2021 it was about 14 times higher. The Theil index of the Shandong and northern Jiangsu and Zhejiang and southern Jiangsu, both showed a decreasing trend in the ten years of the study, which indicates that the differences in the comprehensive social and economic indices of the districts and counties in the two areas gradually became smaller in this period and composite index differences gradually became smaller. Throughout the three years of data, the Theil index of Shandong and northern Jiangsu is generally smaller than the other areas, and the decline rate of the Theil index is generally higher than that of Zhejiang and southern Jiangsu, indicating that the regional-development imbalance in Shandong and northern Jiangsu is generally less pronounced than that of the other two across all the years, and that the regional imbalance is eliminated at a faster rate than that of the other two areas. In terms of different years, as shown in Figure 5, the Theil indexes of cities in 2011 were generally higher than those of later years, with the three-year trend of index changes in Tianjin, Hangzhou, and Jiaxing being obvious, and the three-year changes in Yangzhou and Suqian being not obvious.
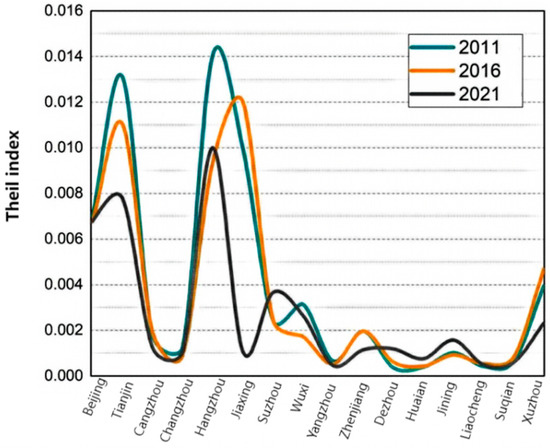
Figure 5.
Trends in the Theil index.
As far as specific cities are concerned, there are different development patterns in the evolutionary patterns of developmental differences between districts and counties within each city, and cities with the same pattern are not geographically neighboring, but are at the same developmental level within their respective city clusters. In this paper, each city is divided into three development patterns according to the similarity and heterogeneity of the changes using the Theil Index. The first pattern comprises Beijing, Jining, Wuxi, Changzhou, and Hangzhou. Intra-regional differences among these cities exhibit a tendency of a shrinking-then-expanding trend with an overall reduction. Conversely, Cangzhou, Jiaxing, Suqian, Liaocheng, Zhenjiang, and Xuzhou demonstrate an expanding-then-shrinking trend with an overall reduction. Tianjin is characterized by Suzhou and Yangzhou as well as Tianjin, demonstrating a shrinking pattern. It is found that the cities in Mode 1 “shrinking-then-expanding trend with an overall reduction” belong to the city cluster in which cities are located with higher rankings in the overall social–economic index, for example, Beijing, Jining City, Wuxi City, Changzhou City, and Hangzhou City are, respectively, the Beijing–Tianjin–Hebei area, and the Shandong Peninsula City Cluster, the South Jiangsu province, and Zhejiang province are the areas with a higher overall ranking. The cities in Mode 2 “expanding year by year” are all in the middle rank of the social–economic index of the city cluster in which they are located, while the cities in Mode 3 “expanding first and then shrinking” are in the lower rank. This shows that the Grand Canal has not yet formed a truly synergistic regional development, and the internal regional differentiation is relatively obvious.
The development differences between the five cities in the middle of their respective areas, namely Tianjin, Suzhou, Yangzhou, Dezhou, and Huai’an, are widening year by year. The development differences between the five cities can be narrowed by improving the coverage and quality of public service facilities such as education, healthcare, and culture in each district and county, and by improving the accessibility of public services for the residents of each area, so as to converge with the leading cities in their respective areas.
6. Conclusions and Discussion
6.1. Conclusions
This paper studies the current situation and evolutionary characteristics of the social–economic spatial pattern of the region along the Grand Canal, and mainly reaches the following research conclusions:
The social and economic indicators are designed for five dimensions, which effectively measure the economic status of the districts and counties and the whole region, and, therefore, can be used as the basis for studying the regional spatial pattern. Some districts and counties, such as Tonglu County in Zhejiang province, ranked high in terms of their degree of greening, which is more prominent than the overall indicators.
Districts and counties in the region along the Grand Canal are clustered in their numerical distribution of comprehensive economic indicators, and the region along the Grand Canal has not yet formed a good synergistic development pattern. However, from the perspective of the evolution of the social–economic spatial pattern in the decade of 2011–2021, the number of hotspots for overall economic development is experiencing an increasing trend, and the momentum of agglomeration development has been strengthened increasingly evidently. From an overall perspective, the development of a regional economy will promote the economic development of neighboring areas through the spillover effect. The degree of comprehensive development of Zhejiang and Southern Jiangsu compared to the northern areas of the organization and traction of the Grand Canal regional economy is more evident, and the northern areas need to strengthen the role of the core city’s economic radiation.
The development differences between districts and counties within some cities have similar evolutionary patterns, and these cities are not geographically adjacent to each other, but they are cities with similar development statuses and the same level of comprehensive economic indicators in their respective areas, which suggest that there are similar development patterns between different cities and that cities with similar patterns can learn from each other and strive to achieve high-quality development over the next five years or even longer, moving towards the common goal of prosperity.
The Beijing–Hangzhou Grand Canal spans over 1600 km from north to south in China, connecting counties with significant differences in their economic development. As an ancient aspect of the cultural heritage of China, the construction of the Grand Canal Cultural Belt undoubtedly recognizes the potential and value of regional coordinated development. Based on the research findings presented in this article, there is a certain degree of agglomeration observed in the social and economic development along the Grand Canal at the county level. However, distinct disparities exist between hotspots and cold spots within this region. On one hand, this region still has some progress to make before achieving high-quality development; on the other hand, it continues to adhere to traditional patterns and circles without fully capitalizing on the construction of the Grand Canal Cultural Belt for coordinated development purposes. The “14th Five-Year Plan” emphasizes further realization of the economic, cultural, and ecological functions of the Grand Canal in driving regional development along its route. Building upon insights into agglomeration patterns in economic development and changes in regional economic disparities as revealed in this study, the relevant counties can break away from their existing models and effectively utilize resources such as ecology, tourism, and livelihood benefits along the Grand Canal route. By forming partnerships with other counties within this region, they can collectively work towards narrowing down developmental disparities.
6.2. Discussion
The study of the spatial pattern of the comprehensive social and economic development level of the region along the Grand Canal is an important part of the promotion of the bhigh-quality development of the Grand Canal region in the new era. This paper has analyzed and studied the characteristics and laws of the economic spatial pattern of the Grand Canal region, but there are still many problems to be further improved as follows.
The indicators designed in this article have taken into account the connotation of China’s high-quality social development and the discussions in the 14th Five-Year Plan. They are relatively comprehensive, and they are integrated indicators of the current research on the socio-economic aspects of the Grand Canal. However, there are still aspects that need further improvement. The innovation indicators and security indicators only contain one sub-indicator each, so the indicators needs to be strengthened and completed.
This paper only discusses the current situation of the social–economic development of the Grand Canal and the evolution of the patterns in the past ten years, but it does not study the driving factors behind it, and the related manmade and natural influencing factors are also worth studying.
Author Contributions
Conceptualization, D.H. and L.K.; data curation, methodology and writing—original draft, D.B. and B.H.; writing—review and editing, D.B. and M.Z. All authors have read and agreed to the published version of the manuscript.
Funding
This work is supported by the Water Conservancy Science and Technology Program of Jiangsu province (2022065), National Natural Science Foundation of China (42271423), the Think Tank Special Research Project of the Research Institute for the Construction of the Grand Canal Cultural Belt (DYH19ZD01), and the National Social Science Foundation of China (20BZS110).
Data Availability Statement
The data presented in this study are available upon request from the corresponding authors.
Acknowledgments
The authors would like to thank the anonymous reviewers and the editor for their very insightful suggestions that helped to improve the quality of this paper.
Conflicts of Interest
Authors Bingbing Huang and Mengying Zhang were employed by the Jiangsu Surveying and Design Institute of Water Resources Co., Ltd. The remaining authors declare that the research was conducted in the absence of any commercial or financial relationships that could be construed as potential conflicts of interest.
References
- Wang, W.; Chen, Y.; Wang, X.W. A study on spatial-temporal patterns of regional development disparities in Yangtze River Economic Zone. Resour. Environ. Yangtze Basin 2017, 26, 1489–1497. [Google Scholar]
- Rozelle, S. Rural industrialization and increasing inequality: Emerging patterns in China’s reforming economy. J. Comp. Econ. 1994, 19, 362–391. [Google Scholar] [CrossRef]
- Yu, L.; Jiang, Y.T. Spatial and Temporal Analysis on the Regional Economic Disparities in China: Based on the Comparison between the Whole Country and Three Megalopoleis. J. Financ. Econ. 2007, 33, 18–29. [Google Scholar]
- Yang, H.; Liu, J.; Wang, T. Analyzing economic spatial-temporal disparities at county level in Yangtze River Delta based on ESDA-GIS. In Advanced Research on Electronic Commerce, Web Application, and Communication, Proceedings of the International Conference, ECWAC 2011, Guangzhou, China, 16–17 April 2011; Springer: Berlin/Heidelberg, Germany, 2011; pp. 185–191. [Google Scholar]
- Lu, M.; Wang, E. Forging ahead and falling behind: Changing regional inequalities in post-reform China. Growth Chang. 2002, 33, 42–71. [Google Scholar] [CrossRef]
- Zhang, Z.; Hu, Z.; Zhong, F.; Cheng, Q.; Wu, M. Spatio-Temporal Evolution and Influencing Factors of High Quality Development in the Yunnan–Guizhou, Region Based on the Perspective of a Beautiful China and SDGs. Land 2022, 11, 821. [Google Scholar] [CrossRef]
- Yang, G.; Ma, X. Spatial and temporal difference of county economy development level in Jiangsu Province during 2005–2015. In Journal of Physics: Conference Series; IOP Publishing: Bristol, UK, 2018; Volume 1087, p. 032009. [Google Scholar]
- He, S.; Liao, F.H.; Li, G. A spatiotemporal analysis of county economy and the multi-mechanism process of regional inequality in rural China. Appl. Geogr. 2019, 111, 102073. [Google Scholar] [CrossRef]
- Liu, T.; Zhou, B. Evaluation and obstacle factors of high-quality development in coastal cities along the Yangtze River. Ocean Coast. Manag. 2023, 244, 106818. [Google Scholar] [CrossRef]
- Li, H.; Wei, Y.D.; Swerts, E. Spatial inequality in the city-regions in the Yangtze River Valley, China. Urban Stud. 2020, 57, 672–689. [Google Scholar] [CrossRef]
- Pak, M.S. Study on the Economic Development of Suez Canal Region with the Opening of Suez Canal. J. Mediterr. Area Stud. 2008, 10, 1–32. [Google Scholar]
- Chen, M.; Wang, J.; Sun, J.; Ye, F.; Zhang, H. Spatio-Temporal Distribution Characteristics of Intangible Cultural Heritage and Tourism Response in the Beijing–Hangzhou Grand Canal Basin in China. Sustainability 2023, 15, 10348. [Google Scholar] [CrossRef]
- Yang, J.; Hu, D.; Chen, Z.; Xu, Y.; Zou, Z.; Zhu, Y. Analysis of Spatial and Temporal Distribution Patterns of Traditional Opera Culture along the Beijing–Hangzhou Grand Canal. ISPRS Int. J. Geo-Inf. 2023, 12, 477. [Google Scholar] [CrossRef]
- Zhang, S.; Liu, J.; Pei, T.; Chan, C.S.; Wang, M.; Meng, B. Tourism value assessment of linear cultural heritage: The case of the Beijing–Hangzhou Grand Canal in China. Curr. Issues Tour. 2021, 26, 47–69. [Google Scholar] [CrossRef]
- Zhang, F.; Yang, L.; Luo, X. A Study on the Distribution and Utilization of Recreational Resources along the Grand Canal Culture Belt. Chin. J. Urban Environ. Stud. 2023, 7, 1950015. [Google Scholar] [CrossRef]
- Shi, F.; Lu, Y.; Wu, F.; Wang, C.; Hsu, W.L. Evaluation of Green Cities in the Drainage Area of China’s Beijing–Hangzhou Canal. Water 2021, 13, 2145. [Google Scholar] [CrossRef]
- Huang, Y.; Yang, S. Spatio-temporal evolution and distribution of cultural heritage sites along the Suzhou canal of China. Herit. Sci. 2023, 11, 188. [Google Scholar] [CrossRef]
- Zhao, Y.; Bian, G.; Sun, T.; Yan, J. The In-Situ Spatial-Temporal Evolution of the Settlement Space along the Grand Canal Tianjin Section from the Perspective of Cultural Heritage. Land 2023, 12, 1023. [Google Scholar] [CrossRef]
- Zhang, Y.; Tian, Q.; Wu, J. Coupling coordination degree and obstacle factors between the tourism industry and ecological environment in the Beijing-Hangzhou Grand Canal Basin, China. Environ. Dev. Sustain. 2023, 26, 2589–2613. [Google Scholar] [CrossRef]
- Tong, D. The Mechanism of Ecological and Cultural Collaborative Construction of the Beijing Hangzhou Grand Canal Cultural Belt. In Proceedings of the 2022 6th International Seminar on Education, Management and Social Sciences, Suzhou, China, 25–26 June 2022; pp. 557–565. [Google Scholar]
- Pan, S.; Ren, G.; Ma, Y.; Zhang, J.; Tong, D. The inheritance and coordinated utilization of intangible cultural heritage in the Beijing-Tianjin-Hebei section of the Beijing-Hangzhou Grand Canal. In Proceedings of the 2nd International Conference on Public Relations and Social Sciences (ICPRSS 2022), Changsha, China, 23–25 September 2022; EDP Sciences: Les Ulis, France, 2022; Volume 148. [Google Scholar]
- Cheng, Z.; He, J.; Li, Y.; Zhu, Y.; Dai, J. Coupling-Coordinated Development of the Water-Economy-Innovation Nexus: A Case Study of the Grand Canal Area in China. J. Water Resour. Plan. Manag. 2023, 149, 05023016. [Google Scholar] [CrossRef]
- Sun, J.; Yi, S. The Construction of the Grand Canal Cultural Belt and the Remodeling of China’s Regional Spatial Patterns. Nanjing J. Soc. Sci. 2019, 1, 11–16+33. [Google Scholar] [CrossRef]
- Hua, X.; Lv, H.; Jin, X. Research on High-Quality Development Efficiency and Total Factor Productivity of Regional Economies in China. Sustainability 2021, 13, 8287. [Google Scholar] [CrossRef]
- Cao, J.; Wang, S.; Fan, X.; Yang, X.; Zheng, H. Correlation analysis of regional carbon emission intensity and green industry development-A case study of Chengdu-Chongqing region. Heliyon 2023, 9, e21683. [Google Scholar] [CrossRef]
- Pei, Z.J.; Chong, P.; Ma, L.S. Macroeconomic uncertainty, high-level innovation, and urban green development performance in China. China Econ. Rev. 2019, 55, 1–18. [Google Scholar]
- Shang, F.L. Liang Shan Prefecture’s Excellent Traditional Culture Boosts Regional High-Quality Development. Acad. J. Humanit. Soc. Sci. 2021, 4, 76–80. [Google Scholar]
- Wang, D.; Zhang, E.; Liao, H. Does Fiscal Decentralization Affect Regional High-Quality Development by Changing Peoples’ Livelihood Expenditure Preferences. Provincial Evidence from China. Land 2022, 11, 1407. [Google Scholar] [CrossRef]
- Zhao, A.; Wang, J.; Sun, Z.; Guan, H. Research on the Evolutionary Path of Eco-Conservation and High-Quality Development in the Yellow River Basin Based on an Agent-Based Model. Systems 2022, 10, 105. [Google Scholar] [CrossRef]
- Shi, L.F.; Huang, X.J. Spatiotemporal differences of urban expansion along China’s Grand Canal. Prog. Geogr. 2019, 38, 1206–1216. [Google Scholar] [CrossRef]
- Chun, H.Z.; Yue, P.N. Study on the effects of Grand Canal on city pattern change of Hangzhou based on Remote Sensing. In Proceedings of the 2009 Joint Urban Remote Sensing Event, Shanghai, China, 20–22 May 2009; pp. 1–6. [Google Scholar]
- Li, J.; Zhang, H.; Sun, Z. Spatiotemporal variations of land urbanization and socioeconomic benefits in a typical sample zone: A case study of the Beijing-Hangzhou Grand Canal. Appl. Geogr. 2020, 117, 102187. [Google Scholar] [CrossRef]
- Zhou, W.; Li, X.J. A Comprehensive Evaluation Method Based on Information Entropy. Sci. Technol. Eng. 2010, 10, 5839–5843. [Google Scholar]
- Moran, P.A.P. Notes on Continuous Stochastic Phenomena. Biometrika 1950, 37, 17–23. [Google Scholar] [CrossRef]
- Conceição, P.; Ferreira, P. The Young Person’s Guide to the Theil Index: Suggesting Intuitive Interpretations and Exploring Analytical Applications. 2000. Available online: https://papers.ssrn.com/sol3/papers.cfm?abstract_id=228703 (accessed on 1 January 2023).

Disclaimer/Publisher’s Note: The statements, opinions and data contained in all publications are solely those of the individual author(s) and contributor(s) and not of MDPI and/or the editor(s). MDPI and/or the editor(s) disclaim responsibility for any injury to people or property resulting from any ideas, methods, instructions or products referred to in the content. |
© 2024 by the authors. Licensee MDPI, Basel, Switzerland. This article is an open access article distributed under the terms and conditions of the Creative Commons Attribution (CC BY) license (https://creativecommons.org/licenses/by/4.0/).