Abstract
Online grocery shopping has grown rapidly in recent years. It has been promoted as a way to overcome the systemic inequalities in food access and increase sustainable food practices. A growing body of studies has highlighted the impact of income, food prices, and internet access/connection on shaping people’s behavior in buying groceries online. However, there is a dearth of prior studies that have examined the impact of these three factors at the macro/meso level. Therefore, this paper presents an analysis of these factors from a sample of 16 Russian regions with a combined population size of more than 44 million people. We used a fixed effects linear regression model to analyze panel data on median income, mobile internet connection, food price index, and online grocery sales. Our results show the significant impact of income and imply that while online grocery shopping holds huge promise for overcoming unequal access to food and achieving sustainability, entrenched challenges such as poverty and income inequality might be difficult to shake off.
1. Introduction
Interest in online grocery shopping has grown modestly for years; however, the COVID-19 pandemic led to an exponential increase in consumer interest [1,2]. Online grocery shopping refers to the purchase of groceries or food over the internet and then having these products delivered to consumer homes or these being picked up in a store or warehouse [1]. Academic literature on online grocery shopping has existed for decades. Influential studies in the field can be traced back to the late 1990s and early 2000s with studies on the type of people who bought groceries online [3,4], operations management in online grocery shopping [5,6], creating value in online grocery shopping [7], theoretical approaches for analyzing online grocery shopping behavior [8], and the success potential of online grocery shopping [9,10], among other things. Nevertheless, online grocery shopping was not always destined for success, in part because the perishable nature of food, particularly fresh foods, is fundamentally different from that of other types of products, such as clothing or electronics. According to Ring and Tigert [11], many early online grocery retailers failed due to the higher operating costs compared to brick-and-mortar grocery stores, the lack of profitability, and the small size of the target market at the time.
However, all this began to change in recent years as the operating costs of running online retail significantly dropped [12]. Also, COVID-19 and the restraints implemented to control the virus spread led to a significant boost in online grocery shopping [13,14]. Before the COVID-19 pandemic, studies showed an increasing but limited interest in online grocery shopping in many parts of the world. For example, a 2016 Nielsen study of 30,000 online consumers in 63 countries showed that only 9% of people in Europe and North America and 7% in Latin America, the Middle East, and Africa had ever purchased fresh groceries online [15]. Additional studies by Gallup [16] revealed that 81% of adults in the United States (US) never order groceries online, and 88% never order meal preparation kits with fresh foods online. Nevertheless, due to the restrictions imposed to contain the spread of COVID-19, 79% of shoppers in the US had ordered groceries online [17]. This growth is similar in other countries such as China [18] and in other parts of the world [1,2,19,20]. Research has revealed that the majority of consumers plan to continue online grocery shopping in the future, regardless of the COVID-19 pandemic circumstances [21]. For example, the data for 2022 show that the volume of online grocery shopping increased by 66% in Russia, while the number of orders increased by 75% [22].
Online grocery shopping has been envisaged as a business practice to promote sustainable development [23,24]. Online grocery shopping can become a potent tool to promote sustainable transportation and develop sustainable cities [25]. It is considered a potential solution to urban traffic congestion by consolidating several consumer shopping excursions into a solitary delivery route [26]. Prior research indicates that online grocery shopping may result in carbon dioxide and energy reductions ranging from 17 to 90 percent [25,27,28]. Sustainability practices may be enhanced by using a variety of last-mile delivery vehicles [29], including electric cars, tricycles, and bicycles [30,31]. Potentially, this might mitigate external impacts, including but not limited to traffic jamming, pollution, and land usage [32].
Furthermore, studies show that online grocery shopping can potentially ease the struggles of disadvantaged groups, such as the elderly community and people with mobility challenges [33]. Also, online grocery shopping has been championed as a way to overcome the structural barriers to food access faced by low-income families, who may live disproportionately far from physical grocery stores or lack personal vehicles to use to go shopping [34]. It can also promote healthy eating habits by limiting impulse buying unhealthy foods as a behavior, which is more prevalent in physical grocery shops [35]. Nevertheless, a crucial challenge of the premise of these studies is that the majority of the previous research, going back several decades, shows that it is wealthy people or people with higher levels of income—not low-income people—who disproportionately buy groceries online [1,3,4,36]. Moreover, in recent years, studies have begun to highlight the impact of the cost/price of food and internet connection on online grocery shopping behavior [37,38]. However, some recent studies have challenged the impact of these factors. For example, Frank and Peschel [39] stated that higher-income individuals were less likely to shop for groceries online. Zheng et al. [40] revealed that price does not increase the frequency of online grocery shopping. As a result of these studies, it can be stated that there is some inconsistency in the literature about the role of the aforementioned factors in online grocery shopping. Also, little is known about the impact of income, internet connection, and food prices on online grocery shopping at the regional, district, city, and country levels.
Nonetheless, studies show that online grocery shopping can be influenced by a range of other issues, including situational factors such as the presence of a baby in the family, the health of the consumer, distance to a physical shop, mobility challenges, and the working situation of the consumer [33,41,42]. Other influencers include social norms or subjective influence, time-saving, trust, price value, prior shopping experience, attitude, perceived usefulness, and perceived ease of use, among other things [2,20,39,43,44]. However, the impact of income, internet connection, and food prices are particularly important because they strike at the heart of the potential for online grocery shopping as a tool for addressing systemic food inequality. While the promise of online grocery shopping for low-income families remains undisputed, it is not exactly clear whether they can afford it. Disparities in vital facilitating conditions such as internet access remain very high for low-income families and communities [45,46], and in recent years, a growing body of literature suggests income might play a stronger role than earlier realized in people’s overall online shopping behavior [47,48,49].
Therefore, in this study, we aim to empirically investigate the relationship between online grocery shopping and income, internet connection, and the price of food. We developed a linear regression model using fixed effects, panel data on online grocery sales in 16 regions of Russia, and corresponding panel data on median income, mobile internet connection, and the food price index. We also examined whether food prices could moderate the impact of income. To the best of our knowledge, this paper represents one of few studies to examine the impact of income, internet connection, and food prices on online grocery shopping at the macro/meso level. While other studies have concentrated on the impact of these factors on individuals and households [1,36,37], our paper arguably provides a more definitive analysis of the topic by investigating regional data in regions with a combined population of over 44 million people. As such, this paper makes the following contributions. First, by examining the macro-level data, we provide robust evidence to guide the policy formulation process for Russia’s online grocery shopping. Second, we extend the debate on online grocery shopping by empirically demonstrating that income, internet access, and food prices not only pose a challenge for individuals and households but for regions as well. Third, we provide a reality check on the role of online grocery shopping in improving food access by showing that in spite of its potential, deep-rooted socio-economic challenges remain a problem even within online grocery shopping. The following sections present the literature review, methodology, results, discussion/conclusion, and limitations.
2. Theoretical Background
2.1. Literature Review and Hypotheses Development
The advent of online grocery shopping can be traced back to the 1990s due to the emergence of the high-tech era [50]. Prior research has focused on the socio-demographic determinants of consumers’ online shopping behavior [4,51,52,53]. The recent research highlights the role of online grocery shopping in promoting sustainability practices [23,24,25,26]. According to the International Telecommunication Union, online technologies are critical for the realization of United Nations Sustainable Development Goals (SDGs) [54]. Digitalization can contribute to the development of a healthy, sustainable, and equitable society [55]. A digital-technology-enabled green economy can contribute to sustainable development [56,57]. In particular, a digital economy can improve the infrastructure, economic competitiveness, and well-being of countries and help them toward achieving SDG 9 (industry, innovation, and infrastructure) [58]. As a result, online grocery shopping could serve as a significant facilitator of sustainable development.
Frank and Peschel [39] surveyed 1580 online shoppers in Denmark to identify the key socio-demographic determinants of their online grocery shopping behavior. According to the study, customers prefer online grocery shopping since it saves them time and is more convenient. The study further reported that higher-income individuals were less likely to engage in online grocery shopping; however, most of the prior research indicates quite the opposite. For example, Hansen [59] conducted a study in the US to examine the adoption of online grocery shopping using a web survey of 784 online consumers. The study revealed that higher-income customers were more likely to purchase groceries online; however, the study found no effect of age, gender, or education. Similarly, Hui and Wan [51] conducted a study in Singapore to examine consumers’ usage of online supermarkets. The study revealed that online grocery shopping consumers in Singapore were high-income, young, and educated. This is consistent with more recent studies such as those by Shen et al. [1] and Eriksson and Stenius [60]. Research by Shen et al. [1] was conducted in the US to examine the effect of COVID-19 on the online grocery shopping behavior of 302 consumers. They found that the adoption of online grocery shopping accelerated during and after the COVID-19 pandemic, and people with health issues and higher incomes were likelier to engage in online grocery shopping [1]. Eriksson and Stenius [60], in a survey of 2568 Finnish consumers, also found that high-income and urban residents were more likely to engage in online grocery shopping than low-income and rural consumers, although they further indicated that income and rural–urban regions did not matter for consumers who were above 45 years of age.
In addition, a survey of consumers in Portugal revealed that male consumers with higher income and education levels were more likely to purchase groceries online [50], and consumers who had a positive experience with online grocery shopping during COVID-19 were likely to continue purchasing after the pandemic [50]. Also, a secondary data analysis of 863 consumers in the US revealed that lower-income households were less likely to engage in online grocery shopping [61]. A survey of 2032 consumers in the United Kingdom (UK) found that consumers with high and average incomes prefer online grocery shopping. In contrast, those with less education, who are price-conscious, and those with low incomes prefer physical grocery shopping [62]. These findings are but-tressed by a survey of Chinese consumers, which identified two segments of online grocery consumers: online food pioneers (OFPs) and online food conservatives (OFCs) [63]. According to the study, OFPs were more likely than OFCs to engage in online grocery shopping. OFPs had a high or average income and belonged to the middle-aged group (31–40 years). OFCs had a low income and were either younger than 30 or older than 40 years [63]. Saphores and Xu [64]’s US study revealed that higher-income households were more likely to engage in online grocery shopping. Finally, a study of 18,598 consumers in the US revealed that people’s income impacted whether they bought groceries online [36].
As a result of these studies, we hypothesize that:
Hypothesis 1:
The median income of a region will positively impact the level of online grocery shopping.
Furthermore, while some studies argue that consumers who buy groceries online are not price-sensitive [35], the majority of other studies show that the price of food products influences consumers’ decision to employ online grocery shopping. For example, a systematic review by Trude et al. [34] revealed food cost as a leading barrier to online grocery shopping, and focus group research carried out by Rogus et al. [38] in New Mexico echoed the same conclusion. Other studies have highlighted the impact of price or cost, including a survey by Etumnu et al. [65] of 985 consumers in the US and focus group interviews by Ramus and Nielsen [66]. Additionally, research by Hand et al. [41], following interviews and a survey of 1128 consumers, revealed that there is a distinct cluster of consumers who refuse to shop online due to the price of food in online grocery stores. Zheng et al. [40] demonstrate that consumers are more likely to shop online for fresh food if they believe online grocery shopping provides a price advantage, although people who believe this are not necessarily frequent online grocery shoppers. Also, the findings from a large-scale study of 3526 people in the US revealed that food prices were the most popular reason for grocery shopping online [67].
However, because there are no available data to specifically examine the price of food in online grocery stores in Russia and potentially compare it with that in brick-and-mortar stores, we sought to examine the influence of overall food prices on online grocery shopping. Specifically, our goal is to test whether customers are more likely to buy food online when the general food prices are high in a region. We postulate that due to the lower search/transaction costs in online grocery shopping [68,69], high regional food prices might induce customers to take advantage of the price comparison advantage in online grocery stores to seek bargains. Moreover, understanding the purchasing attitude of online customers at a time of general high/low food prices can provide implications for closely similar areas, such as the influence of inflation or an increased cost of living on online grocery shopping.
Therefore, we hypothesize that:
Hypothesis 2:
The price of food in a region will impact the level of online grocery shopping.
Moreover, since online grocery shopping requires using the internet, we argue that having access to internet or broadband connection can significantly impact online grocery shopping behavior. This argument is backed up by previous research. Schuster and Sporn [10] conducted one of the earliest such studies and showed a connection between internet access and online grocery shopping. For instance, in a geospatial and socio-economic study examining the level of online shopping for frozen and fresh foods in 2162 census tracts in North Carolina, McGuirt et al. [37] revealed that internet connection significantly impacted online grocery shopping, as tracts with higher internet availability rates were much more likely to shop for groceries online. In addition, in a study of 29,701 residential zip codes in the US spanning 45 months, Bell and Song [70] show that internet access contributes to the neighborhood effect, which impacts online grocery shopping.
Therefore, we hypothesize the following:
Hypothesis 3:
The level of internet connection in a region will positively impact the level of online grocery shopping.
2.2. Online Grocery Shopping in Russia
Online grocery shopping has grown exponentially in Russia within the last few years. According to Statista, the five leading online grocery stores in Russia in 2022 were VkusVill, SberMarket, Samokat, X5 Group, and Wildberries [71,72]. According to Statista, the Russian online grocery sector exceeded a market size of 553 billion Russian rubles (approximately 6.2 billion US dollars) in 2022 and is expected to reach 765 billion rubles (approximately 8.7 billion US dollars) in 2023 [71]. This represents a year-on-year increase of 66% from 2021. Also, with 402 million orders, the year 2022 also saw a 75% increase in the number of orders in the Russian online grocery market [73]. Previous studies have highlighted the influence of the COVID-19 pandemic and the subsequent lockdowns imposed on the Russian public in fueling the growth of online grocery shopping in the country [74,75,76]. According to Olumekor and Polbitsyn [13], online grocery sales increased by 250% in Russia in 2020 due to the COVID-19 pandemic, and retailers such as Sbermarket and Ozon witnessed online sales increases of 500% and 170%, respectively. Other studies have reached similar conclusions. For instance, research by Steklova et al. [77] revealed that COVID-19 led to a record increase in the overall e-commerce market in Russia, with online grocery stores experiencing the highest growth rate.
Furthermore, an extensive examination of the Russian online grocery market by Axenov et al. [78] revealed the emergence of a new type of online grocery shopping in Russia: the online prepared meal delivery system. They showed that these services are completely changing the entire mode of food retail in Russia. This market is primarily made up of two types of retailers: supermarkets and catering services who sell ready meals both online and in physical stores/spaces and fully online retailers who only offer their products online. The latter group rely on so-called closed or dark kitchens/stores to prepare food and handle delivery/logistics. These retailers, led by companies such as Samokat, Yandex, Lavka, and Sbermarket, attain customer loyalty and competitive advantage by situating dark stores as close as possible to the customer and optimizing their delivery times [78].
Moreover, in a similar study to our research, Lola and Bakeev investigated the regional differences in the Russian electronic commerce market and investigated the impact of a range of social and economic factors [79]. The authors concluded that smartphone and computer ownership, as well as gross regional product per capita and a lack of trust, were the only influential factors, whereas education, age, and the level of urbanization were not influential. However, these results are specific to electronic commerce, not online grocery shopping. To date, studies on online grocery shopping in Russia have remained very limited, and empirical research on the regional differences in Russia’s online grocery market is almost non-existent.
3. Materials and Methods
The Russian administrative system is divided into 8 main federal administrative districts (okrug), which are then subdivided into more than 80 subjects or constituent entities referred to as regions (oblasts), territories (krais), republics, federal cities, autonomous regions, and autonomous districts. These subjects are all constitutionally equal and will hereinafter be collectively referred to as regions in this paper. Due to the controversies surrounding certain regions in Russia and the fact that some of them are not internationally recognized, we chose to use a sample of all regions instead of the total number. We utilized a two-stage sampling strategy to decide on which regions to include in this study. The first stage consisted of a stratified sampling approach by dividing the pool of regions into eight strata following the official divisions of the federal administrative district. Then, we used a purposive sample to select two regions in each stratum, accounting for factors like population size, ethnic composition, level of urbanization, political structure, and level of development. The result was a final representative sample size of 16 regions covering the breadth of Russia and providing a diverse mix of ethnicities, sizes, and wealth. The list of included regions is provided in both Figure 1 and Table 1.
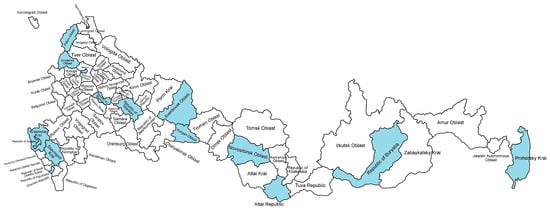
Figure 1.
Study area. Source: authors’ elaboration. Note: The map only shows regions around our study area, not all regions in Russia. Blue shaded areas show the regions included in this study.

Table 1.
Descriptive data.
Figure 1 shows the regions included in the study sample. The regional data on online grocery shopping were retrieved from the analytics page of the Association of E-Commerce Companies of Russia [80] on 13 September 2023. AKIT uses arguably the most robust methodology for collecting e-commerce data in Russia. Their methodology includes analyzing the figures for e-commerce sales via electronic payment systems—including credit cards—which make up close to 90% of the overall payment methods for e-commerce in Russia. They also analyze sales data from companies and data from fiscal operators, among others. Furthermore, the data on Russian regions’ income level, food prices, and internet connection were retrieved from the Federal State Statistical Service—Rosstat [81]. Median income was chosen as the primary measure of income level because studies show that it provides a more accurate reflection of the actual incomes of people than other measures, such as per capita income, which has been criticized for failing to capture the living standards of people accurately [82,83,84].
In addition, data on the number of connected mobile devices per 1000 people—here-after referred to as mobile internet—were used to represent internet connection. Mobile internet was chosen ahead of fixed internet because Russian consumers overwhelmingly and almost exclusively order online groceries using their mobile phones [85]. Then, the food price index was used to analyze the impact of food prices. Since there are no data to provide a comparative tracking of food prices in online and brick-and-mortar stores, the role of food prices was to examine whether more/less people shop online when the price of food increases. Moreover, in Russia, grocery prices online are largely similar to those in shops because many brick-and-mortar supermarkets are also dominant in online grocery shopping, and they offer no specific discounts for ordering online [86].
All included data were longitudinal panel data covering a three-year period from 2019 to 2021, as presented in Table 1. The mean of the sample data was utilized for the three-year period of the study. The analysis covered a three-year period due to the available data at the time of analysis. While data on online grocery shopping were available from 2018 to 2022, the annual data on the independent variables only covered the period from 2019, and there were none for 2022. Furthermore, it was necessary to decide whether a random or fixed effect was appropriate for the regression. Fixed effect was chosen ahead of random effect for several reasons. First, fixed effect is recommended as the more robust approach to panel data structures such as ours [87,88,89,90,91]. Second, we also decided to use fixed effects after using one of the most popular methods to decide between fixed and random effects: the Hausman test (Table 2) [92,93]. Regional online grocery sales were taken as the dependent variable, while the median income, mobile internet, and the food price index were taken as the explanatory or independent variables. Furthermore, we examined whether the price of food could moderate the impact of median income on online grocery shopping. The results of our analysis are presented in the results section. Following this, a robustness test on the normality of the residuals was conducted using the Kolmogorov–Smirnov method [94].
Table 2.
Hausman test results.
4. Results
4.1. Descriptive Analysis and Model Approach
Table 1 shows the data on the sales turnover of online groceries across the 16 regions of Russia included in our study sample. The descriptive data show a year-on-year in-crease in grocery sales in all 16 regions of Russia from 2019 to 2021. The city of Moscow is by some distance the leading region in online grocery sales, followed by the city of Saint Petersburg and Krasnodar Territory. In contrast, the least performing regions in online grocery sales are the Republics of Ingushetia, Altai, and Adygea. Table 1 also provides a glimpse of the level of online grocery shopping before COVID-19 (2019) and during the peak of the pandemic (2020–2021). This is provided in greater detail in Figure 2.
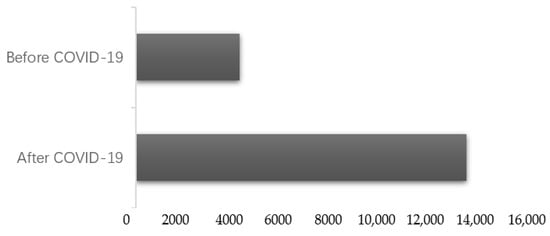
Figure 2.
Online grocery sales in Russia before and after the COVID-19 pandemic. Note: the figures represent the mean sales of online grocery before (2018–2019) and after (2020–2021) COVID-19.
Table 1 shows the mean values of online grocery sales in the 16 Russian regions before the COVID-19 pandemic in the years 2018 and 2019 and after COVID-19 in the years 2020 and 2021. While COVID-19 began in 2019, the first recorded case in Russia was only in 2020 [95,96,97,98]. Lockdowns were introduced in Russia between March and June 2020 [99,100,101]. However, various forms of restrictions to travel and movement, self-isolation, and social distancing were in place until July 2022 [102,103,104]. A new online grocery store was sought out by around 40 percent of the Russian population amid the COVID-19 lockdown in 2020 [105]. Figure 2 shows a cumulative large increase in the sales of online grocery shopping after the COVID-19 pandemic began. It can be seen that most regions saw a multiple-fold increase in online grocery shopping (Table 1). For example, regions such as Buratya, Mordovia, Kurgan, and Pskov experienced seven to eight times increases in their online grocery shopping, whereas Moscow and Sverdlovsk saw increases three to four times over (Table 1).
Furthermore, Table 1 also shows the median income of all the regions included in our study sample. It can be seen that Moscow leads this group, followed by Saint Petersburg and Krasnodar Territory. Conversely, the regions with the lowest income levels include the Republics of Ingushetia, Altai, and Mordovia. For mobile internet connection, the city of Moscow again leads over the other regions, followed by Saint Petersburg and Krasnodar Territory. In contrast, for the food price index, Stavropol Territory had the highest score for 2021, followed by Krasnodar Territory. The trio of the Novosibirsk region, the Republic of Adygea, and the Republic of Ingushetia all had the same score for 2021.
Table 2 depicts the result of the Hausman test for random effect correlation. Table 2 shows a chi-square statistic of 13.105479 and a probability of 0.0043. This means that the probability is less than the significance level of 5% or p < 0.05. Therefore, we reject the null hypothesis for random effects and proceed with fitting a fixed effect model for our analysis. Moreover, this follows the recommendations of prior studies, which suggest this fixed effect produces more accurate results for a panel data causal inference analysis such as ours [87,88,89,90,91].
4.2. Linear Regression Results
The omnibus tests presented in Table 3 were conducted to test the overall fit of our model. The test examines whether the independent variable accounts for the variation in the de-pendent variable by examining statistically significant differences in the mean of both variables. Also, in order to remove bias, we tested the effect size using partial eta squared. The results show statistically significant values for the model with p < 0.001. Therefore, we reject the null hypothesis that the mean is the same.
Table 3.
Model fit summary.
To further demonstrate the strength of our model, we proceeded with a coefficient of determination analysis with the R-squared statistic. The result of this is shown in Table 3, with values for both the R-squared and adjusted R-squared. The results demonstrate a strong relationship between our model and the dependent variable [106,107]. It shows that approximately 76% of the variation in online grocery shopping (approximately 74% for adjusted R-squared) can be explained by the regions’ median income, food prices, and mobile internet connection.
Following the omnibus test results, we analyzed the result of our fixed effects model (Table 4), with the dependent variable—online grocery sales turnover—shown as the intercept. Table 4 shows a standard error of 2149.3 for the dependent variable, 0.372 for median income, 7.073 for mobile internet, and 597.583 for food prices. Furthermore, the results from Table 4 also show a highly significant β coefficient of 0.8587 for median income but a relatively low β coefficient for mobile internet (β = 0.0117) and food prices (β = 0.0252). The results of the estimate and t-test all indicate a positive relationship between online grocery shopping and median income, mobile internet, and food prices. However, only the impact of median income was statistically significant at p < 0.001. Therefore, only the study’s first hypothesis was confirmed.
Table 4.
Fixed effects estimates.
Table 4 also shows the results of the analysis examining the moderating impact of food prices on median income. The parameter estimates show a β of approximately 0.86, demonstrating a strong moderating impact [108,109] of food prices on the impact of median income. β indicates that holding other things constant, there is an approximate 0.86 change in the impact of median income on online grocery shopping for every unit change in the food price index of the region. Following this analysis, we carried out a robustness analysis to test for the normality of the residuals in our model.
Table 5 shows the result of the test on the normality of the residuals using the Kolmogorov–Smirnov statistic. The results show a p-value of 0.909 with p > 0.05, indicating that we fail to reject the null hypothesis of non-normality of the sample. The results of the test indicate that the sample follows a normal distribution.
Table 5.
Test for normality of residuals.
5. Discussion and Conclusions
The use of online grocery shopping has been seen as a viable business strategy to ad-dress systematic inequities in food availability. It has also been envisaged to promote sustainable development as it can address urban traffic congestion [26] and reduce carbon dioxide and energy consumption [25,27,28], traffic jamming, and pollution [32].
The impact of income, internet connection, and food prices on online grocery shopping has been established in several prior studies [1,34,37,50]. However, prior research has largely examined the impact of these factors on online grocery shopping at the individual or household level [1,36,37]. Macro/meso-level analysis enables the observation of patterns and trends over a larger population scale in comparison to individual or household level analysis [110]. The utilization of macro/meso-level analysis empowers organizations to gain insights into customer behavior at a significant magnitude. Consequently, this paper contributes to the existing literature by being one of the few studies—to the best of our knowledge—to examine the impact of income, internet connection, and food prices at the macro/meso level. Therefore, the present study offered considerable evidence to inform the policy-making process for online grocery shopping through an analysis of the macro/meso-level data. Furthermore, the study provided empirical evidence that regions (not just individuals and households) are confronted with challenges related to income, internet availability, and food prices.
In this study, we examined 16 Russian regions with a combined population size of 44 million people and utilized panel data covering a period of three years. Following a fixed effects linear regression analysis, our results revealed that income has a statistically significant impact on the level of online grocery shopping in the examined regions with a β of approximately 0.86 (Table 5), whereas although internet connection and food prices showed a positive relationship (β = 0.0117; β = 0.0252), the relationship was not statistically significant. Overall, with an R-squared value of approximately 76%, our result demonstrates considerable significance.
The results of the current study suggest that a higher income positively correlates with online grocery sales. This is in alignment with those of several prior studies [1,36,40,51,59,61,62,63,64]. However, the majority of the prior research has focused on individual or household income, whereas the current research considered regional income. This suggests that a higher regional income is likely to lead to higher online grocery sales in Russia. This also underscores that Russian regions with a higher income are likely to lead in online grocery shopping sales, whereas regions with a lower income are likely to fall behind in online grocery sales. Therefore, policy-makers should pay attention to lower-income regions to encourage online grocery sales.
The current study found a positive but insignificant relationship between regional food prices and online grocery sales. Nevertheless, this result is consistent with the prior research [35,38,40,65,66,67]. It implies that affordability due to income level is a more potent influencer of online grocery shopping than the daily prices of food. This insignificant relationship suggests that although better food prices could encourage online grocery sales, other factors (like income) could be potentially more significant in influencing online grocery shopping. This implies that deep-seated socio-economic challenges continue to be an issue in the realm of online grocery shopping, notwithstanding the potential of technology to encourage online sales. Furthermore, due to the dominance of traditional brick-and-mortar companies like X5 Group and VkusVill in Russia’s online grocery shopping, the prices in shops and online are largely the same [71,72]. As a result, consumers in Russia do not obtain a price advantage by grocery shopping online.
Similarly, this study reported a positive but insignificant relationship between inter-net connection and online grocery sales. This can be explained by the relatively high penetration rate of internet access in Russia. As such, internet connection in Russia might not be a barrier as it once was. Also, a number of prior studies show that the main divide in internet access is largely between rural–urban and wealthy–poorer areas, not between regions/states [37]. Therefore, internet connection is a less significant factor in influencing online grocery sales in Russia.
Furthermore, the majority of previous studies in many parts of the world have revealed that lockdowns and health risks had a significant positive impact on online grocery shopping [1,2,21]. Similar to many previous studies, we found a substantial increase in the level of online shopping in Russia during the peak of the COVID-19 pandemic in 2020 and 2021 (Table 1 and Figure 2). This result is also supported by the prior research on online grocery sales in Russia [13,74,75,76,77].
In addition, a number of managerial and practical implications can be derived from our research. First, online grocery shopping can facilitate sustainable development; therefore, countries should formulate policies to encourage their people to buy online. Further, nations should make efforts to make people aware of the potential of online grocery shopping to promote sustainability practices. Second, since income retains a very significant impact on online grocery shopping, retailers must place the affordability of products at the core of attracting and retaining consumers. Previous studies have recommended promoting cost-saving options to increase grocery shopping online [12]. We suggest that these cost-saving strategies can include providing targeted discounts to people from lower-income households, such as those on the Supplemental Nutrition Assistance Program (SNAP) or those facing disproportionate inequality in accessing in-store grocery shops. However, simply offering these services is not enough. Managers should also communicate the price advantage of online grocery shopping in marketing campaigns, among other things.
The current research underscores the significant impact of income on influencing online grocery sales. Despite the potential influence of internet connection and food prices, income continues to be a substantial determinant in shaping online grocery sales. With this research, we hope to lead toward a consensus on the impact of income on online grocery shopping, not only among individuals or households but also among communities, cities, and regions. Furthermore, policy-makers in various nations should also address the socio-economic challenges that hinder the growth of online grocery shopping. This will facilitate the achievement of sustainable development in those nations by encouraging the use of online food shopping.
Limitations and Future Research
The findings and conclusions of this study should be considered exploratory. The findings of this study may not reinforce definitive conclusions to the research on online grocery shopping. However, this study provides a foundation/base for future studies to build upon.
This paper examines the absolute sale revenues of online shopping in regions and the regions’ median income, mobile internet connection, and food price index. The current study data only cover the period 2019–2021 as the most recent data available from the statistical agency Rosstat span up to 2021. This might not completely reflect the conditions of online grocery shopping in Russia at the present time. However, it provides a robust picture of the past and future trends in online grocery shopping in the country. Future research can also collect covering a longer timeframe. Additionally, future research may gather more current data to better depict the current state of online grocery shopping.
The current research does not include any analysis of individual interest in online grocery shopping. Quantitative analysis regarding the extent of public interest in online grocery shopping and the factors’ determining purchase was not conducted since such matters fall beyond the scope of the existing research. It also does not include the shopping frequency or the number of shoppers in online grocery stores. Therefore, the paper does not explain whether wealthy regions buy more expensive groceries online, which might not be entirely unique to online grocery shopping. This represents an interesting avenue for future research. As such, future studies can consider the impact of having a higher disposable income on online grocery shopping, the price differences in the average purchased products in regions with high and low median incomes, or the impact of population size on online grocery sales. Future research can also conduct a quantitative investigation into the level of public interest in online grocery shopping and the factors’ determining the purchase of products online. Further, the purpose of the food price index in this study was not to provide a comparative analysis between the prices of food in online stores and those in brick-and-mortar stores. Instead, the current study analysis chose to investigate whether changes in the general price of food can spur an overall increase/decrease in online grocery shopping. Consequently, future studies can consider looking into the influence of the cost of living and inflation on online grocery shopping.
Furthermore, since this paper is specifically focused on regional-level analysis, future studies can consider the impact of income in individual and country-level studies. This can enable an international comparative analysis at the country level and a deeper analysis of individual differences. Also, future studies can consider the impact of income across various product categories in online grocery shopping, such as fresh groceries, packaged food, beverages, pastries, or groceries with a longer shelf life. This would contribute to our understanding of customer behavior in buying groceries online across different product categories, hence enhancing the research findings. The impact of income on nutritional choices via online grocery shopping can also be examined in future research.
In addition, this study is limited to regions in a single country (Russia), whose social, cultural, and economic reality might be different from nations in other parts of the world. The results should be carefully interpreted to reflect this. Further research may involve collecting regional data from multiple nations to analyze the effects of the factors identified in this study on online grocery shopping. This will help to generalize the research findings. Future research can also investigate the level of interest in the population in online grocery shopping and the factors that determine the purchase of products online. Also, future studies can consider examining the rural–urban differences in the variables in this study. This could provide a better understanding of the influence of factors such as internet access and potentially facilitate the generalization of the present research findings.
Author Contributions
Conceptualization, M.O. and H.P.S.; methodology, M.O. and H.P.S.; software, M.O.; validation, M.O., H.P.S. and I.A.A.; formal analysis, M.O.; investigation, M.O. and H.P.S.; resources, H.P.S. and I.A.A.; data curation, M.O.; writing—original draft preparation, M.O. and H.P.S.; writing—review and editing, M.O., H.P.S. and I.A.A.; visualization, M.O. and H.P.S.; supervision, H.P.S. and I.A.A.; project administration, M.O., H.P.S. and I.A.A.; funding acquisition, M.O., H.P.S. and I.A.A. All authors have read and agreed to the published version of the manuscript.
Funding
The author M.O. acknowledges financial support from the Ministry of Science and Higher Education of the Russian Federation (Ural Federal University project within the Priority-2030 program).
Institutional Review Board Statement
Not applicable.
Informed Consent Statement
Not applicable.
Data Availability Statement
The open access data used for this research can be accessed on the websites of the Association of E-Commerce Companies of Russia, https://akit.ru/analytics/trade, accessed on 13 September 2023, and the Federal State Statistics Service—Rosstat, https://rosstat.gov.ru/folder/210/document/13204, accessed on 13 September 2023.
Acknowledgments
The authors thank the editors and reviewers for their constructive feedback.
Conflicts of Interest
The authors declare no conflict of interest.
References
- Shen, H.; Namdarpour, F.; Lin, J. Investigation of Online Grocery Shopping and Delivery Preference before, during, and after COVID-19. Transp. Res. Interdiscip. Perspect. 2022, 14, 100580. [Google Scholar] [CrossRef]
- Tyrväinen, O.; Karjaluoto, H. Online Grocery Shopping before and during the COVID-19 Pandemic: A Meta-Analytical Review. Telemat. Inform. 2022, 71, 101839. [Google Scholar] [CrossRef]
- Hiser, J.; Nayga, R.M.; Capps, O.; Hiser, J.; Nayga, R.M.; Capps, O. An Exploratory Analysis of Familiarity and Willingness to Use Online Food Shopping Services in a Local Area of Texas. Res. Agric. Appl. Econ. 1999, 30, 78–90. [Google Scholar] [CrossRef]
- Morganosky, M.A.; Cude, B.J. Consumer Response to Online Grocery Shopping. Int. J. Retail Distrib. Manag. 2000, 28, 17–26. [Google Scholar] [CrossRef]
- Boyer, K.K.; Hult, G.T.M. Extending the Supply Chain: Integrating Operations and Marketing in the Online Grocery Industry. J. Oper. Manag. 2005, 23, 642–661. [Google Scholar] [CrossRef]
- Delaney-Klinger, K.; Boyer, K.K.; Frohlich, M. The Return of Online Grocery Shopping: A Comparative Analysis of Webvan and Tesco’s Operational Methods. TQM Mag. 2003, 15, 187–196. [Google Scholar] [CrossRef]
- Anckar, B.; Walden, P.; Jelassi, T. Creating Customer Value in Online Grocery Shopping. Int. J. Retail Distrib. Manag. 2002, 30, 211–220. [Google Scholar] [CrossRef]
- Hansen, T.; Møller Jensen, J.; Stubbe Solgaard, H. Predicting Online Grocery Buying Intention: A Comparison of the Theory of Reasoned Action and the Theory of Planned Behavior. Int. J. Inf. Manag. 2004, 24, 539–550. [Google Scholar] [CrossRef]
- Keh, H.T.; Shieh, E. Online Grocery Retailing: Success Factors and Potential Pitfalls. Bus. Horiz. 2001, 44, 73–83. [Google Scholar] [CrossRef]
- Schuster, A.; Sporn, B. Potential For Online Grocery Shopping In The Urban Area of Vienna. Electron. Mark. 1998, 8, 13–16. [Google Scholar] [CrossRef]
- Ring, L.J.; Tigert, D.J. Viewpoint: The Decline and Fall of Internet Grocery Retailers. Int. J. Retail Distrib. Manag. 2001, 29, 264–271. [Google Scholar] [CrossRef]
- Ali, S.H.; Lloyd-Montgomery, J.; Lowery, C.M.; Vedovato, G.M.; Trude, A.C.B. Equity-Promoting Strategies in Online Grocery Shopping: Recommendations Provided by Households of Low Income. J. Nutr. Educ. Behav. 2022, 54, 998–1010. [Google Scholar] [CrossRef] [PubMed]
- Olumekor, M.; Polbitsyn, S. COVID-19 and Consumer Behaviour: A Review of Recent Literature. Bull. South Ural State Univ. Ser. Econ. Manag. 2021, 15, 183–189. [Google Scholar] [CrossRef]
- Olumekor, M.; Polbitsyn, S. Online Consumer Behaviour: Opportunities and Challenges for the Elderly. In Proceedings of the European Conference on Innovation and Entrepreneurship, ECIE, Lisbon, Portugal, 16–17 September 2021; pp. 1190–1195. [Google Scholar]
- Nielsen. What’s In-Store for Online Grocery Shopping; Nielsen: New York, NY, USA, 2017. [Google Scholar]
- Gallup. Online Grocery Shopping Still Rare in U.S.; Gallup: Washington, DC, USA, 2019. [Google Scholar]
- Forbes. 3 Lasting Changes to Grocery Shopping after COVID-19; Forbes: New York, NY, USA, 2020. [Google Scholar]
- Li, J.; Hallsworth, A.G.; Coca-Stefaniak, J.A. Changing Grocery Shopping Behaviours Among Chinese Consumers At The Outset Of The COVID-19 Outbreak. J. Econ. Hum. Geogr. 2020, 111, 574–583. [Google Scholar] [CrossRef] [PubMed]
- Chang, H.-H.; Meyerhoefer, C.D. COVID-19 and the Demand for Online Food Shopping Services: Empirical Evidence from Taiwan. Am. J. Agric. Econ. 2021, 103, 448–465. [Google Scholar] [CrossRef]
- Gruntkowski, L.M.; Martinez, L.F. Online Grocery Shopping in Germany: Assessing the Impact of COVID-19. J. Theor. Appl. Electron. Commer. Res. 2022, 17, 984–1002. [Google Scholar] [CrossRef]
- Jensen, K.L.; Yenerall, J.; Chen, X.; Yu, T.E. US Consumers’ Online Shopping Behaviors and Intentions During and After the COVID-19 Pandemic. J. Agric. Appl. Econ. 2021, 53, 416–434. [Google Scholar] [CrossRef]
- Statista Online Grocery Shopping Frequency in Russia 2023. Available online: https://www.statista.com/statistics/1407298/russia-online-grocery-shopping-frequency/ (accessed on 1 December 2023).
- Martín, J.; Pagliara, F.; Román, C. The Research Topics on E-Grocery: Trends and Existing Gaps. Sustainability 2019, 11, 321. [Google Scholar] [CrossRef]
- Samudio Lezcano, M.; Harper, C.D.; Nock, D.; Lowry, G.V.; Michalek, J.J. Online Grocery Delivery: Sustainable Practice, or Congestion Generator and Environmental Burden? Transp. Res. Part D Transp. Environ. 2023, 119, 103722. [Google Scholar] [CrossRef]
- Schnieder, M.; Hinde, C.; West, A. Land Efficient Mobility and Emissions: Click and Collect vs. Grocery Deliveries in Switzerland. Sustainability 2023, 15, 8814. [Google Scholar] [CrossRef]
- Hardi, L.; Wagner, U. Grocery Delivery or Customer Pickup—Influences on Energy Consumption and CO2 Emissions in Munich. Sustainability 2019, 11, 641. [Google Scholar] [CrossRef]
- Wygonik, E.; Goodchild, A. Evaluating the Efficacy of Shared-Use Vehicles for Reducing Greenhouse Gas Emissions: A U.S. Case Study of Grocery Delivery. J. Transp. Res. Forum 2012, 51, 2. [Google Scholar] [CrossRef]
- Tehrani, S.M.; Karbassi, A.; Ghoddosi, J. Prediction of Energy Consumption and Urban Air Pollution Reduction in E-Shopping Adoption. Int. J. Food Agric. Environ. 2009, 34, 898–903. [Google Scholar]
- Ranieri, L.; Digiesi, S.; Silvestri, B.; Roccotelli, M. A Review of Last Mile Logistics Innovations in an Externalities Cost Reduction Vision. Sustainability 2018, 10, 782. [Google Scholar] [CrossRef]
- Oliveira, C.; Albergaria De Mello Bandeira, R.; Vasconcelos Goes, G.; Schmitz Gonçalves, D.; D’Agosto, M. Sustainable Vehicles-Based Alternatives in Last Mile Distribution of Urban Freight Transport: A Systematic Literature Review. Sustainability 2017, 9, 1324. [Google Scholar] [CrossRef]
- Schnieder, M.; Hinde, C.; West, A. Land Consumption of Delivery Robots and Bicycle Couriers for On-Demand Meal Delivery Using GPS Data and Simulations Based on the Time-Area Concept. Sustainability 2021, 13, 11375. [Google Scholar] [CrossRef]
- Heard, B.R.; Bandekar, M.; Vassar, B.; Miller, S.A. Comparison of Life Cycle Environmental Impacts from Meal Kits and Grocery Store Meals. Resour. Conserv. Recycl. 2019, 147, 189–200. [Google Scholar] [CrossRef]
- Kvalsvik, F. Understanding the Role of Situational Factors on Online Grocery Shopping among Older Adults. J. Retail. Consum. Serv. 2022, 68, 103009. [Google Scholar] [CrossRef]
- Trude, A.C.B.; Lowery, C.M.; Ali, S.H.; Vedovato, G.M. An Equity-Oriented Systematic Review of Online Grocery Shopping among Low-Income Populations: Implications for Policy and Research. Nutr. Rev. 2022, 80, 1294–1310. [Google Scholar] [CrossRef] [PubMed]
- Pitts, S.B.J.; Ng, S.W.; Blitstein, J.L.; Gustafson, A.; Niculescu, M. Online Grocery Shopping: Promise and Pitfalls for Healthier Food and Beverage Purchases. Public Health Nutr. 2018, 21, 3360–3376. [Google Scholar] [CrossRef] [PubMed]
- Duffy, E.W.; Lo, A.; Hall, M.G.; Taillie, L.S.; Ng, S.W. Prevalence and Demographic Correlates of Online Grocery Shopping: Results from a Nationally Representative Survey during the COVID-19 Pandemic. Public Health Nutr. 2022, 25, 3079–3085. [Google Scholar] [CrossRef]
- McGuirt, J.T.; Jilcott Pitts, S.B.; Labban, J.D.; Anderson Steeves, E.T.; Haynes-Maslow, L.; Henry, S.; Gustafson, A.A. Evidence of Geospatial and Socioeconomic Disparities in Access to Online Grocery Shopping for Fresh and Frozen Produce in North Carolina. J. Acad. Nutr. Diet. 2022, 122, 2106–2114. [Google Scholar] [CrossRef] [PubMed]
- Rogus, S.; Guthrie, J.F.; Niculescu, M.; Mancino, L. Online Grocery Shopping Knowledge, Attitudes, and Behaviors Among SNAP Participants. J. Nutr. Educ. Behav. 2020, 52, 539–545. [Google Scholar] [CrossRef] [PubMed]
- Frank, D.A.; Peschel, A.O. Sweetening the Deal: The Ingredients That Drive Consumer Adoption of Online Grocery Shopping. J. Food Prod. Mark. 2020, 26, 535–544. [Google Scholar] [CrossRef]
- Zheng, Q.; Chen, J.; Zhang, R.; Wang, H.H. What Factors Affect Chinese Consumers’ Online Grocery Shopping? Product Attributes, e-Vendor Characteristics and Consumer Perceptions. China Agric. Econ. Rev. 2020, 12, 193–213. [Google Scholar] [CrossRef]
- Hand, C.; Riley, F.D.O.; Harris, P.; Singh, J.; Rettie, R. Online Grocery Shopping: The Influence of Situational Factors. Eur. J. Mark. 2009, 43, 1205–1219. [Google Scholar] [CrossRef]
- Van Droogenbroeck, E.; Van Hove, L. Adoption of Online Grocery Shopping: Personal or Household Characteristics? J. Internet Commer. 2017, 16, 255–286. [Google Scholar] [CrossRef]
- Bezirgani, A.; Lachapelle, U. Online Grocery Shopping for the Elderly in Quebec, Canada: The Role of Mobility Impediments and Past Online Shopping Experience. Travel Behav. Soc. 2021, 25, 133–143. [Google Scholar] [CrossRef]
- Piroth, P.; Ritter, M.S.; Rueger-Muck, E. Online Grocery Shopping Adoption: Do Personality Traits Matter? Br. Food J. 2020, 122, 957–975. [Google Scholar] [CrossRef]
- Dolcini, M.M.; Canchola, J.A.; Catania, J.A.; Song Mayeda, M.M.; Dietz, E.L.; Cotto-Negrón, C.; Narayanan, V. National-Level Disparities in Internet Access Among Low-Income and Black and Hispanic Youth: Current Population Survey. J. Med. Internet Res. 2021, 23, e27723. [Google Scholar] [CrossRef]
- Katz, V.S. What It Means to Be “under-Connected” in Lower-Income Families. J. Child. Media 2017, 11, 241–244. [Google Scholar] [CrossRef]
- Alhaimer, R. Fluctuating Attitudes and Behaviors of Customers toward Online Shopping in Times of Emergency: The Case of Kuwait during the COVID-19 Pandemic. J. Internet Commer. 2022, 21, 26–50. [Google Scholar] [CrossRef]
- Barska, A.; Wojciechowska-Solis, J. Consumers and Local Food Products: A Perspective for Developing Online Shopping for Local Goods in Poland. Sustainability 2020, 12, 4958. [Google Scholar] [CrossRef]
- Beckers, J.; Cárdenas, I.; Verhetsel, A. Identifying the Geography of Online Shopping Adoption in Belgium. J. Retail. Consum. Serv. 2018, 45, 33–41. [Google Scholar] [CrossRef]
- Gomes, S.; Lopes, J.M. Evolution of the Online Grocery Shopping Experience during the COVID-19 Pandemic: Empiric Study from Portugal. J. Theor. Appl. Electron. Commer. Res. 2022, 17, 909–923. [Google Scholar] [CrossRef]
- Hui, T.-K.; Wan, D. Who Are the Online Grocers? Serv. Ind. J. 2009, 29, 1479–1489. [Google Scholar] [CrossRef]
- Raijas, A. The Consumer Benefits and Problems in the Electronic Grocery Store. J. Retail. Consum. Serv. 2002, 9, 107–113. [Google Scholar] [CrossRef]
- Ramachandran, K.K.; Karthick, K.K.; Kumar, M.S. Online Shopping in the UK. Int. Bus. Econ. Res. J. 2011, 10, 23. [Google Scholar] [CrossRef]
- ITU Digital Technologies to Achieve the UN SDGs. Available online: https://www.itu.int/en/mediacentre/backgrounders/Pages/icts-to-achieve-the-united-nations-sustainable-development-goals.aspx (accessed on 4 December 2023).
- Mondejar, M.E.; Avtar, R.; Diaz, H.L.B.; Dubey, R.K.; Esteban, J.; Gómez-Morales, A.; Hallam, B.; Mbungu, N.T.; Okolo, C.C.; Prasad, K.A.; et al. Digitalization to Achieve Sustainable Development Goals: Steps towards a Smart Green Planet. Sci. Total Environ. 2021, 794, 148539. [Google Scholar] [CrossRef]
- Estevão, J.; Lopes, J.D.; Penela, D. SDG9 and the Competitiveness: Employing Mixed Methods to Understand How Countries Can Use Science to Compete. Technol. Forecast. Soc. Chang. 2023, 187, 122178. [Google Scholar] [CrossRef]
- Singh, H.P.; Alshammari, K. Impacts of Digital Technology-Enabled Personalized and Adaptive Learning on Student Learning Performance: A TOE Framework for Saudi Arabia. Int. Trans. J. Eng. Manag. Appl. Sci. Technol. 2021, 12, 1–12. [Google Scholar] [CrossRef]
- Singh, S.; Ru, J. Goals of Sustainable Infrastructure, Industry, and Innovation: A Review and Future Agenda for Research. Environ. Sci. Pollut. Res. 2023, 30, 28446–28458. [Google Scholar] [CrossRef]
- Hansen, T. Consumer Adoption of Online Grocery Buying: A Discriminant Analysis. Int. J. Retail Distrib. Manag. 2005, 33, 101–121. [Google Scholar] [CrossRef]
- Eriksson, N.; Stenius, M. Online Grocery Shoppers Due to the COVID-19 Pandemic—An Analysis of Demographic and Household Characteristics. Procedia Comput. Sci. 2021, 196, 93–100. [Google Scholar] [CrossRef]
- Zatz, L.Y.; Moran, A.J.; Franckle, R.L.; Block, J.P.; Hou, T.; Blue, D.; Greene, J.C.; Gortmaker, S.; Bleich, S.N.; Polacsek, M.; et al. Comparing Shopper Characteristics by Online Grocery Ordering Use among Households in Low-Income Communities in Maine. Public Health Nutr. 2021, 24, 5127–5132. [Google Scholar] [CrossRef]
- Brand, C.; Schwanen, T.; Anable, J. ‘Online Omnivores’ or ‘Willing but Struggling’? Identifying Online Grocery Shopping Behavior Segments Using Attitude Theory. J. Retail. Consum. Serv. 2020, 57, 102195. [Google Scholar] [CrossRef]
- Wang, O.; Somogyi, S. Consumer Adoption of Online Food Shopping in China. Br. Food J. 2018, 120, 2868–2884. [Google Scholar] [CrossRef]
- Saphores, J.-D.; Xu, L. E-Shopping Changes and the State of E-Grocery Shopping in the US—Evidence from National Travel and Time Use Surveys. Res. Transp. Econ. 2021, 87, 100864. [Google Scholar] [CrossRef]
- Etumnu, C.E.; Foster, K.A.; Widmar, N.O.; Lusk, J.L.; Ortega, D.L.; Etumnu, C.E.; Foster, K.A.; Widmar, N.O.; Lusk, J.L.; Ortega, D.L. Drivers of Online Grocery Shopping. In Proceedings of the Agricultural and Applied Economics Association (AAEA) Conferences 2019 Annual Meeting, Atlanta, Georgia, 21–23 July 2019. [Google Scholar]
- Ramus, K.; Asger Nielsen, N. Online Grocery Retailing: What Do Consumers Think? Internet Res. 2005, 15, 335–352. [Google Scholar] [CrossRef]
- Rummo, P.E.; Roberto, C.A.; Thorpe, L.E.; Troxel, A.B.; Elbel, B. Age-Specific Differences in Online Grocery Shopping Behaviors and Attitudes among Adults with Low Income in the United States in 2021. Nutrients 2022, 14, 4427. [Google Scholar] [CrossRef] [PubMed]
- Chintagunta, P.K.; Chu, J.; Cebollada, J. Quantifying Transaction Costs in Online/Off-Line Grocery Channel Choice. Mark. Sci. 2012, 31, 96–114. [Google Scholar] [CrossRef]
- Richards, T.J.; Hamilton, S.F.; Allender, W. Search and Price Dispersion in Online Grocery Markets. Int. J. Ind. Organ. 2016, 47, 255–281. [Google Scholar] [CrossRef]
- Bell, D.R.; Song, S. Neighborhood Effects and Trial on the Internet: Evidence from Online Grocery Retailing. Quant. Mark. Econ. 2007, 5, 361–400. [Google Scholar] [CrossRef]
- Statista Online Grocery Revenue in Russia from 2021 to 2023. Available online: https://www.statista.com/statistics/1413122/russia-e-grocery-revenue/ (accessed on 30 November 2023).
- Baron, C. Leading Online Grocery Retailers in Russia in 3rd Quarter 2022, by Sales Value. Available online: https://www.statista.com/statistics/1117579/russia-online-grocery-sales-by-retailer/#:~:text=BetweenJulyandSeptember2022,%2CX5Group%2CandWildberries (accessed on 5 December 2023).
- Alda, M. Online Food Delivery Services in Russia—Statistics & Facts. Available online: https://www.statista.com/topics/7550/online-food-delivery-services-in-russia/#dossier-chapter5 (accessed on 8 December 2023).
- Ben Hassen, T.; El Bilali, H.; Allahyari, M.S.; Berjan, S.; Fotina, O. Food Purchase and Eating Behavior during the COVID-19 Pandemic: A Cross-Sectional Survey of Russian Adults. Appetite 2021, 165, 105309. [Google Scholar] [CrossRef] [PubMed]
- Lialina, A.V.; Morachevskaya, K.A. Economic Access to Food and COVID-19: New Challenges for the Russian Exclave. Reg. Res. Russ. 2022, 12, 335–349. [Google Scholar] [CrossRef]
- Ben Hassen, T.; El Bilali, H.; Allahyari, M.S.; Berjan, S.; Karabašević, D.; Radosavac, A.; Dašić, G.; Đervida, R. Preparing for the Worst? Household Food Stockpiling during the Second Wave of COVID-19 in Serbia. Sustainability 2021, 13, 11380. [Google Scholar] [CrossRef]
- Steklova, T.N.; Leshcheva, M.G.; Uryadova, T.N.; Steklov, A.N.; Batishcheva, E.A. Impact of the COVID-19 Pandemic on the Development of Online Retailing in Russia. In Digital Technologies and Institutions for Sustainable Development; Bogoviz, A.V., Popkova, E.G., Eds.; Springer: Cham, Switzerland, 2022; pp. 477–481. [Google Scholar]
- Axenov, K.E.; Kraskovskaia, O.V.; Renni, F.M. Spatial Organisation of the New Forms of E-Grocery and Ready-Made Food Trade in a Large Russian City. Balt. Reg. 2022, 14, 28–48. [Google Scholar] [CrossRef]
- Lola, I.; Bakeev, M. What Determines the Differentiation in the E-Commerce Adoption by Consumers: Evidence from Russia. Electron. Commer. Res. 2023, 23, 1143–1159. [Google Scholar] [CrossRef]
- AKIT Internet Trade Turnover by Product Categories in Regions. Available online: https://admin.akit.ru/analytics/ (accessed on 13 September 2023).
- Rosstat Regions of Russia. Socio-Economic Indicators. Available online: https://rosstat.gov.ru/folder/210/document/13204 (accessed on 13 September 2023).
- Atkinson, A.B.; Guio, A.-C.; Marlier, E. Monitoring the Evolution of Income Poverty and Real Incomes over Time; Centre for Analysis of Social Exclusion: London, UK, 2015. [Google Scholar]
- Fixler, D.; Johnson, D.; Craig, A.; Furlong, K. Consistent Data Series to Evaluate Growth and Inequality in the National Accounts. Rev. Income Wealth 2017, 63, S437–S459. [Google Scholar] [CrossRef]
- Nolan, B.; Roser, M.; Thewissen, S. GDP Per Capita Versus Median Household Income: What Gives Rise to the Divergence Over Time and How Does This Vary Across OECD Countries? Rev. Income Wealth 2019, 65, 465–494. [Google Scholar] [CrossRef]
- Data Insight Marketing Research Internet Trading in Russia 2022. Available online: https://datainsight.ru/eCommerce_2022 (accessed on 31 October 2023).
- Melkadze, A. Grocery Shopping Behavior among Russians in 2021, by Store Type. Available online: https://www.statista.com/statistics/1059887/grocery-shopping-behavior-by-store-type-russia/ (accessed on 7 November 2023).
- Allison, P.D. Fixed Effects Regression Models; SAGE Publications: Thousand Oaks, CA, USA, 2009; ISBN 978-1-4833-8927-1. [Google Scholar]
- Brüderl, J.; Ludwig, V. Fixed-Effects Panel Regression. In The SAGE Handbook of Regression Analysis and Causal Inference; Best, H., Wolf, C., Eds.; SAGE Publications Ltd.: London, UK, 2014; pp. 327–358. [Google Scholar]
- Ullah, A.; Wang, T.; Yao, W. Modal Regression for Fixed Effects Panel Data. Empir. Econ. 2021, 60, 261–308. [Google Scholar] [CrossRef]
- Lee, J.; Robinson, P.M. Panel Nonparametric Regression with Fixed Effects. J. Econom. 2015, 188, 346–362. [Google Scholar] [CrossRef][Green Version]
- Giesselmann, M.; Schmidt-Catran, A.W. Interactions in Fixed Effects Regression Models. Sociol. Methods Res. 2022, 51, 1100–1127. [Google Scholar] [CrossRef]
- Amini, S.; Delgado, M.S.; Henderson, D.J.; Parmeter, C.F. Fixed vs Random: The Hausman Test Four Decades Later. In Advances in Econometrics; Baltagi, B.H., Carter Hill, R., Newey, W.K., White, H.L., Eds.; Emerald Group Publishing Limited: Leeds, UK, 2012; Volume 29, pp. 479–513. ISBN 978-1-78190-307-0/978-1-78190-308-7. [Google Scholar]
- Singh, H.P.; Alhulail, H.N. Information Technology Governance and Corporate Boards’ Relationship with Companies’ Performance and Earnings Management: A Longitudinal Approach. Sustainability 2023, 15, 6492. [Google Scholar] [CrossRef]
- Massey, F.J. The Kolmogorov-Smirnov Test for Goodness of Fit. J. Am. Stat. Assoc. 1951, 46, 68–78. [Google Scholar] [CrossRef]
- Anyutin, A.P.; Khodykina, T.M.; Akimova, E.I.; Belova, E.V.; Shashina, E.A.; Shcherbakov, D.V.; Makarova, V.V.; Zabroda, N.N.; Klimova, A.A.; Ermakova, N.A.; et al. Study of the Deep Processes of COVID-19 in Russia: Finding Ways to Identify Preventive Measures. Int. J. Environ. Res. Public Health 2022, 19, 14714. [Google Scholar] [CrossRef]
- Fang, L.; Wang, D.; Pan, G. Analysis and Estimation of COVID-19 Spreading in Russia Based on ARIMA Model. SN Compr. Clin. Med. 2020, 2, 2521–2527. [Google Scholar] [CrossRef] [PubMed]
- Andreeva, A.A.; Koroleva, D.O.; Kosaretsky, S.G.; Frumin, I.D. Pandemic Lessons: Story of Cooperation and Competition in Russian Education. In Schools and Society during the COVID-19 Pandemic; Springer: Cham, Switzerland, 2024; pp. 169–192. [Google Scholar]
- Tishkov, V.A.; Butovskaya, M.L.; Stepanov, V.V. Society and the State in Russia and the World during the Coronavirus Epidemic. Her. Russ. Acad. Sci. 2022, 92, 520–530. [Google Scholar] [CrossRef]
- Matasov, V.; Vasenev, V.; Matasov, D.; Dvornikov, Y.; Filyushkina, A.; Bubalo, M.; Nakhaev, M.; Konstantinova, A. COVID-19 Pandemic Changes the Recreational Use of Moscow Parks in Space and Time: Outcomes from Crowd-Sourcing and Machine Learning. Urban For. Urban Green. 2023, 83, 127911. [Google Scholar] [CrossRef]
- Zinchenko, Y.P.; Shaigerova, L.A.; Almazova, O.V.; Shilko, R.S.; Vakhantseva, O.V.; Dolgikh, A.G.; Veraksa, A.N.; Kalimullin, A.M. The Spread of COVID-19 in Russia: Immediate Impact on Mental Health of University Students. Psychol. Stud. 2021, 66, 291–302. [Google Scholar] [CrossRef]
- Kaewkitipong, L.; Chen, C.; Ractham, P. Examining Factors Influencing COVID-19 Vaccine Tourism for International Tourists. Sustainability 2021, 13, 12867. [Google Scholar] [CrossRef]
- Allam, Z.; Bibri, S.E.; Sharpe, S.A. The Rising Impacts of the COVID-19 Pandemic and the Russia–Ukraine War: Energy Transition, Climate Justice, Global Inequality, and Supply Chain Disruption. Resources 2022, 11, 99. [Google Scholar] [CrossRef]
- Gostin, L.O.; Friedman, E.A.; Hossain, S.; Mukherjee, J.; Zia-Zarifi, S.; Clinton, C.; Rugege, U.; Buss, P.; Were, M.; Dhai, A. Human Rights and the COVID-19 Pandemic: A Retrospective and Prospective Analysis. Lancet 2023, 401, 154–168. [Google Scholar] [CrossRef] [PubMed]
- Kravchenko, N.A.; Ivanova, A.I. Spread of the COVID-19 In Russia: Regional Peculiarities. Reg. Res. Russ. 2021, 11, 428–434. [Google Scholar] [CrossRef]
- Stipp, H. Share of Russians Who Discovered New Online Stores during the Self-Isolation Period in Russia in 2020, by Type. Available online: https://www.statista.com/statistics/1126849/e-store-types-discovered-during-self-isolation-russia/ (accessed on 30 September 2023).
- Singh, H.P.; Alshallaqi, M.; Altamimi, M. Predicting Critical Factors Impacting Hotel Online Ratings: A Comparison of Religious and Commercial Destinations in Saudi Arabia. Sustainability 2023, 15, 11998. [Google Scholar] [CrossRef]
- Singh, A.; Singh, H.P.; Alam, F.; Agrawal, V. Role of Education, Training, and E-Learning in Sustainable Employment Generation and Social Empowerment in Saudi Arabia. Sustainability 2022, 14, 8822. [Google Scholar] [CrossRef]
- Singh, H.P.; Singh, A.; Alam, F.; Agrawal, V. Impact of Sustainable Development Goals on Economic Growth in Saudi Arabia: Role of Education and Training. Sustainability 2022, 14, 14119. [Google Scholar] [CrossRef]
- Singh, H.P.; Alhulail, H.N. Predicting Student-Teachers Dropout Risk and Early Identification: A Four-Step Logistic Regression Approach. IEEE Access 2022, 10, 6470–6482. [Google Scholar] [CrossRef]
- Carretero, S.; Stewart, J.; Centeno, C. Information and Communication Technologies for Informal Carers and Paid Assistants: Benefits from Micro-, Meso-, and Macro-Levels. Eur. J. Ageing 2015, 12, 163–173. [Google Scholar] [CrossRef]


Disclaimer/Publisher’s Note: The statements, opinions and data contained in all publications are solely those of the individual author(s) and contributor(s) and not of MDPI and/or the editor(s). MDPI and/or the editor(s) disclaim responsibility for any injury to people or property resulting from any ideas, methods, instructions or products referred to in the content. |
© 2024 by the authors. Licensee MDPI, Basel, Switzerland. This article is an open access article distributed under the terms and conditions of the Creative Commons Attribution (CC BY) license (https://creativecommons.org/licenses/by/4.0/).