Abstract
Infrastructure upgrading has an important impact on environmental protection and low-carbon development. Based on the panel data of 277 prefecture-level cities in China from 2005 to 2021, we examined the impact of infrastructure upgrading on the synergistic effect of pollution reduction and carbon reduction (Pc) by using the multiple-period difference-in-differences method. The results show that infrastructure upgrading can achieve Pc. Additionally, compared with resource-based cities, peripheral cities, and central and western cities, the impact of infrastructure upgrading on Pc is more significant in non-resource-based cities, central cities, and eastern cities. Meanwhile, infrastructure upgrading can promote Pc by promoting scientific and technological talent agglomeration (Tg) and industrial agglomeration (Ig). Finally, the policy of synergy analysis shows that compared with the single pilot cities, the dual pilot cities have a more obvious effect on Pc, and becoming first high-speed rail (HSR) cities and then becoming “Broadband China” strategy (BCS) cities has a stronger effect on Pc. Therefore, to effectively alleviate the dual environmental pressures of pollution reduction and carbon reduction, emphasis should be placed on promoting the common development of transportation infrastructure and digital infrastructure.
1. Introduction
Climate warming and environmental pollution are the two major environmental problems facing the world today, and not only hinder economic growth but also affect people’s health [1,2]. According to the Global Carbon Project (2023), in 2022, China, the United States, India, and the EU27 accounted for 31%, 14%, 8%, and 7% of global fossil CO2 emissions, respectively. By 2023, global fossil carbon dioxide emissions are projected to grow by 1.1%, with China, the United States, India, and the European Union changing by 4%, −3%, 8.2%, and −7.4%, respectively (data source: https://essd.copernicus.org/articles/15/5301/2023/ (accessed on 20 December 2023)). Taking the path of green and low-carbon development and realizing cleaner uses of energy has become a crucial choice for many countries to deal with environmental problems [3,4]. Scholars have been conducting a lot of research on pollution reduction and carbon reduction as two separate problems. Previous studies have mainly explored the effects of the digital economy [5], technological innovation [6], urbanization level [7], demographic factors [8], industrial structure [9], resource utilization [10,11] and transportation infrastructure [12] on pollution emission and carbon emission, but have neglected the role of infrastructure upgrading. Some scholars have also studied pollution reduction and carbon reduction together to explore the environmental effects brought about by the implementation of policies, such as the environmental protection tax [13], the green fiscal policy [14], and the national eco-industrial demonstration park policy [15]. The Chinese government has responded positively to accelerate the achievement of the dual-carbon goal, emphasizing many times that organizations should “adhere to the synergistic promotion of carbon reduction, pollution reduction, greening, and growth, speed up the transportation in key areas such as green low carbon development”, and “coordinate the promotion of traditional infrastructure and new infrastructure construction, and strive to build an intelligent and green modern infrastructure system”. Thus, as the material basis for urban survival and development, infrastructure construction is not only the basic condition for social production and residents’ lives, but also a vital path to fulfill sustainable development. With the upgrading of infrastructure and digital technology, the green nature of infrastructure has gradually emerged, not only bringing more economic benefits but also reducing pollution emissions [16]. Stimulating the low-carbon development of infrastructure and accelerating the deep integration of digitization and greening will contribute to high-quality economic development. Therefore, in this context, with the high-speed rail (HSR) and the “Broadband China” strategy (BCS), it is especially crucial to analyze in depth the impact of infrastructure upgrading on the synergistic effect of pollution reduction and carbon reduction (Pc), which can contribute to Chinese wisdom and Chinese solutions for the world.
Transportation infrastructure is a microcosm of infrastructure construction, and with the basic formation of the high-speed rail network pattern, China has entered the high-speed rail era. By the end of 2022, the mileage of high-speed rail reached 42,000 km, accounting for 27.1% of the national railroad mileage, and accounting for more than two-thirds of the global high-speed railroad mileage [17]. The high-speed rail network is changing the way residents travel and the spatial layout of cities and is characterized by cleanliness and high efficiency. The research on transportation infrastructure mainly involves the following aspects. First, the economic effect: HSR improves regional accessibility, accelerates the process of market integration [18,19,20], acts on the spatial redistribution of labor and other factors of production, facilitates the concentration of talent and industrial agglomeration, and generates knowledge spillover effects [21]. Furthermore, HSR helps to enhance the level of urbanization [22] and reduce the economic gap between regions [23]. Second, the environmental effect. Scholars regard infrastructure as exogenous and explore the connection between it and the environment [24], and the research results mainly focus on the impact of HSR or other modes of transportation on energy consumption and atmospheric pollution, with less attention paid to carbon emissions. The conclusions show that traditional transportation modes emit large amounts of vehicle exhaust, which can cause air quality deterioration [25], while HSR is a more environmentally friendly and efficient mode of transportation [26,27], with fast running speeds, high punctuality rate, a comfortable riding environment, and high levels of safety. It provides more choices for people to travel and will have a certain alternative effect on the traditional modes of transportation [28]. It has gradually become the preferred means of long-distance transportation. From this point of view, HSR can replace the existing means of transportation, change people’s travel modes, reduce the frequency of use of motor vehicles, and then reduce the energy consumption and exhaust emissions of motor vehicles.
In the new era, digital infrastructure is taking over the transportation infrastructure and playing a vital role in reshaping the economic geographic landscape. Digital infrastructure is an updated generation of public infrastructure construction that embodies the characteristics of the digital economy, covering 5G Internet, data centers, industrial Internet, and other fields. It can realize energy saving and carbon reduction with the support of digital technology, and alleviate the “lock-in effect” of traditional infrastructure implementation on the sustainable impact of ecological environment and climate change. The research mainly involves the following aspects. First, the economic effect: digital infrastructure can accelerate the pace of upgrading of traditional industries [29], drive the development of new industries [30], stimulate innovation, increase employment [31], and reduce income inequality [32]. Second, the environmental effect: the construction of infrastructure such as the Internet is green and environmentally friendly. Moreover, digital infrastructure can reduce information asymmetry and transaction costs, help enterprises make more scientific production and operation decisions, accelerate the flow of production factors [33], improve resource utilization, and reduce pollutant emissions [34]. However, some researchers have discovered that digital infrastructure may increase the environmental burden in the short term [35,36], and increasing energy-intensive production may trigger an energy rebound effect, which is harmful to decreasing carbon emissions [37]. It can be observed that there is no unified conclusion on the influence of digital infrastructure on the environment. In addition, some scholars have taken the BCS and pilot smart city construction as entry points to discuss the effect of specific digital infrastructure on enterprise productivity [38], entrepreneurship [39,40], innovation [41], carbon emissions [42,43], energy [44,45], and environmental pollution [46]. So, does infrastructure upgrading contribute to the realization of Pc? Are there spatial and temporal differences in such impacts? What are the core mechanisms? Does the dual pilot policy have a stronger impact on Pc than the single pilot policy? Clarifying the above questions has important practical value for improving infrastructure development and accelerating green and low-carbon development.
Although the environmental effects of transportation infrastructure and digital infrastructure have been abundantly debated by scholars, there is room for deeper exploration on this basis. Firstly, most works in the literature focus on the single effect of transportation infrastructure or digital infrastructure on the environment, ignoring the synergies between these two types of infrastructure. Secondly, the literature on driving factors of Pc mostly focuses on the digital economy, technological innovation, urbanization level, industrial structure, demographic factors, resource utilization, and transportation infrastructure, and takes less notice of the environmental effects of infrastructure upgrading and does not focus on Pc. Finally, there are large differences in the level of economic development, resource endowment, and other conditions among regions, and there is a lack of research on the heterogeneity of the synergistic effect of infrastructure upgrading on pollution reduction and carbon reduction, and the conclusions obtained are not persuasive. Therefore, based on the panel data of 277 prefecture-level cities in China from 2005 to 2021, we estimate the impact of infrastructure upgrading on Pc by using the multiple-period difference-in-differences method.
The marginal contributions of this paper may lie as follows. (1) In terms of research topics, unlike existing studies that analyze the environmental effects of single infrastructure construction, the effect of infrastructure upgrading on Pc is explored, and the possible synergistic effect between transportation infrastructure and digital infrastructure is taken into account, which is a reasonable addition to the existing research results. (2) In terms of identification strategy, based on the exogenous shock of the establishment of the dual pilot, the multiple-period difference-in-differences method was used to systematically assess the magnitude of the effect of infrastructure upgrading on Pc, as well as the specific mechanism of the effect. (3) The “net effect” of the dual pilot policy on Pc, which is different from that of the single pilot policy, was captured, and the heterogeneous impacts of the differences in the characteristics of the cities themselves and the order of policy implementation on Pc were further analyzed.
The rest of this article is arranged as follows. The second part is the research hypothesis. The third part is the methodology and data. The fourth part is the empirical results. The fifth part is the conclusions and policy implications.
2. Research Hypothesis
2.1. Direct Effect
According to the theory of low carbon economy, greenhouse gas emissions and energy consumption are important factors affecting sustainable development, and perfect infrastructure plays an important part in reducing carbon emissions and boosting resource utilization efficiency. Digital infrastructure and transportation infrastructure upgrading are environmentally friendly and have small negative externalities, which provide new opportunities for urban development and can help cities break the “resource curse”. Firstly, we can consider innovative government regulation [47]. Infrastructure upgrading provides technical support for government regulatory model innovation [48], such as remote sensing technology, big data, and other digital technologies to monitor real-time pollution and environmental quality, and the accurate prediction of carbon emissions [49], to realize the goal of early warning of pollution sources. Secondly, the production mode of companies can be optimized. Infrastructure upgrading helps companies to reduce traditional energy consumption, enhance the degree of intensification of enterprise production methods and energy use efficiency [50,51], optimize the operating parameters of the production cycle through data collection and simulation, and transform the traditional production methods into precise control, to attain the aim of optimal production and scientific pollution control [52]. Thirdly, public supervision and green co-management can be strengthened. Infrastructure upgrading provides more channels for the public to understand environmental information and practice green environmental protection concepts, and the public can use digital media to better assume the responsibility of environmental supervision, and actively participate in green governance [53], reflecting the effectiveness of environmental governance promptly, and can build an ecological governance pattern with the government through online public opinion and other channels.
Hypothesis 1.
Infrastructure upgrading can achieve the synergistic effect of pollution reduction and carbon reduction.
2.2. Theoretical Mechanism
Based on the thrust–pull theory, the flow of talents is combined with the thrust of the outflow area and the pull of the inflow area. Whether there is perfect infrastructure construction is one of the key elements of talent flow [54]. Infrastructure upgrading has changed the existing talent demand and created more opportunities for Tg. Schumpeter’s innovation theory points out that under the role of competition, the new combination will replace and eliminate the old combination, and digitally enabled infrastructure can give rise to updated industries, and gradually eliminate backward industries [55]. As the pace of industrial digital transformation accelerates [56], the low-skilled labor force is gradually replaced by machines, and the demand for scientific and technological talents is greatly enhanced. Perfect infrastructure construction can break the time–space limitation of learning, reduce the learning cost [57], and improve human capital skills through diversified communication and learning methods. Tg also affects the environment. First, the knowledge spillover effect: Tg can speed up the knowledge spillover of green technological innovation within and between cities, stimulate the dissemination of new knowledge and environmental protection technique [58,59], and then drive the boosting of energy utilization efficiency, and cut down on the emission of pollutants. Second, the resource sharing effect: Tg can advance the efficiency of infrastructure utilization through the high-speed rail network and digitization [60], which can help to reduce the waste of resources caused by duplicated construction, and then reduce pollution and carbon emissions. Third, the promotion of environmental awareness and example effect, in the process of exchange and cooperation with scientific and technological personnel, the model effect, the same group effect, and the spatial spillover of environmental knowledge can have a “magnet effect”, enhancing environmental awareness and responsibility throughout the region, and promoting green consumption and green production [61].
Hypothesis 2.
Infrastructure upgrading can achieve the synergistic effect of pollution reduction and carbon reduction by attracting scientific and technological talent agglomeration.
According to location theory and new economic geography, transportation cost, traffic accessibility, and resource allocation are key factors to be considered when selecting the location of industries. For one thing, infrastructure upgrading may bring about the “industrial siphon effect”, which is conducive to improving inter-regional traffic accessibility, reducing inter-industry transportation and transaction costs, and accelerating the spatial agglomeration of production factors [62,63]. For another, the Internet and high-speed rail networks can broaden and smooth the communication and cooperation channels between enterprises, establish a good interaction mechanism, promote information sharing, bring financial externality and technological externality for Ig, and enhance the level of cooperation between enterprises and Ig through the overflow impact of muted knowledge. Simultaneously, Ig is an important channel for infrastructure upgrading to influence Pc, and one is the scale effect. From the enterprise level, as the production scale of enterprises continues to expand, the scale effect gradually emerges, and the factor resource allocation efficiency and production efficiency of enterprises can be optimized, which helps to reduce energy consumption. Enterprises in the cluster can not only share public infrastructure, but also share pollution control equipment, reducing pollution control costs caused by duplicated construction [64], and providing more financial support for enterprises to enhance their core competitiveness and environmental governance. From the consumer level, Ig can provide more employment opportunities for workers, increase their income, stimulate the diversified and green consumption demand of residents, and force enterprises to increase green production and environmental governance, thus reducing the non-desired output in the production process. Second, the technology spillover effect: Ig creates more opportunities for cross-industry cooperation and cross-border exchanges among enterprises [65], accelerates technological progress through talent flow, technology exchanges, and innovation activities, and provides support for emerging industries.
Hypothesis 3.
Infrastructure upgrading can achieve the synergistic effect of pollution reduction and carbon reduction by promoting industrial agglomeration.
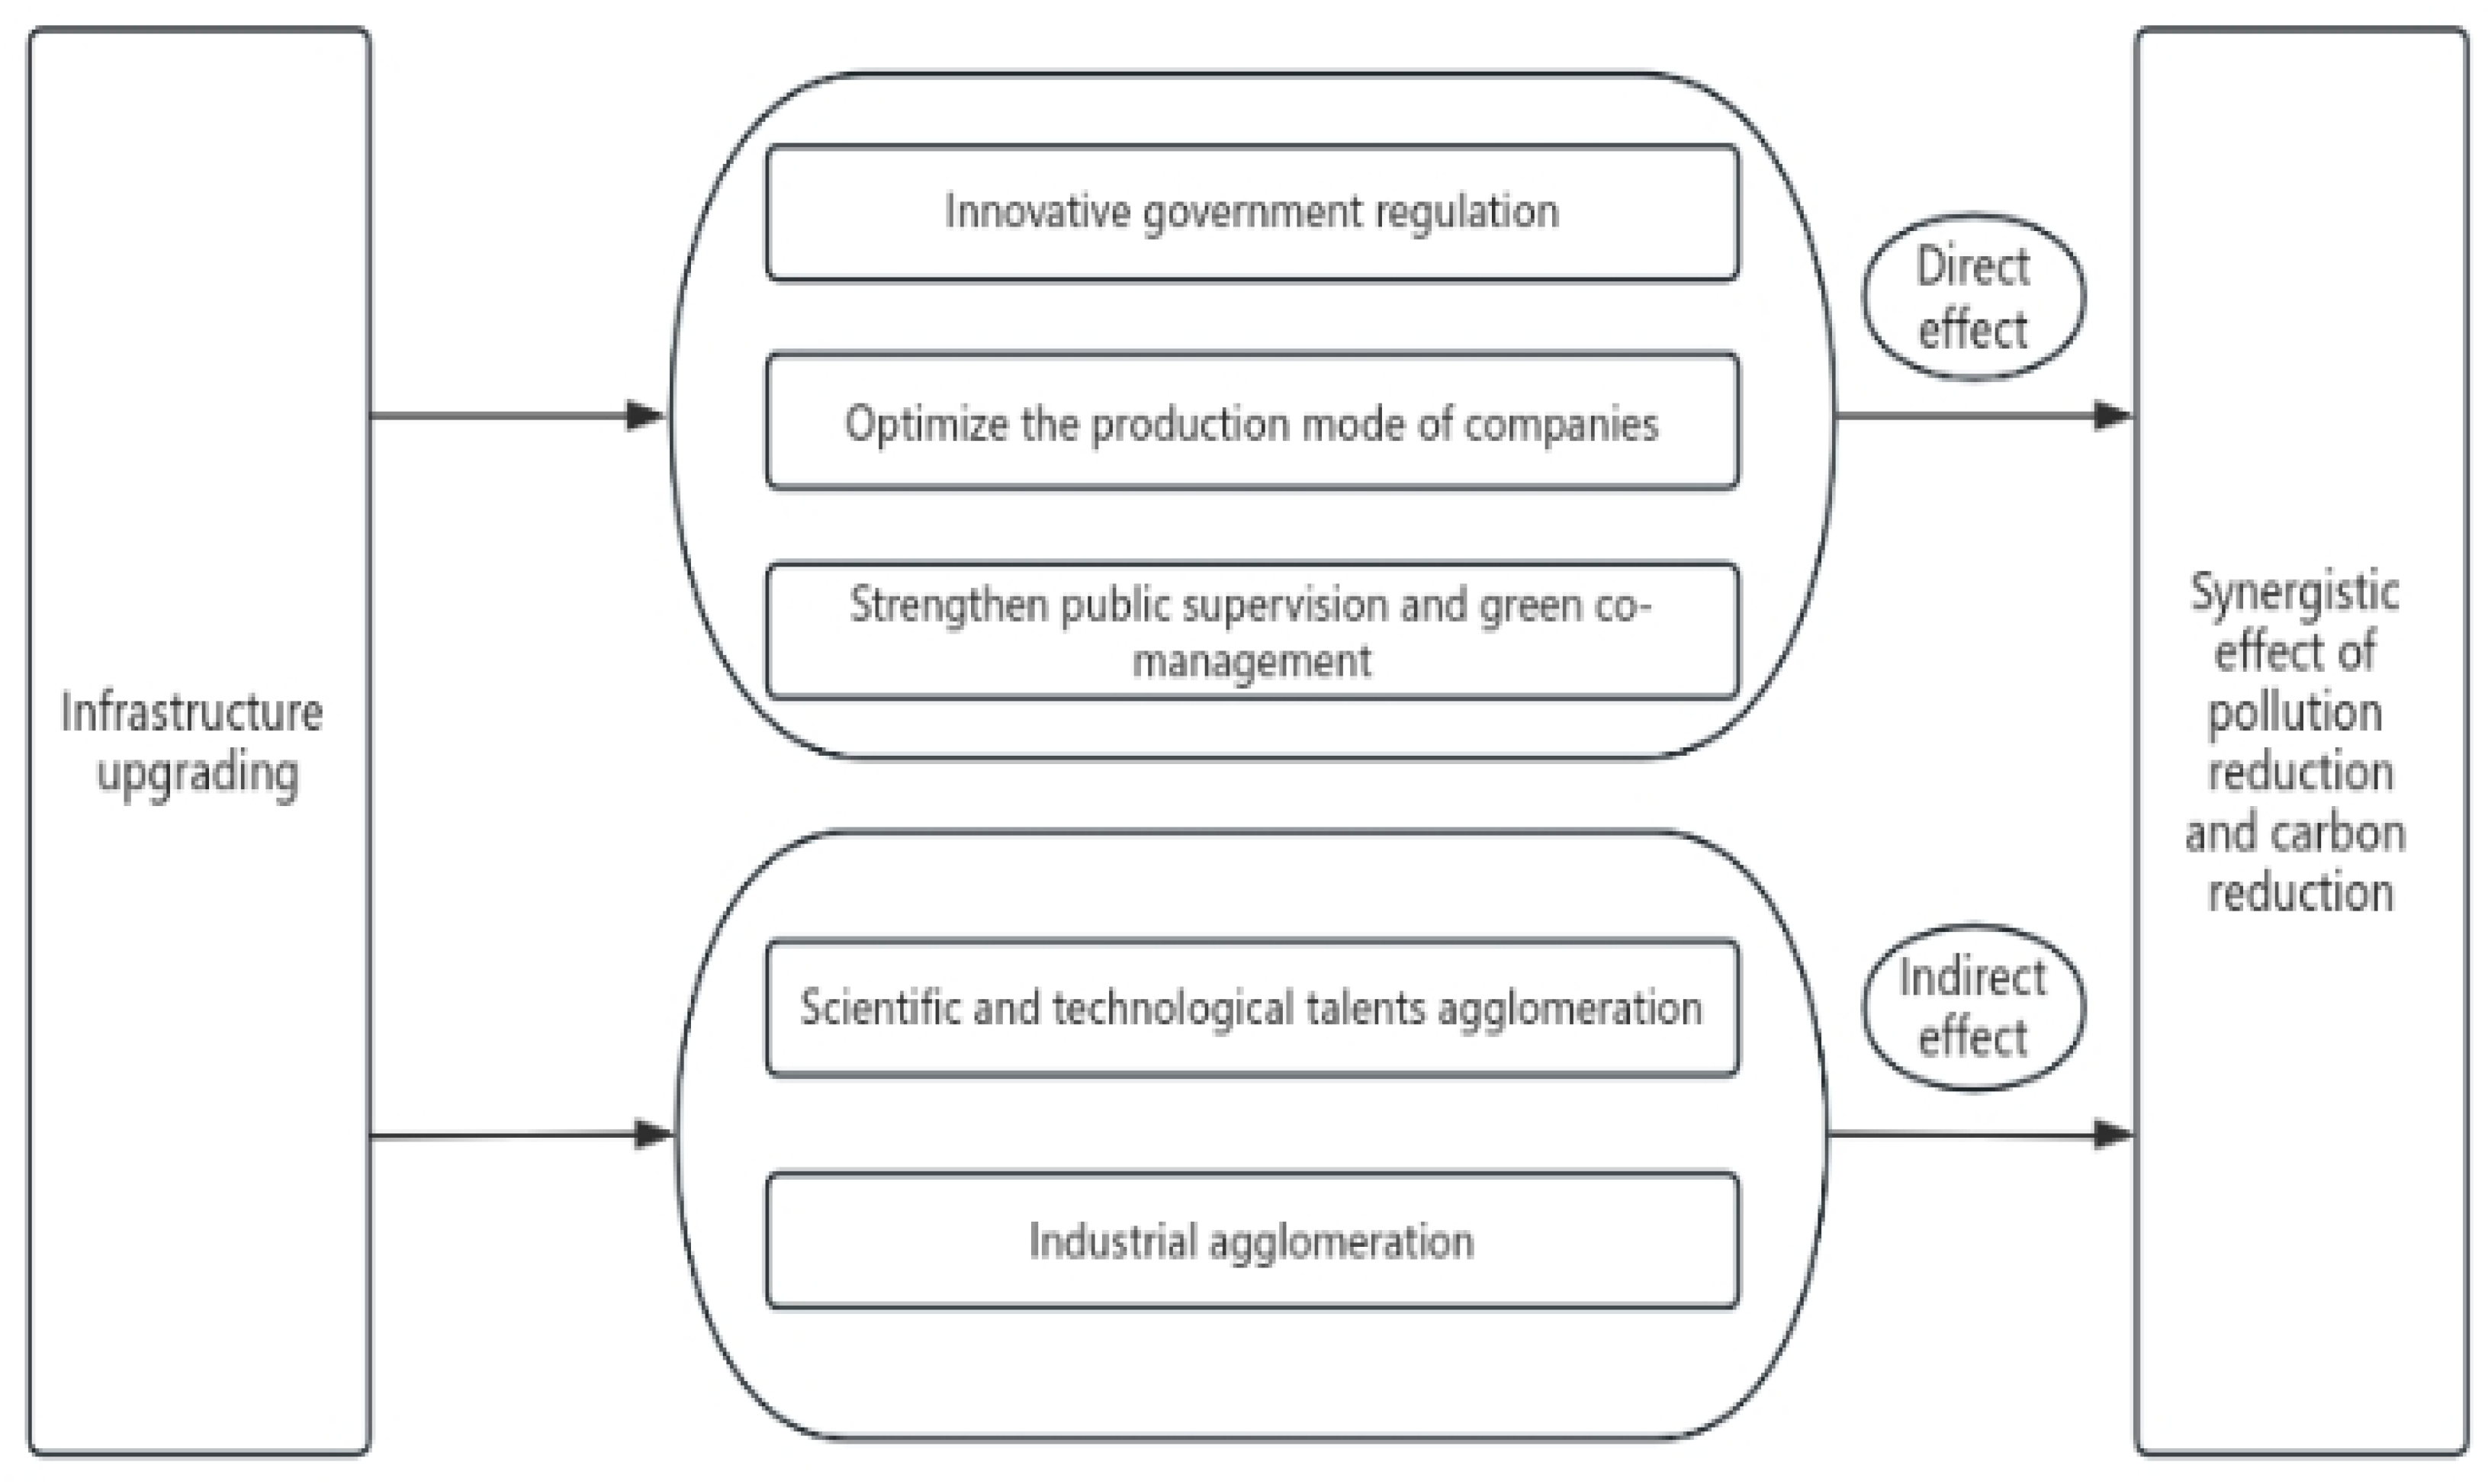
The mechanism diagram is shown in Figure 1.
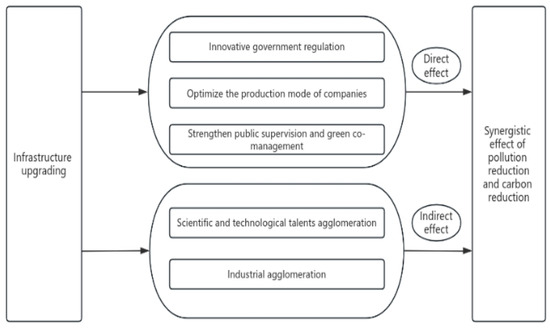
Figure 1.
Mechanism diagram.
3. Methodology and Data
3.1. Model Design
To empirically investigate the policy effect of infrastructure upgrading on Pc, the model is constructed as follows, considering Zhang et al. (2022) [38]:
where the subscripts i and t denote city and year, respectively; Pcit is the explained variable; DIDit is the core explanatory variable, indicating infrastructure upgrading, which is indicated by whether or not it is a pilot city for both HSR and BCS; controlit represents the control variable; μi is the city fixed effect; and εit is the random error term. Among them, the value rule of DID is as follows: the DID variable is 1 for the current and following years when the city meets the requirements of HSR and BCS at the same time, and the rest is 0. β1 is the estimated coefficient that needs to be focused on; if β1 is markedly negative, it indicates that infrastructure upgrading plays a vital driving effect on Pc.
Next, to further explore the mechanism of infrastructure upgrading on Pc, the following recursive equation is constructed on the baseline model (1) regarding Hayes (2009) [66]:
where Wit represents the mediating variables, including Tg and Ig, and λ and β2 are the coefficients focused on in this paper. If λ is markedly positive, it indicates that the infrastructure upgrading has a positive driving effect on Tg and Ind; if θ is significant, and β2 is not significant or less than β1, it indicates that there is a complete or partial mediating effect, and the meaning of the other variables is the same as mentioned above.
3.2. Variable Description
3.2.1. Explained Variable
Synergistic effect of pollution reduction and carbon reduction (Pc). Characterized by using the cross-multiplier term between carbon emission intensity and environmental pollution intensity, which is a negative indicator; if the estimated coefficient before Pc is negative, it shows that infrastructure upgrading helps in the realization of Pc. Carbon emission intensity (Ci) is expressed as the ratio of total carbon emissions to regional GDP, which is logarithmically treated. Referring to Hu (2023) [67] to calculate the total carbon emissions,
where En denotes natural gas consumption, El denotes liquefied petroleum gas consumption, and Ee denotes social electricity consumption; the total carbon emissions are equal to the product of the three energy sources’ consumption and the carbon dioxide conversion factor, γ, λ, and θ denote the carbon dioxide conversion factors of the three energy sources, and η is the share of coal in the gross electricity generation.
Pollution intensity (Pi) is measured by the ratio of total pollutant equivalents to the gross regional product, which is logarithmically treated. The formula is as follows:
where P denotes the sum of pollutant equivalents; Qi denotes the emissions of industrial smoke (dust), industrial sulfur dioxide, and industrial chemical oxygen demand; ei denotes the equivalent value coefficient of the third pollutant, a dimensionless quantity, and the discounted coefficients refer to the “Law of the People’s Republic of China on Environmental Protection Taxes”; and λ, μ, and δ are 2.18/1, 0.95/1, and 1/1, respectively. To avoid an increase in carbon or pollution intensity in the cross-multiplier term, the separate impacts of infrastructure upgrading on Ci and Pi are further explored in robustness tests.
3.2.2. Explanatory Variable
Infrastructure upgrading (DID): referring to Hou et al. (2023) [68] and Zhang and Zheng (2023) [69], according to whether the city is simultaneously HSR and/or BCS, the DID value of the year and subsequent years when the city becomes a dual pilot is represented as 1, and otherwise it is 0. Similarly, the DID variables DIDHSR and DIDBCS of the HSR and BCS involved in the further analysis are assigned a value of 1 in the year when the city is established as the pilot, and in subsequent years 0. By the end of 2021, there were 92 dual pilot cities out of a total sample of 277, which we consider as the treatment group, and the remaining 185 cities constitute the control group.
High-speed rail (HSR): taking June 30 of each year as the boundary, if the city opens the HSR before this, DIDH is assigned a value of 1 in the current year and later; otherwise, DIDHSR takes the value of 0 in the current year and 1 in the next year and later [70]. By the end of 2021, 227 cities in the total sample had high-speed trains. It should be pointed out that the definition of the opening of HSR is mainly based on whether the city has high-speed railway stations. Since some cities have multiple HSR lines, the opening time of the first HSR line through the city will be determined as the year of the opening of HSR in the city.
“Broadband China” strategy (BCS): in 2013, the State Council issued the “Broadband China” Strategy and Implementation Plan, and the National Development and Reform Commission and the Ministry of Industry and Information Technology announced the list of pilot cities (groups) of BCS in three batches in 2014, 2015, and 2016. By the end of 2021, there were 106 BCS cities in the sample of 277 cities. The virtual variable DIDBCS for BCS pilot cities takes the value of 1 in the year of establishment and later years, and 0 otherwise.
3.2.3. Intermediate Variable
① Scientific and technological talents agglomeration (Tg). According to the National Economic Industry Classification (GB-T4754-2017) [71], “scientific research, technical services and geological exploration industry and information transmission, computer services, and software industry employees” are defined as scientific and technological talents, and Tg is measured by the proportion of the number of scientific and technological talents in the total population of the region at the end of the year. ② Industrial agglomeration (Ig). The formula is shown in Equation (6):
where the subscript i denotes the city and t denotes the year; N denotes the number of cities; A denotes the area of the city’s administrative region; ind denotes the logarithm of the regional non-agricultural output value; and Ig indicates industrial agglomeration.
3.2.4. Control Variables
Referring to the existing related research on Pc [72,73,74,75,76], the following five variables were finally selected as control variables: ① Degree of government intervention (Gov), measured by the ratio of local general public budget expenditure to regional GDP. ② Internet level (Inter), expressed as the logarithm of the number of Internet access users. ③ Industrial structure (Str), measured by the ratio of value added of secondary and tertiary industries to regional GDP. ④ Urbanization rate (Ur), measured as the ratio of regional urban population to total regional population. ⑤ Technological Innovation (Tec), expressed as the logarithm of the number of patents granted.
3.3. Data Sources
This paper contains empirical analysis based on the balance panel data of 277 cities in China from 2005 to 2021. Among them, the list of BCS pilot cities is from the official website of the Ministry of Industry and Information Technology, and the data on the opening time of HSR is from the website of the National Railway Administration and the website of the China Railway Corporation. The original data of other variables come from the China Urban Statistical Yearbook (2006–2022), the China Statistical Yearbook (2006–2022), and the statistics database of the China Economic Net, and the missing values are filled in by linear interpolation. The descriptive statistics of each variable are shown in Table 1. The observed value of the selected variable is 4709. The maximum, minimum, and standard deviation of Pc are 10.374, −12.221, and 4.632, respectively, the maximum, minimum, and standard deviation of Ci are 3.601, −11.282, and 4.328, respectively, and the maximum, minimum, and standard deviation of Pi are 7.656, −2.316, and 1.512, respectively, indicating that there are great differences in the carbon emission level and pollutant emission level of the sample cities, and the values of other variables are all within a reasonable range. We performed the multicollinearity test using the VIF method, and the maximum VIF was 3.97, the minimum VIF was 1.15, and the average VIF was 2.19, which is much less than 10, showing that there is no multicollinearity problem. This paper uses Stata software for data processing and analysis.

Table 1.
Descriptive statistics.
4. Empirical Results and Analysis
4.1. Benchmark Regression
To explore the influence of infrastructure upgrading on Pc, the multiple-period difference-in-differences method is used for estimation, and the estimation results are shown in Table 2. Column (1) is the estimation result without considering the control variables, and columns (2) to (6) are the estimation results with the gradual addition of control variables, which shows that, regardless of the inclusion of control variables or not, the coefficient estimate of infrastructure upgrading on Pc is all negative and significant at the 1% confidence level, indicating that infrastructure upgrading can achieve Pc, which is in line with the findings of Zhang et al. (2023) [77] and Zhang et al. (2023) [78]. Hypothesis 1 proposed in this paper is verified. The effects of Gov, Inter, Str, Ur, and Tec on Pc are all negative and significant, indicating that increasing government expenditure, improving the level of the Internet, accelerating the upgrading of industrial structure, increasing the urbanization rate, and promoting technological innovation are all conducive to achieving environmental benefits, which is in line with the findings of Liu et al. (2023) [73] and Qi et al. (2023) [75].
Table 2.
Baseline regressions.
4.2. Robustness Test
4.2.1. Parallel Trend Analysis
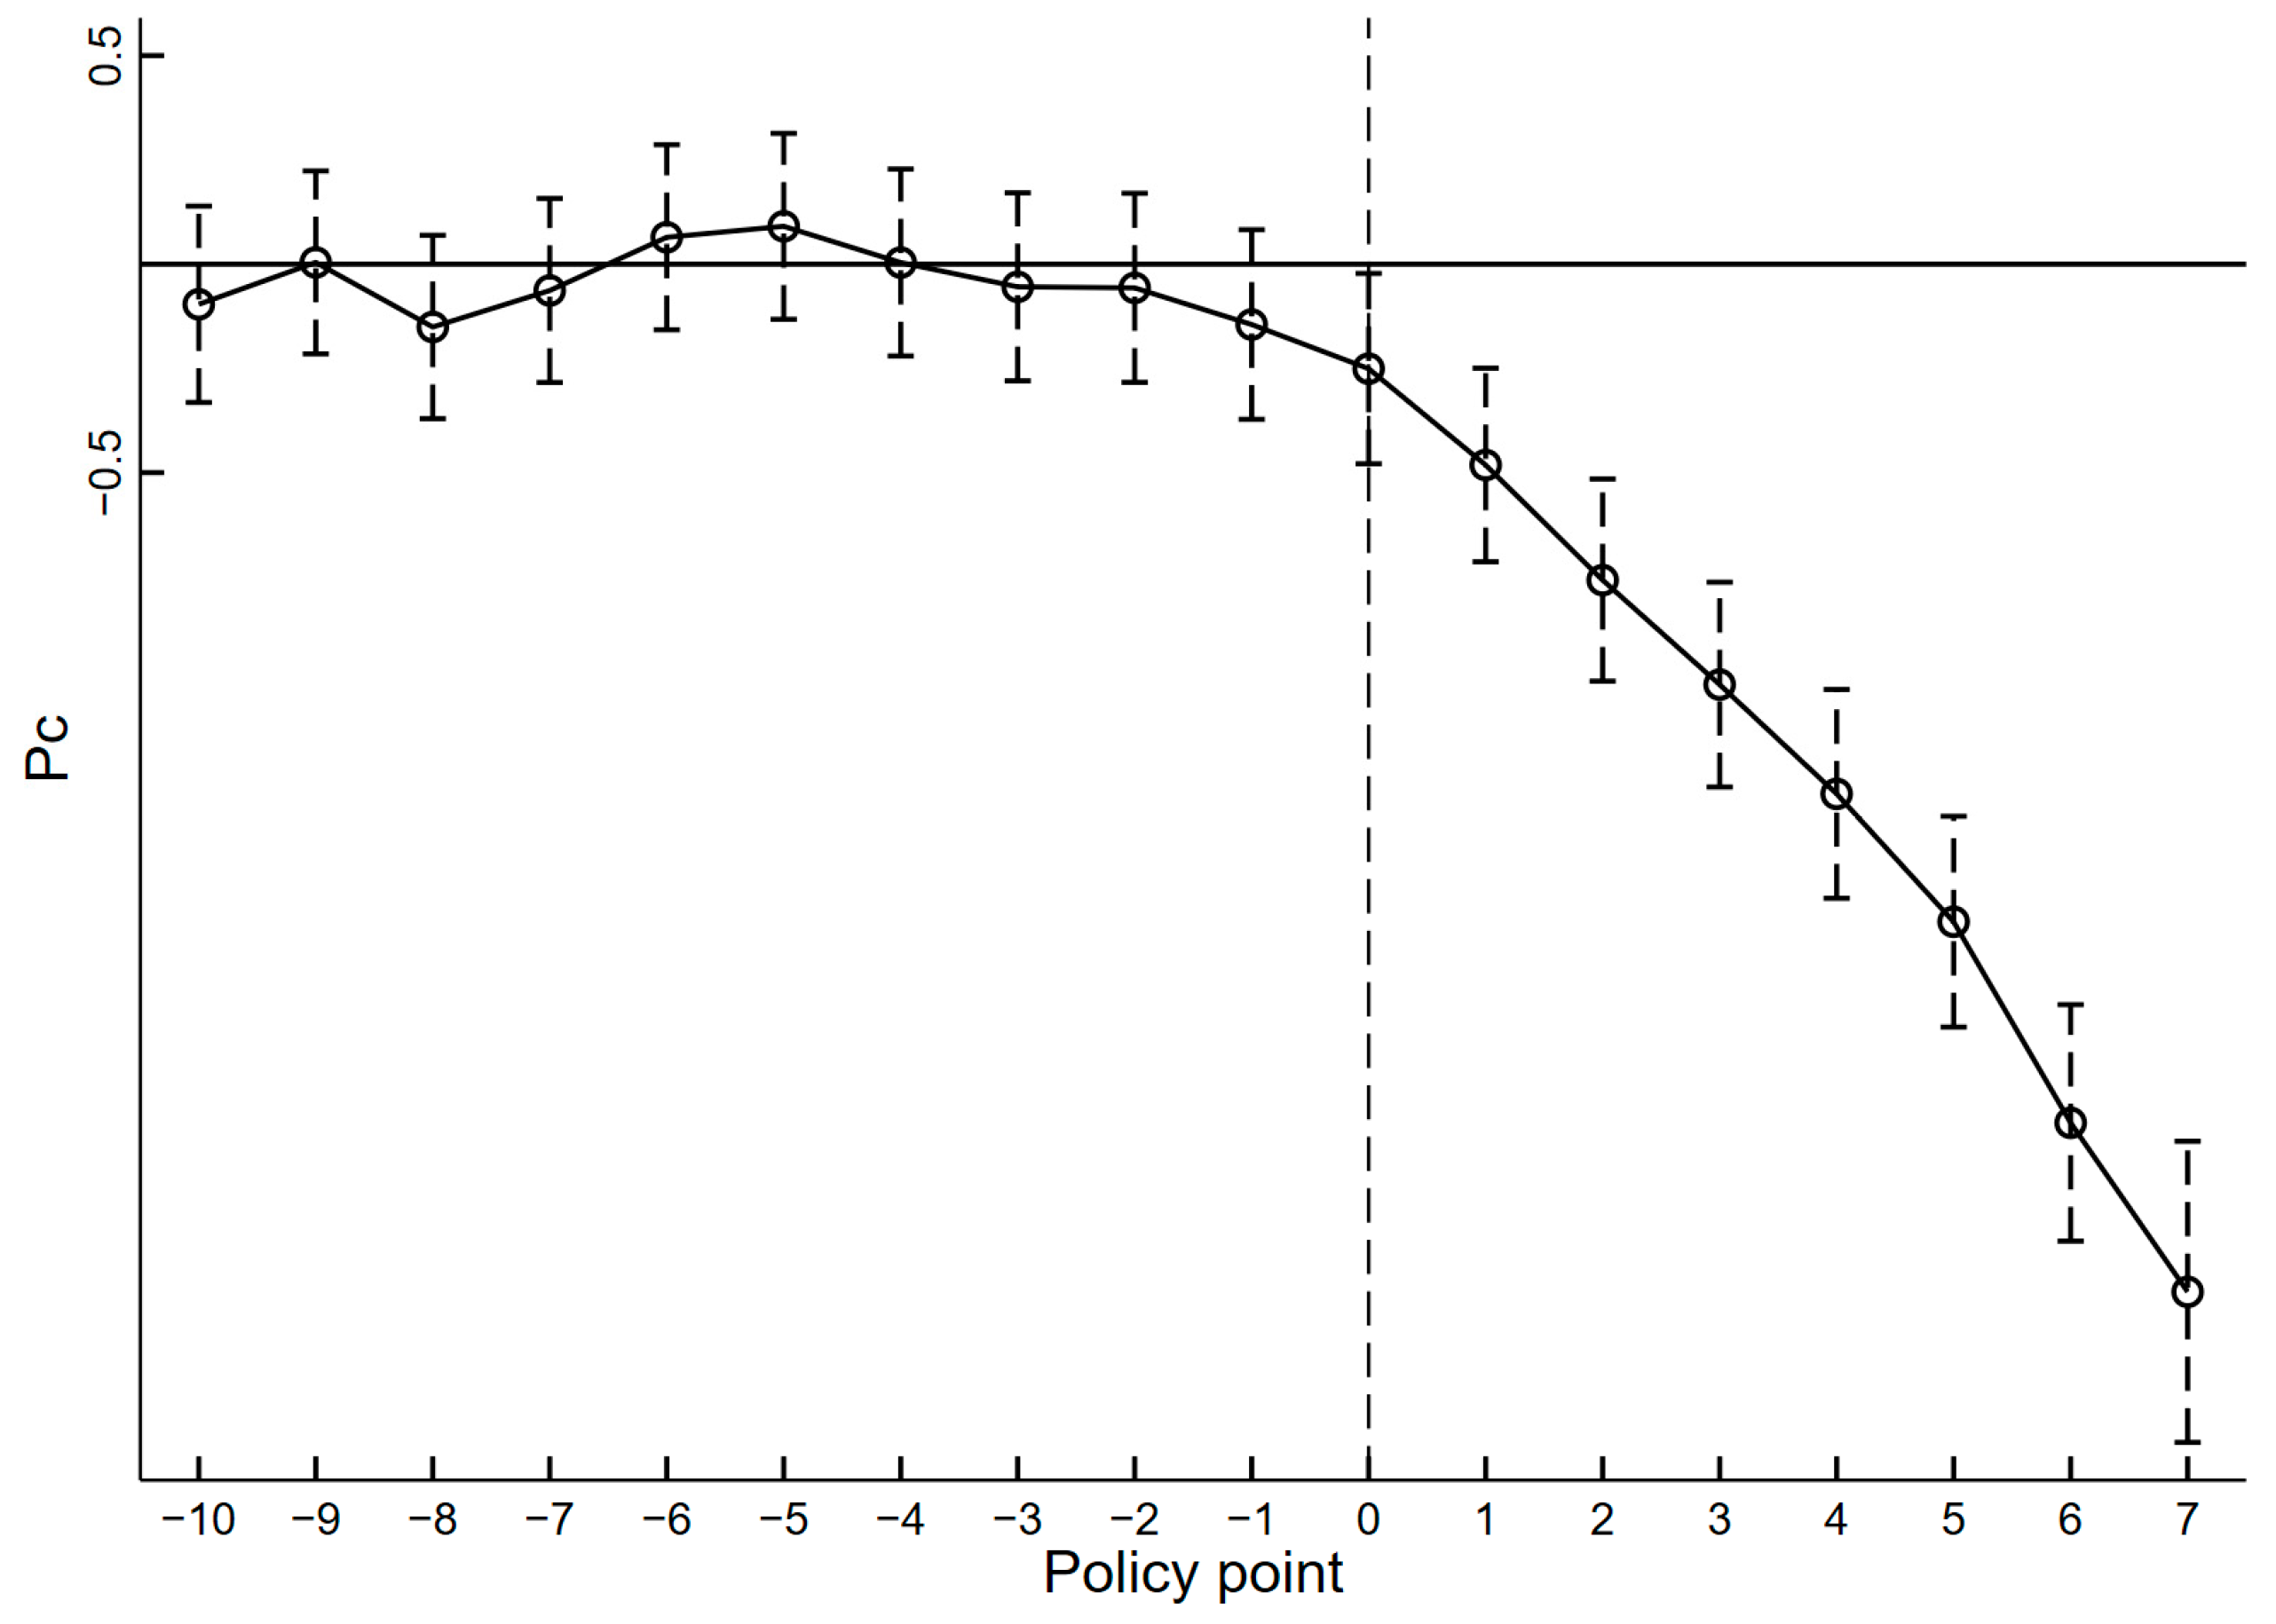
The important premise of estimating the policy effect by using DID is that the treatment group and the control group satisfy the parallel trend to ensure an unbiased estimator. Drawing on the research of Beck et al. (2010) [79], we take the 10 years before the year of enforcement of the dual pilot policies of HSR and BCS as the comparison basis, and construct the crossover term between the year dummy variable and the corresponding policy dummy variable of the 10 years before the enforcement of the dual pilot policy, the start year, and the 7 years after the implementation. To examine the time variation of infrastructure upgrading to Pc, the model is set up as follows:
where DIDit±σ denotes the dummy variable for n years before and after the enforcement of the dual pilot policy, β-σ denotes the effect of σ years before the enforcement of the dual pilot policy, β+σ denotes the effect of σ years after the implementation of the dual pilot policy, β denotes the effect of the dual pilot policy in the current period of its implementation, and the interpretation of the remaining variables is the same as in Equation (1). It can be seen in Figure 2 that the corresponding coefficients of the first 10 years of the enforcement of the dual pilot policy do not pass the test of significance, and the effect of pollution reduction and carbon reduction appear in the year of the dual pilot policy enforcement, which passes the test of the parallel trend.
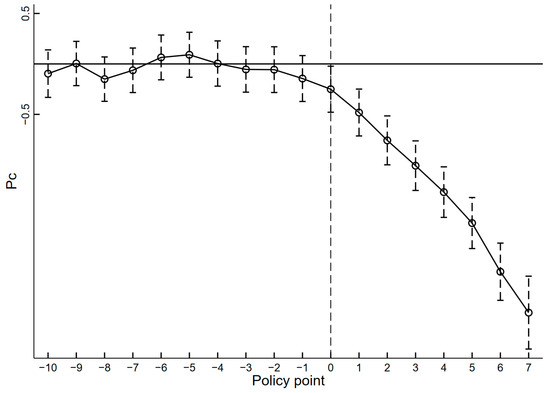
Figure 2.
The policy effect on Pc before and after the implementation of the dual pilot.
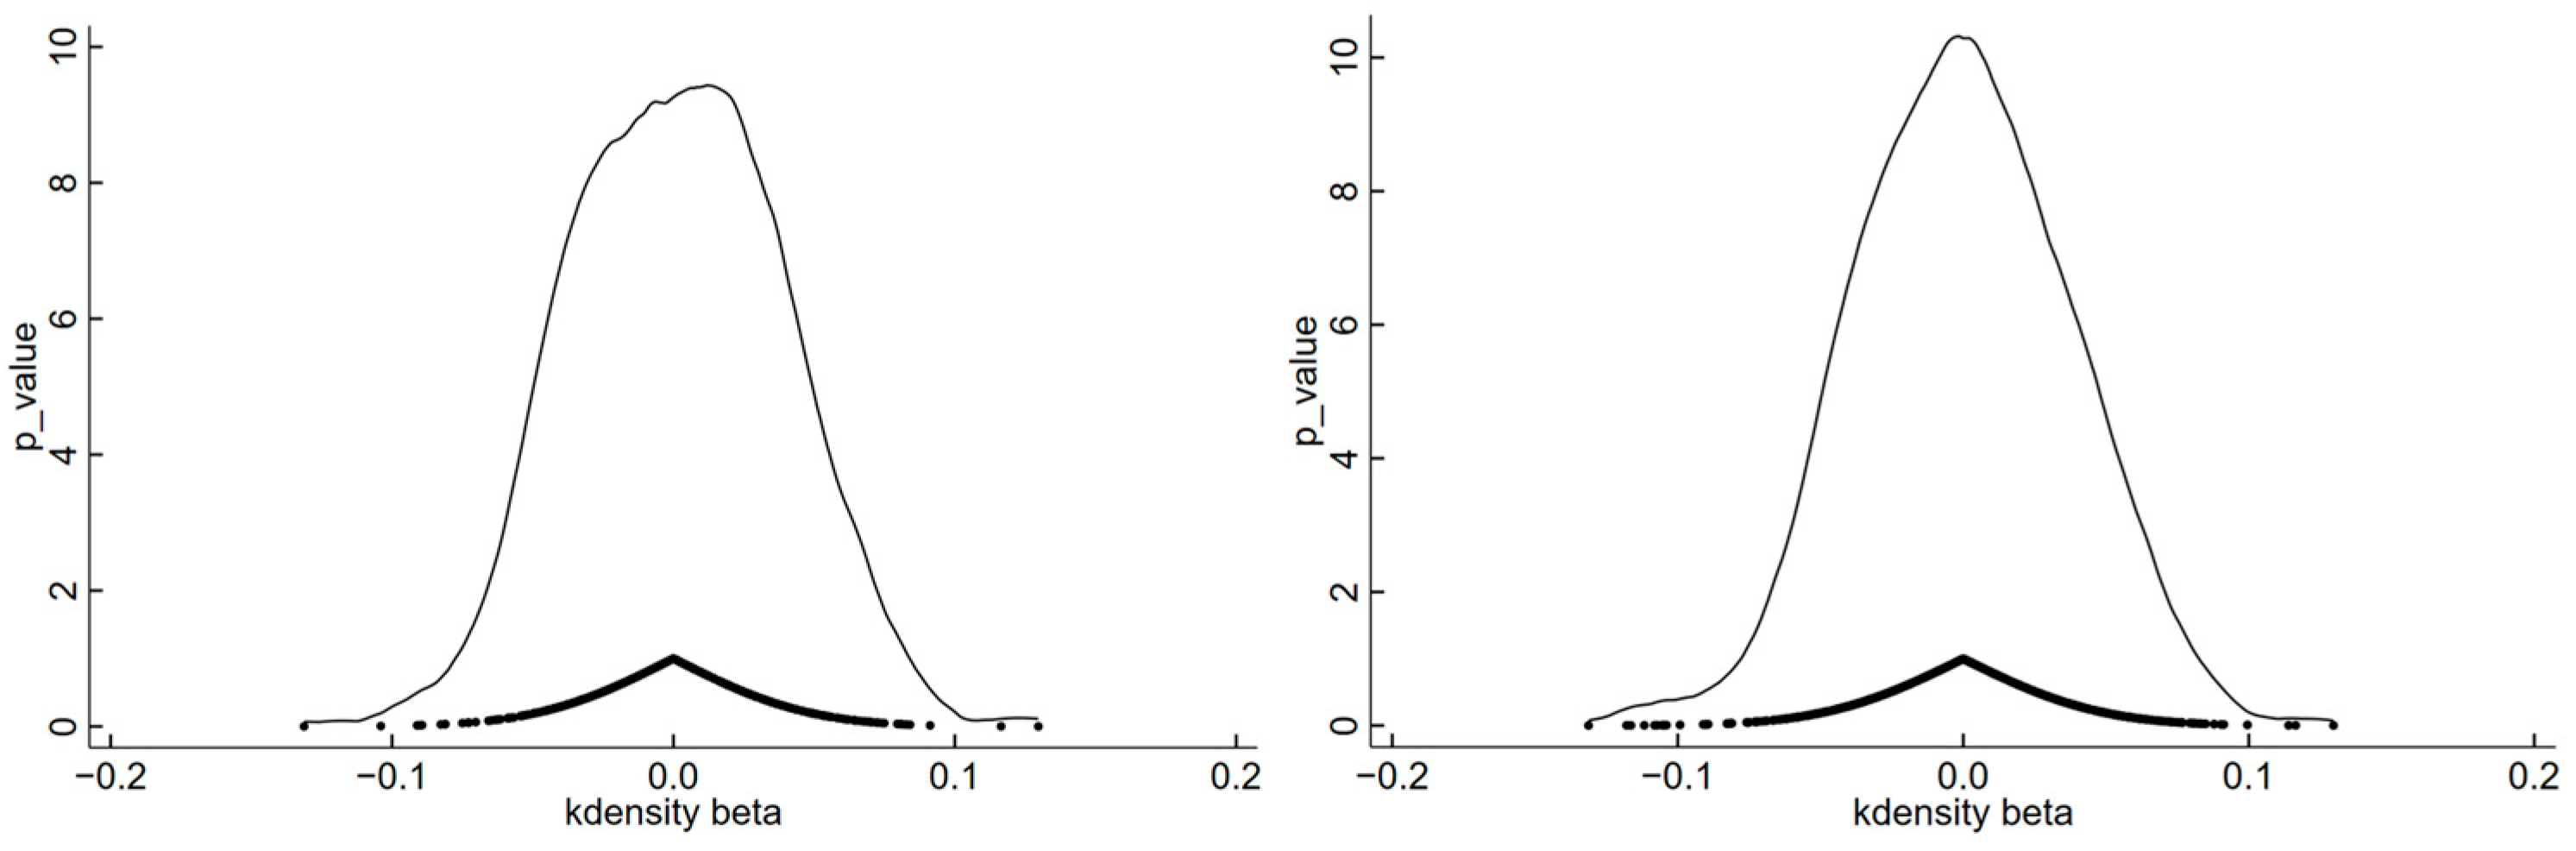
4.2.2. Placebo Test
The placebo test is an important means of determining whether there are other unobservable factors influencing the baseline results. The placebo test is conducted by randomly selecting a sample of dual pilot cities [80]. This is undertaken by constructing dummy experimental group variables by randomly selecting a year as the enforcement time of the dual pilot policy for all observed cities; then, 500 and 1000 regressions are repeated based on Equation (7) for the degree of synergy in reducing pollution and carbon. Figure 3 portrays the distribution of DIDit regression coefficients with Pc as the explained variable. It is observed that the regression coefficient estimated by randomly selecting two pilot cities shows a normal distribution around 0, and it is markedly different from the benchmark results. This indicates that the influence of the dual pilot policy on Pc is not interfered with by other unobservable factors, proving the robustness of the benchmark regression results.
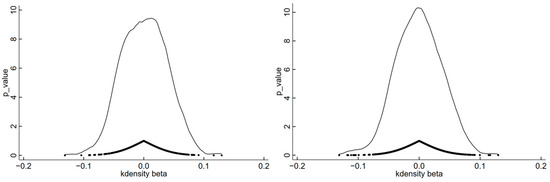
Figure 3.
Placebo test.
4.2.3. Endogeneity Test: Instrumental Variables Approach
Considering that the selection of HSR cities and BCS cities may be non-random, this paper uses the instrumental variable method to examine for endogeneity [81], with the interaction term between terrain undulation and the dual pilot as the instrumental variable, and the results of the two-stage estimation are illustrated in Table 3. For one thing, the degree of terrain undulation can reflect the change in topography, and the bigger the degree of terrain undulation, the more tough it is to construct infrastructure; therefore, the degree of terrain undulation and infrastructure upgrading satisfy the correlation. For another, the degree of terrain undulation is a natural geographic condition formed by history which satisfies the exogenous hypothesis. The first-stage regression results indicate that the coefficient of IV is significantly positive, and the instrumental variables are appropriately selected, and the second-stage regression results represent that the infrastructure upgrading can realize Pc, which is consistent with the previous estimated results.
Table 3.
Results of the instrumental variable method test.
4.2.4. Other Robustness Tests
To ensure the dependability of the baseline results, we further used PSM-DID estimation, the replacement of the explained variable, the exclusion of other policy interferences, the lagging of the core explanatory variable by one period, the elimination of outliers, and the elimination of municipalities to conduct the robustness test, and the test results are illustrated in Table 4.
Table 4.
Results of other robustness tests.
PSM-DID estimation: due to the possible non-randomness problem of dual pilot city establishment, further tests were conducted using the PSM-DID method [82] to improve the reliability of the conclusions, and the estimation result is illustrated in column (1), and the estimated coefficient of the effect of infrastructure upgrading on Pc was −0.610, which passed the test of significance at the 1% level.
Replacement of explained variable: considering that different measurement methods of variables can exert an influence on the estimation results, we adopted two ways to replace the explained variable. First, we re-calculated the Pc. For the carbon reduction index, we used the value of carbon emissions, and for the pollution reduction index, refer to Liang et al. (2019) [83]. Based on the data of three pollutants, industrial sulfur dioxide emissions, industrial wastewater emissions, and industrial soot emissions, the entropy method is used to construct the environmental pollution index, and the Pc is characterized by using the logarithmic value of the total amount of carbon emissions and the cross-multiplier of the environmental pollution index. The estimation result is illustrated in column (2), and the estimated coefficient of the impact of infrastructure upgrading on Pc is markedly negative, which verifies the robustness of the baseline estimation results. Secondly, the Pc is replaced by Ci and Pi, respectively. To avoid the situation of increasing Ci or Pi in the cross-multiplier term, we explored the impact of infrastructure upgrading on Ci and Pi, respectively. The regression results are illustrated in columns (3) and (4), which show that contrasted with the non-pilot areas, the Ci of the dual pilot areas of HSR and BCS decreased by 0.068 and the Pi decreased by 0.864, indicating that infrastructure upgrading has a noteworthy influence on Ci and Pi, and the Pi effect is stronger.
Excluding other policy interferences, previous studies have shown that the establishment of smart cities and low-carbon cities will have a positive influence on Pc [84,85], and the above two policies can be carried out at the same time as the pilot program of HSR and BCS, which may result in an overestimation of the policy effect of infrastructure upgrading. Therefore, we added the policy dummy variables DIDzh and DIDdt, which represent the smart city construction and low-carbon city pilot, as control variables in the benchmark regression, and the estimation result is illustrated in column (5), which shows that the coefficients of DID are still observably negative after excluding other policy interferences, which verifies the robustness of the benchmark estimation results once again.
Lagging of core explanatory variable by one period: Considering the possible lag in policy implementation, the DID variable is subjected to a one-stage lag [86]. The estimation result is illustrated in column (6), where the coefficient of DID is −1.032, which passes the significance test at the 1% level, showing that the baseline estimation results are relatively robust.
Elimination of outliers: Considering the impact of extreme values, the explained variable and control variables are subjected to upper and lower 1% shrinkage [77]. The estimation result is illustrated in column (7), where the effect of infrastructure upgrading on Pc is still significant, which verifies the robustness of the results of the baseline estimation.
Elimination of municipalities: Since Beijing, Shanghai, Tianjin, and Chongqing have a considerable gap compared with other cities in terms of geographic location and economic level, the municipalities are excluded from the regression [34], and the estimation result is illustrated in column (8). The estimated coefficient of the impact of infrastructure upgrading on Pc is −0.865, which passes the test of significance at the 1% level, showing that the baseline estimation result is relatively robust.
4.3. Heterogeneity Analysis
4.3.1. Analysis of Resource Endowment Heterogeneity
Due to the influence of the previous extensive development model, resource-based cities are facing greater pressure towards transformation and environmental governance [87]. Therefore, we divided the sample into resource-based cities and non-resource-based cities according to the State Council’s division of resource cities and explored the heterogeneity of the two samples based on Equation (1), and the estimation results are illustrated in columns (1) and (2) of Table 5. It can be observed that the coefficient estimates of DID are −0.566 and −1.058, respectively, both of which passed the significance test at the 1% level. That is, infrastructure upgrading promotes the synergistic effect of resource-based cities and non-resource-based cities and has a stronger driving effect on Pc in non-resource cities. This may be because the economic development of resource-based cities mainly depends on the secondary industry, because the industrial structure is single, and because the dependence on natural resources is high [88,89]. The environmental issues are more prominent than those of non-resource-based cities, which will affect the policy effect of infrastructure upgrading to some extent.
Table 5.
Results of the heterogeneity test.
4.3.2. Analysis of Center–Periphery City Heterogeneity
According to the “center–periphery” analysis framework, this paper explores the impact of infrastructure upgrading on Pc. The 19 city clusters are divided into city cluster center cities and peripheral cities (Center cities of city clusters: Nanjing, Shanghai, Hangzhou, Zhengzhou, Qingdao, Jinan, Wuhan, Nanchang, Changsha, Yinchuan, Guangzhou, Shenzhen, Lanzhou, Urumqi, Beijing, Tianjin, Hohhot, Shenyang, Dalian, Xi’an, Taiyuan, Harbin, Changchun, Fuzhou, Xiamen, Kunming, Chongqing, Chengdu, Guiyang, and Nanning) and among the 277 city samples examined, there are 30 city cluster center cities and 247 peripheral cities. Based on Equation (1), the two samples are analyzed for heterogeneity, respectively, and the estimation results are illustrated in columns (3) and (4) of Table 5, which show that the driving effect of infrastructure upgrading on Pc in both central and peripheral cities passes the test of significance at the 1% level, and that the coefficient estimations of the DID variable are −1.294 and −0.727, respectively, which implies that infrastructure upgrading can break the market segmentation and space-time boundaries between the central cities and peripheral cities, and drive the peripheral cities to realize Pc, but the policy effect of infrastructure upgrading in central cities is more obvious. The reason for this may be that central cities have high-quality production factors needed for city development, and by attracting the concentration of innovation factors, they can further quicken the pace of Pc.
4.3.3. Analysis of Regional Heterogeneity
China has a huge geographical area and an uneven distribution of cities. There are considerable gaps in the development of cities due to many factors, such as geographic location, resource endowment, administrative level, economic level, and so on [77]. Eastern cities have more advantageous economic and natural conditions, affecting whether the policy effect of infrastructure upgrading varies according to the geographic location of the cities, and whether the policy effect brought about by infrastructure upgrading in eastern cities is more apparent than that of central and western cities. Therefore, this paper divides the sample into eastern cities and central and western cities, and the estimation results are illustrated in columns (5) and (6), which indicate that the driving effect of infrastructure upgrading on Pc is significant in both samples, and the coefficient estimation of the DID variables are −1.047 and −0.813, but the policy effect is more obvious in eastern cities. The reason may be that the eastern cities have a good digital infrastructure environment, and that the Tg effect is more obvious. However, the digital infrastructure of central and western cities is not perfect enough. Due to the limitations of human capital and other factors, the environmental effect of infrastructure upgrading cannot be effectively demonstrated.
4.4. Mechanism Analysis
As can be seen from the above analysis, infrastructure upgrading can significantly enhance Pc. So, how does infrastructure upgrading affect Pc? What is the mechanism of action? According to the theoretical analysis, infrastructure upgrading can influence Pc in two ways: Tg and Ig. This part will examine whether these mechanisms exist.
Table 6 reveals the results of the mechanism test, showing that infrastructure upgrading affects Pc. The results of the mechanism test of Tg are illustrated in columns (1) and (2). Column (1) reveals that the coefficient estimation of the DID variable is markedly positive after adding the Tg variable, which indicates that infrastructure upgrading can promote new formats, reduce the cost of learning and exchange, and strengthen the siphoning effect of talents. Column (2) is the estimation result of adding the variables of Tg and DID at the same time, and the coefficient estimates of DID and Tg are both markedly negative at the 1% confidence level, indicating that the direct effect exists significantly, and Tg plays a partly intermediary role, and the infrastructure upgrading can enhance Pc by strengthening the effect of Tg. Tg can strengthen the spillover effect of green technology in a larger scope, promote green production, reduce resource waste, and promote people’s environmental awareness. Working together from the production side and the consumption side can reduce pollution and carbon emissions. Hypothesis 2 is verified. The results of the mechanism test of Ig are illustrated in columns (3) and (4). Column (3) reveals that the coefficient estimation of the DID variable is markedly positive after adding the Ig variable, which indicates that infrastructure upgrading can reduce the cost of transportation and transaction, broaden the channels of exchanges and cooperation between industries, and bring about an “industrial siphon effect”. Column (4) is the estimation result of adding Ig and DID variables at the same time, and the coefficient estimates of DID and Ig are both markedly negative at the 1% confidence level, indicating that the direct effect exists significantly, and Ig plays a partly intermediary role, and infrastructure upgrading can enhance Pc by strengthening the effect of Ig. Ig can generate a scale effect and improve resource allocation efficiency. Exchanges and cooperation between different industries can bring about a technology spillover, which in turn promotes energy conservation and emission reduction. Hypothesis 3 is verified. To further test whether infrastructure upgrading will have an impact on Pc through Tg and Ig, the paper conducts the Sobel test and Bootstrap test, and the Z-values of the Sobel test are −6.598 and −14.36, respectively. Bootstrap test results show that 95% confidence intervals do not contain 0, which further confirms that Tg and Ig are important mechanisms of infrastructure upgrading influencing Pc, and further verifies Hypothesis 2 and Hypothesis 3.
Table 6.
The mechanism test results of the double pilot on Pc.
4.5. Further Analysis
4.5.1. The Synergistic Effect of HSR and BCS Dual Pilot
It has been shown that HSR and BCS can alleviate environmental problems [90,91,92]. Referring to Zhang and Zheng (2023) [69], we further explore the synergistic effect of HSR and BCS; that is, whether the driving function of the dual pilot on Pc is more efficient than that of the single pilot. The operationalization is as follows.
First, the effects of HSR and BCS on Pc were examined separately. Excluding the sample of BCS cities, only the sample of HSR cities and the sample of cities with neither HSR nor with BCS cities are retained, and the coefficients of the DIDHSR variable reflect the net effect of HSR on Pc, and the estimation results are illustrated in columns (1), (2), and (3) of Table 7. The coefficient estimates of HSR on Pc, Ci, and Pi are −0.890, −0.055, and −0.834, respectively, which pass the test of significance at the level of 1%, indicating that the implementation of HSR will lead to an average annual PC increase of 0.890 percentage points, and also lead to the average annual Ci and Pi of the city to decrease by 0.055 and 0.834 percentage points, and the HSR has a more obvious impact on reducing the pollution intensity. Similarly, after excluding the sample of cities with HSR, the coefficients of the DIDBCS variable reflect the net effect of BCS on Pc, and the estimation results are illustrated in columns (4), (5) and (6) of Table 7. The estimated coefficients of the BCS on Pc and Pi are −0.819 and −0.823, respectively, indicating that the implementation of the BCS helps to enhance Pc and reduce Pi, but the effect on Ci is not obvious.
Table 7.
Comparative estimation results of dual pilot cities and single pilot cities.
Second, to further test whether the dual pilot is more efficient in driving Pc, among the 277 city samples, samples that were neither HSR cities nor BCS cities were excluded, and samples that had become HSR cities or BCS cities were retained. At this time, the coefficients of the DID variable characterized the impacts of HSR cities becoming BCS cities or BCS cities becoming HSR cities. That is, the net effect of a single pilot city becoming a dual pilot city on Pc was shown. The results in columns (7), (8) and (9) reveal that the coefficient estimates of single pilot cities becoming dual pilot cities on Pc, Ci, and Pi are −0.890, −0.055, and −0.834, respectively, which passed the significance test at the 1% level, and the coefficient estimates of the DID variable were larger than those of the DIDHSR variable and the DIDBCS variable, which indicates that the dual pilot policy is more conducive to Pc.
4.5.2. Comparative Analysis of Policy Implementation Sequence
After verifying that the Pc of dual pilot cities is stronger, further analysis was made of which out of the two ways HSR cities become BCS cities and BCS cities become HSR cities is more effective, and whether there will be differences due to the different order of policy implementation. We kept the samples of cities that had already become HSR cities and had not yet become dual pilot cities, in which case the coefficient of the DID variable reflected the impact of HSR cities becoming BCS cities on Pc, and similarly, we kept the sample of cities that had already become BCS cities and had not yet become dual pilot cities; the coefficient of the DID variable reflects the impact of the pilot cities of BCS becoming HSR cities on Pc. From the perspective of the order of policy implementation, among the 277 city samples investigated, 54 samples had first become HSR cities and then became BCS cities, and 31 samples had first become BCS cities and then became HSR cities. There were seven cities (Mudanjiang, Maanshan, Tongling, Xinyu, Mianyang, Lanzhou, and Zhangye) that became dual pilot cities in the same year, and the test was conducted separately after excluding these seven cities. Columns (1), (2) and (3) of Table 8 are the estimation results of HSR first and then BCS, and the coefficients of the DID variables are estimated to be −1.294, −0.054, and −1.242, respectively, which pass the significance test at the 1% level. Columns (4), (5) and (6) are the estimation results of BCS first and then HSR, and the coefficients of the DID variables are estimated to be −0.889, −0.053, and −0.931, which all pass the significance test at the 10% level. Therefore, in different pilot policy implementation sequences, the dual pilot policy helps to enhance Pc, but in terms of the size of the coefficients, it is more obvious that becoming an HSR city first and then becoming a BCS city has a more pronounced effect on Pc.
Table 8.
Results of comparative estimation of the order of policy implementation.
5. Conclusions and Policy Implications
5.1. Conclusions
Empowered by digital technology, infrastructure upgrading can break through the limits of time and space, accelerate the gathering of innovative factors such as talents, and provide the impetus for the green transformation of the economy. Existing studies provide strong support for the economic and environmental effects of traditional infrastructure and digital infrastructure, respectively, but there are few works in the literature on the synergistic effects of the two. High-speed rail (HSR) and the “Broadband China” strategy (BCS) have played a crucial role in upgrading infrastructure. Therefore, based on the panel data of 277 prefecture-level cities in China from 2005 to 2021, this paper applies the multiple-period difference-in-differences method to discuss whether infrastructure upgrading can achieve the synergistic effect of pollution reduction and carbon reduction (Pc), and discusses the mechanism of infrastructure upgrading on Pc from the perspectives of scientific and technological talent agglomeration (Tg) and industrial agglomeration (Ig), and further analyzes the “net effect” of Pc of the dual pilot policy, which differs from that of the single pilot policy. The central conclusions are as follows.
First, infrastructure upgrading can realize Pc, and this conclusion is still valid after the placebo test, PSM-DID estimation, the replacement of the explained variable, the exclusion of other policy interferences, the lagging of core explanatory variable by one period, the exclusion of outliers, the exclusion of municipalities, and other tests. This shows that hypothesis 1 proposed in this paper is valid. With the gradual upgrading of infrastructure, the government regulatory model has been innovated to allow for the real-time monitoring of environmental quality, enterprises have become more intensive in their production methods, which has improved the efficiency of energy use [92], and the avenues for public scrutiny and green co-governance have been broadened, which has contributed to the realization of Pc. In addition, the policy synergy analysis shows that compared with the single pilot of HSR and the single pilot of BCS, the Pc of dual pilot cities is more obvious, and the Pc of pilot cities that first become HSR cities and then become BCS pilot cities is stronger than that of the pilot cities that first become BCS cities and then become HSR cities. Other scholars have adopted similar methods to study the impact of dual pilot programs on residents’ green lifestyle and carbon emission reduction, such as Hou et al. (2023) [68], Zhang and Zheng (2023) [69], and Zhang and Fan (2023) [93].
Second, there is significant heterogeneity in the impact of infrastructure upgrading on Pc, which is mainly manifested by the fact that the impact of infrastructure upgrading on Pc is stronger in non-resource-based cities, central cities, and eastern cities. The main reasons may be that resource-based cities face greater environmental governance pressure [87], industrial transformation is relatively difficult, and it is necessary to further exert the environmental dividends brought by pilot policies. Central cities have stronger spatial efficiency, scale effect, and agglomeration ability than peripheral cities, which is a new growth pole for urban environmental governance and high-quality development. The eastern cities are more inclined to lay out high-tech industries and service industries, while the central and western cities are not perfect in digital technology infrastructure and electronic information industry, which may lead to different environmental pollution control efficiency levels [77].
Third, the mechanism analysis indicates that Tg and Ig play an intermediary part in the process of infrastructure upgrading to achieve Pc, which is consistent with the findings of Su and Xie (2023) [57] and Cai and Hu (2023) [65]. This indicates that Hypothesis 2 and Hypothesis 3 proposed in this paper are valid. Infrastructure upgrading can attract innovative elements such as talent to gather in a certain space [94], which has an impact on the Pc. Tg can give full play to the knowledge spillover effect of technological innovation, promote the development of emerging industries, effectively reduce resource waste through resource sharing, and practice a green lifestyle by giving play to the example demonstration effect. In addition, with the gradual deepening of Ig, the production efficiency and resource utilization of enterprises can be improved, the expansion of production scale increases employment opportunities, and the income of workers and the demand for green consumption are greatly increased. Ig can also accelerate technology spillover through cross-industry cooperation and exchanges, and help in the development of emerging industries.
5.2. Policy Implications
Based on the above analysis, the following policy implications are drawn: First, attention should be paid to the synergistic effect between policies and support infrastructure upgrading. Since the Pc is more obvious in dual pilot cities than in single pilot cities, the government should focus on the shift from a single policy tool to a reasonable policy mix, and leverage the synergistic effect of HSR and BCS to help achieve Pc. For one thing, for the cities that have not opened HSR at present, it is necessary to expand the coverage of HSR based on the actual situation of urban development and accelerate the upgrading of traditional transportation infrastructure. For another, with the help of digital technologies, we will continue to impel the pilot work of the BCS to provide technical support for the green development of the city. Meanwhile, it is necessary to keep a watchful eye on the longevity and iteration of network facilities, especially in areas where network infrastructure construction was carried out at an early stage, to improve the quality and effectiveness of network facilities.
Second, we should dredge up the transmission channels for infrastructure upgrading to enhance Pc and insist on taking a new path of pollution reduction and carbon reduction oriented towards Tg and Ig. For one thing, the government should formulate more active and effective policies for the mobility of talents, enhance the attraction and cohesion of talents, break down the obstacles affecting Tg, focus on giving full play to the green technological innovation and knowledge spillover effect brought about by Tg, and help realize green and low-carbon development. For another, the government should vigorously carry out industrial incubation, optimize the spatial layout of the industry, establish a good interaction mechanism, accelerate high-tech Ig around key enterprises, leverage the size effect and technological externalities of Ig, and promote the development of new industries with low energy consumption and low pollution.
Third, the regional heterogeneity of infrastructure upgrading on Pc should be fully considered, and the pace of infrastructure upgrading should be accelerated according to local conditions. We should seize the opportunity to guide policy downwards and accelerate harmonious development by bringing the whole area to the surface. This paper shows that the non-resource-based cities, central cities, and eastern cities enjoy more policy dividends, compared with the resource-based cities, peripheral cities, and central and western cities, and the favorable policy impact achieves the same environmental effects with difficulty, which leads to the emergence of the Matthew effect. Therefore, in promoting the process of infrastructure upgrading, the government should always adhere to universal orientation, focus on strengthening the construction of infrastructure in weak areas, and gradually lessen the gap between the level of infrastructure construction between areas. Furthermore, it is essential to leverage the radiating role of key cities on neighboring cities, accelerate the realization of the equalization of factor resources, maximize the effect of the policy, and help to achieve Pc.
5.3. Limitations and Prospects
Although this paper provides some insights into the pollution and carbon reduction synergies of infrastructure upgrading, there are still some important aspects that deserve attention in future research. First, infrastructure upgrading may generate spatial spillover effects, which means that local infrastructure upgrading will not only influence the local synergistic effect of pollution reduction and carbon reduction but also affect the neighboring areas. Due to the constraints of the research content, the spatial spillover effects of infrastructure upgrading were not investigated. Secondly, this paper used HSR and BCS to indicate infrastructure upgrading, and in the future, the measurement of this indicator could be further refined. Finally, this paper verified the mechanism of infrastructure upgrading on Pc from the two pathways of Tg and Ig, and there may be other mechanisms to be explored.
Author Contributions
Conceptualization, X.M.; methodology, M.Z.; resources, M.Z. and X.M.; data curation and analysis, M.Z., X.M. and J.L.; writing—original draft, M.Z. and X.M.; writing—review and editing, M.Z. and J.L.; polish, M.Z. and J.L.; validation, M.Z.; supervision, X.M. and M.Z.; funding acquisition, X.M. and J.L.; project administration, X.M. and J.L. All authors have read and agreed to the published version of the manuscript.
Funding
This research was financially supported by the National Social Science Foundation of China (No. 21XRK007), Research and Innovation Program for Outstanding Doctoral Students (No. XJU2022BS008).
Institutional Review Board Statement
Not applicable.
Informed Consent Statement
Not applicable.
Data Availability Statement
The data presented in this study are available on request from the corresponding author.
Acknowledgments
We would like to extend special thanks to the anonymous reviewers for their valuable comments in greatly improving the quality of this paper.
Conflicts of Interest
The authors declare no conflicts of interest.
References
- Matthews, H.D.; Gillett, N.P.; Stott, P.A.; Zickfeld, K. The proportionality of global warming to cumulative carbon emissions. Nature 2009, 459, 829–832. [Google Scholar] [CrossRef]
- Shen, C.; Wang, Y. How does public concern about climate change affect carbon emissions? Evidence from large-scale online content and provincial-level data in China. J. Clean. Prod. 2023, 426, 139137. [Google Scholar] [CrossRef]
- Qin, C.; Yang, C.; Zhang, M.; Zhu, B. Does high-speed rail improve green development? Evidence from a quasi-natural experiment. J. Clean. Prod. 2023, 407, 137174. [Google Scholar] [CrossRef]
- Zhang, M.; Cheng, G.; Lu, Y.; Cao, Y.; Von Lau, E. Preparation of long-flame coal flotation collector from waste cooking oil. Miner. Eng. 2023, 202, 108296. [Google Scholar] [CrossRef]
- Che, S.; Wang, J. Digital economy development and haze pollution: Evidence from China. Environ. Sci. Pollut. Res. 2022, 29, 73210–73226. [Google Scholar] [CrossRef] [PubMed]
- Huang, J.; Yan, Y.; Kang, J.; Peng, W.; Wang, A. Driving technology factors of carbon emissions: Theoretical framework and its policy implications for China. Sci. Total. Environ. 2023, 904, 166858. [Google Scholar] [CrossRef]
- Li, X.; Zheng, Z.; Shi, D.; Han, X.; Zhao, M. New urbanization and carbon emissions intensity reduction: Mechanisms and spatial spillover effects. Sci. Total. Environ. 2023, 905, 167172. [Google Scholar] [CrossRef] [PubMed]
- Zhou, Y.; Wang, H.; Qiu, H. Population aging reduces carbon emissions: Evidence from China’s latest three censuses. Appl. Energy 2023, 351, 121799. [Google Scholar] [CrossRef]
- Hu, L.; Yuan, W.; Jiang, J.; Ma, T.; Zhu, S. Asymmetric effects of industrial structure rationalization on carbon emissions: Evidence from thirty Chinese provinces. J. Clean. Prod. 2023, 428, 139347. [Google Scholar] [CrossRef]
- Hou, H.; Zhang, S.; Guo, D.; Su, L.; Xu, H. Synergetic benefits of pollution and carbon reduction from fly ash resource utilization—Based on the life cycle perspective. Sci. Total. Environ. 2023, 903, 166197. [Google Scholar] [CrossRef]
- Cheng, G.; Zhang, M.; Lu, Y.; Zhang, H.; Von Lau, E. New insights for improving low-rank coal flotation performance via emulsified waste fried oil collector. Fuel 2023, 357, 129925. [Google Scholar] [CrossRef]
- Bai, C.; Chen, Z.; Wang, D. Transportation carbon emission reduction potential and mitigation strategy in China. Sci. Total. Environ. 2023, 873, 162074. [Google Scholar] [CrossRef] [PubMed]
- Gao, X.; Liu, N.; Hua, Y. Environmental Protection Tax Law on the synergy of pollution reduction and carbon reduction in China: Evidence from a panel data of 107 cities. Sustain. Prod. Consum. 2022, 33, 425–437. [Google Scholar] [CrossRef]
- Fan, H.; Liang, C. The pollutant and carbon emissions reduction synergistic effect of green fiscal policy: Evidence from China. Financ. Res. Lett. 2023, 58, 104446. [Google Scholar] [CrossRef]
- Chen, S.; Tan, Z.; Wang, J.; Zhang, L.; He, X.; Mu, S. Spatial and temporal evolution of synergizing the reduction of pollution and carbon emissions and examination on comprehensive pilot effects–evidence from the national eco-industrial demonstration parks in China. Environ. Impact Asses. Rev. 2023, 101, 107147. [Google Scholar] [CrossRef]
- Marrero, Á.S.; Marrero, G.A.; González, R.M.; Rodríguez-López, J. Convergence in road transport CO2 emissions in Europe. Energy Econ. 2021, 99, 105322. [Google Scholar] [CrossRef]
- Han, D.; Attipoe, S.G.; Han, D.; Cao, J. Does transportation infrastructure construction promote population agglomeration? Evidence from 1838 Chinese county-level administrative units. Cities 2023, 140, 104409. [Google Scholar] [CrossRef]
- Garmendia, M.; Ribalaygua, C.; Ureña, J.M. High speed rail: Implication for cities. Cities 2012, 29, S26–S31. [Google Scholar] [CrossRef]
- Deng, T.; Shao, S.; Yang, L.; Zhang, X. Has the transport-led economic growth effect reached a peak in China? A panel threshold regression approach. Transportation 2014, 41, 567–587. [Google Scholar] [CrossRef]
- Zou, Y.; Song, M.; Zhang, W.; Wang, Z. The impact of high-speed rail construction on the development of resource-based cities: A temporal and spatial perspective. Socio-Econ. Plan. Sci. 2023, 90, 101742. [Google Scholar] [CrossRef]
- Shao, S.; Tian, Z.; Yang, L. High speed rail and urban service industry agglomeration: Evidence from China’s Yangtze River Delta region. J. Transp. Geogr. 2017, 64, 174–183. [Google Scholar] [CrossRef]
- Wang, F.; Wei, X.; Liu, J.; He, L.; Gao, M. Impact of high-speed rail on population mobility and urbanisation: A case study on Yangtze River Delta urban agglomeration, China. Transport. Res. A Pol. 2019, 127, 99–114. [Google Scholar] [CrossRef]
- Yu, L.B.; Tran, T.M.; Lee, W.S. Bridging the gap: Assessing the effects of railway infrastructure investments in Northwest China. China Econ. Rev. 2023, 82, 102076. [Google Scholar] [CrossRef]
- Aschauer, D.A. Is public expenditure productive? J. Monetary Econ. 1989, 23, 177–200. [Google Scholar] [CrossRef]
- Zhao, L.; Zhang, X.; Zhao, F. The impact of high-speed rail on air quality in counties: Econometric study with data from southern Beijing-Tianjin-Hebei, China. J. Clean. Prod. 2021, 278, 123604. [Google Scholar] [CrossRef]
- Jiang, M.; Jiang, C.; Xiao, Y.B.; Wang, C. Air-HSR cooperation: Impacts on service frequency and environment. Transport. Res. E Log. 2021, 150, 102336. [Google Scholar] [CrossRef]
- Tang, Z.; Wang, L.; Wu, W. The impact of high-speed rail on urban carbon emissions: Evidence from the Yangtze River Delta. J. Transp. Geogr. 2023, 110, 103641. [Google Scholar] [CrossRef]
- Chen, P.; Lu, Y.; Wan, Y.; Zhang, A. Assessing carbon dioxide emissions of high-speed rail: The case of Beijing-Shanghai corridor. Transport. Res. D Tr E. 2021, 97, 102949. [Google Scholar] [CrossRef]
- Gong, M.; Zeng, Y.; Zhang, F. New infrastructure, optimization of resource allocation and upgrading of industrial structure. Financ. Res. Lett. 2023, 54, 103754. [Google Scholar] [CrossRef]
- Ancillai, C.; Sabatini, A.; Gatti, M.; Perna, A. Digital technology and business model innovation: A systematic literature review and future research agenda. Technol. Forecast. Soc. 2023, 188, 122307. [Google Scholar] [CrossRef]
- Ndubuisi, G.; Otioma, C.; Tetteh, G.K. Digital infrastructure and employment in services: Evidence from Sub-Saharan African countries. Telecommun. Policy 2021, 45, 102153. [Google Scholar] [CrossRef]
- Qiu, L.; Zhong, S.; Sun, B. Blessing or curse? The effect of broadband Internet on China’s inter-city income inequality. Econ. Anal. Policy 2021, 72, 626–650. [Google Scholar] [CrossRef]
- Li, Z.; Dai, H.; Song, J.; Sun, L.; Geng, Y.; Lu, K.; Hanaoka, T. Assessment of the carbon emissions reduction potential of China’s iron and steel industry based on a simulation analysis. Energy 2019, 183, 279–290. [Google Scholar] [CrossRef]
- Yang, Y.; Chen, W.; Gu, R. How does digital infrastructure affect industrial eco-efficiency? Considering the threshold effect of regional collaborative innovation. J. Clean. Prod. 2023, 427, 139248. [Google Scholar] [CrossRef]
- Williams, E. Environmental effects of information and communications technologies. Nature 2011, 479, 354–358. [Google Scholar] [CrossRef]
- Sun, X.; Xiao, S.; Ren, X.; Xu, B. Time-varying impact of information and communication technology on carbon emissions. Energy Econ. 2023, 118, 106492. [Google Scholar] [CrossRef]
- Wang, Q.; Hu, A.; Tian, Z. Digital transformation and electricity consumption: Evidence from the Broadband China pilot policy. Energy Econ. 2022, 115, 106346. [Google Scholar] [CrossRef]
- Zhang, L.; Tao, Y.; Nie, C. Does broadband infrastructure boost firm productivity? Evidence from a quasi-natural experiment in China. Financ. Res. Lett. 2022, 48, 102886. [Google Scholar] [CrossRef]
- Huang, Z.; Tao, Y.; Zhang, Q.; Ye, Y. The road to entrepreneurship: The effect of China’s broadband infrastructure construction. Econ. Anal. Policy 2023, 80, 1831–1847. [Google Scholar] [CrossRef]
- Li, C.; Zhang, X.; Dong, X.; Yan, Q.; Zeng, L.; Wang, Z. The impact of smart cities on entrepreneurial activity: Evidence from a quasi-natural experiment in China. Resour. Policy 2023, 81, 103333. [Google Scholar] [CrossRef]
- Feng, Y.; Chen, Z.; Nie, C. The effect of broadband infrastructure construction on urban green innovation: Evidence from a quasi-natural experiment in China. Econ. Anal. Policy 2023, 77, 581–598. [Google Scholar] [CrossRef]
- Feng, Y.; Li, L.; Chen, H. Carbon Emission Reduction Effect of Digital Infrastructure: From the “Broadband China” Strategy. Ecol. Chem. Eng. S 2023, 30, 283–289. [Google Scholar] [CrossRef]
- Shu, Y.; Deng, N.; Wu, Y.; Bao, S.; Bie, A. Urban governance and sustainable development: The effect of smart city on carbon emission in China. Technol. Forecast. Soc. 2023, 193, 122643. [Google Scholar] [CrossRef]
- Chen, P. Urban planning policy and clean energy development Harmony-evidence from smart city pilot policy in China. Renew. Energy 2023, 210, 251–257. [Google Scholar] [CrossRef]
- Hong, J.; Shi, F.; Zheng, Y. Does network infrastructure construction reduce energy intensity? Based on the “Broadband China” strategy. Technol. Forecast. Soc. 2023, 190, 122437. [Google Scholar] [CrossRef]
- Wu, D.; Xie, Y.; Lyu, S. Disentangling the complex impacts of urban digital transformation and environmental pollution: Evidence from smart city pilots in China. Sustain. Cities Soc. 2023, 88, 104266. [Google Scholar] [CrossRef]
- Alam, M.M.; Murad, M.W. The impacts of economic growth, trade openness and technological progress on renewable energy use in organization for economic co-operation and development countries. Renew. Energy 2020, 145, 382–390. [Google Scholar] [CrossRef]
- Wu, K.; Ye, Y.; Wu, X.; Liu, Z.; Zhang, H. New infrastructure-lead development and green-technologies: Evidence from the Pearl River Delta, China. Sustain. Cities Soc. 2023, 99, 104864. [Google Scholar] [CrossRef]
- Guo, J.; Wang, L.; Zhou, W.; Wei, C. Powering green digitalization: Evidence from 5G network infrastructure in China. Resour. Conserv. Recycl. 2022, 182, 106286. [Google Scholar] [CrossRef]
- Liu, Y.; Yang, Y.; Li, H.; Zhong, K. Digital economy development, industrial structure upgrading and green total factor productivity: Empirical evidence from China’s cities. Int. J. Environ. Res. Public Health 2022, 19, 2414. [Google Scholar] [CrossRef]
- Zhao, S.; Ozturk, I.; Hafeez, M.; Ashraf, M.U. Financial structure and CO2 emissions in Asian high-polluted countries: Does digital infrastructure matter? Environ. Technol. Innov. 2023, 32, 103348. [Google Scholar] [CrossRef]
- Guo, Q.; Ma, X. How Does the Digital Economy Affect Sustainable Urban Development? Empirical Evidence from Chinese Cities. Sustainability 2023, 15, 4098. [Google Scholar] [CrossRef]
- Sun, C.; Min, J.; Li, J.; Cai, W. Public participation and policy evaluation in China’s smog governance. Environ. Impact. Asses. 2023, 100, 107052. [Google Scholar] [CrossRef]
- Pan, J.; Lai, J. Spatial pattern of population mobility among cities in China: Case study of the National Day plus Mid-Autumn Festival based on Tencent migration data. Cities 2019, 94, 55–69. [Google Scholar] [CrossRef]
- Feng, S.; Liu, S. Does AI Application Matter in Promoting Carbon Productivity? Fresh Evidence from 30 Provinces in China. Sustainability 2023, 15, 16261. [Google Scholar] [CrossRef]
- Wu, W.; Wang, S.; Jiang, X.; Zhou, J. Regional digital infrastructure, enterprise digital transformation and entrepreneurial orientation: Empirical evidence based on the broadband China strategy. Inf. Process. Manag. 2023, 60, 103419. [Google Scholar] [CrossRef]
- Su, W.; Xie, C. High-speed rail, technological improvement, and PM2.5: Evidence from China. Econ. Anal. Policy 2023, 80, 1349–1362. [Google Scholar] [CrossRef]
- Wen, J.; Okolo, C.V.; Ugwuoke, I.C.; Kolani, K. Research on influencing factors of renewable energy, energy efficiency, on technological innovation. Does trade, investment and human capital development matter? Energy Policy 2022, 160, 112718. [Google Scholar] [CrossRef]
- Zhang, J.; Ma, X.; Liu, J. How Can the Digital Economy and Human Capital Improve City Sustainability. Sustainability 2022, 14, 15617. [Google Scholar] [CrossRef]
- Xiao, X.; Liu, C.; Li, S. How the digital infrastructure construction affects urban carbon emissions—A quasi-natural experiment from the “Broadband China” policy. Sci. Total. Environ. 2023, 912, 169284. [Google Scholar] [CrossRef]
- Xu, X.; Wang, S.; Yu, Y. Consumer’s intention to purchase green furniture: Do health consciousness and environmental awareness matter? Sci. Total. Environ. 2020, 704, 135275. [Google Scholar] [CrossRef]
- Deng, T.; Wang, D.; Yang, Y.; Yang, H. Shrinking cities in growing China: Did high speed rail further aggravate urban shrinkage? Cities 2019, 86, 210–219. [Google Scholar] [CrossRef]
- Liu, B.; Nie, B.; Wang, Y.; Han, X.; Li, Y. Does New Infrastructure Affect Regional Carbon Intensity? Empirical Evidence from China. Sustainability 2023, 15, 16842. [Google Scholar] [CrossRef]
- Chen, C.; Sun, Y.; Lan, Q.; Jiang, F. Impacts of industrial agglomeration on pollution and ecological efficiency—A spatial econometric analysis based on a big panel dataset of China’s 259 cities. J. Clean. Prod. 2020, 258, 120721. [Google Scholar] [CrossRef]
- Cai, Y.; Hu, Z. Industrial agglomeration and industrial SO2 emissions in China’s 285 cities: Evidence from multiple agglomeration types. J. Clean. Prod. 2022, 353, 131675. [Google Scholar] [CrossRef]
- Hayes, A.F. Beyond Baron and Kenny: Statistical mediation analysis in the new millennium. Commun. Monogr. 2009, 76, 408–420. [Google Scholar] [CrossRef]
- Hu, J. Synergistic effect of pollution reduction and carbon emission mitigation in the digital economy. J. Environ. Manag. 2023, 337, 117755. [Google Scholar] [CrossRef] [PubMed]
- Hou, X.; Liu, P.; Liu, X.; Chen, H. Assessing the carbon emission performance of digital greening synergistic transformation: Evidence from the dual pilot projects in China. Environ. Sci. Pollut. Res. 2023, 30, 113504–113519. [Google Scholar] [CrossRef]
- Zhang, J.; Zheng, T. Can dual pilot policy of innovative city and low carbon city promote green lifestyle transformation of residents? J. Clean. Prod. 2023, 405, 136711. [Google Scholar] [CrossRef]
- Feng, Q.; Chen, Z.; Cheng, C.; Chang, H. Impact of high-speed rail on high-skilled labor mobility in China. Transp. Policy 2023, 133, 64–74. [Google Scholar] [CrossRef]
- GB/T 4754-2017; Industrial Classification for National Economic Activities. MOHURD and AQSIQ: Beijing, China, 2017.
- Guo, Q.; Ma, X.; Zhao, J. Can the digital economy development achieve the effect of pollution reduction? Evidence from Chinese Cities. Environ. Sci. Pollut. Res. 2023, 30, 74166–74185. [Google Scholar] [CrossRef]
- Liu, J.; Ma, X.; Zhang, J.; Zhang, S. New-type urbanization construction, shift-share of employment, and CO2 emissions: Evidence from China. Environ. Sci. Pollut. Res. 2023, 30, 26472–26495. [Google Scholar] [CrossRef]
- Ma, Q.; Yan, G.; Ren, X.; Ren, X. Can China’s carbon emissions trading scheme achieve a double dividend? Environ. Sci. Pollut. Res. 2022, 29, 50238–50255. [Google Scholar] [CrossRef]
- Qi, H.; Shen, X.; Long, F.; Liu, M.; Gao, X. Spatial–temporal characteristics and influencing factors of county-level carbon emissions in Zhejiang Province, China. Environ. Sci. Pollut. Res. 2023, 30, 10136–10148. [Google Scholar] [CrossRef]
- Cheng, C.; Ren, X.; Dong, K.; Dong, X.; Wang, Z. How does technological innovation mitigate CO2 emissions in OECD countries? Heterogeneous analysis using panel quantile regression. Environ. Sci. Pollut. Res. 2021, 280, 111818. [Google Scholar] [CrossRef] [PubMed]
- Zhang, W.; Fan, H.; Zhao, Q. Seeing green: How does digital infrastructure affect carbon emission intensity? Energy Econ. 2023, 127, 107085. [Google Scholar] [CrossRef]
- Zhang, W.; Zeng, M.; Zhang, Y.; Su, C.W. Reducing carbon emissions: Can high-speed railway contribute? J. Clean. Prod. 2023, 413, 137524. [Google Scholar] [CrossRef]
- Beck, T.; Levine, R.; Levkov, A. Big bad banks? The winners and losers from bank deregulation in the United States. J. Financ. 2010, 65, 1637–1667. [Google Scholar] [CrossRef]
- Zhang, Z.; Wang, J.; Feng, C.; Chen, X. Do pilot zones for green finance reform and innovation promote energy savings? Evidence from China. Energy Econ. 2023, 124, 106763. [Google Scholar] [CrossRef]
- Zhang, K.; Xiong, Z.Y.; Huang, X.J. Green Bonds, Carbon Emission Reduction Effect and High-quality Economic Development. J. Financ. Econ. 2023, 49, 64–78. [Google Scholar] [CrossRef]
- Heckman, J.J.; Ichimura, H.; Todd, P.E. Matching as an econometric evaluation estimator: Evidence from evaluating a job training programme. Rev. Econ. Stud. 1997, 64, 605–654. [Google Scholar] [CrossRef]
- Liang, L.; Wang, Z.; Li, J. The effect of urbanization on environmental pollution in rapidly developing urban agglomerations. J. Clean. Prod. 2019, 237, 117649. [Google Scholar] [CrossRef]
- Yu, Y.; Zhang, N. Low-carbon city pilot and carbon emission efficiency: Quasi-experimental evidence from China. Energy Econ. 2021, 96, 105125. [Google Scholar] [CrossRef]
- Song, T.; Dian, J.; Chen, H. Can smart city construction improve carbon productivity? A quasi-natural experiment based on China’s smart city pilot. Sustain. Cities Soc. 2023, 92, 104478. [Google Scholar] [CrossRef]
- Hu, J.; Zhang, H.; Irfan, M. How does digital infrastructure construction affect low-carbon development? A multidimensional interpretation of evidence from China. J. Clean. Prod. 2023, 396, 136467. [Google Scholar] [CrossRef]
- Yao, F.; Li, L.; Zhong, S. Sulfur dioxide emissions curbing effects and influencing mechanisms of China’s emission trading system. PLoS ONE 2022, 17, e0276601. [Google Scholar] [CrossRef]
- Yu, W.; Peng, Y.; Yao, X. The effects of China’s supporting policy for resource-exhausted cities on local energy efficiency: An empirical study based on 284 cities in China. Energy Econ. 2022, 112, 106165. [Google Scholar] [CrossRef]
- Ozcan, B.; Temiz, M. Re-visiting resource curse hypothesis in China through the lens of human capital and globalization. Environ. Sci. Pollut. Res. 2023, 338, 117685. [Google Scholar] [CrossRef]
- Peng, H.R.; Ling, K.; Zhang, Y.J. The carbon emission reduction effect of digital infrastructure development: Evidence from the broadband China policy. J. Clean. Prod. 2023, 434, 140060. [Google Scholar] [CrossRef]
- Zhang, C.; Weng, X.; Guo, Y. Digital infrastructure construction and household energy efficiency: Based on a quasi-natural experiment in China. Sci. Total. Environ. 2023, 911, 168544. [Google Scholar] [CrossRef]
- Tang, K.; Yang, G. Does digital infrastructure cut carbon emissions in Chinese cities? Sustain. Prod. Consum. 2023, 35, 431–443. [Google Scholar] [CrossRef]
- Zhang, X.; Fan, D. Collaborative emission reduction research on dual-pilot policies of the low-carbon city and smart city from the perspective of multiple innovations. Urban Clim. 2023, 47, 101364. [Google Scholar] [CrossRef]
- Du, Y.; Zhou, J.; Bai, J.; Cao, Y. Breaking the resource curse: The perspective of improving carbon emission efficiency based on digital infrastructure construction. Resour. Policy 2023, 85, 103842. [Google Scholar] [CrossRef]
Disclaimer/Publisher’s Note: The statements, opinions and data contained in all publications are solely those of the individual author(s) and contributor(s) and not of MDPI and/or the editor(s). MDPI and/or the editor(s) disclaim responsibility for any injury to people or property resulting from any ideas, methods, instructions or products referred to in the content. |
© 2024 by the authors. Licensee MDPI, Basel, Switzerland. This article is an open access article distributed under the terms and conditions of the Creative Commons Attribution (CC BY) license (https://creativecommons.org/licenses/by/4.0/).