Article

The Performance and Feasibility of Solar-Powered Desalination for Brackish Groundwater in Egypt

by
Mohamed A. Dawoud
1,*,
Ghada R. Sallam
2,
Mohamed A. Abdelrahman
2 and
Mohamed Emam
2
1
Environment Agency Abu Dhabi, Abu Dhabi P.O. Box 45553, United Arab Emirates
2
Faculty of Engineering at Shoubra, Benha University, Benha 13511, Egypt
*
Author to whom correspondence should be addressed.
Sustainability 2024, 16(4), 1630; https://doi.org/10.3390/su16041630
Submission received: 26 November 2023 / Revised: 2 February 2024 / Accepted: 4 February 2024 / Published: 16 February 2024

Abstract

:
With a deficit of about 20 BCM in 2022, Egypt faces a severe water shortage due to rapid population growth (109.3 million in 2022). Egypt launched a program to utilize non-conventional water sources, like treated wastewater, agriculture drainage water, and desalination. Egypt is expanding its non-conventional water resources, boosting desalination capacity from 86,000 m3/day in 2015 to 680,000 m3/day in 2022, with plans to reach 1,250,000 m3/day by 2025. Despite the improvements in desalination technologies and cost, its high energy use and environmental impacts are still limiting its use. Egypt’s desalination relies on grid electricity, but renewable energy is crucial for remote areas where no electricity grid exists. Scaling up renewable energy in desalination faces challenges like land availability and high costs. GIS was used for optimal site selection for a brackish groundwater solar desalination plant in the Western North Nile Delta. Factors like solar radiation, groundwater quality, aquifer potentiality, geology, and seawater intrusion were carefully assessed. An evaluation of a sustainable 1000 m3/day solar-powered RO desalination pilot plant’s economic and technical viability is provided, along with its performance assessment. Limitations, challenges, and potential improvements are discussed. The study finds that RO–PV desalination for brackish groundwater is technically mature, with competitive Capex costs (USD 760-USD 850/m3) and low Opex (USD 0.55–USD 0.63/m3). Solar desalination for brackish groundwater with salinity less than 23,000 ppm can reduce energy consumption to 3.6–4.2 kWhr/m3. Water storage and hybrid systems with solar and conventional energy are suggested to enhance efficiency. This implies a growing market for small- to medium-scale RO solar-powered desalination in remote areas in the near future.

1. Introduction

Egypt, located in an arid region, heavily relies on the Nile River, receiving an annual allocation of 55.5 billion cubic meters (BCM) through a treaty with Sudan. Despite having a vast land area (approximately 1.01 million km2), 97% of the Egyptian population resides in the Nile Valley and Delta [1]. The nation faces numerous water resource challenges, including rapid population growth, uneven distribution, urbanization, declining water quality, government land reclamation policies, and unsustainable water use practices. Egypt is nearing the limits of its available water resources, and the country will soon confront variable supply conditions. The primary development challenge revolves around limited water resources and water scarcity. Over the years, Egypt’s renewable water resources have dwindled, decreasing from 2189 m3/capita/year in 1966 to 1123 m3/capita/year in 1990 [2]. Presently, the per capita share stands at approximately 630 m3/year, falling below the global average of 1000 m3/year considered the water poverty level as shown in Figure 1. The demand for water in Egypt is on the rise due to population growth, improving living standards, and the needs of domestic, industrial, and agricultural sectors. The nation faces the daunting task of bridging the gap between limited water resources and the escalating demand, resulting in an annual shortage of 23 BCM, roughly 40% of Egypt’s total available surface water resources. On the supply side, there is a pressing need to develop non-conventional water resources, particularly desalination, to meet the water demands for both potable water and high-value crops. However, various challenges and constraints must be addressed to facilitate the growth of water production, including desalination, in arid and semi-arid countries like Egypt. On the demand side, improving water use efficiency, reducing losses in water supply networks, and adopting modern irrigation systems are essential components of Egypt’s integrated water resources management strategy. To address the water shortage and scarcity, Egypt is focusing on utilizing non-conventional water resources, such as non-renewable deep aquifer groundwater, agricultural drainage water, treated wastewater, and desalination. Desalination has become a crucial component of the Egyptian National Water Resources Plan 2017–2027, with various projects underway or planned to bolster the desalination industry [3]. These projects are particularly important in remote areas, such as coastal and desert regions, where freshwater alternatives are limited. Egypt has also initiated research and development programs to assess and enhance desalination technologies, governance, and its application potential for various purposes. These efforts include capacity building and training on desalination techniques and the management of desalinated water. It is important to note that non-conventional water resources, including desalination, should be integrated into a comprehensive water resources development, planning, and management framework to ensure their effectiveness in addressing Egypt’s water challenges.
At present, the annual virtual water is about 34 BCM. Due to the rapid increase and growth in population, the annual projected water demand is about 114 BCM compared with annual renewable water of about 59.25 BCM, which means that there is a gap of 20 BCM. It is expected that the gap in water resources supplies will be about 35.0 BCM by 2030, as shown in Table 1. Egypt developed an ENWRP (2017–2037) with a total investment of about 900 billion LE, out of them about 16% for enhancing the freshwater availability including non-conventional water and recycling. Ensuring water security takes precedence on the national agenda, as research findings indicate a growing disparity between water supply and various water requirements. This disparity is not solely attributable to the projected surge in water demand but also results from the influence of additional factors affecting the available Nile water quantity [4].
Recent studies indicated that the Egyptian population will be about 130 million [5]. The predicted per capita share of water in 2030 will be less than 500 m3. At present, there are two categories of desalination plants, government-owned units and private units. At present (2021), there are more than 59 desalination plants with a total capacity of both governmental and private desalination plants in Egypt of about 633,000 m3/day, as shown in Table 2. The governmental plan is to increase the daily capacity to about 1,690,000 m3/day by 2037, as shown in Figure 2. The cost of desalination can be divided into two main categories: capital costs and operation and maintenance costs. The capital and operating costs of seawater desalination plants have decreased significantly over the period (1990–2017).
Table 2. Current desalination capacities in Egypt (2021).
NoRegionDesalination Capacity (m3/day)
1Red Sea242,000
2Marsa Matruh150,000
3North Saini120,000
4South Saini121,000
Total633,000
Source: Abd El-Hady et al., 2021 [6].
Figure 2. Predicted future desalination capacities in Egypt (2018–2037). Sources: Dawoud et al., 2020 [7].
Sustainability 16 01630 g002
Solar desalination in Egypt serves as a crucial solution to address the country’s pressing water scarcity issues, primarily caused by population growth, climate change, and limited freshwater resources. The main purpose of solar desalination is to harness the abundant solar energy available in Egypt to power the desalination process, converting seawater into fresh water. This is achieved through innovative technologies such as solar stills and solar-powered reverse osmosis systems. The methods involve using solar energy to heat seawater, causing it to evaporate, and then condensing the vapor to obtain fresh water. Additionally, solar panels generate electricity to run desalination plants, making the process sustainable and environmentally friendly. The significance of solar desalination in Egypt lies in its potential to alleviate water scarcity, providing a reliable source of freshwater that is independent of traditional, energy-intensive desalination methods. By harnessing solar power, Egypt can address its water challenges while also contributing to a cleaner and more sustainable future.
Desalination is acknowledged as a renewable water source in numerous regions of Egypt, given the country’s extensive coastline of about 2400 km along the Red Sea and Mediterranean, coupled with vast brackish water aquifers. Presently, seawater desalination operations are actively undertaken in the coastal regions along the Red Sea. The primary objective is to meet the domestic water demands of villages and tourist resorts, as the economic assessment of unit water in these areas substantiates the feasibility of desalination costs [8]. Establishing solar desalination plants hinges on country-specific financial considerations. Wealthier developed nations encounter fewer economic challenges than their less affluent counterparts. In 2021, de Doile et al. explored economic feasibility and regulatory issues in hybrid wind and solar PV energy generation [9]. Their findings underscored a lack of attention to hybrid studies, particularly in regulatory and legal aspects. Commercializing renewable energy for solar desalination involves navigating environmental, economic, and local market factors, and understanding government regulations and a country’s economic development [10]. Effectively safeguarding the environment, encompassing water, air, and soil, poses a critical challenge in managing desalination plants. Addressing concerns such as the disposal of brine solution and potential air pollution from energy generation is paramount. From an environmental standpoint, a solar-based zero liquid discharge (ZLD) desalination system stands as an ideal solution. This approach ensures ecosystem protection while supplying potable water. The challenge lies in generating valuable commercial products from the salts recovered in the brine water. In the ZLD framework, potable water becomes a byproduct, exemplified in the analysis by Onishi et al. (2021) of a solar-driven ZLD system for shale gas wastewater desalination [11]. Elsaie et al., 2023, [12] conducted a detailed literature review and assessment for the water and desalination sector in Egypt and found that RO seawater desalination technology is the most efficient system globally and in Egypt, with approximately 63.5% of the world desalination capacity at present. In 2023, Goosen et al. carried out a review of recent developments in environmental, regulatory, and economic issues of solar-powered desalination in arid regions such as Egypt [13]. It has been found that in intricate scenarios with numerous variables, the application of a Pareto frontier, a relatively novel concept, proves valuable in determining optimal points for decision-making in the development of integrated solar desalination systems. This process necessitates a comprehensive analysis of political, environmental, and economic constraints associated with desalination plant construction. Innovative approaches, such as integrating solar thermal energy units with organic Rankine and Stirling cycle engines, address challenges in electricity production. The development of a sustainable Janus wood evaporator showcases progress in overcoming solar desalination issues through a photochemical desalination process with high efficiency. Life cycle assessments emphasize the environmental impact of electric pumping energy, with solar collectors being a primary capital equipment cost. Integrating renewable energy and storage systems is a growing trend, emphasizing the importance of careful decision-making by stakeholders. Recognizing the total real price of a new plant, including borrowing costs, maintenance, and energy prices, underscores the importance of cost-effective, sustainable solar desalination plant integration, addressing environmental, regulatory, and economic factors. This multifaceted challenge requires collaboration among scientists, decision-makers, and society to achieve successful implementation. The ultimate goal remains a solar-based zero liquid discharge desalination plant, offering long-term ecosystem protection and a sustainable source of potable water and commercial products from recovered salts. Ibrahim and Shabak, 2022, delve into the critical aspects of energy and water, fundamental to our existence, leveraging solar energy for sustainability and a clean environment in Egypt [14]. It offers a robust methodology for sizing and designing a comprehensive photovoltaic reverse osmosis (PVRO) integrated system. Applied to Cairo’s weather data, the model efficiently desalinates water at various salinities and accommodates diverse water demands. A custom simulation program calculates system costs, enabling quick and reliable decision-making for equipment selection. The program serves as a time-efficient design tool, providing design and cost options for both designers and customers and facilitating informed choices. Few studies focused on the economic analysis of a small-scale stand-alone reverse osmosis desalination unit powered by photovoltaic for possible application on the northwest coast of Egypt, and it has been found [15,16]. These studies emphasize the significance of environmentally friendly alternatives, particularly reverse osmosis (RO), to conventional fossil-fuel-powered systems. The focus is on a cost-effective, battery-less mobile photovoltaic (PV)-powered groundwater reverse osmosis (PV–RO) desalination unit capable of desalinating brackish and saline groundwater. Operating in regions with good solar resources, this unit avoids battery use, maximizing electric energy yield through a single-axis tracking system, PV cleaning, and cooling. Despite intermittent solar power challenges, the cost of desalination using the PV–RO system without batteries is 9.3–5.6 LE/m3, with investment costs comprising 87.9% of the total project cost and operation and maintenance costs contributing 12%.

2. Materials and Method

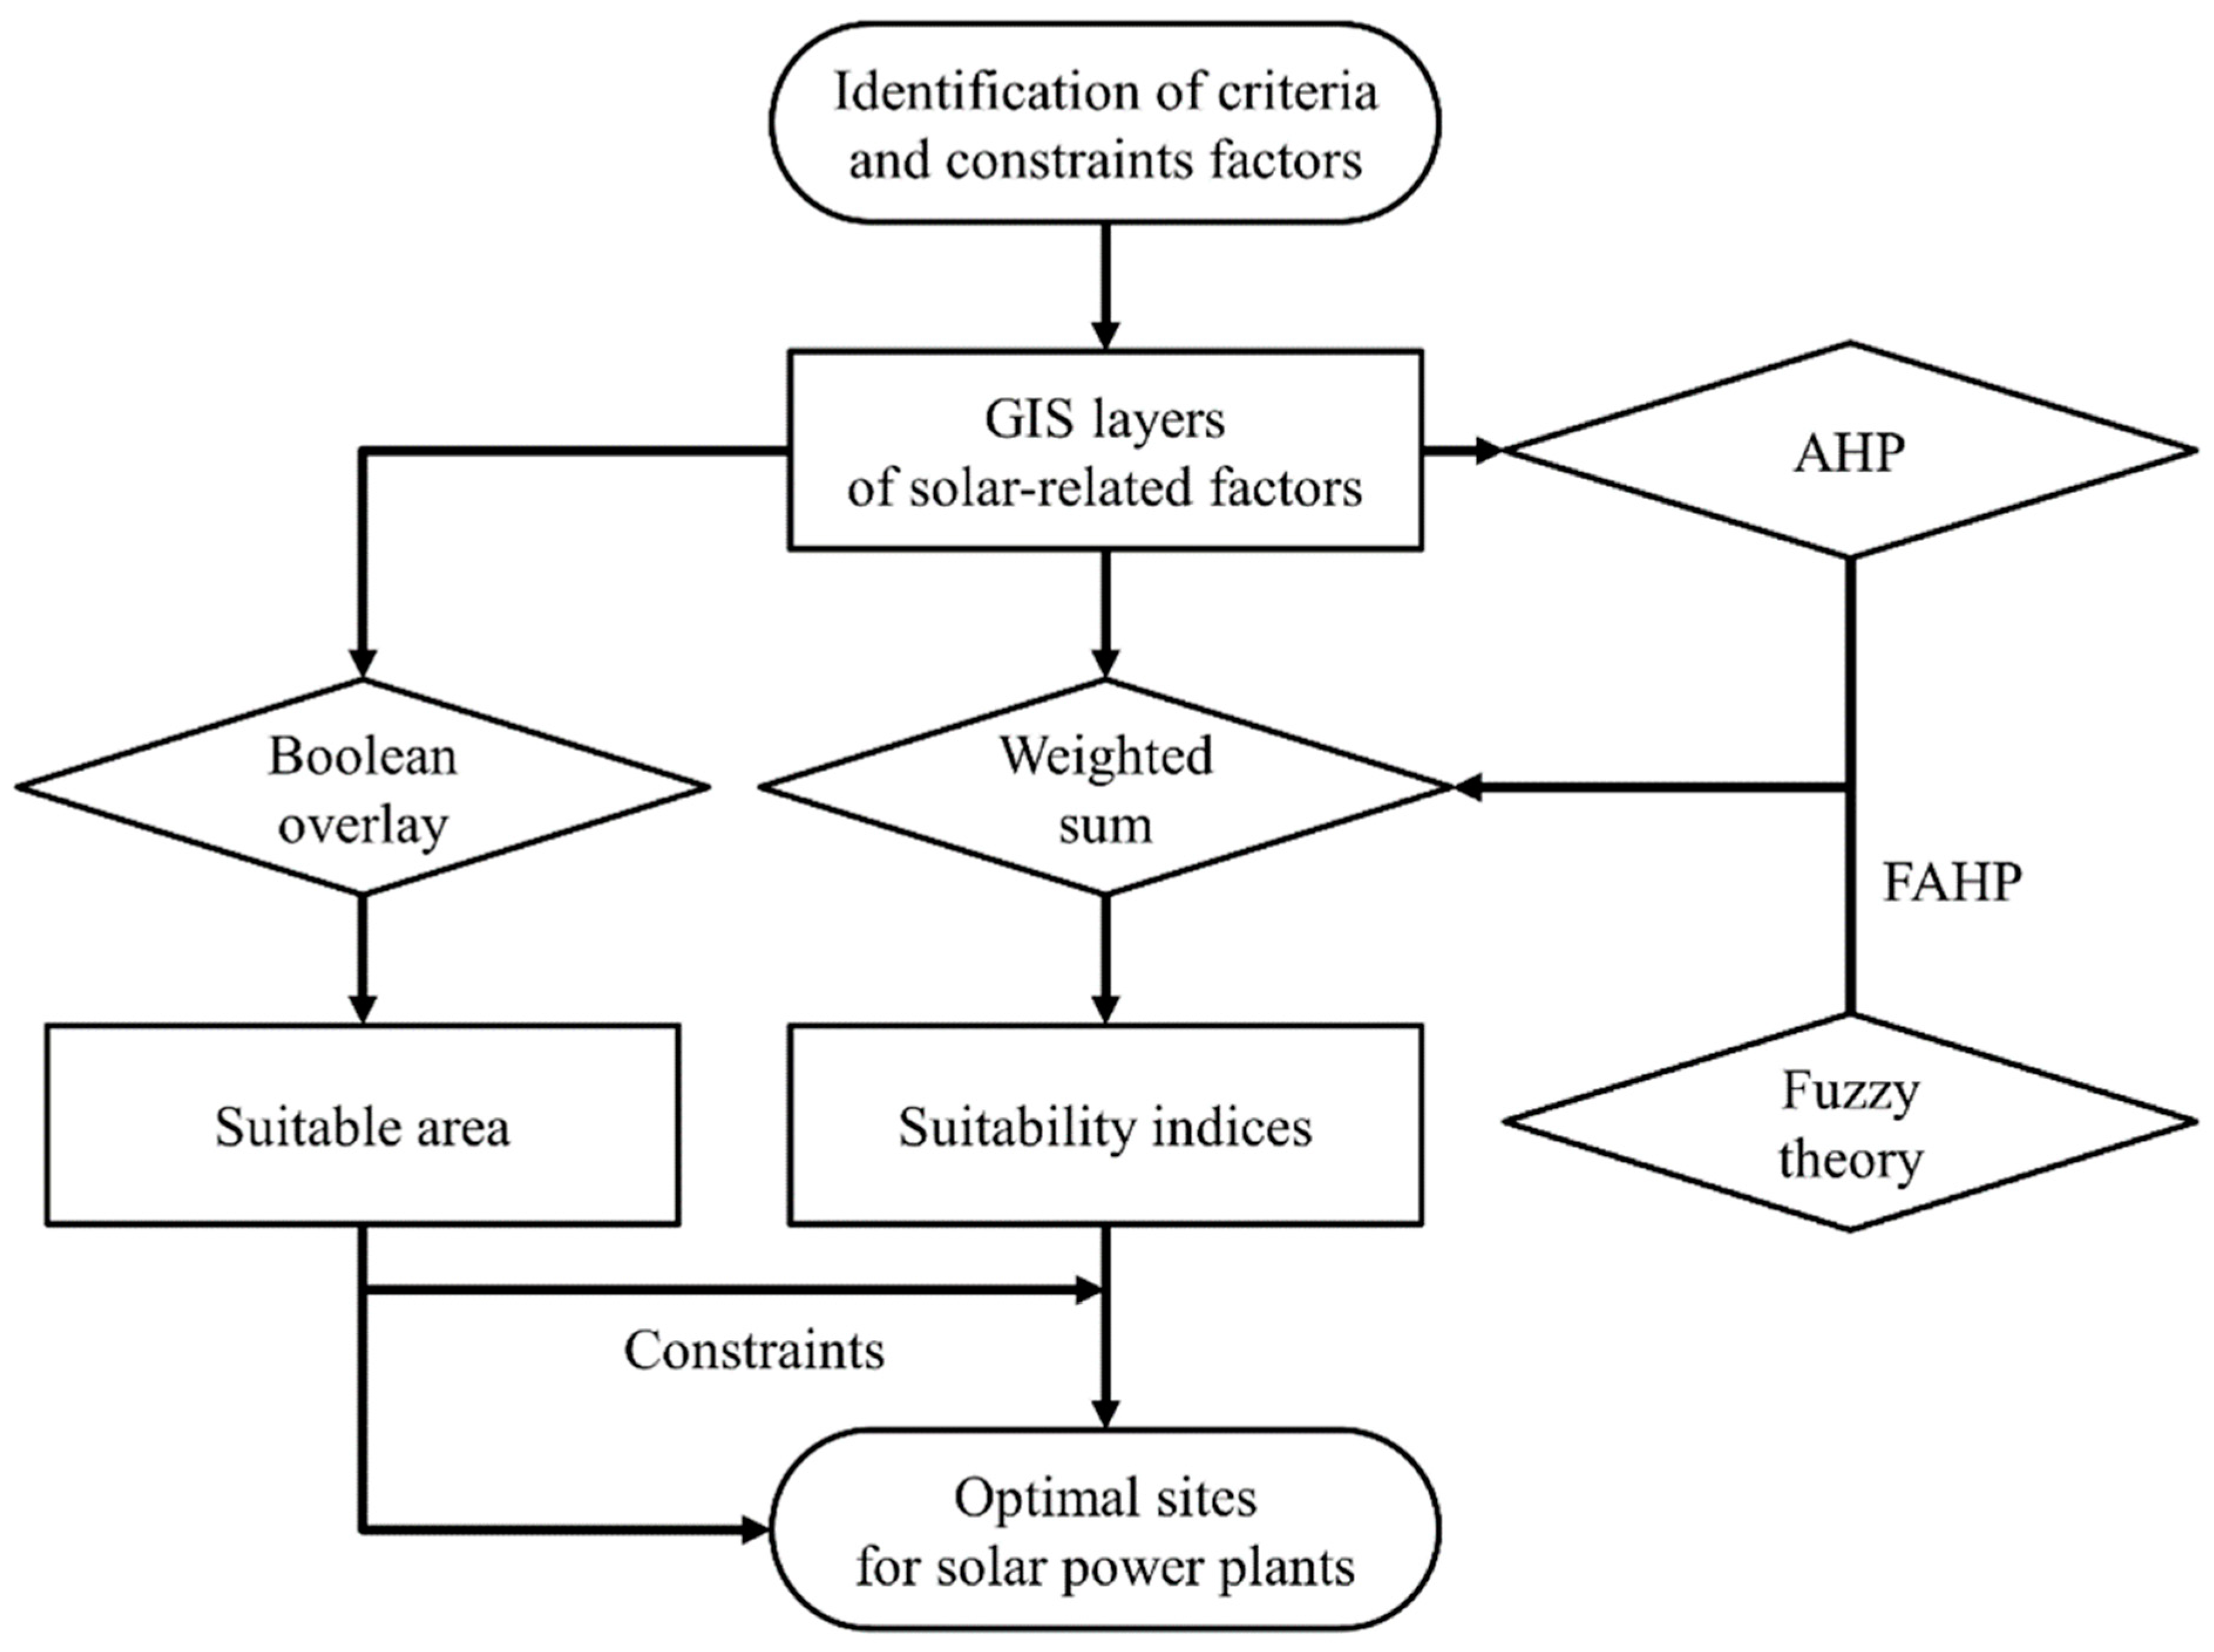
2.1. Site Selection Criteria Using GIS

A geographic information system (GIS) is employed to create a decision-making tool for the optimal site selection of solar-powered desalination plants in Egypt. This tool comprehensively analyses key parameters influencing site selection, encompassing alternative water resources, current and projected water demand, solar radiation levels, seawater or brackish/saline groundwater availability, and existing infrastructure. The GIS-based decision-making tool operates across four primary analysis levels: identifying regions experiencing freshwater scarcity with anticipated demand growth, assessing the absence of alternative water resources, pinpointing optimal sites for solar desalination plant installation, and conducting design, sizing, cost estimation, and performance evaluation of the solar desalination systems. Figure 3 presents the basic outline of the GIS decision-making tool. The GIS decision-making tool effectively manages a diverse range of maps and datasets through the implementation of advanced data management techniques. It seamlessly integrates crucial geographic features specific to the regions being analyzed. This powerful tool facilitates accurate assessments of water requirements for domestic, irrigation, and industrial purposes. During this processing stage, significant achievements were realized. Firstly, ArcGIS adeptly converted a solar radiation map from a raster dataset to a vector dataset while preserving its original resolution, avoiding any generalization. This transformation facilitated a visually appealing output that departed from conventional cartographic representation, thereby improving the effective encoding and visualization of solar radiation data.
The inclusion of technical criteria within the GIS is crucial as it plays a significant role in determining the potential solar energy that could be used for desalination. The following are the specific criteria that are incorporated:
(a)
Solar Radiation (Kwhr/m2/day)
The analysis used a database of daily sunshine duration, global and diffuse radiation on horizontal surfaces, and normal beam radiation for locations from Aswan in the south to Matruh in the north. Monthly averages were reported for these radiation types. Annual average daily global and diffuse irradiation varied for each location. Results highlighted Egypt’s high daily radiation, especially direct and clear day frequency. Cairo exhibited lower radiation due to urbanization and pollution, particularly in direct radiation, resulting in fewer clear days. The yearly average daily global irradiation stands at 5.4, 5.13, and 6.05 Kwhr/m2/day for Matruh, Cairo, and Aswan, respectively. The diffuse irradiation records are 1.67, 1.84, and 1.73 Kwhr/m2/day for the same cities [17]. By leveraging ArcGIS (ver. 10.6.1), distribution maps for the analyzed parameters were produced. Figure 4 showcases the resulting maps, highlighting the spatial distribution of solar energy across Egypt. Furthermore, the area encompassing solar energy distributions was quantified and obtained for further analysis.
  • (b) Wind Speed (m/s)
Data on average wind speeds at 24.5 m above ground level were collected monthly for 30 years (1993–2022) and analyzed. Using ArcGIS, a spatial analyst tool facilitated wind speed mapping, analysis, and modeling for specific areas and times. This approach successfully modeled wind energy, as detailed in a 2023 study by Gebaly et al. [18]. Local factors were considered, and statistical analysis was applied to classify wind speeds at 24.5 m above ground level in Egypt, as visualized in Figure 5. This research provides valuable insights into wind energy potential in specific regions of Egypt over the past three decades.
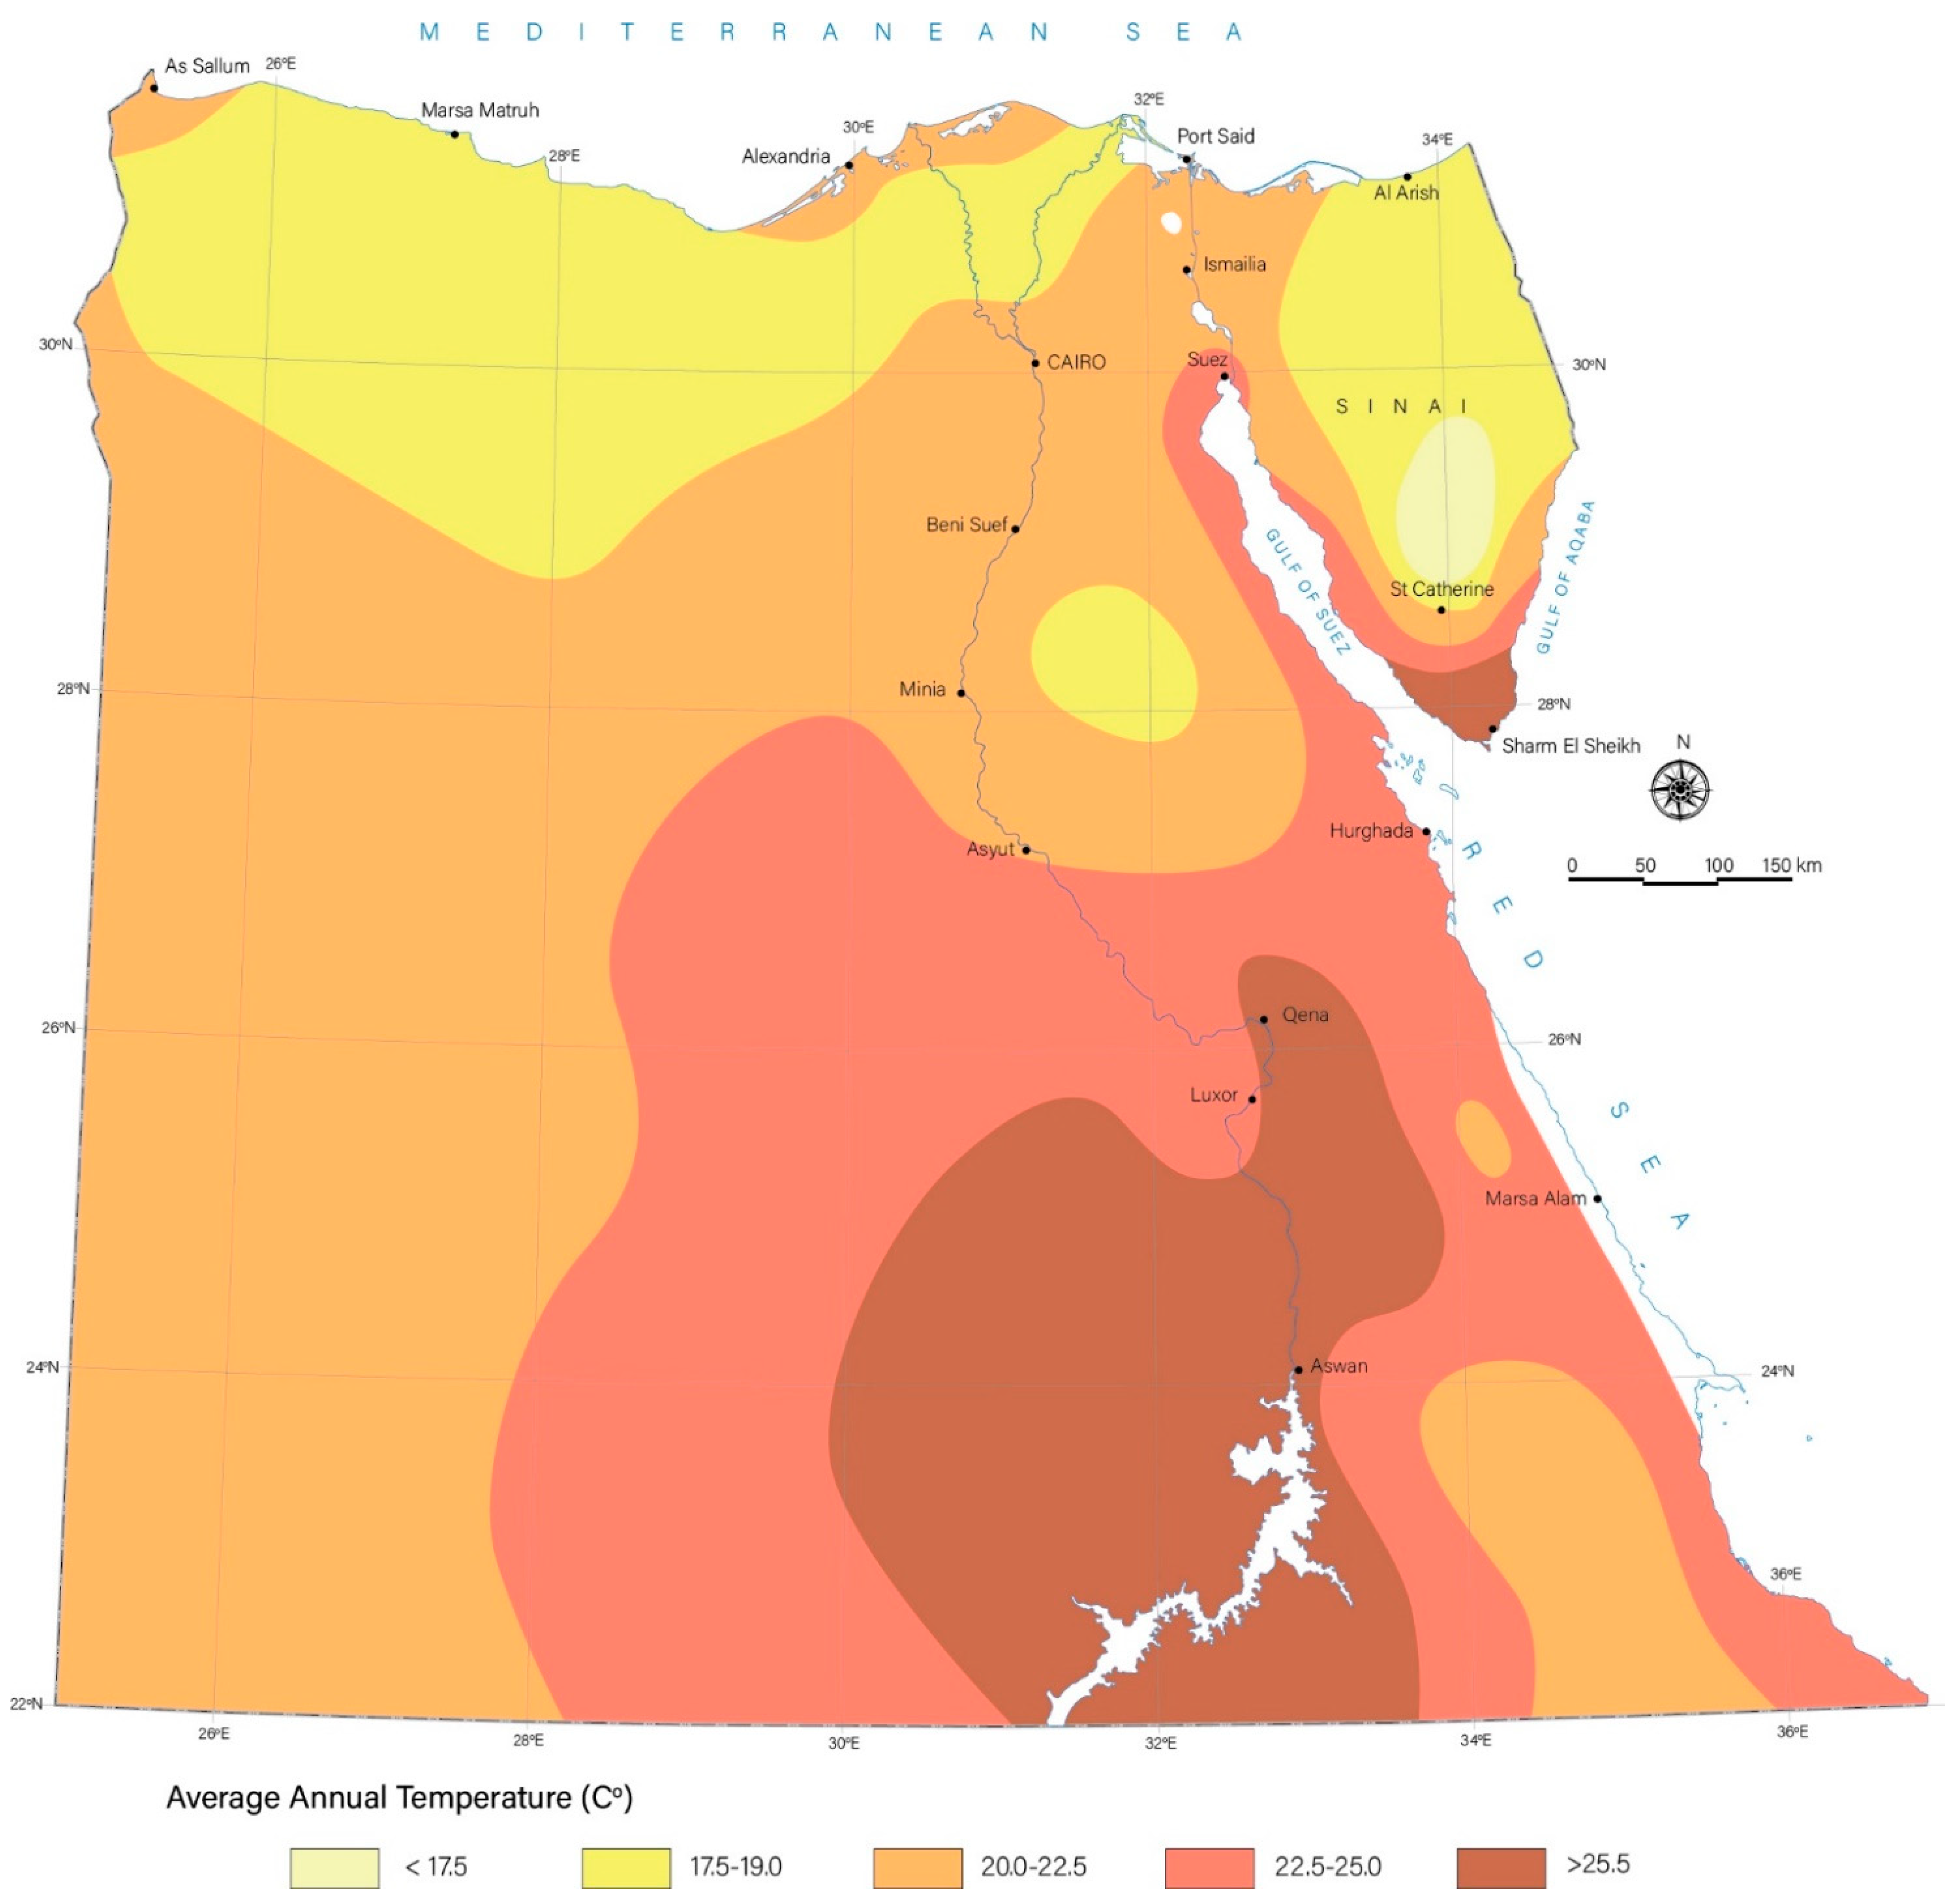
  • (c) Temperature (°C)
Photovoltaic (PV) solar cell efficiency experiences a notable decline with rising temperatures, primarily due to the accelerated rates of internal carrier recombination. This phenomenon can be attributed to the increased carrier concentrations that occur at elevated temperatures. The temperature at which solar cells operate plays a pivotal role in the photovoltaic conversion process, with a clear and direct impact on the efficiency of electricity generation and the overall power output of PV modules. Numerous simplified equations found in the existing literature establish correlations that are applicable to a wide range of setups, including PV arrays. Therefore, it is crucial to conduct a comprehensive study and analysis of temperature distribution, as emphasized in research conducted by Abou-Ali et al. in 2023 [19]. Data were gathered from NASA Egypt, encompassing a 30-year period from 1993 to 2022, focusing on average temperatures at a height of 2.0 m above ground level. Leveraging the ArcGIS software, these data were employed to create temperature distribution maps, enabling precise analysis and modeling of specific areas or points in Egypt over time. Figure 6 visually illustrates the resultant temperature distribution in Egypt, aiding in understanding the geographical variations in temperature.
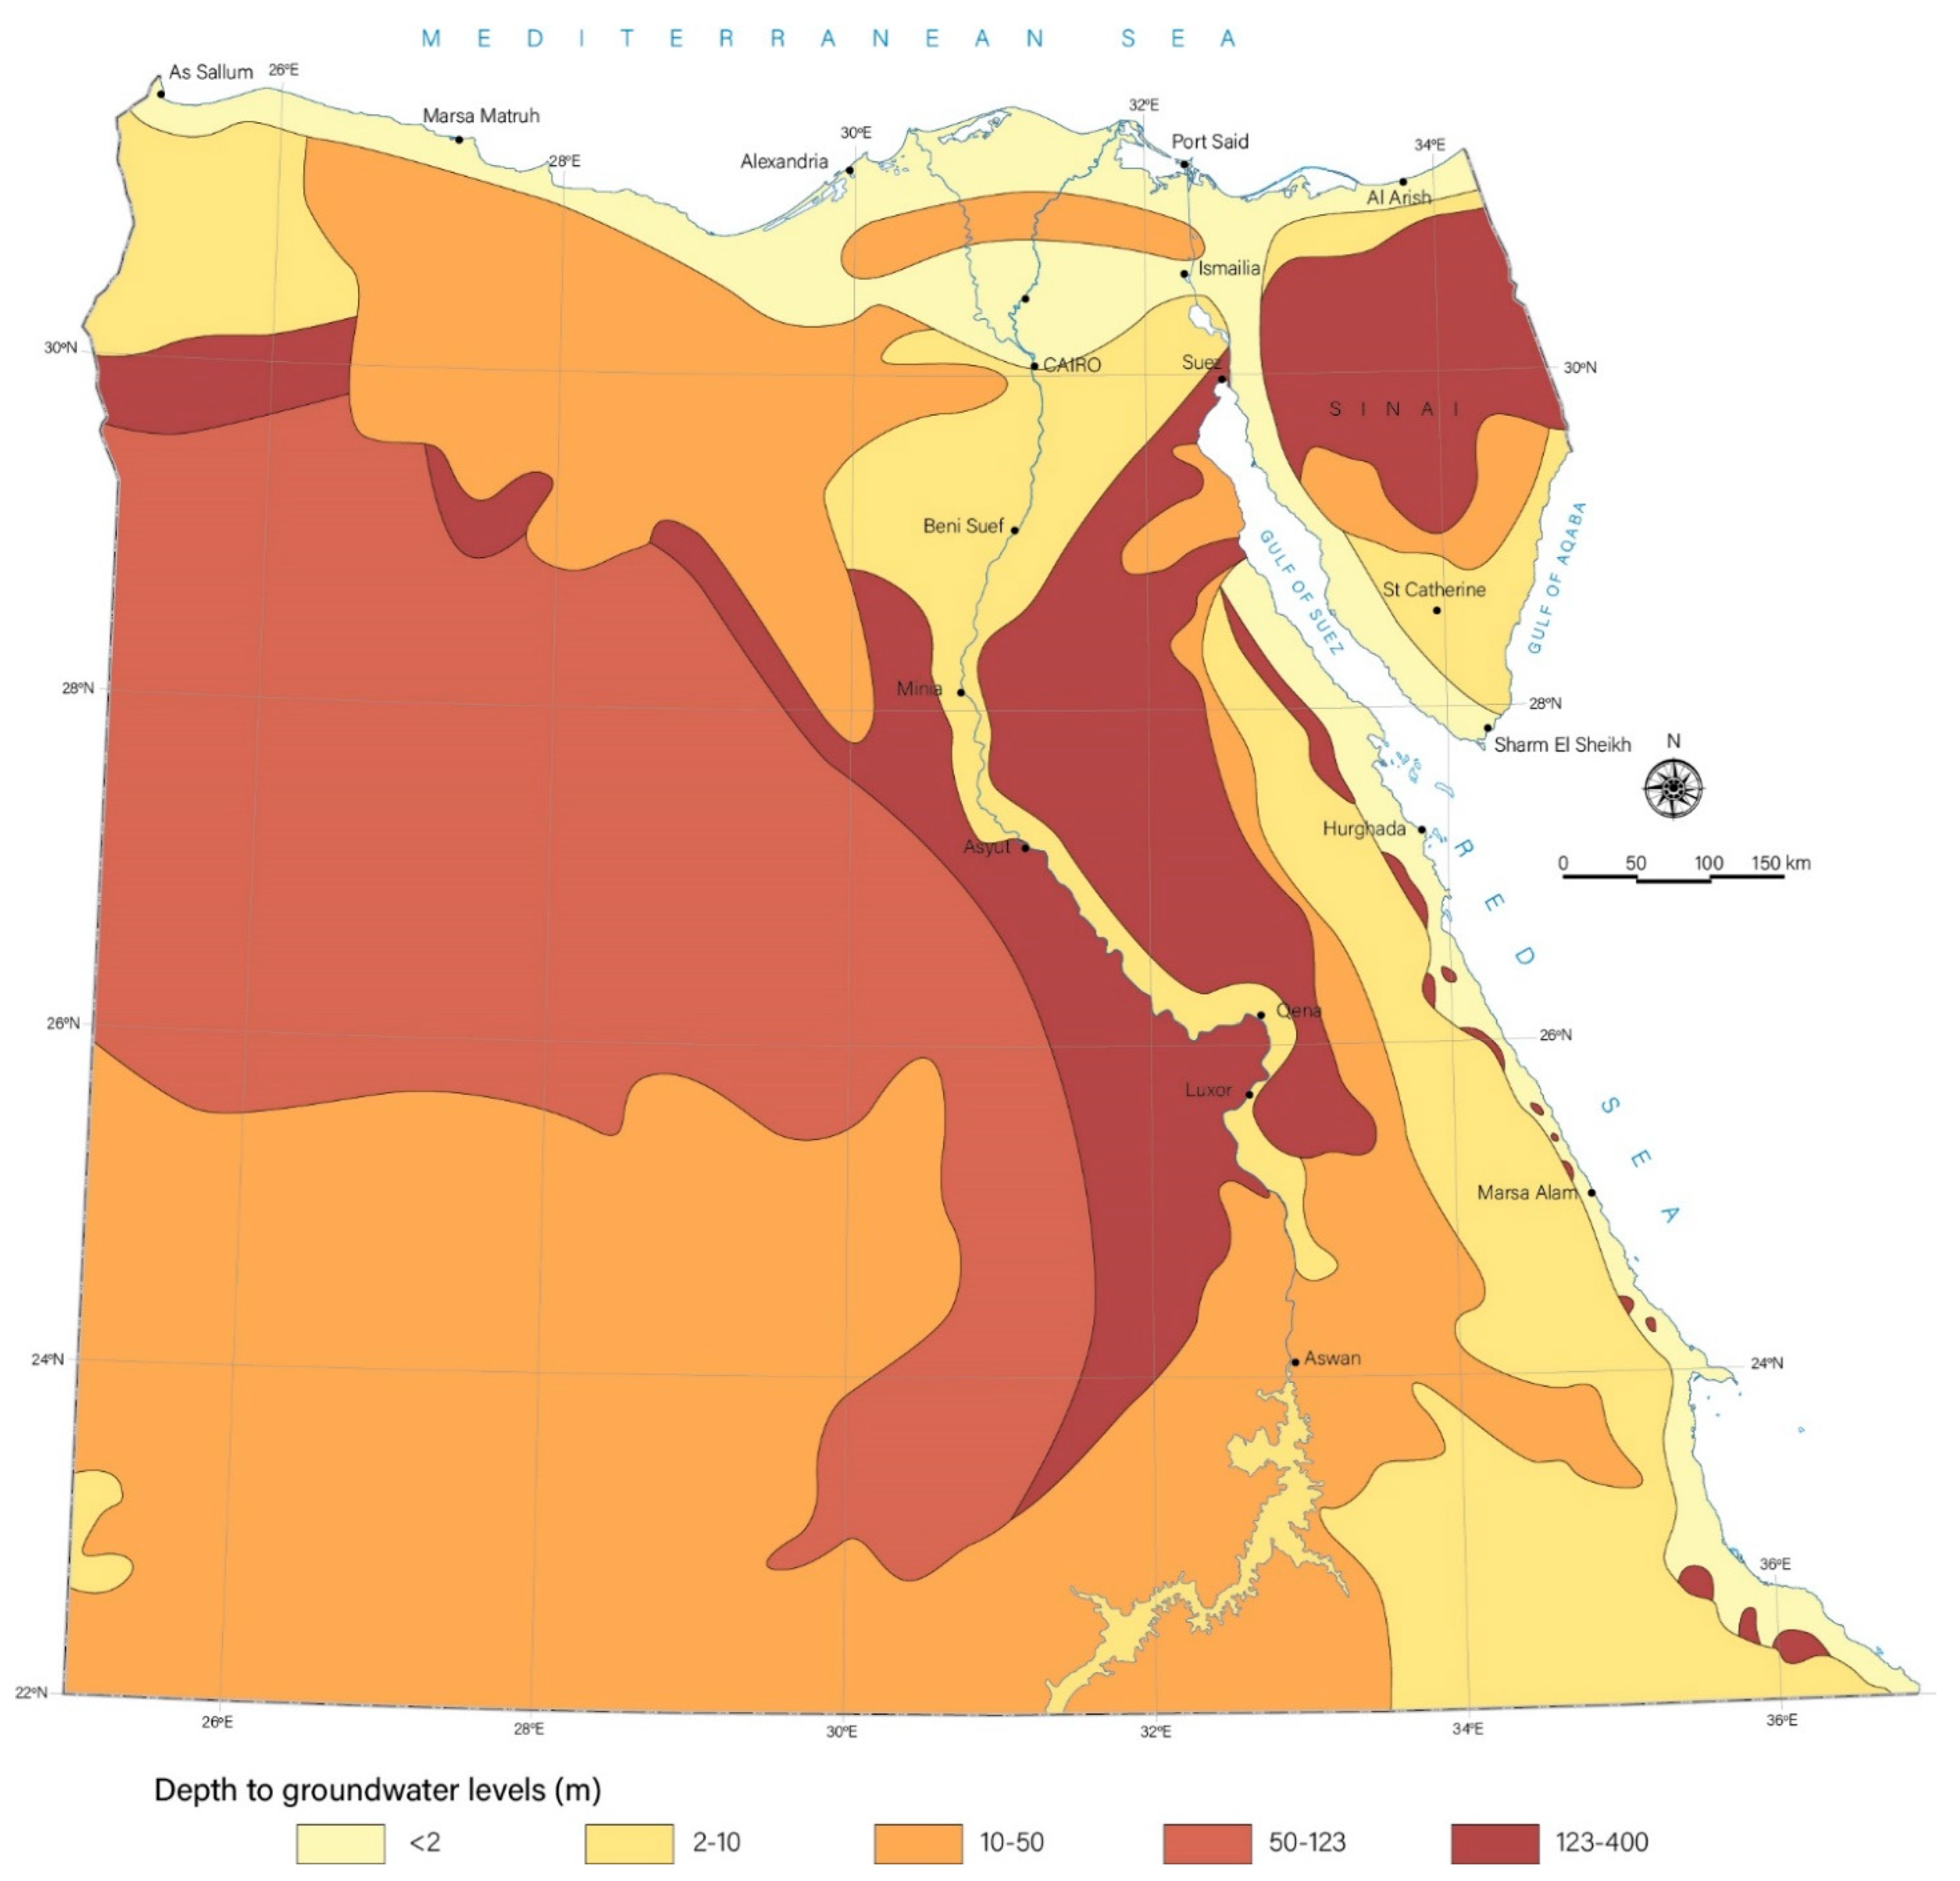
  • (d) Depth to Groundwater Levels
The pumping cost is direct function in the depth to groundwater levels, which will impact the feasibility of the solar-powered desalination plant. Mainly, there are four aquifer systems in Egypt. The first is the quaternary aquifer system within the Nile Valley and Delta region recharged by excess water from irrigation networks. The second is the non-renewable Nubian Sandstone Aquifer. The third is the limited renewable Moghra aquifer system. The fourth is the fissured limestone aquifer system [20]. The depth to groundwater levels were classified as shown in Figure 7.
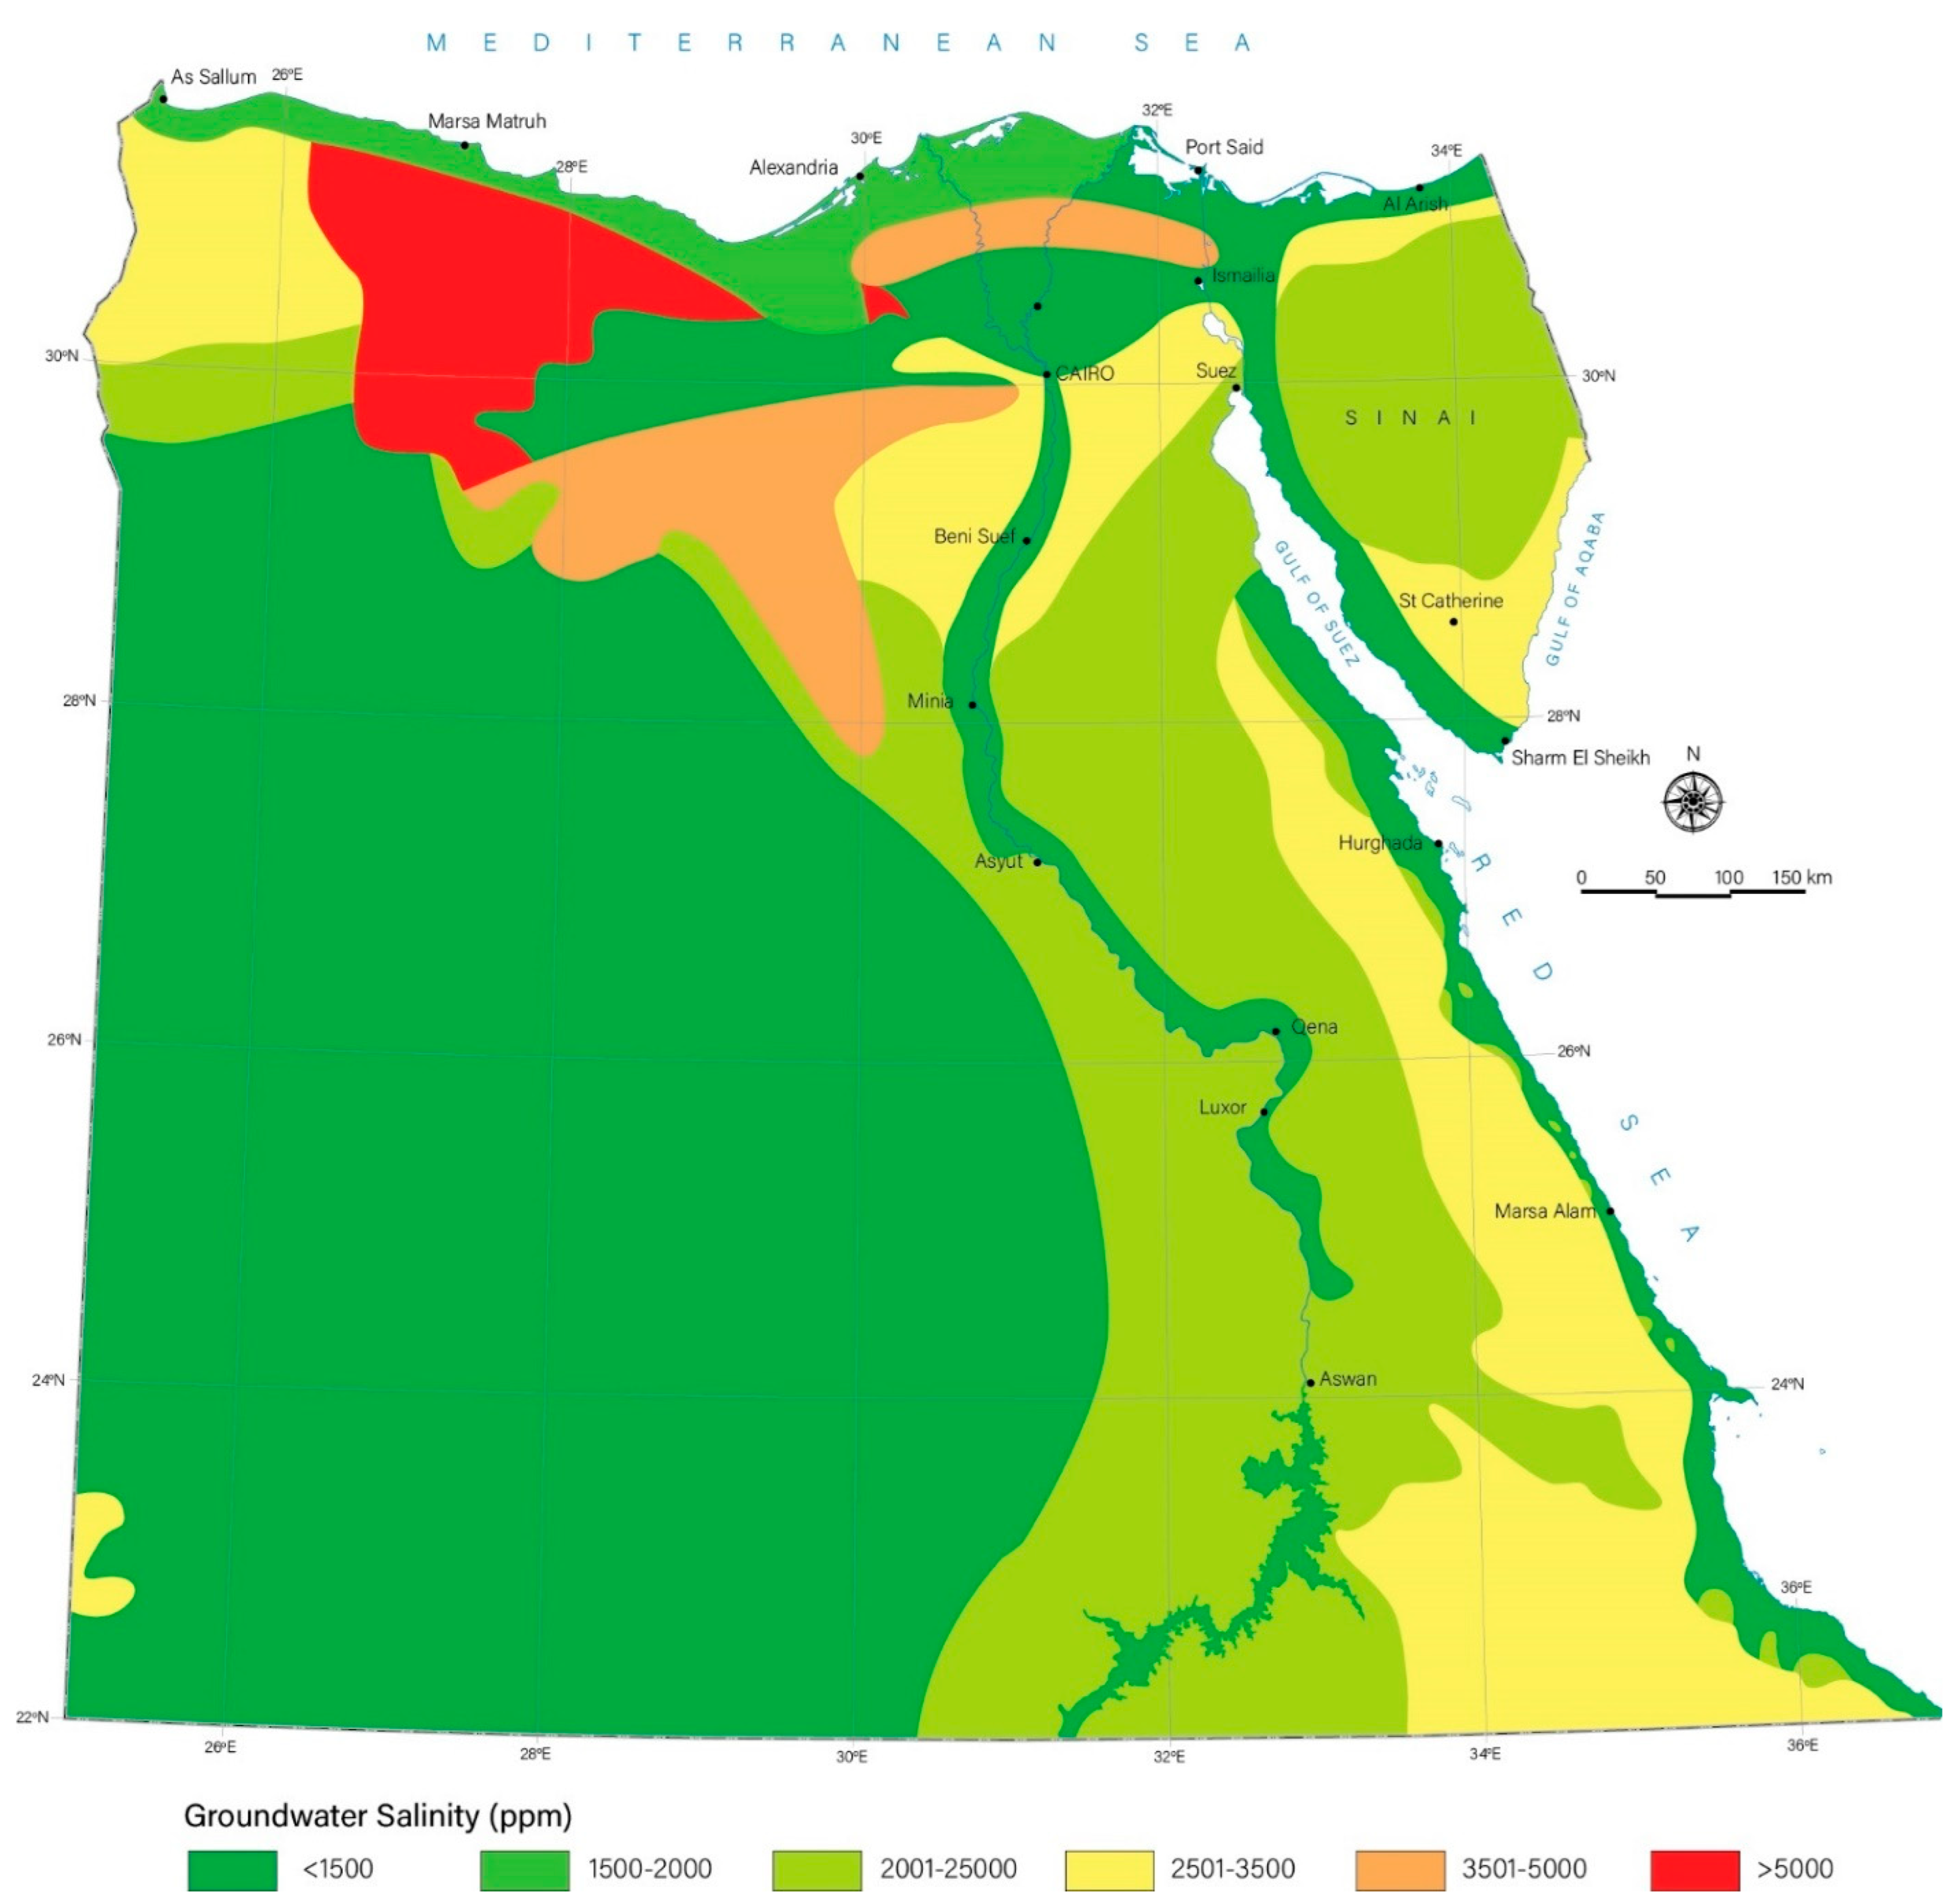
  • (e) Groundwater Quality (Salinity)
The salinity of brackish groundwater can significantly impact the selection of a desalination system and the cost, as it will impact the energy cost. The higher salinity water generally requires more energy for treatment. The impact of brackish groundwater salinity on the selection of a desalination system is substantial, affecting energy costs, technology feasibility, and overall system performance. A comprehensive evaluation of various factors is essential to determine the most suitable desalination solution for treating brackish groundwater with specific salinity levels. The present studies indicate that the present abstraction from the Quaternary aquifer system is about 6.4 billion cubic meters annually with salinity ranging from 1500 ppm in the Nile Valley and the South Nile Delta and reaching about 5000 ppm in the North Delta. The Nubian Sandstone Aquifer covers about 85% of Egypt’s surface area and the present abstraction is about 2 billion cubic meters annually with salinity ranging from 500 to 2000 ppm. The present abstraction from the Moghra aquifer system is about 1 billion cubic meters annually, ranging from 2000 to 15,000 ppm, especially after starting new reclamation project in 2022. The fissured limestone aquifer covers about 53% of Egypt’s surface area, with a poor potentiality, and there is pumping at present from this aquifer due to low yield with salinity ranging from 2100 to 16,000 ppm [21]. The groundwater salinity classification is shown in Figure 8.

2.2. Exclusion Areas

Exclusions in land use for solar-powered desalination are influenced by a range of topographic factors, with altitude and steep slopes playing a pivotal role. Notably, experts highlight that establishing wind farms in regions characterized by significant slopes, such as mountains and cliffs, may entail increased investment requirements. Additionally, regulatory frameworks at both the national and local levels impose specific restrictions. For example, construction activities within residential and urban zones, as well as in close proximity to rivers, airports, and other designated areas, must adhere to distance standards set by governing regulations. After establishing the exclusion criteria using Boolean logic, the CON tool is employed to assign binary values, typically represented as true (1) or false (0). In the final stage of data analysis, all areas falling under these exclusions are systematically eliminated.

2.3. Pilot Project Site Selection

In this study, each criterion was assessed and assigned weights through the analytical hierarchy process (AHP) method. The process began by establishing a hierarchy structure for the criteria based on AHP principles. Subsequently, comparisons between factors at each level were made to determine their relative importance. Finally, weights were computed for each criterion. The weights assigned to the criteria were primarily derived from existing research relevant to the specific country and region under investigation. Wind speed, soil and climate type, slope, and groundwater aquifers were accorded the highest weights, signifying their greater significance in the study. Conversely, the distance from the airport, city, and protected areas received the lowest weights in the evaluation process. According to this analysis, it has been found that El Alamein is an area that has emerged as a highly favorable location for solar-powered desalination pilot projects. This suitability is attributed to the coastal aquifer system, which presents a promising option. The driving factors behind this selection include the escalating water requirements along the northern coast, coupled with concerns related to groundwater salinity. Additionally, the abundance of solar radiation and the prevailing temperature conditions in the area contribute to its attractiveness as an ideal site for solar-powered desalination. Figure 9 shows the pilot project location map.

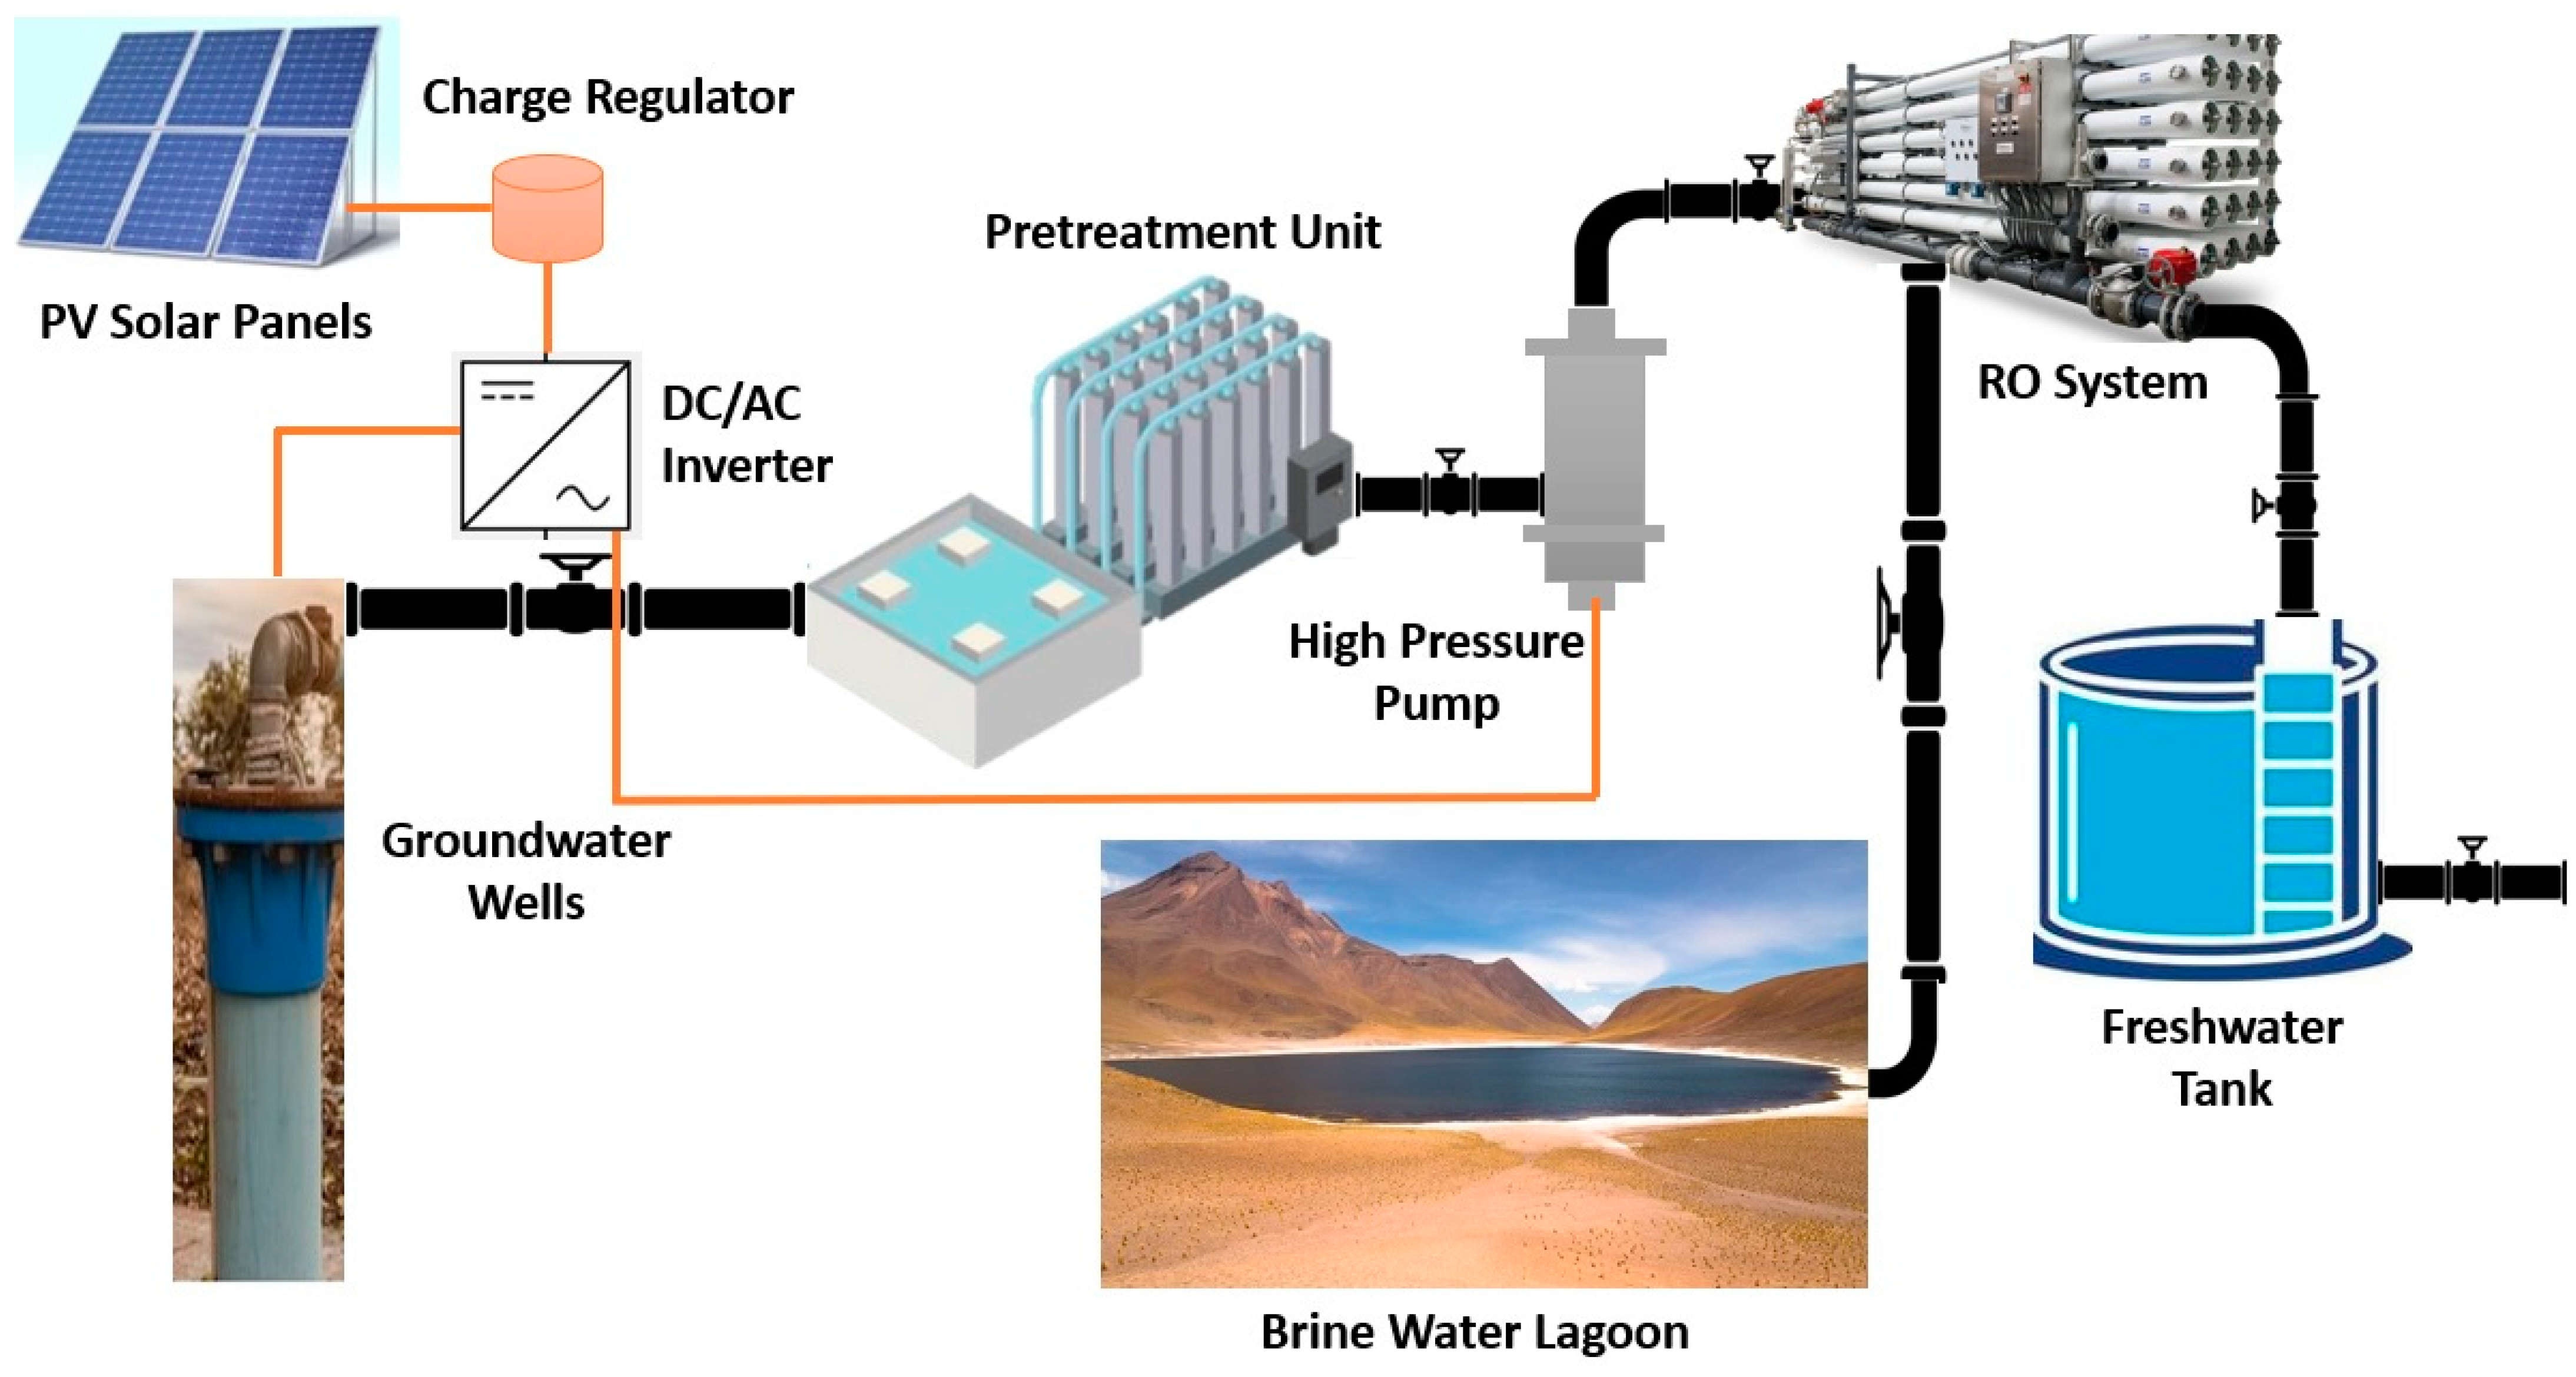
2.4. Solar Desalination Pilot Plant at El Alamein

A 1000 m3/day capacity solar-powered RO desalination plant was designed and constructed in Northern Western Desert (El Alamein area) to utilize the brackish groundwater from two drilled wells taping the coastal aquifer system with a salinity of about 21,150 mg/L. Table 3 presents the typical chemical analysis of groundwater sample, which is mainly characterized by medium salinity in the range of brackish groundwater, low organic contamination, and low Fe and Mn contents. Figure 9 shows the typical design of the pilot project and Figure 10 shows schematic diagram of the design of the solar-powered RO desalination plant. Figure 11 shows a real photo from the site.
Table 4 shows the technical design specifications of the PV–RO desalination pilot project. Figure 12 shows the constructed solar-powered RO desalination pilot plant in El Alamein area on northern coast of Egypt. The photovoltaic system area for the peak load can be obtained from Equation (1) [22]:
A p v = E l H   η p v   η i n v   η b   η c c   T c
where A p v is the required photovoltaic system area for peak load (m2), E l is the daily peak energy demand for the RO system (kWh/day), H is the daily irradiation within the study area (Wh/m2/d), η p v ,   η i n v ,   η b and η c c are the efficiencies of photovoltaic system, inverter, battery, and charge controller, respectively, and T c is a temperature correction factor of the photovoltaic system module.
The required photovoltaic module power 𝑃𝑝𝑣 (W) to meet the desalination system demand electrical load can be estimated from Equation (2):
𝑃𝑝𝑣 = 𝐴𝑃𝑉 𝐻𝑠𝑐 𝜂𝑃𝑉
where 𝐻𝑠𝑐 is the standard solar irradiation (kW/m2) and 𝐴𝑃𝑉 is the area calculated from Equation (1). Then, the total number photovoltaic modules (Nm) can be calculated based on the commercially available area of a single photovoltaic panel. The number of modules can be defined by Equation (3):
N m = P p v P m
where 𝑃𝑚 is the power of the single module (W). The actual area of all modules (𝐴𝑡) and the exact peak power for total modules (𝑃𝑡) are given by Equations (4) and (5):
A t = A m   N m
P t = N m   P m
where 𝐴𝑚 is the area of the single module (m2) and 𝑁′𝑚 is the corrected number of modules to the nearest integer number.

3. Results and Discussion

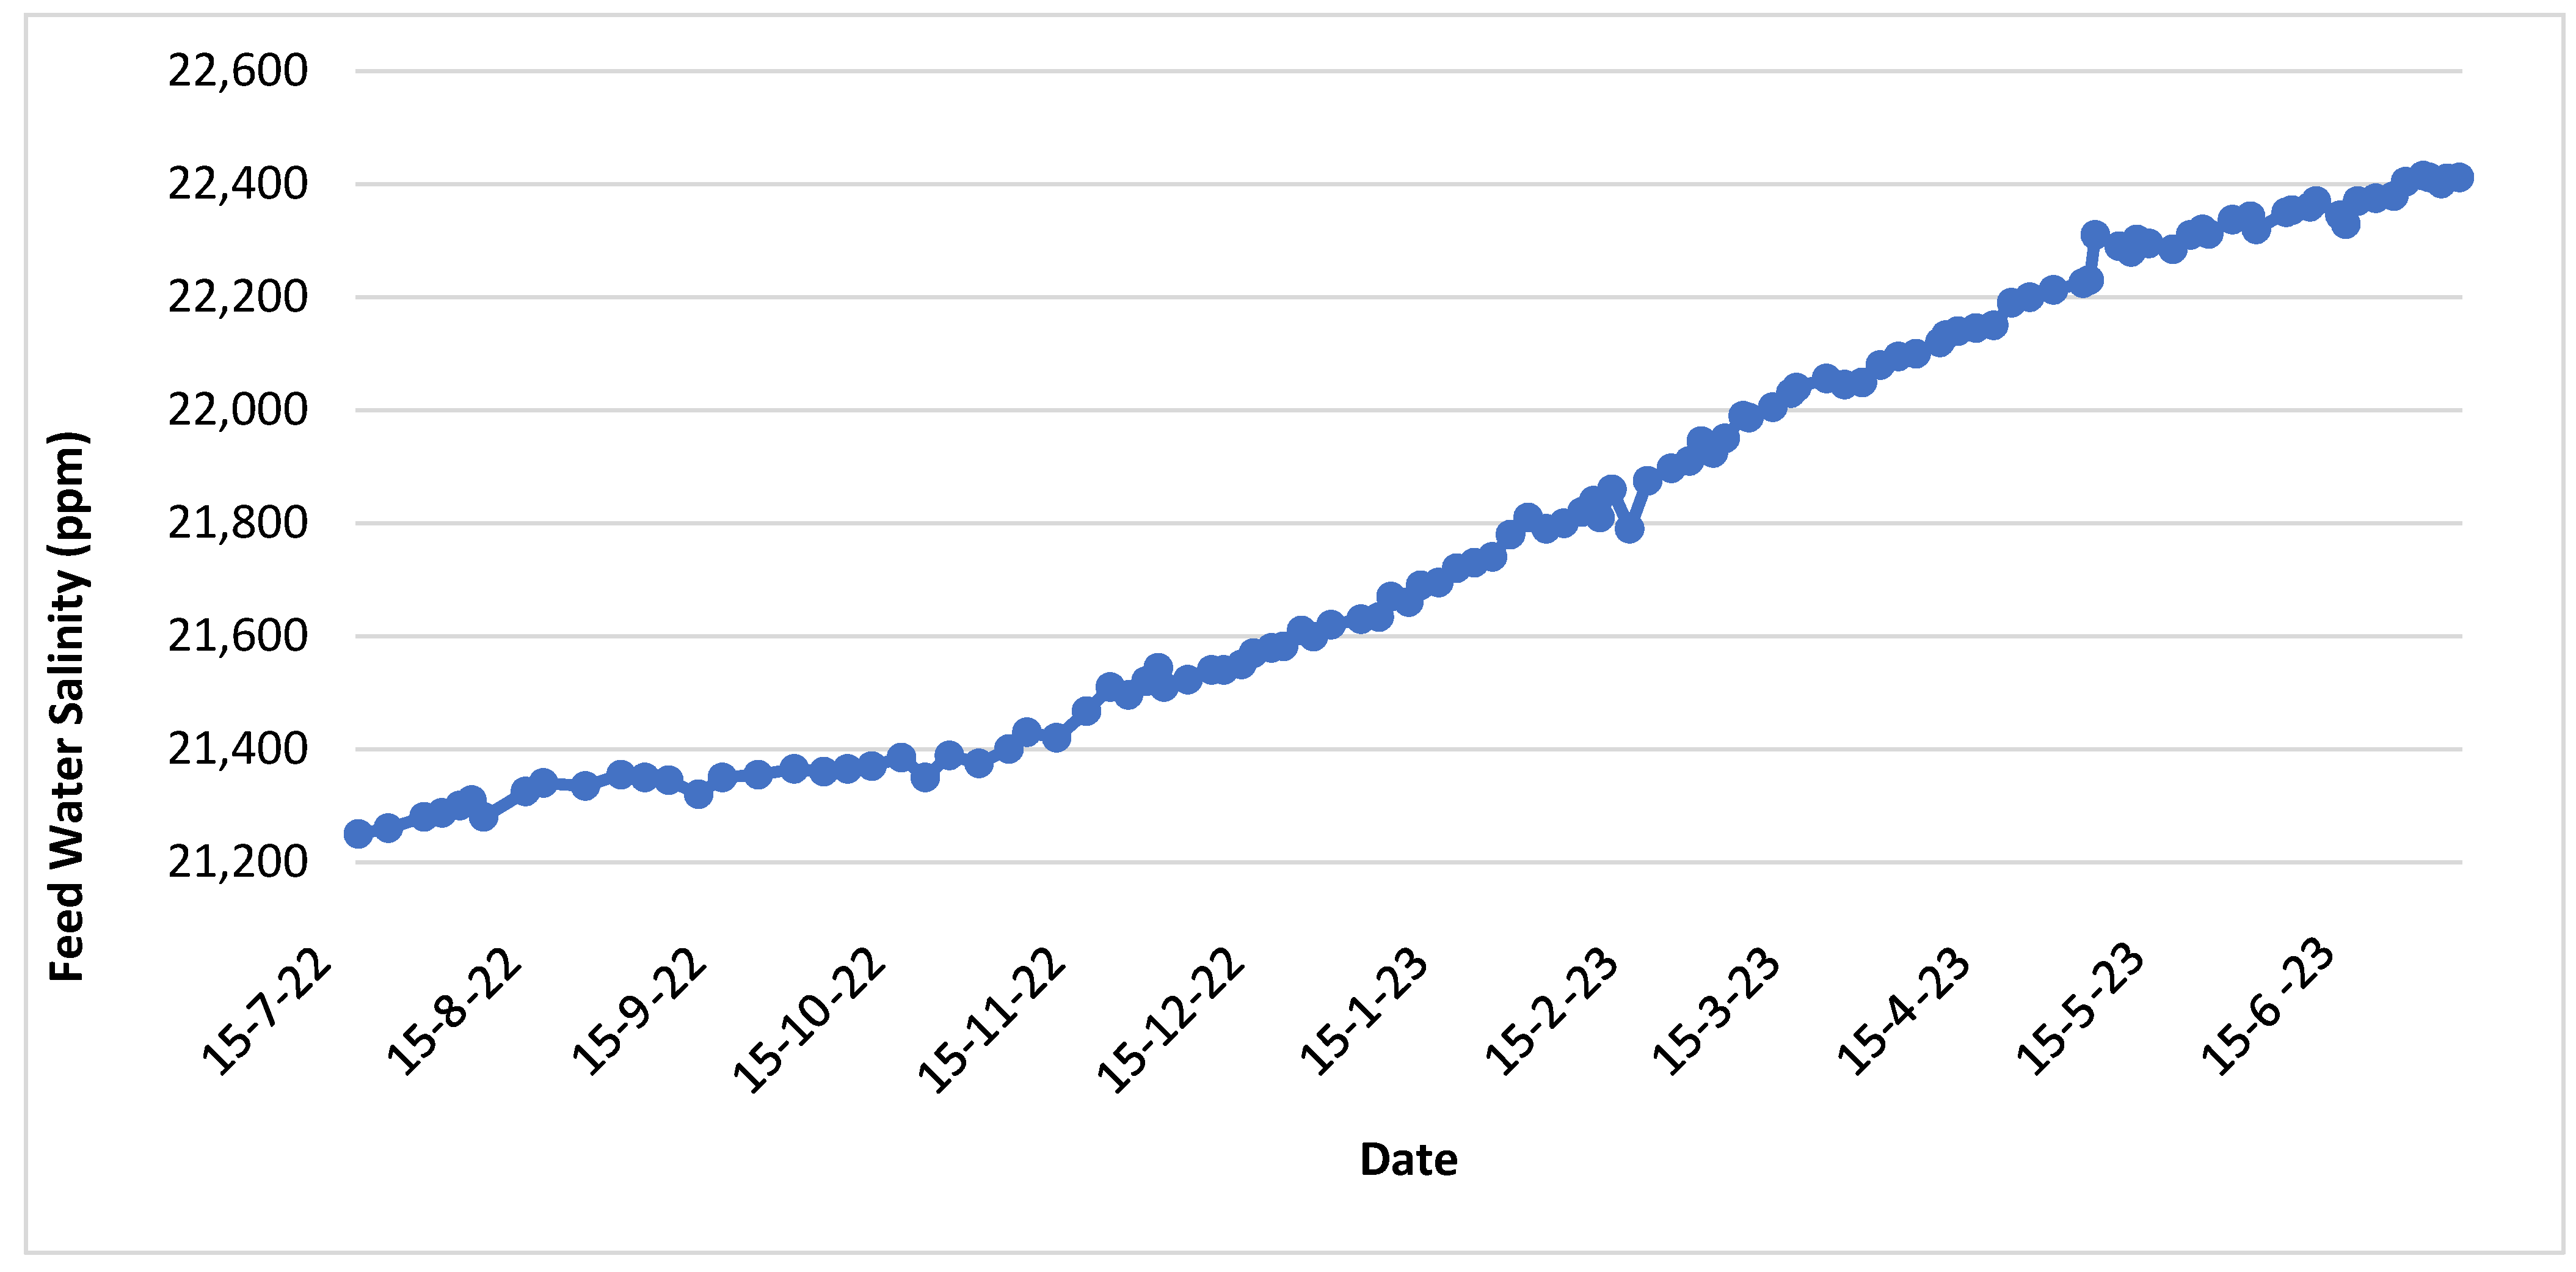
3.1. The Feed Water Flow, Quality, and Temperature

The desalination plant operates efficiently as it receives a steady supply of brackish groundwater from two wells, with a daily discharge range of about 2200 at the beginning of the operation and it increases smoothly to reach about 2820 cubic meters after one year of operation. This essential resource ensures a consistent production of fresh water through the desalination process, with a daily capacity of 1000 cubic meters. The plant’s advanced technology and infrastructure are well-equipped to handle this flow rate, effectively removing salts and impurities from the brackish groundwater, resulting in a reliable source of clean, potable water. Figure 13 shows the feed water (brackish groundwater) flow during the study period.
During the study period, the quality of feed brackish groundwater, specifically its salinity levels, has exhibited a slight increase ranging from 21,250 up to 22,400 mg/L. This increase in feed water salinity is primarily attributed to the limited recharge of the groundwater coastal aquifer system, which, in turn, has a profound impact on the operational efficiency of the desalination plant and the recovery ratio. To ensure the sustained effectiveness of the plant, a strategic and well-planned approach to groundwater abstraction is imperative. Such a plan will not only address the immediate concerns related to water salinity but also prevent the imminent issue of underlying saline groundwater in the deeper aquifer system to the tapped brackish groundwater lens, ensuring the long-term viability of the performance of the plant and its freshwater production. Figure 14 shows the feed brackish groundwater water quality (salinity in mg/L) during the study period. Increased feed water salinity (TDS) can dramatically impact the design of the RO in terms of hydraulic design, feed pressure requirements, and permeate quality.
As the temperature of the feed increases, the RO membrane’s productivity also goes up, albeit with a slight decrease in salt rejection. The feed temperature of the RO membrane shall fall between 5 and 45 °C. The brackish groundwater feed water temperature is about 32 °C and it is mostly constant over the year, as the groundwater depth is about 35 m from the ground surface. Figure 15 shows the relation between feed water temperature, productivity, and salt rejection.

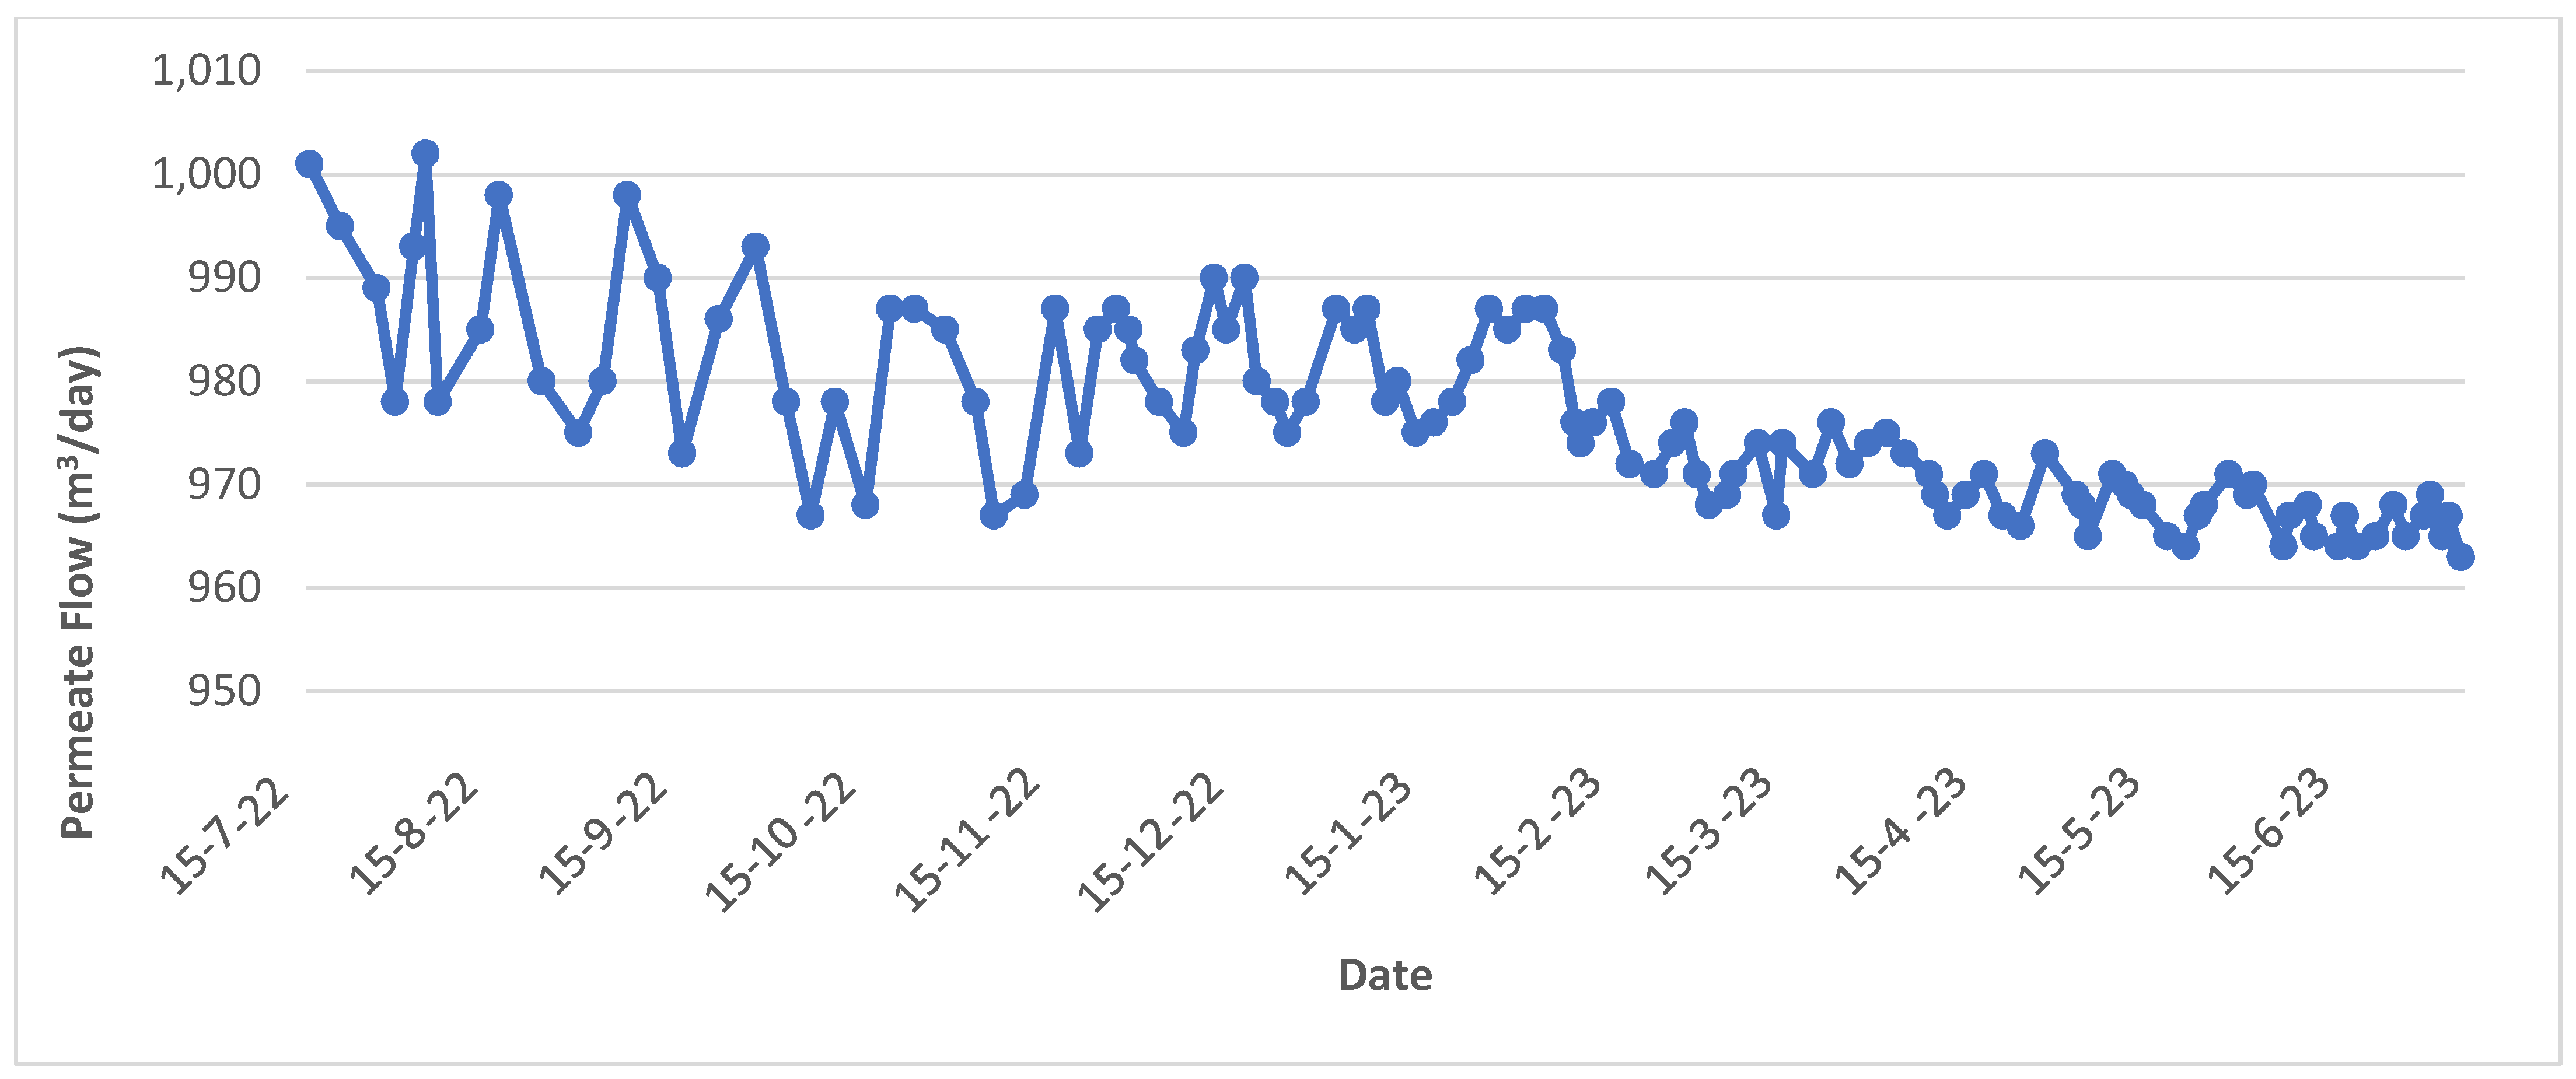
3.2. The Permeate Flow and Quality

Figure 16 illustrates the permeate flow over the study period, depicting a decline from 1000 to 963 m3/day due to reduced recovery. This drop in permeate flow and recovery could result from membrane fouling, scaling, element compaction, and an elevation in feed water salinity. After a year of operation, the permeate flow diminished by 4%. Throughout the study, the RO system maintained acceptable permeate water quality, with salinity and TDS levels consistently falling within the 590–625 mg/L range, making it a viable source of potable water supply. Figure 17 illustrates the permeate salinity (TDS) in mg/L, influenced by the mass transfer rates of water and dissolved solutes through the membranes.

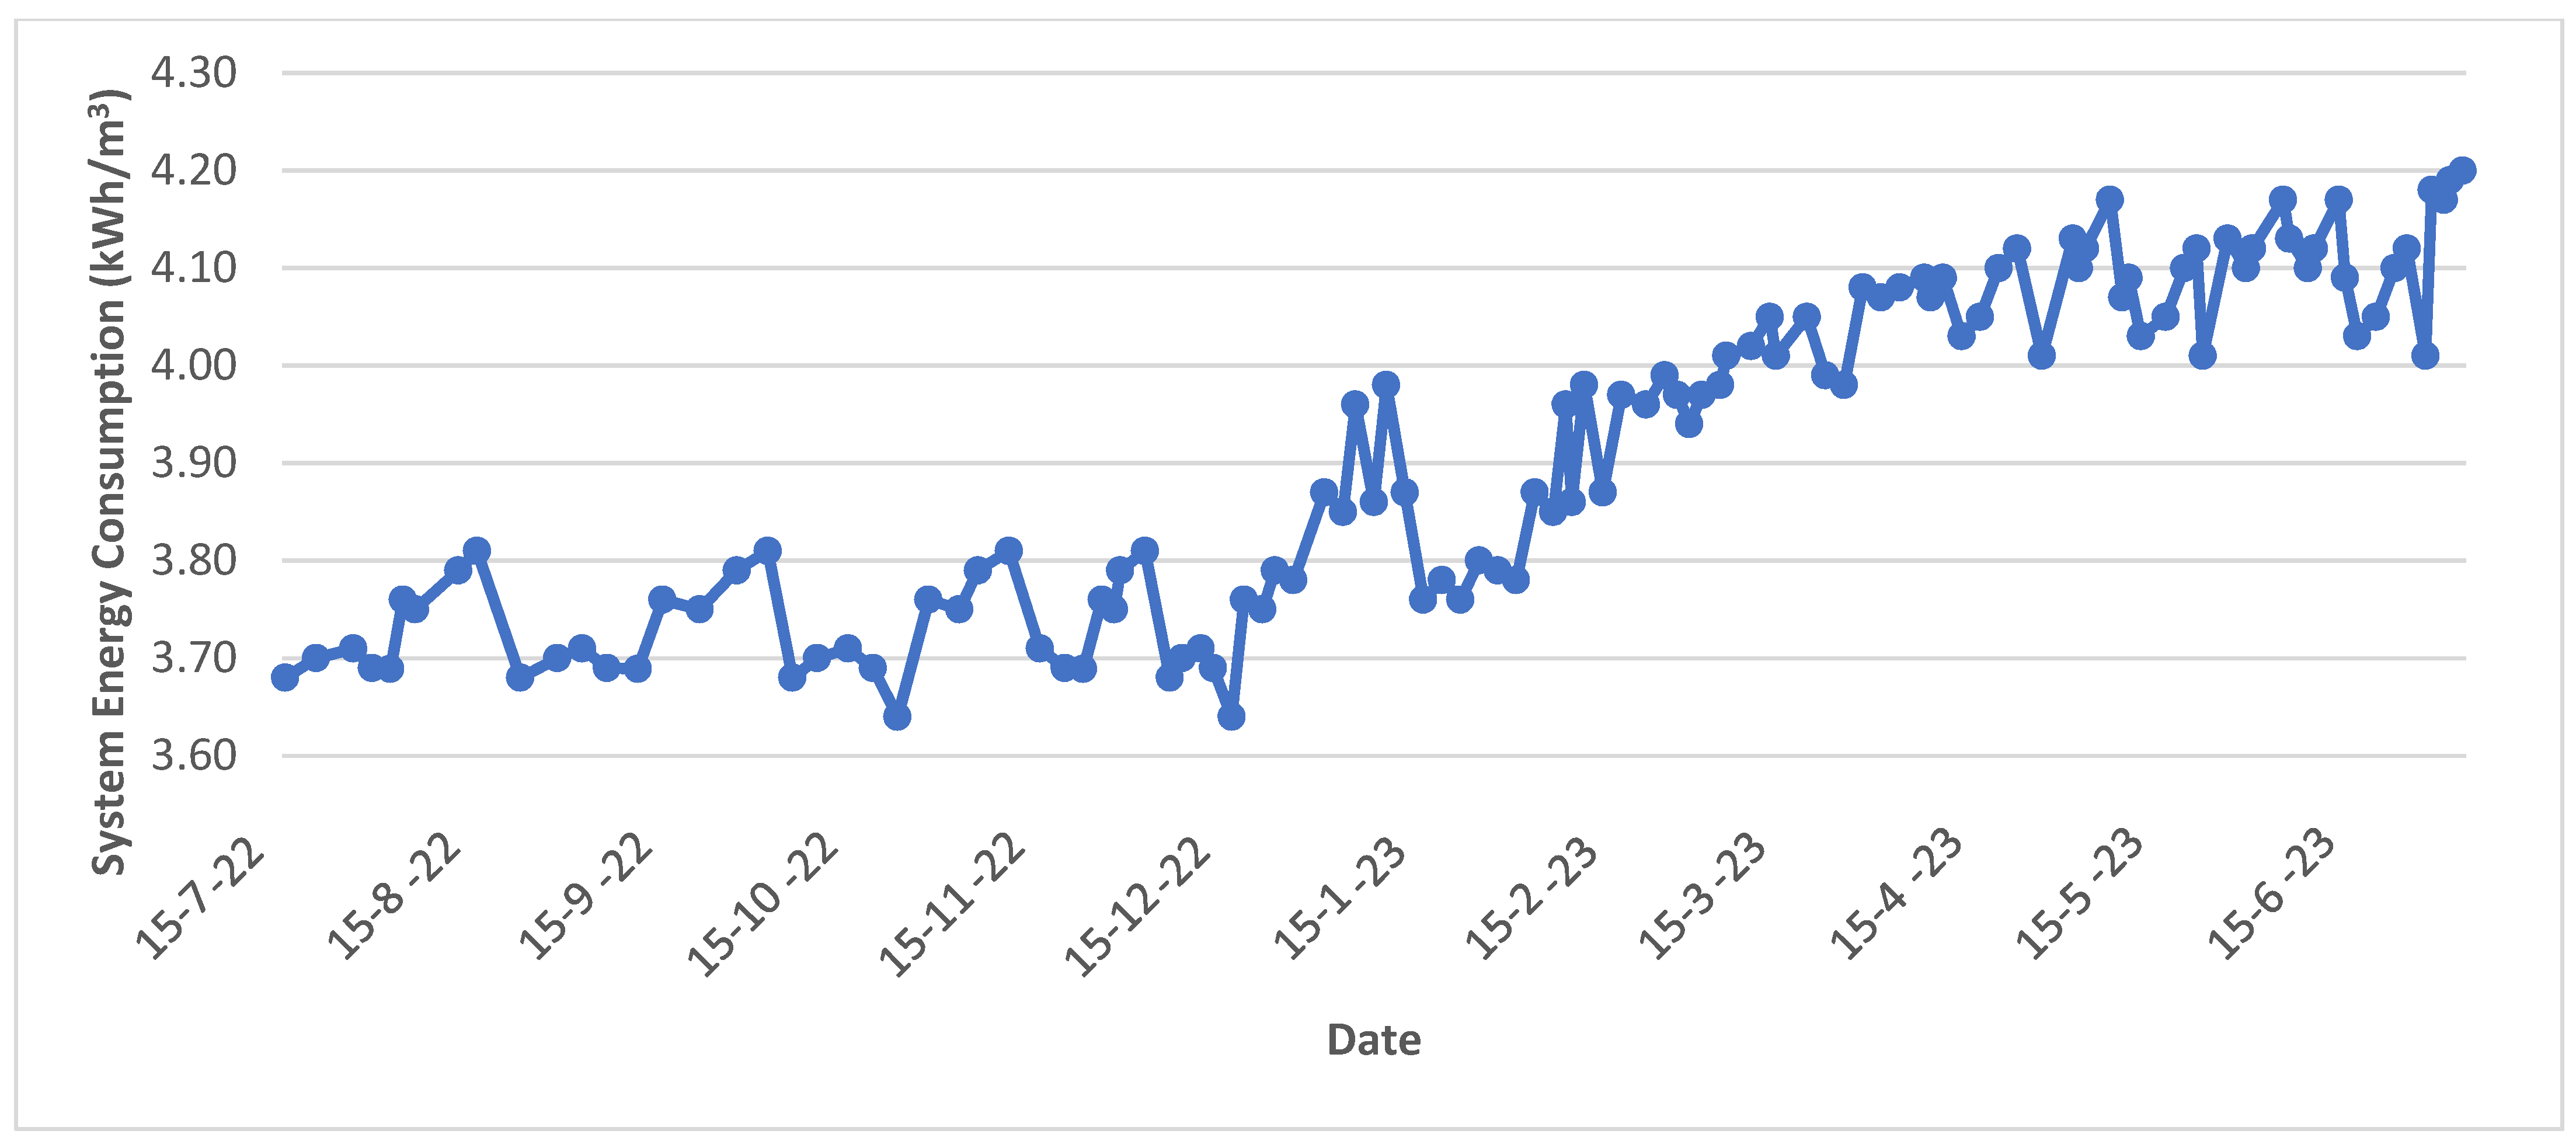
3.3. Energy Consumption

Energy system consumption is influenced by various factors, including a groundwater level of approximately 76.0 m, a feed brackish water salinity of 22,350 mg/L, and feed pressure. Figure 18 displays the system’s energy consumption throughout the study, ranging from 3.68 kWh/m3 to 4.20 kWh/m3 for produced permeate water, with an average of approximately 3.94 kWh/m3. These findings highlight the dependence of energy consumption on specific parameters and provide insight into the energy efficiency of the system in producing permeate water.

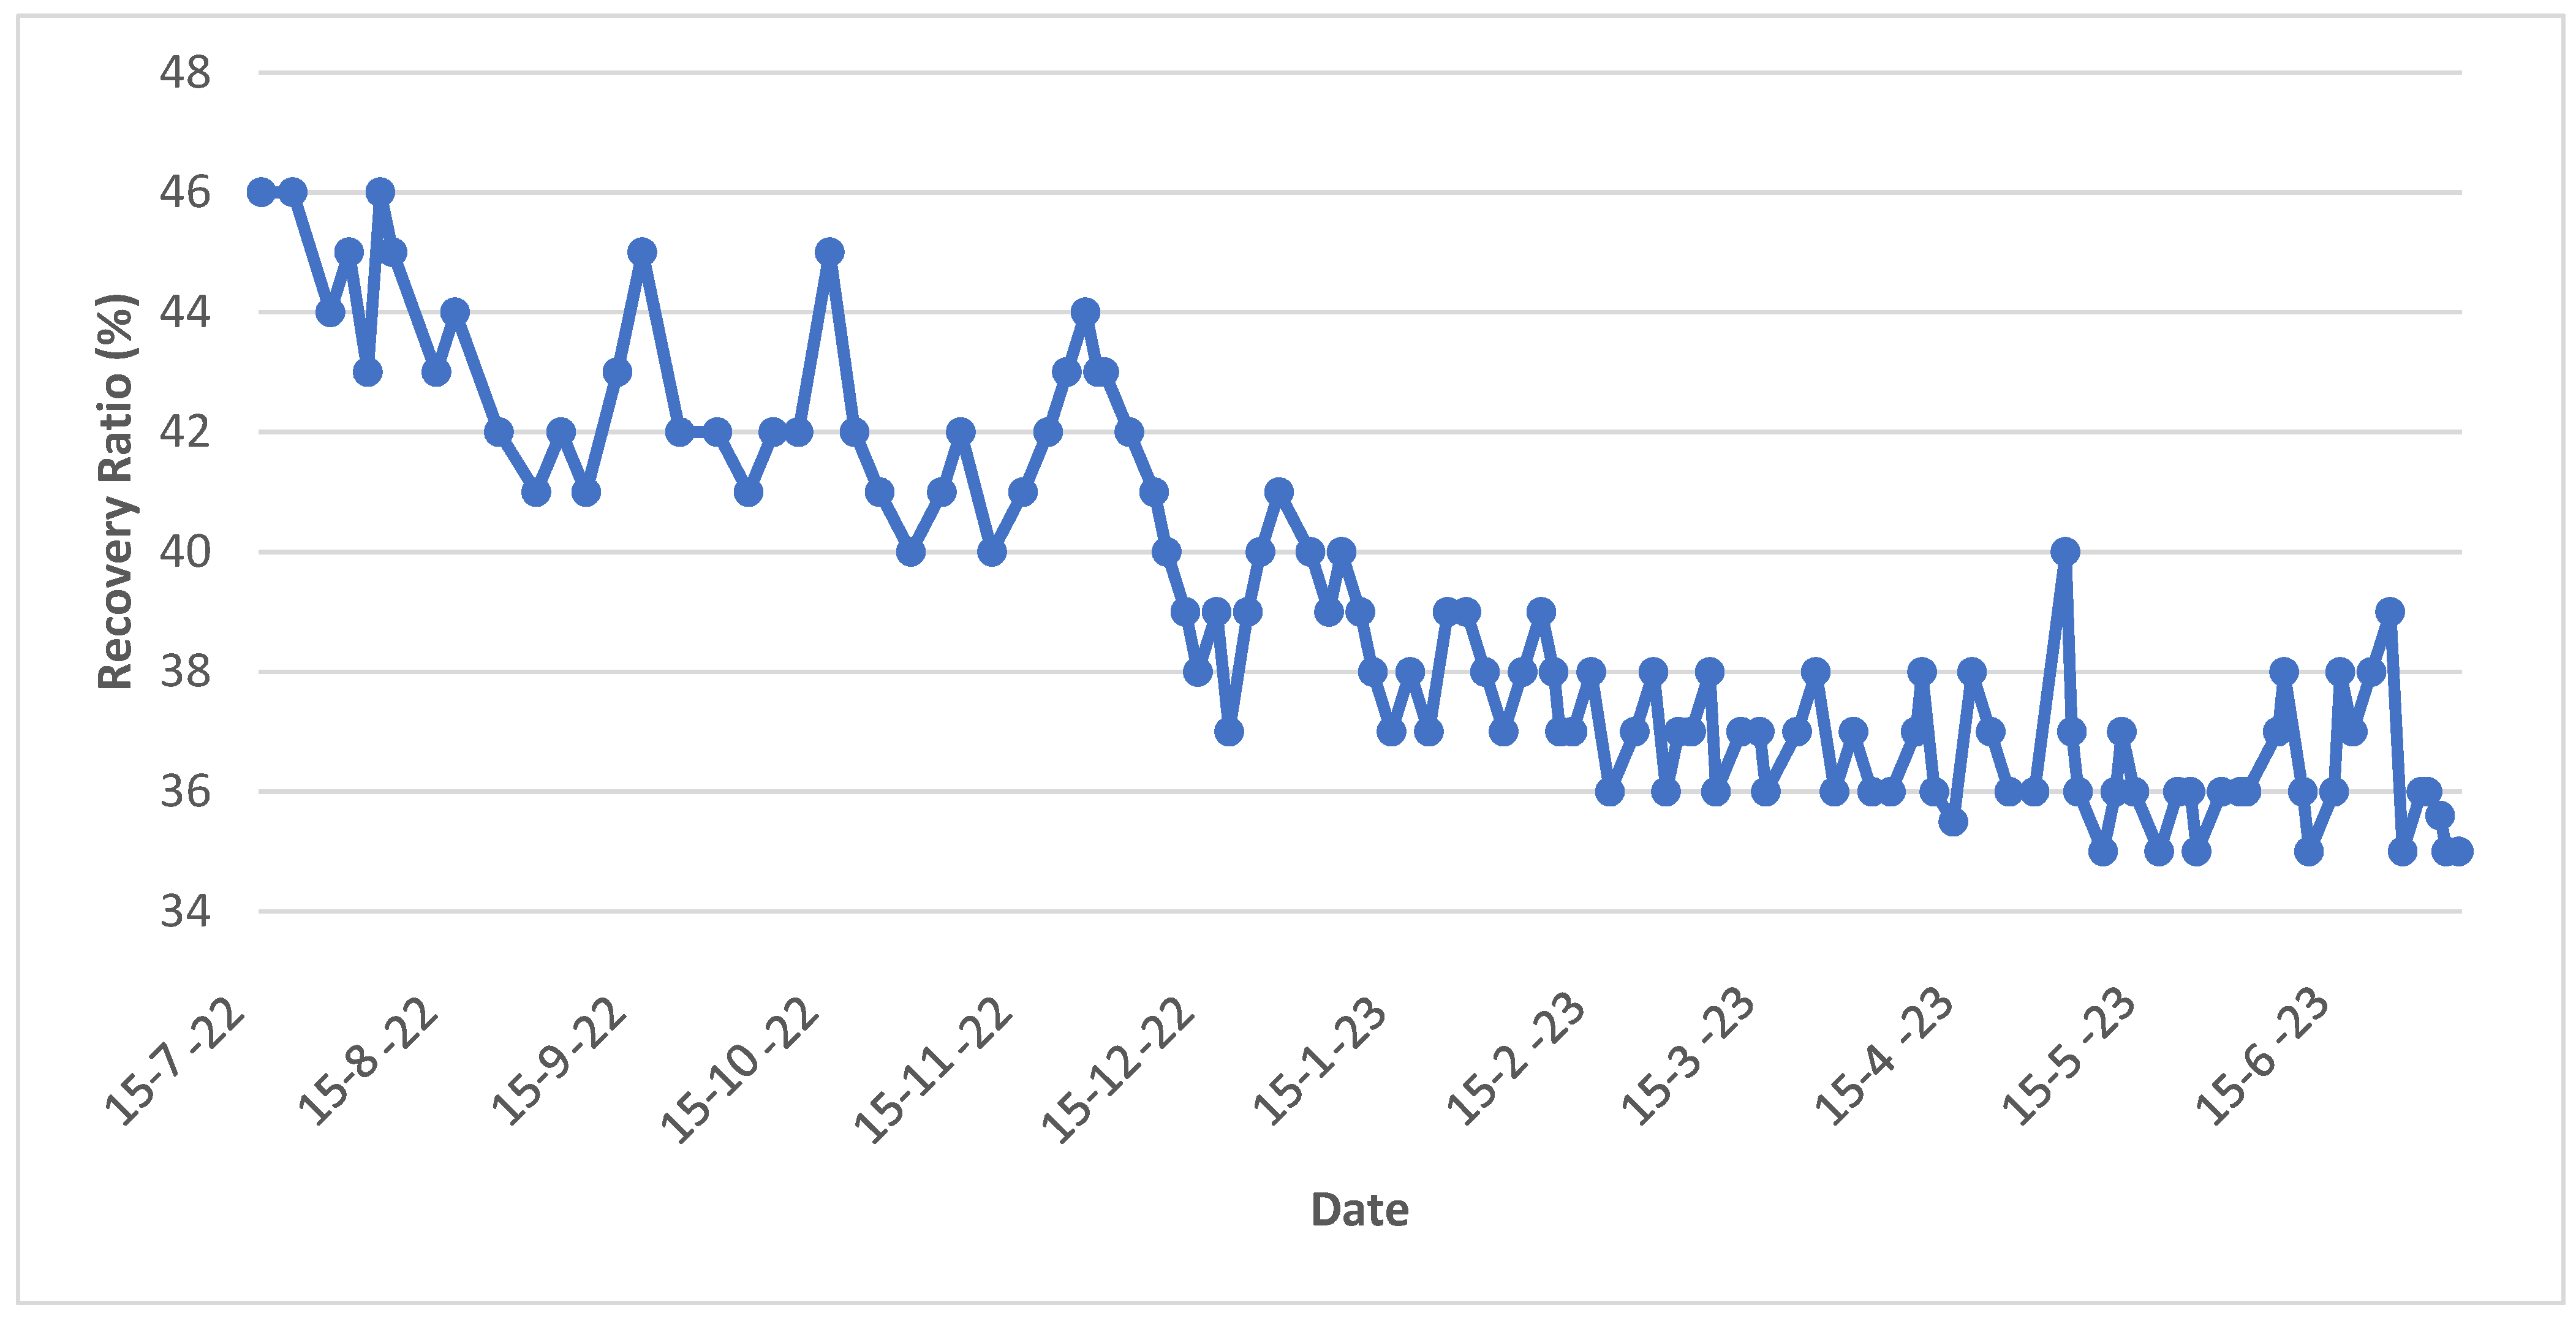
3.4. RO System Recovery

The results of RO system recovery indicate that there is a decrease in the system recovery from 46% at the beginning of the pilot project to 35% after one year of operation. Performance analysis and modeling indicate that after approximately three years of operation, the number of pressure vessels should be increased to boost the system recovery to at least 40%. The performance decay could be due to fouling, scaling, ambient groundwater salinity increase, and compaction that occurred during the operation, as shown in Figure 19.

3.5. The Economic Analysis for the System

The total capital cost for the construction of the system, including the groundwater wells, the desalination unit, and the brine water discharge bond is shown in Table 5. The construction cost for the desalination unit and the PV units is about EGP 16,320,000 (which is about USD 931,290). So, the capital cost is USD 931.29 per cubic meter of the capacity. Unlike fossil-fuel-powered desalination, solar desalination systems benefit from a daily energy supply that comes at no cost. However, it is important to note that as energy consumption per unit of water produced increases, the corresponding rise in the necessary area of solar collectors leads to higher capital costs. However, if the lifetime for the solar PV system without batteries is about 20 years, then the cost of the KWh will be calculated by multiplying the system’s minimum daily output (not its hourly capacity) by 365 to find its yearly output. Then multiply by 20 years to find the output over the warranted life of the system. Divide the result into the system’s total cost. So, the cost of kWh is about USD 0.039.
The primary cost of a seawater desalination driver is energy consumption, particularly in the high-pressure pump. The adoption of advanced reverse osmosis membranes from the latest generation can significantly reduce this cost. The system has an average power consumption of 4.0 kWh/m3, and at a rate of USD 0.039 per kWh, the energy cost per cubic meter of permeate water is approximately USD 0.16/m3. For a plant with a daily permeate flow of 1000 cubic meters, the daily energy consumption cost amounts to USD 160. Implementing more efficient technologies can lead to substantial cost savings in desalination operations.

3.6. Assessment of the Performance of Solar Desalination Systems

The performance evaluation of solar-powered desalination systems is often quantified in terms of the daily water purification capacity per unit collector area (expressed as L/m2-day). However, relying solely on this metric for performance comparisons can be misleading due to the geographical and seasonal variations in daily solar energy availability. To provide a more comprehensive assessment, we can deconstruct this parameter to isolate the influences of solar radiation and system design. For electrically driven systems like photovoltaic-driven reverse osmosis, we can express the daily volume of purified water (Vp) per unit collector area (Acol) in terms of daily solar energy incidence (Hsol), the specific work of purification (SW), and the average daily electrical conversion efficiency of the photovoltaic cells (ηpv):
V p A c o l = H c o l η p v S W
Conversely, for thermally driven systems like solar-driven humidification–dehumidification, we can express Vp/Acol in terms of daily solar energy incidence (Hsol), the average daily efficiency of solar thermal collectors (ηth), the gain output ratio (GOR), product water density (ρ), and latent heat of vaporization of saline water (hfg):
V p A c o l = G O R H c o l η t h   ρ   h f g
The equations presented allow for a clear distinction between the desalination and solar energy collection systems. Key factors affecting the global obtained ratio (GOR) and collector thermal efficiency include temperature variations within the desalination cycle. These fluctuations may occur during the day. To ensure uninterrupted operation, both thermal- and electrically powered desalination systems can incorporate energy storage methods to mitigate daily cycles and sustain performance even during nighttime hours. This highlights the importance of managing system dynamics and energy storage to optimize the efficiency and reliability of solar-driven desalination processes.

3.7. Environmental Impacts Analysis

One of the major challenges facing the inland desalination systems is the brine water discharge to the environment. Three options were assessed and evaluated. The first is to discharge the brine to an evaporation bond. The second is to reuse the brine for irrigation of salt-tolerant plants. The third is zero level discharge (ZLD). The expenses associated with running a ZLD desalination facility are partly balanced by the income generated from the sale of excess salt produced because of the desalination process. Furthermore, as desalination plants transition towards achieving and constructing ZLD, there will be a need for constructing temporary evaporation bonds. The estimated cost of this evaporation bond infrastructure is approximately USD 860 per square meter, accumulating to a substantial total cost. Recent studies have been carried out in many countries to minimize the brine water from RO desalination systems to achieve ZLD [12,23]. However, the effective management of RO inland desalination brine remains a notable technological challenge. It is worth noting that there have been relatively few studies conducted on a pilot plant scale in Egypt and globally, as evidenced by the existing research. Finding viable solutions necessitates a thoughtful consideration of RO brine composition and the substantial volumes involved. One promising avenue involves the production of sodium hydroxide (NaOH) from CSG RO brine through a process known as membrane electrolysis (ME). This alternative has garnered attention and has been documented in various technical papers [24]. However, it is important to recognize that the overall level of impurities present in CSG brine may present limitations when pursuing this zero liquid discharge (ZLD) approach [25,26]. Furthermore, regardless of the initial technology chosen for RO brine minimization and concentration, continued research is imperative to address and mitigate potential scaling issues. Table 6 summarizes the RO brine discharge options for inland desalination plants. Based on this analysis, a selected depression near the desalination plant location was selected to construct an environmental evaporation bond with a cost of about USD 39,250, which is about 4.2% of the total Capex.

4. Conclusions and Recommendations

The desalination sector in arid regions faces many environmental challenges and a need for sustainable energy sources. Renewable energy-driven desalination systems, such as solar-powered reverse osmosis (RO), offer a promising alternative to fossil-fuel-powered systems. This paper explores the development of a cost-effective, battery-free, small-scale RO solar desalination unit for brackish groundwater. This system can desalinate groundwater with salinity (TDS) up to 25,000 ppm, producing 1000 m3/day of potable water that meets WHO and Egyptian standards. Northwestern coastal regions, rich in solar resources, make photovoltaic (PV) power a compelling choice for desalination in resorts and new developments. To address the intermittent nature of solar power, the unit incorporates a single-axis tracking system, PV cleaning, and cooling features, boosting energy yield by 30–35%. However, small-scale PV–RO systems face challenges in maintaining continuous operation due to solar power variability, often requiring costly batteries. Avoiding batteries is a strategic choice, given their maintenance and cost issues, which could inflate expenses by 35%. The estimated cost of desalination using the PV–RO system without batteries ranges from EGP 15 to 17 per cubic meter (USD 0.55–0.63/m3), with a capital expenditure of approximately USD 850 per cubic meter of capacity. At this cost level, the PV–RO system remains a viable solution to provide potable water to resource-scarce areas in the northwestern coastal region, comparable to the cost of transferring water from nearby surface sources. However, managing inland brine water discharge remains a significant challenge. Innovative solutions must be explored to minimize environmental impacts and derive greater economic value from this discharge. In summary, solar-powered RO desalination offers an environmentally friendly and cost-effective approach to address water scarcity in arid regions, with potential for further improvements in sustainability and efficiency.

Author Contributions

Conceptualization, M.A.D. and G.R.S.; methodology, M.A.D.; software, G.R.S. and M.A.A.; validation, M.A.D., G.R.S., and M.A.A.; formal analysis, G.R.S.; investigation, G.R.S. and M.A.D.; resources, G.R.S. and M.A.D.; data curation, G.R.S., M.A.D., and M.A.A. writing—original draft preparation, G.R.S. and M.A.D.; writing—review and editing, M.A.A. and M.E.; visualization, G.R.S. and M.A.A.; supervision, M.A.A. and M.E.; project administration, M.A.D. and G.R.S. All authors have read and agreed to the published version of the manuscript.

Funding

This research received no external funding.

Institutional Review Board Statement

The study did not require ethical approval.

Informed Consent Statement

The study did not involve humans.

Data Availability Statement

The data presented in this study are available on request from the corresponding author.

Conflicts of Interest

The authors declare no conflicts of interest.

References

  1. Abdel-Shafy, H.; Mansour, M. Overview on Water Reuse in Egypt: Present and Future: Use of treated wastewater is oftremendous potential importance to Egypt, particularly for restricted irrigation and forest trees. Sustainable Sanitation Practice. 2013, pp. 17–25. Available online: http://www.ecosan.at/ssp/selected-contributions-from-the-1st-waterbiotech-conference-9-11-oct-2012-cairo-egypt/SSP-14_Jan2013_17-25.pdf (accessed on 25 November 2023).
  2. Dawoud, M. Egypt’s Non-Conventional Water Resources: Desalination Sector Analysis and Proposed Development; African Development Bank Report; African Development Bank: Cairo, Egypt, 2019; p. 97. [Google Scholar]
  3. Ministry of Water Resources and Irrigation (MWRI). Egyptian National Water Resources Plan; Ministry of Water Resources and Irrigation: Cairo, Egypt, 2023; p. 125.
  4. El-Rawy, M.; Mostafa, A.A.; Hashe, D.; Eltarabily, M.G. Groundwater management of quaternary aquifer of the Nile Valley under different recharge and discharge scenarios: A case study Assiut governorate, Egypt. Ain Shams Eng. J. 2021, 12, 2563–2574. [Google Scholar] [CrossRef]
  5. Central Agency for Public Mobilization and Statistics. Egypt Future Population Projections (2017–2052); Central Agency for Public Mobilization and Statistics: Cairo, Egypt, 2017.
  6. Abd El-Hady, B.; Kashyout, A.H.; Gasser, H.; Hassan El-Banna, F.; Abd El-Wahab, K.; Hisham, E.; Ranjan, V.; Mohammad, H.S. Hybrid renewable energy/hybrid desalination potentials for remote areas: Selected cases studied in Egypt. RSC Adv. 2021, 11, 13201–13219. [Google Scholar]
  7. Dawoud, M.; Alaswad, S.O.; Ewea Hatem, A.; Dawoud, R.M. Towards sustainable desalination industry in Arab region: Challenges and opportunities. Desalination Water Treat. 2020, 193, 1–10. [Google Scholar] [CrossRef]
  8. El-Sadek, A. An imperative measure for water security in Egypt. Desalination 2010, 250, 876–884. [Google Scholar] [CrossRef]
  9. de Doile, G.N.D.; Rotella, P., Jr.; Rocha, L.C.S.; Bolis, I.; Janda, K.; Coelho, L.M., Jr. Hybrid Wind and Solar Photovoltaic Generation with Energy Storage Systems: A Systematic Literature Review and Contributions to Technical and Economic Regulations. Energies 2021, 14, 6521. [Google Scholar] [CrossRef]
  10. Al-Sarihi, A.; Mansouri, N. Renewable energy development in the gulf cooperation council countries: Status, barriers, and policy options. Energies 2022, 15, 1923. [Google Scholar] [CrossRef]
  11. Onishi, V.C.; Khoshgoftar, M.H.; Salcedo-Díaz, R.; Ruiz-Femenia, R.; Labarta, J.A.; Caballero, J.A. Thermo-economic and environmental optimization of a solar-driven zero-liquid discharge system for shale gas wastewater desalination. Desalination 2021, 511, 115098. [Google Scholar] [CrossRef]
  12. Meng, Y.; Tang, D.; Xu, H.; Li, Y.; Gao, L. Coalbed methane produced water in China: Status and environmental issues. Environ. Sci. Pollut. Res. 2014, 21, 6964–6974. [Google Scholar] [CrossRef] [PubMed]
  13. Goosen, M.; Mahmoudi, H.; Alyousef, Y.; Ghaffour, N. Solar desalination: A review of recent developments in environmental, regulatory and economic issues. Sol. Compass 2023, 5, 100034. [Google Scholar] [CrossRef]
  14. Ibrahim, S.M.A.; Shabak, A.G.M. Design of a Solar Powered Reverse Osmosis System in Egypt. J. Mech. Energy Eng. 2021, 5, 125–140. [Google Scholar] [CrossRef]
  15. Abo Zaid, D.E. Economic analysis of a stand-alone reverse osmosis desalination unit powered by photovoltaic for possible application in the northwest coast of Egypt. Desalination Water Treat. 2014, 54, 3211–3217. [Google Scholar] [CrossRef]
  16. Eltawil, M.A.; Zhao, Z.; Yuan, L. A review of renewable energy technologies integrated with desalination systems. Renew. Sustain. Energy Rev. 2009, 13, 2245–2262. [Google Scholar] [CrossRef]
  17. Moharram, N.A.; Tarek, A.; Gaber, M.; Bayoumi, S. Brief review on Egypt’s renewable energy current status and future vision. Energy Rep. 2022, 8, 165–172. [Google Scholar] [CrossRef]
  18. Gebaly, A.M.; Nashwan, M.S.; Khadr, W.M.; Shahid, S. Future changes in wind energy resources in Egypt under Paris climate agreements’ goals. Reg. Environ. Chang. 2023, 23, 63. [Google Scholar] [CrossRef]
  19. Abou-Ali, H.; Elayouty, A.; Mohieldin, M. Chapter 3|Climate Action in Egypt: Challenges and Opportunities in Keys to Climate Action; Working Paper No. (180.3); Center for Sustainable Development Columbia University: New York, NY, USA, 2023; pp. 1–28. [Google Scholar]
  20. Elkholy, M. Assessment of Water Resources in Egypt: Current Status and Future Plan. In Groundwater in Egypt’s Deserts; Elkhouly, A.N.A., Ed.; Springer: Berlin/Heidelberg, Germany, 2021; pp. 395–425. [Google Scholar]
  21. Sallam, F.T.; Sadek, M.A.; Rayan, R.A.; El-Shahat, M.F. Sources of Salinity and Suitability for Irrigation and Drinking Use of the Groundwater of Northwest of ElMinia, Upper Egypt. Egypt. J. Chem. 2020, 63, 4063–4074. [Google Scholar] [CrossRef]
  22. Khatib, T.; Mohamed, A.; Sopian, K.; Mahmoud, M. A New Approach for Optimal Sizing of Standalone Photovoltaic Systems. Int. J. Photoenergy 2012, 2012, 391213. [Google Scholar] [CrossRef]
  23. Nghiem, L.D.; Schäfer, A.I. Critical risk points of nanofiltration and reverse osmosis processes in water recycling applications. Desalination 2006, 187, 303–312. [Google Scholar] [CrossRef]
  24. Simon, T.W.; Price, W.E.; Nghiem, L.D. Sodium hydroxide production from sodium carbonate and bicarbonate solutions using membrane electrolysis: A feasibility study. Sep. Purif. Technol. 2014, 127, 70–76. [Google Scholar] [CrossRef]
  25. Melián-Martel, N.; Sadhwani, J.J.; Ovidio Pérez Báez, S. Saline waste disposal reuse for desalination plants for the chloralkali industry: The particular case of pozo izquierdo SWRO desalination plant. Desalination 2011, 281, 35–41. [Google Scholar] [CrossRef]
  26. Elsaie, Y.; Ismail, S.; Soussa, H.; Gado, M.; Balah, A. Water desalination in Egypt; literature review and assessment. Ain Shams Eng. J. 2023, 14, 101998. [Google Scholar] [CrossRef]
Figure 1. Annual renewable water resources per capita in cubic meters (1955–2050). Source: Dawoud, 2019 [2].
Sustainability 16 01630 g001
Figure 3. Flowchart of the GIS decision-making tool development for site selection.
Sustainability 16 01630 g003
Figure 4. The spatial distribution of solar radiation across Egypt.
Sustainability 16 01630 g004
Figure 5. Distribution of wind speed at 24.5 m above ground level in Egypt.
Sustainability 16 01630 g005
Figure 6. Average annual temperature (°C) in Egypt.
Sustainability 16 01630 g006
Figure 7. The depth to groundwater levels in Egypt.
Sustainability 16 01630 g007
Figure 8. Groundwater quality (salinity) classification in Egypt.
Sustainability 16 01630 g008
Figure 9. Solar-powered desalination plant location map at El Alamein.
Sustainability 16 01630 g009
Figure 10. Typical design scheme of the solar-powered RO desalination pilot plant.
Sustainability 16 01630 g010
Figure 11. Schematic diagram for the design of the solar-powered RO desalination plant.
Sustainability 16 01630 g011
Figure 12. The constructed solar-powered RO desalination pilot plant in El Alamein area.
Sustainability 16 01630 g012
Figure 13. The feed water (brackish groundwater) flow during the study period.
Sustainability 16 01630 g013
Figure 14. The feed water quality (salinity) during the study period.
Sustainability 16 01630 g014
Figure 15. Relation between feed water temperature, productivity, and salt rejection.
Sustainability 16 01630 g015
Figure 16. The permeate flow during the study period.
Sustainability 16 01630 g016
Figure 17. The permeate salinity (TDS) in (mg/L) during the study period.
Sustainability 16 01630 g017
Figure 18. The system energy consumption during the study period.
Sustainability 16 01630 g018
Figure 19. The system recovery ratio (%) during the study period.
Sustainability 16 01630 g019
Table 1. Egyptian water supply and demand (2021).
CategoryWater ResourceWater Resources (BCM)—2022Water Resources (BCM)—2030
Renewable water resourcesNile water55.5055.50
Renewable groundwater3.406.80
Rain-fed harvesting1.051.10
Virtual waterEstimated virtual water34.0041
Non-conventional waterNon-renewable groundwater2.653.20
Agriculture drainage reuse9.709.70
Reuse of treated Wastewater4.905.30
Desalinated water0.250.46
Water resources114.45123.06
Water demand131.65158.16
Water resources deficit20.235.1
Source: MWRI, 2023 [3].
Table 3. Chemical analysis for the brackish groundwater.
ParameterMeasuring UnitValue
Salinity (TSD)mg/L21,250
pH-7.7
Temperature°C24.5
Namg/L7180
Kmg/L314
Mgmg/L547
Camg/L340
Clmg/L11,786
HCO3mg/L543
SO4mg/L378
NO3mg/L28
Femg/L6
Mnmg/L4
Table 4. The technical design specifications of the PV–RO desalination pilot project.
ParameterMeasurement UnitValue
Feed water-Brackish groundwater using well with a depth of 120 m from the ground level
Feed water salinitymg/L21,250
Salt rejection%99.75
Recovery ratio%60
Product flow ratem3/day1000
Produced permeate water salinitymg/L250
Table 5. System Capex cost.
NoItemCost
EGPUSD
1Two groundwater wells including the PV solar system for power supply 3,490,000241,500
2RO desalination plant and the PV solar system12,100,000650,540
3Brine water discharge bond730,00039,250
Total16,320,000931,290
Table 6. Summary of the RO brine discharge options for inland desalination plant.
TechnologyMaturityTechnical AspectsEconomic Aspects
Evaporation pondsIndustrial scaleGroundwater contamination could be risk if the ponds are not designed properly.Land footprint is high due to the large area requirements.
Multistage ROIndustrial scale
  • Leading technology.
  • The limitation of Rw stems from the risk of scaling and the practical constraints in delivering the necessary osmotic pressure.
A cost-effective solution encompasses energy efficiency, capital expenditures (Capex), and operating expenses (Opex).
Evaporators and crystallizersIndustrial scaleThe constraint on Rw in evaporators is scaling. Further research is needed to devise systems capable of recovering residual heat or steam effectively.
  • Required to install ZLD system for brine treatment, which is costly.
  • High Capex and Opex.
ZLDIndustrial scale for non-municipal applications
  • Interstage system.
  • Minimizes risk of salt precipitation.
Low Capex relative to the brine concentration system.
Disclaimer/Publisher’s Note: The statements, opinions and data contained in all publications are solely those of the individual author(s) and contributor(s) and not of MDPI and/or the editor(s). MDPI and/or the editor(s) disclaim responsibility for any injury to people or property resulting from any ideas, methods, instructions or products referred to in the content.

