Abstract
Here, the authors focused on determining the increase in consumers’ preferences for sustainable products, including that of OEMs, who are responsible for the drop in new product sales. We also assessed the effects of remanufacturing by outsourcing to third-party remanufacturers. However, the outsourcing of remanufacturing not only enables the producer to offer a remanufactured product at the same time as manufacturing new units; it also provides OEMs with the flexibility required to peruse eco-design in manufacturing and/or remanufacturing. For instance, Gree and Midea have heavily invested in eco-design to reduce energy costs in manufacturing, while Xerox has adopted a modular design approach to divert materials away from landfills and towards remanufacturing. Following observations of real-world applications, the authors developed two theoretical models in which remanufacturing can be outsourced to an independent remanufacturer, endowing the OEM with the flexibility required to enact eco-design in manufacturing or remanufacturing. This analysis reveals that OEMs tend to put more effort into eco-design in manufacturing than in remanufacturing. Furthermore, such efforts in the name of eco-design may be beneficial for both the OEM and the third-party remanufacturer. As such, this paper encourages governments to provide more incentives that will encourage OEMs to invest in eco-design in manufacturing and establish a possible “win–win” scenario in terms of both environmental and economic performances.
1. Introduction
Environmental problems arise from conflicts between nature and humans [1]. For instance, electrical and electronic equipment (EEE), such as mobile phones, computers, televisions, and refrigerators, are essential to our daily lives, but the increasing consumption of EEE has led to a high rate of wastage. In the EU, the amount of WEEE grew from 7.6 million tons in 2012 to 12.4 million tons in 2021 [2]. Similarly, the annual growth rate of WEEE in the Chinese market is about 13–15% [3]. The related environmental problems continue to impact global ways of life and ecosystems.
In confronting the environmental problems that have arisen from conflicts between nature and humans, more and more individuals are engaging in sustainable behaviors [4]. Consumers often express positive attitudes towards sustainable options, viewing them as a mode of consumption requiring fewer physical resources [5]. In one recent survey, about 75% of the respondents (25% totally agree and 50% tend to agree) stated they are prepared to buy eco-friendly products even if they are more expensive than “normal” products [6]. Obviously, the reasons for purchasing greener products must outweigh the convenience of consuming less-sustainable, cheaper products for the individual, and this consideration necessitates a deeper understanding of the environmental problems as well as a commitment to the use of renewable energy [1,7].
Recognizing the increase in consumers’ preferences for sustainable products, increasing numbers of original equipment manufacturers (OEMs) have developed business models in which remanufacturing is an integral part [8,9]. The remanufacturing business is profitable for OEMs because it can reduce manufacturing costs by 40–60% [8]. Furthermore, a strategy focused on remanufacturing is also compliant with the recent governmental policy seeking to “extend producer responsibility” on the part of OEMs as regards their products which are no longer wanted by consumers [2].
Considering the possible benefits of remanufacturing, even those OEMs concerned with the potential detrimental effects on new products’ sales have also engaged in remanufacturing by outsourcing this process to third-party remanufacturers [10,11]. For instance, in the US and Europe, many OEMs, including Land Rover and IBM, only focus on new product manufacturing, and they outsource their remanufacturing operations to third-party remanufacturers such as Caterpillar and Foxconn [12]. In the US remanufacturing industry, third-party remanufacturers provide more than 70% of remanufactured heavy-duty and off-road equipment, providing about 87,000 full-time jobs [13]. The approach of outsourcing remanufacturing has gained momentum in recent years [12,14].
Interestingly, the outsourcing of remanufacturing not only enables a company to offer remanufactured products alongside manufacturing new units; it also raises questions with regard to the eco-design of a closed-loop supply chain [15,16]. In practice, most OEMs take one of two tracks in establishing eco-design, with the first emphasizing the integration of eco-design into manufacturing. For example, Gree and Midea, two air conditioning giants in China, have allocated huge amounts of money to establishing eco-designs that reduce a building’s air conditioning requirements and thus reduce energy costs [17]. The approach to eco-design in manufacturing primarily focuses on the minimization of emissions and effluents and the use of virgin and nonrenewable energy resources [18,19]. Second, given that remanufacturing is an important process, many brand-name OEMs have focused on eco-design in remanufacturing. For instance, Xerox has adopted a modular design in the development of its printing equipment, allowing it to divert materials from landfills via the offer of remanufactured products [20].
Although numerous researchers have paid attention to eco-design in manufacturing in recent years (see Du et al. [17], Gao et al. [21], and Wang et al. [22]), they have tended to ignore possible eco-design strategies in remanufacturing. On the other hand, in spite of the fact that many studies, including those of Yalabik et al. [23], Wang et al. [24], and Ke et al. [25], have focused on optimal eco-design strategies in remanufacturing, these papers have ignored the possibilities of this approach in manufacturing. As such, the work in this paper complements previous studies by providing a deeper understanding of the eco-design of a closed-loop supply chain with outsourcing. In particular, this paper intends to focus on which of the two modes (eco-design in manufacturing and/or remanufacturing) is the best choice.
More specifically, in order to understand the importance of eco-design for a closed-loop supply chain involving outsourcing, the authors develop two theoretical models under which the OEM would produce new products but outsource the remanufacturing process to an independent remanufacturer. Note that here the outsourcing of remanufacturing endows the OEM with the flexibility required to develop an eco-design for manufacturing (such as in the case of the OEMs Gree and Midea) and/or remanufacturing (Xerox). Via these two models, this paper intends to address the following research questions:
In relation to the increase in consumers’ preferences for sustainable products, how can the OEM make the best choices?
From an environmental perspective, how do different eco-design modes affect sustainability?
From an economic perspective, how do different eco-design modes affect both parties’ profitability?
The analysis shows that OEMs should always put more effort into developing an eco-design for manufacturing than for remanufacturing. Furthermore, such a focus on eco-design would be beneficial for both the OEM and the third-party remanufacturer. As such, to induce a “win–win” scenario from both environmental and economic perspectives, the authors encourage governments and environmental agencies, in addition to focusing on eco-design in remanufacturing, to provide more incentives that will encourage OEMs to invest in eco-design in manufacturing.
The remainder of the paper is organized as follows. Section 2 contains the literature review, Section 3 outlines the methods of model formulation and equilibrium solutions, Section 4 depicts the main results derived through theoretical and numerical analyses, and Section 5 concludes the paper by discussing the main results and offering several possible directions for future research.
2. Literature Review
This paper mainly draws on the following three research areas: (i) eco-design in manufacturing; (ii) eco-design in remanufacturing; and (iii) the strategic choice between eco-design in remanufacturing and in manufacturing. Table 1 gives a quick comparison of approaches taken in the contemporary literature.

Table 1.
Comparison with the current body of literature.
The body of literature on eco-design in manufacturing has been growing rapidly in recent years. For example, Zhu and He [26] investigated the issues related to green product design in supply chains in the context of competition and found that competition in product greenness reduces equilibrium greenness. Then, Hong and Guo [27] studied several cooperative contracts within a green product supply chain and showed that cooperation among partners can ground environmental improvements throughout the whole supply chain. Subsequently, Ko [28] developed a novel green design method based on extension theory, providing designers with a decomposing–recomposing approach for transforming general products into green products. Meanwhile, Du et al. [17] studied the race for green product design between two OEMs and showed that the ratio of the depressant effect of green design on a rival’s demand to its stimulating effect on the company’s own demand is very important. Wang et al. [22] employed a generalized method of moments model to analyze Chinese efficient resource markets from 2011 to 2020 and, accordingly, emphasized the beneficial effects of innovations in resource efficiency on both economic growth and environmental sustainability. Gao et al. [21] undertook a comprehensive discussion of the life cycles of metal parts fabricated through manufacturing. As mentioned earlier, these studies mainly focus on eco-design in manufacturing. This paper thus seeks to complement them by addressing eco-design in remanufacturing, and to develop an understanding of which of these two modes (eco-design in manufacturing and/or remanufacturing) is the better choice.
There are also many studies that focus on eco-design in remanufacturing. In particular, Yalabik et al. [23] developed an integrated deteriorating inventory model with a focus on the lifecycle value of green components and their remanufacturing. Gu et al. [29] studied quality design and the environmental consequences of green consumerism in a remanufacturing context. Dey et al. [30] optimized production plans in relation to investments in green technology and automated inspection in an assembled product manufacturing–remanufacturing system. Wang et al. [24] focused on stylized models relevant to a monopoly OEM and constructed four legislative scenarios through which they could analyze fundamental conflicts of interest in remanufacturing and product design. Ke et al. [25] proposed an integrated design for a remanufacturing scheme with a special consideration of carbon emissions. Collectively, these papers have ignored the possibilities of eco-design in manufacturing; as such, this paper complements them by addressing this issue, as well as addressing which of these two modes (eco-design in manufacturing and/or remanufacturing) is the better choice.
Finally, this paper is specifically related to the work of Pazoki and Samarghandi [16], who assessed whether take-back regulations would encourage eco-design in manufacturing or remanufacturing. However, this paper differs in several important ways: first, in addition to eco-design in manufacturing, this paper also highlights possible eco-design strategies in remanufacturing; second, in its approach to eco-design in manufacturing, this paper is unique in that it allows the OEM the flexibility required to engage in remanufacturing by outsourcing it to a third-party remanufacturer; third, similarly to Irving et al. [13] and Zou et al. [12], the paper places an emphasis on the strategic consequences resulting from the outsourcing of remanufacturing, which were overlooked by Pazoki and Samarghandi [16].
3. Methods
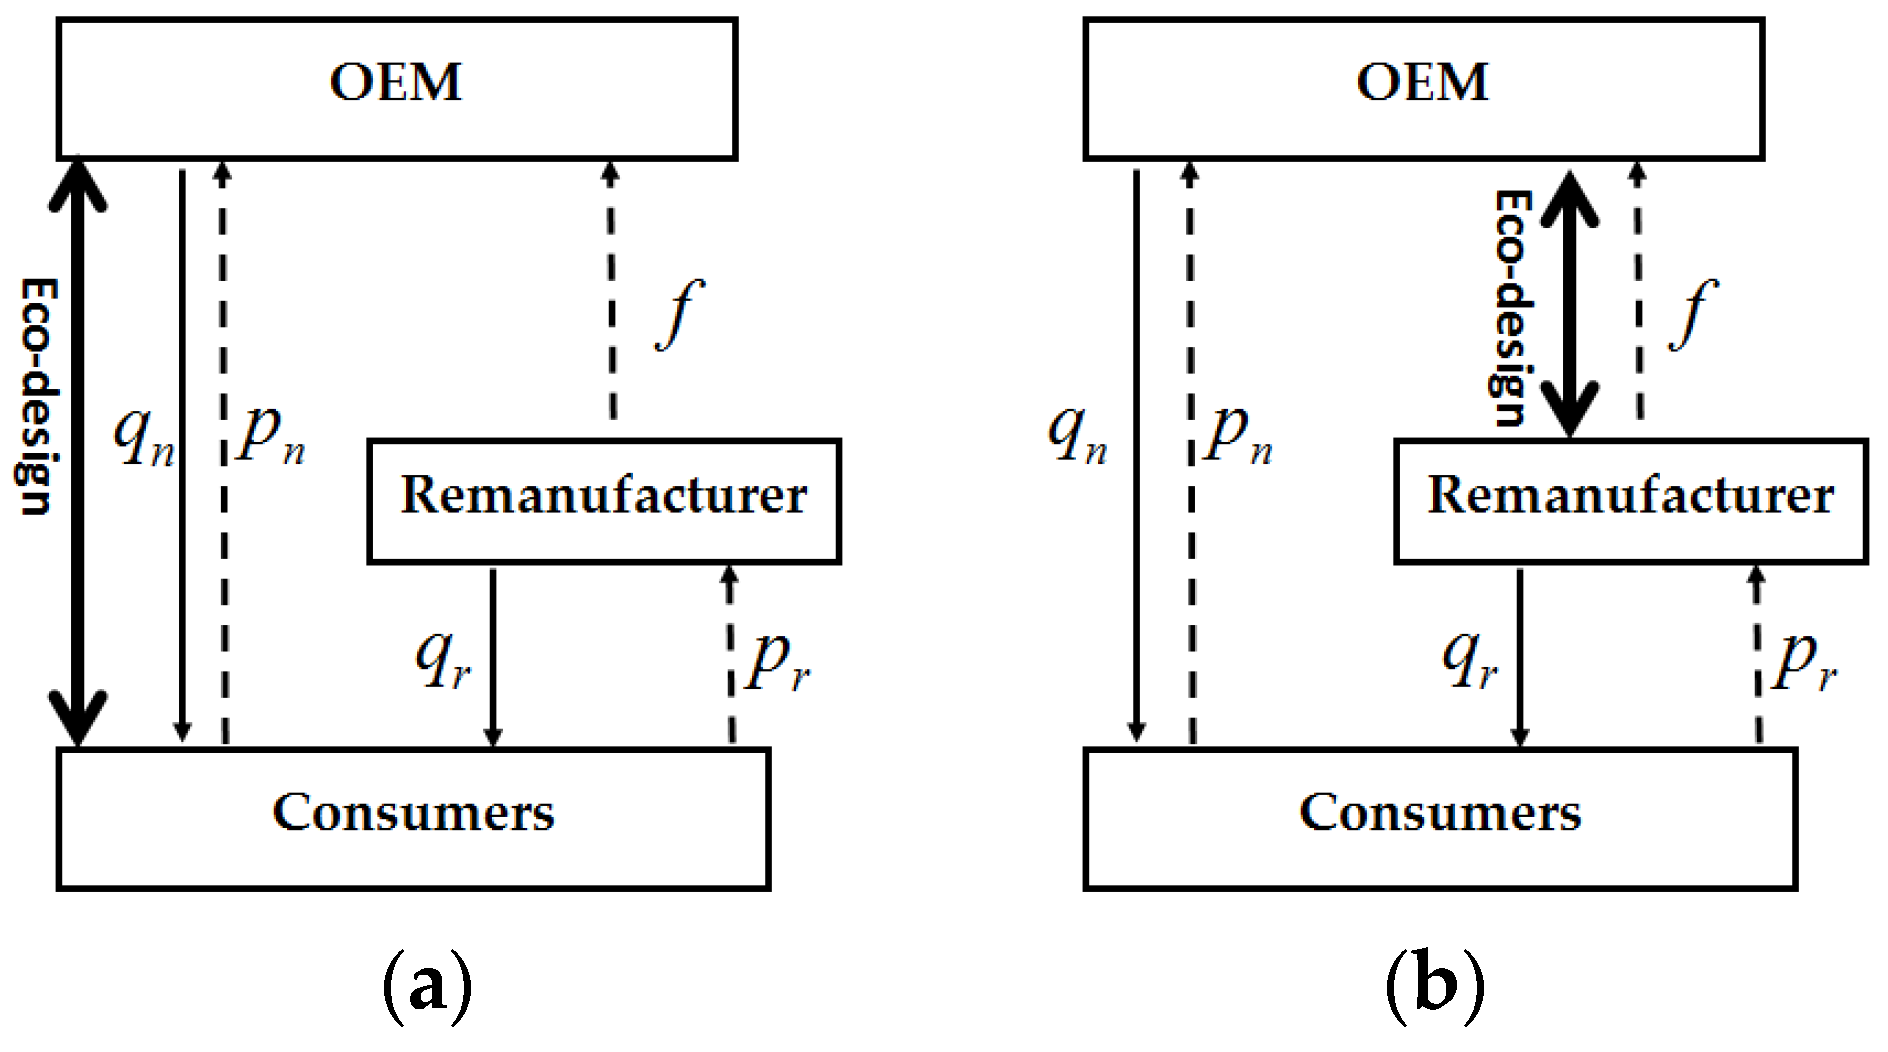
Inspired by the real-world circumstances of practice, this paper considers an OEM offering new products that it has manufactured itself but whose remanufacturing is outsourced to a third-party remanufacturer. As mentioned earlier, such an outsourcing strategy opens up two possible options for eco-design. As represented by Model M in Figure 1a, the OEM develops an eco-design for manufacturing that focuses on minimizing the use of virgin and nonrenewable energy resources in the new product manufacturing process. Model M is actually represented by the two Chinese air conditioning giants Gree and Midea, who direct huge amounts of money towards eco-design in an attempt to reduce a building’s air conditioning and thus reduce its energy costs. The second model, Model R, concerns an eco-design for remanufacturing that embeds remanufacturable parts (Figure 1b). Model R reflects the approach of Xerox, who have adopted a modular design for their printing equipment that allows them to divert materials away from landfills via remanufactured products.
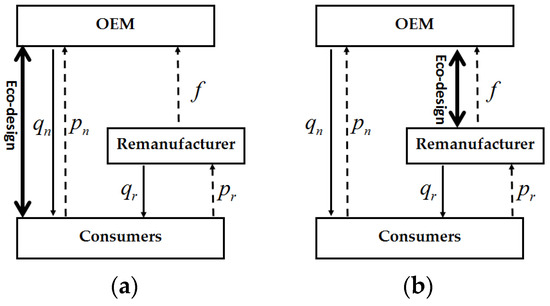
Figure 1.
Two options for the eco-design: (a) Model M; (b) Model R.
3.1. Model Formulation
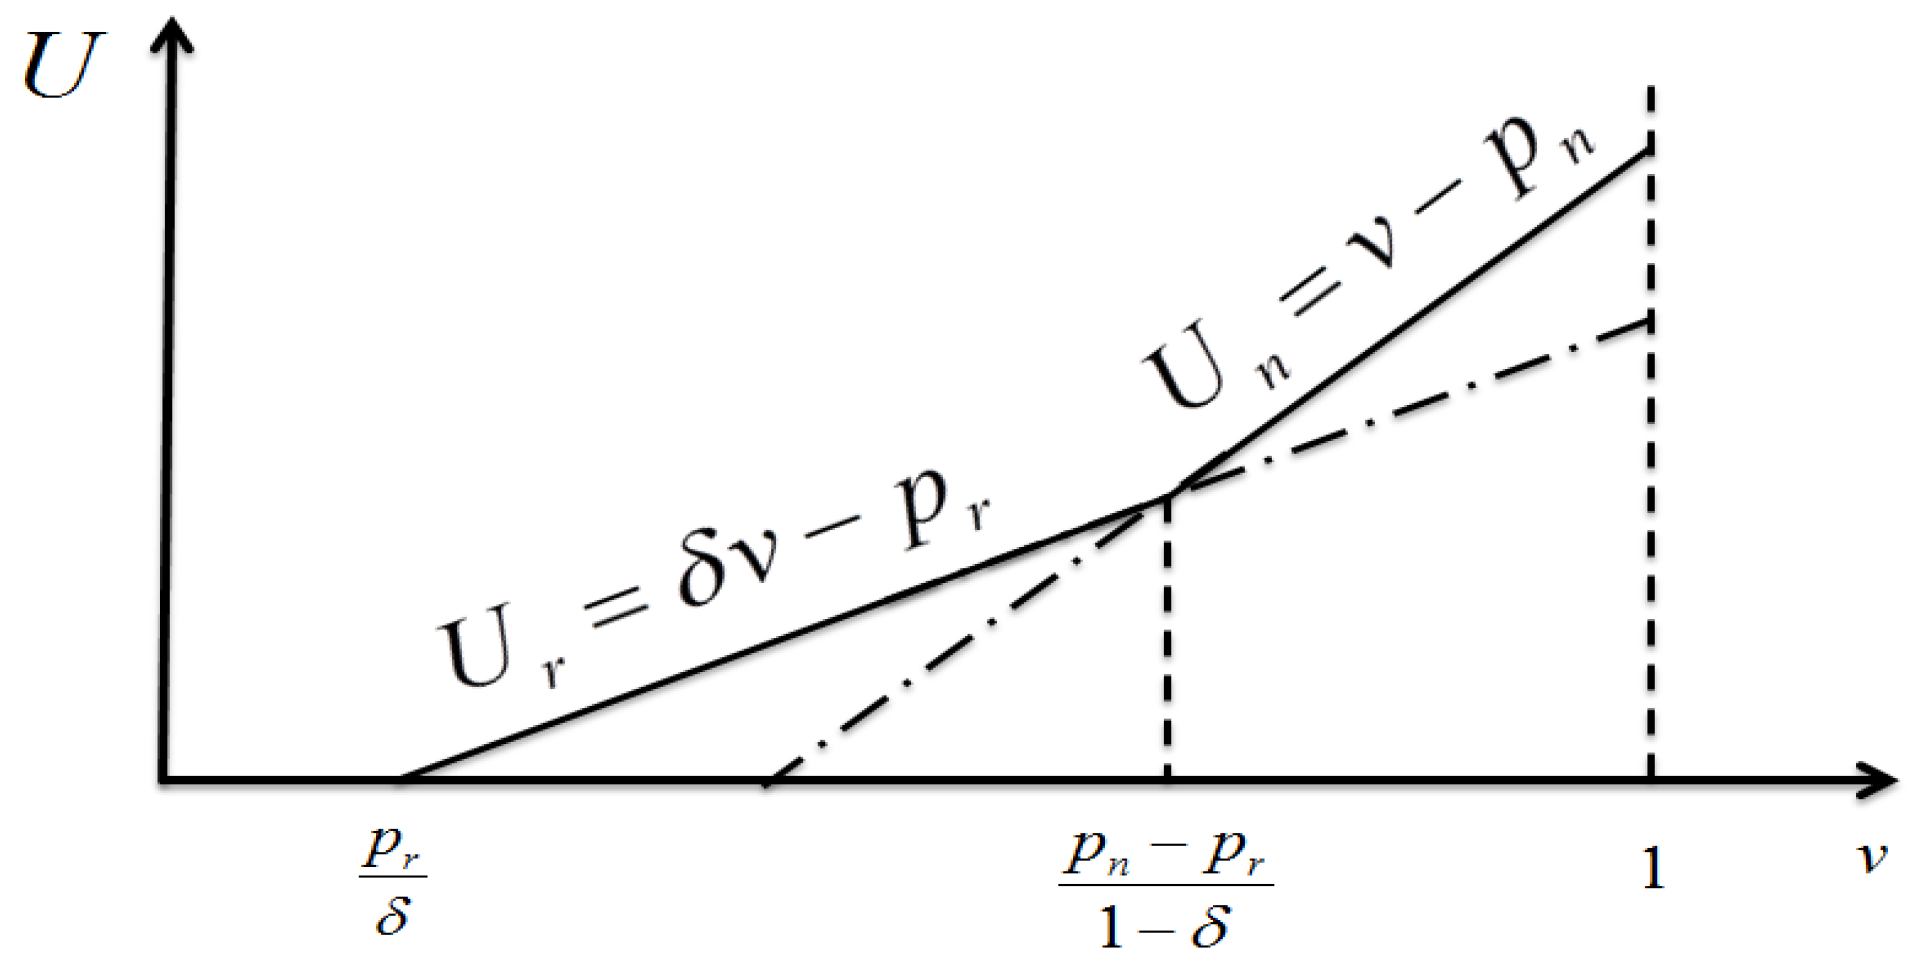
To differentiate new and remanufactured products, following the examples of Yan et al. [8] and Zhang et al. [14], this paper assume that a consumer’s willingness to pay for a remanufactured product will be lower than their willingness to pay for a new one; that is, the paper assumes that the value placed by the consumer on the remanufactured product is a fraction () of that placed on the new product, i.e., . As such, the utility functions for new and remanufactured products are and , respectively. The subscript denotes new and remanufactured products. Based on Figure 2, the consumers perception of utility can be divided into two components: when a consumer’s willingness to pay is , they would choose to purchase remanufactured units; however, when a consumer’s willingness to pay is , they would tend to prefer to purchase new ones.
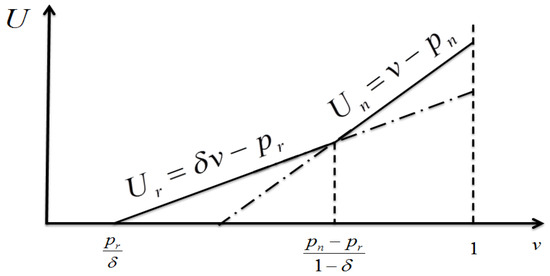
Figure 2.
Consumer valuations for both products.
Accordingly, the inverse demand functions for new and remanufactured products can be derived as follows.
In assessing consumers’ preferences for more sustainable options, this paper assumes that consumers often have positive attitudes towards an OEM’s efforts at eco-design. Suppose that the OEM’s investment cost function in association with eco-design is given by , where is the consumer’s sensitivity to the sustainability level. Such increasing convex cost functions are common to studies on investments (e.g., Shi et al. [31], Chai et al. [32], and Zhang et al. [33]); for simplification, the authors have here normalized the scaling parameter to 1.
Suppose that the marginal cost of manufacturing a new product is , while the marginal cost of remanufacturing is . Furthermore, the costs of remanufacturing are lower than those of manufacturing; that is, [24,25,27].
In these two models, all events transpire within a single period. All the relevant parameters in this paper are listed in the following Table 2.
Table 2.
The primary parameters used in this paper.
3.2. Eco-Design in Manufacturing (Model M)
The model proceeds as follows. First, the OEM sets an outsource fee of and sustainability levels of . Then, both the OEM and the third-party remanufacturer establish the profit-maximizing quantities of and .
Using backwards induction, the authors first solve the following problems.
The first term of in Equation (2) is the OEM’s profitability as derived from new-product manufacturing, while the second term is the revenue derived from remanufactured products, and the last term is the cost of investment for eco-design in manufacturing. All the profits of the third-party remanufacturer, i.e., , are obtained from the remanufacturing that was outsourced by the OEM.
In anticipating the optimal responses of and , the OEM’s problems concern choosing the optimal outsource fee, , for remanufacturing, and the efforts, , it applies to developing an eco-design for manufacturing, as follows.
Using backwards induction, the equilibrium outcomes have been devised and are listed in Table 3.
Table 3.
Equilibrium decisions and profits.
3.3. Eco-Design in Remanufacturing (Model R)
Under Model R, although the OEM still outsources its remanufacturing to a third-party remanufacturer, it also makes efforts towards developing an eco-design for remanufacturing by investing in remanufacturable parts. Then, the OEM and third-party remanufacturer’s optimization problems can be set out as follows.
Here, backwards induction is adopted again, first solving both parties’ problems in relation to and . Subsequently, we substituting these into (4) and maximize the OEM’s problems with and . All optimal outcomes are summarized in Table 3.
4. Analysis and Results
Based on the optimal outcomes shown in Table 3, the authors can now highlight the differences between the models and offer some guidance with regard to optimal decisions, profitability, and sustainability. Table 4 illustrates the connections for the main results.
Table 4.
Connections for the main results.
4.1. Therotical Analysis
In both models, the authors assume that all the remanufacturing processes are outsourced; as such, first, we highlight the differences between the optimal outsource fees set by the OEM in the following proposition (Its proof see Appendix A.1).
Proposition 1.
The OEM would charge a higher outsourcing fee under Model R than under Model M, i.e., .
It should be noted that under Model R, the OEM strives for an eco-design in remanufacturing via the embedding of remanufacturable parts. As such, the higher outsource fee set under Model R reflects the desire of the OEM that the revenue derived from outsourcing the remanufacturing be commensurate with the efforts exerted in eco-design. On the one hand, eco-design in remanufacturing is usually associated with an investment cost of ; hence, in order to derive the additional costs related to eco-design under Model R, the OEM will usually set a higher outsourcing fee. On the other hand, under both models, the OEM’s efforts towards eco-design always lead to an increase in consumers’ preferences for sustainable products. As such, the higher outsourcing fee set in Model R reflects the attempt of the OEM to obtain additional revenue from the price premium paid for the remanufactured product.
Given the higher outsourcing fee set by the OEM, one might expect a reduction in the number of remanufactured products. In fact, the opposite is true, in particular:
Proposition 2.
The optimal quantity of remanufactured (new) products under Model R is higher (lower) than that under Model M, i.e., ().
Proposition 2 suggests that even when considering the higher outsourcing fees charged by the OEM, third-party remanufacturers seek to provide more remanufactured products. Note that under Model R, rather than investing in eco-design in manufacturing, the OEM here works towards an eco-design in remanufacturing. This would lead to a relatively higher (lower) price for the remanufactured (new) products under Model R than under Model M. As such, given the relatively higher marginal revenue derived from remanufactured products under Model R, as Proposition 2 suggests, the third party would still seek to provide more units of remanufactured products under this model. On the other hand, as Proposition 1 has suggested, the OEM would set a higher outsourcing fee for remanufactured products under Model R. As such, to maximize profits, the third party will have to provide more units of remanufactured products. Furthermore, such a demand for higher quantities of remanufactured products can limit the potential market for new products. Thus, as Proposition 2 and its proof in Appendix A.2 have indicated, the greater the number of remanufactured products that are available on the market, the greater the detrimental effects on new products sales, resulting in lower quantities of new products.
Based on the proof in Appendix A.3, now the authors can address the question of how different eco-design modes affect sustainability as follows.
Proposition 3.
The optimal sustainability level under Model R is always lower than that under Model M, i.e., .
It should be noted that although eco-design in manufacturing or remanufacturing appease the preferences for sustainability shown by consumers, the characteristics of the competition are quite different. Specifically, if the OEM invests in eco-design in manufacturing, the consumer’s sustainability-related preference for the new products will increase. Then, in relation to the sustainability value of remanufactured products, eco-design in manufacturing would increase the perceived difference between new and remanufactured products. As such, the competition between products would decrease. However, if the OEM invests in eco-design in the context of remanufacturing, this will increase the consumer’s sustainability-related preference for the remanufactured product. As such, given sustainability of the new products, eco-design in the context of remanufacturing would reduce the difference between new and remanufactured products. As such, the competition between the products will become fiercer.
In practice, increasing numbers of governments are now making efforts to encourage OEMs to engage in eco-design in remanufacturing. For example, the governments of the USA, the EU, China, and Japan have made concerted attempts to promote investments in eco-design in remanufacturing in the context of waste electrical and electronic equipment (WEEE). However, Proposition 3 suggests that OEMs will always put more effort into eco-design in manufacturing than in remanufacturing. In particular, we have found that the optimal sustainability level under Model R is always lower than that under Model M. Furthermore, as the cost of remanufacturing increases, the optimal sustainability level under Model R (M) decreases (increases). Thus, the authors conclude that as the remanufacturing costs increase, the difference between the optimal sustainability levels achievable under Model M and Model R increases. As such, from an environmental perspective, the paper encourages governments and environmental agencies, in addition to focusing on eco-design in remanufacturing, to provide more incentives that will encourage OEMs to invest in eco-design in manufacturing. This emphasis on eco-design in remanufacturing may represent a more powerful tool for securing environmental sustainability in products via higher remanufacturing costs. Thus far, this paper has discussed the differences in optimal decisions and sustainability between Model R and Model M. The analysis now finally focuses on the question of how different eco-design modes affect each party’s profitability (the proof see Appendix A.4), as follows.
Proposition 4.
(i) When the value of the discount for remanufactured products is more pronounced, , the OEM will prefer Model M; otherwise, it will choose model R for but Model M for . (ii) Third-party remanufacturers always prefer Model M to Model R.
If the value of the discount associated with remanufactured products is more pronounced, , the detrimental effects associated with remanufactured products will be higher. In this context, the optimal choice for the OEM will be to pursue eco-design in manufacturing, because this will increase the consumer’s sustainability-related preference for new products; that is, for , the OEM should prioritize eco-design in manufacturing and enhance consumer preference for the new product so as to limit the competition between products. However, when the discount offered by remanufactured products is not pronounced, , the detrimental effects associated with remanufactured products can be limited. Then, in the context of higher remanufacturing costs, i.e., , the optimal choice for the OEM will be to peruse eco-design in remanufacturing because this will increase the consumer’s sustainability-related preference for the remanufactured products. However, if the remanufacturing cost is low, i.e., , the limitation of any potential detrimental effects related to remanufacturing will remain the priority. Then, for and , the optimal choice for the OEM will be to pursue eco-design in manufacturing.
Recall that eco-design in manufacturing intensifies the difference between new and remanufactured products, while eco-design in remanufacturing makes the competition between both products fiercer. As such, if the OEM invests in eco-design in manufacturing, the competition between both parties will become relatively low (i.e., and in Proposition 2). Furthermore, under this scenario, the OEM would charge a lower outsourcing fee (i.e., in Proposition 1), which will also be beneficial to the third-party remanufacturer. As such, the third-party remanufacturer will always prefer Model M to model R, i.e., . In sum, Proposition 4 shows that even without the encouragement of the governments and environmental agencies, eco-design in manufacturing remains a potentially beneficial strategy for the OEM and the third-party remanufacturer.
4.2. Nurmerical Analysis
To gain a deeper understanding of the results, in this section, the authors provide the necessary numerical examples that will allow us to reanalyze all the propositions.
In reality, many strategic consumers value the discount offered by remanufactured products. Then, as shown by Zou et al. [12], Zhu and He [26], and Pazoki and Samarghandi [16], the value associated with the discount offered by the remanufactured product here is . First, the mass of consumers is normalized to 1. Then, to ensure that production remains a profitable business, we assign the cost of manufacturing a new product the value of .
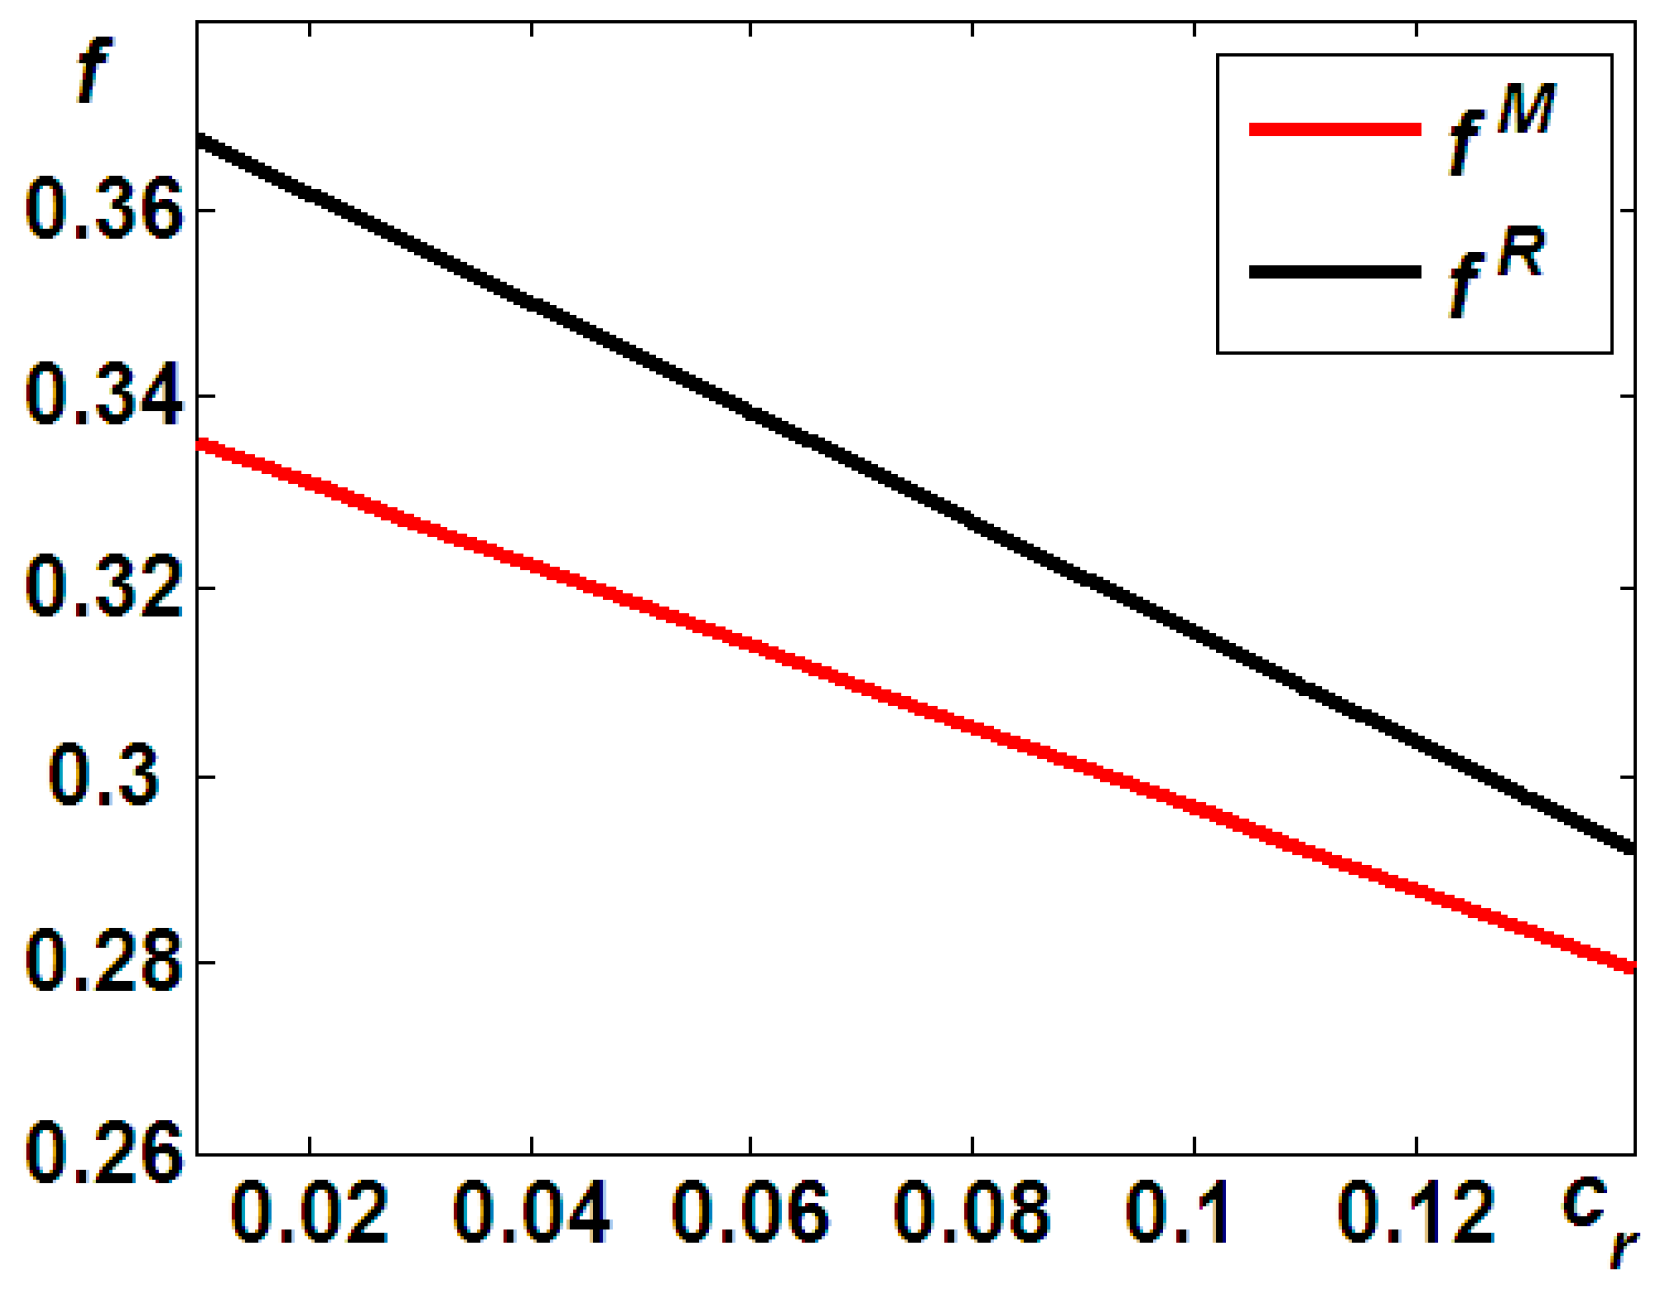
The paper first builds a numerical simulation to indicate the optimal outsourcing fee. From Figure 3, the authors can determine that the optimal outsourcing fee in Model R, , is always higher than that in Model M (). This is consistent with the result suggested by Proposition 1. Based on the variations between both lines, the authors can further conclude that as the remanufacturing cost increases, the OEM would likely reduce the outsourcing fees of and . This means that as the remanufacturing cost increases, the remanufacturer will struggle to access remanufacturing work. To secure the profitability of remanufacturing, the OEM would likely set lower outsourcing fees of and , respectively. Furthermore, as the remanufacturing cost increases, the rate of decrease in is clearly greater than that in . As such, the authors can conclude that the difference between and narrows as the remanufacturing costs drop.
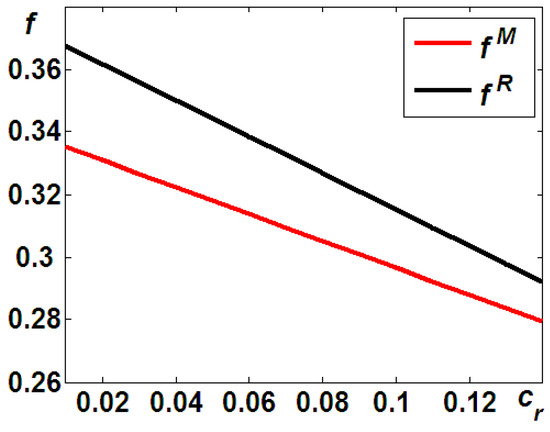
Figure 3.
Comparing and .
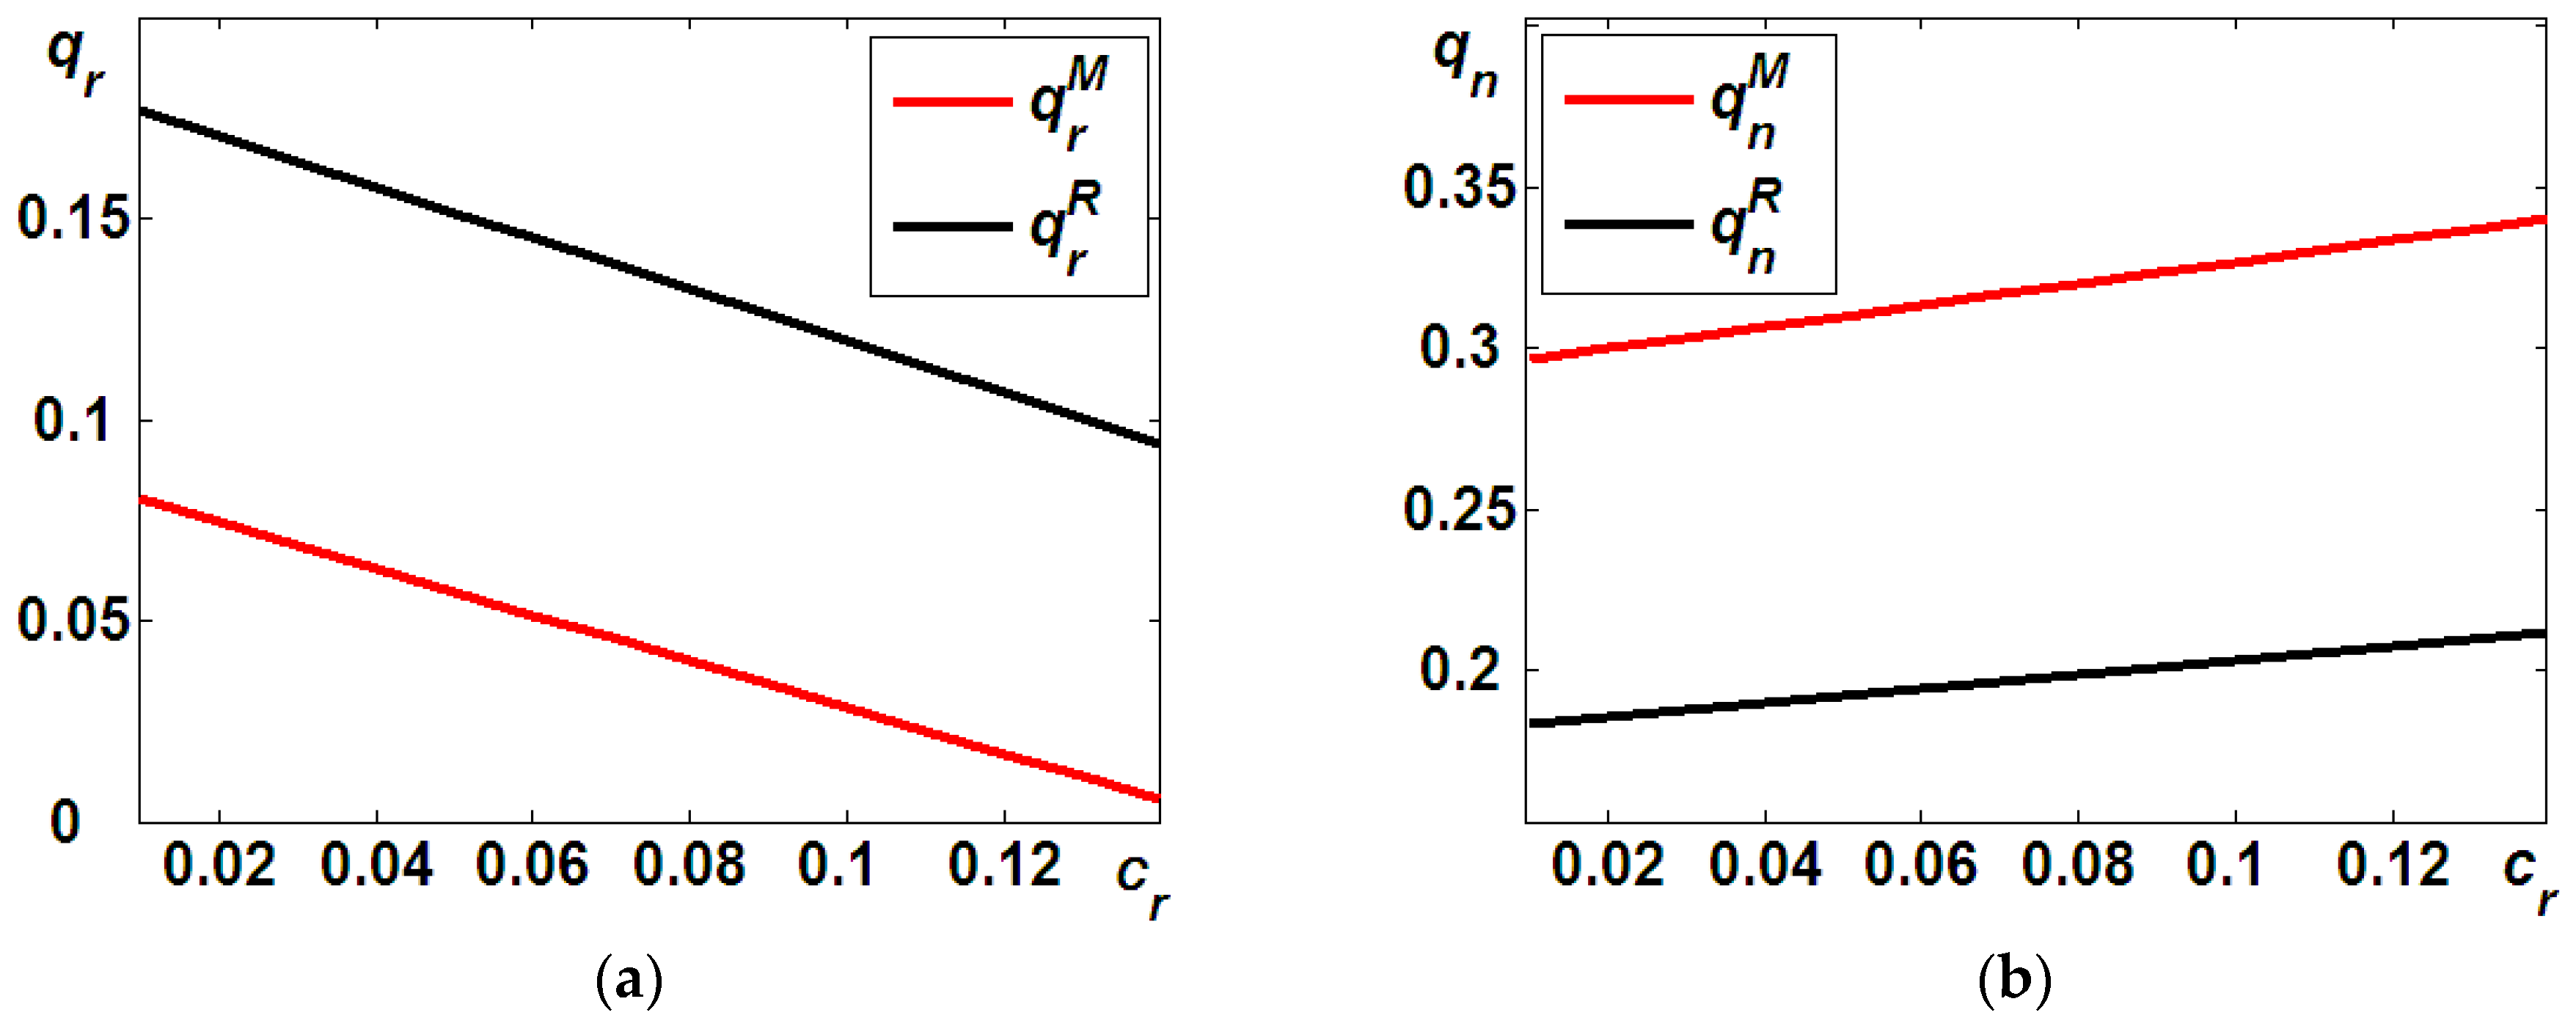
We are now in a position to highlight the differences between the optimal quantities of both products, as set out in Proposition 2. Figure 4a illustrates the outcomes of Proposition 2: even in the context of a higher outsourcing fee charged by the OEM, the third-party remanufacturer will likely seek to provide more remanufactured products; that is, . Moreover, as the remanufacturing costs increase, the remanufacturer will face more difficulty in accessing remanufacturing work. Accordingly, as shown in Figure 4a, as the remanufacturing costs increase, the quantities of both and decrease.
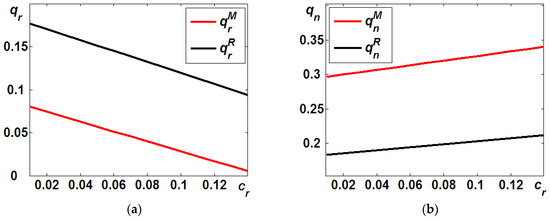
Figure 4.
Comparing the optimal quantities (a) Comparing and ; (b) Comparing and .
Figure 4b shows two main results. First, the optimal quantities of new products in Model R are lower than those in Model M, i.e., . This is consistent with the results shown in Proposition 2. Second, the more remanufactured products made available on the market, the stronger the detrimental effects on new products’ sales. Then, as affirmed by Figure 4b, the authors can further conclude that as the remanufacturing costs increase, the quantities of both and increase.
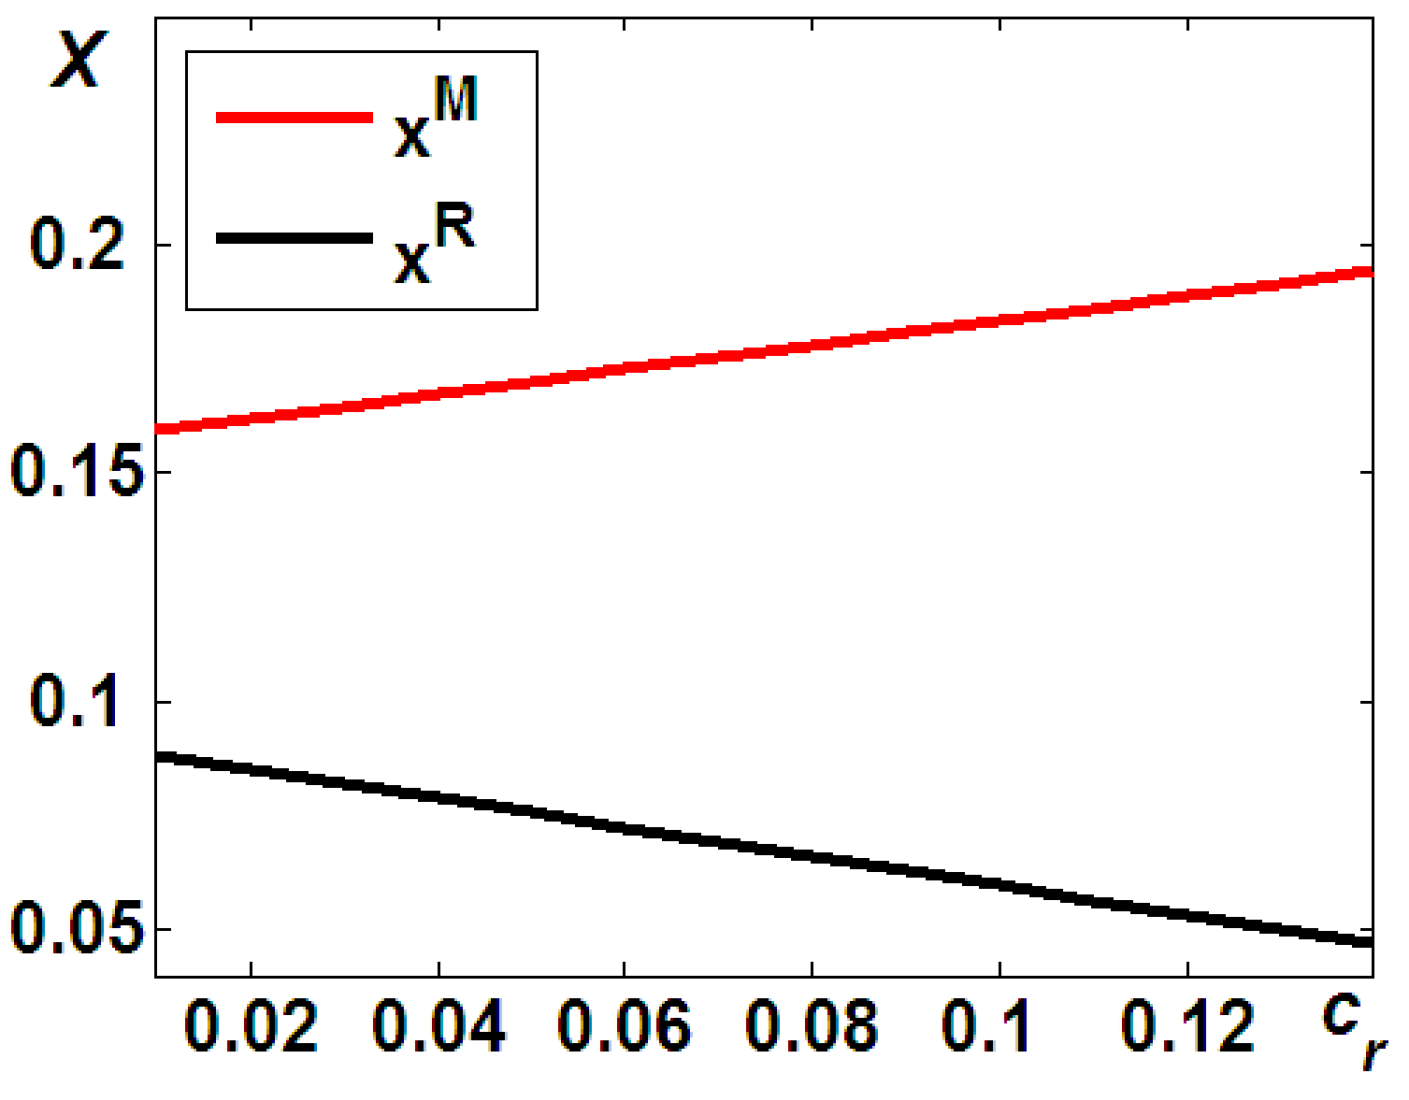
Proposition 3 stated that an OEM will always direct more effort towards eco-design in manufacturing than in remanufacturing. This is affirmed by Figure 5: for any given , the optimal sustainability level in Model R will always be lower than that in Model M; that is, . Furthermore, as the remanufacturing costs increase, the optimal sustainable level of () decreases (increases). As such, as the remanufacturing costs increase, the difference between the optimal sustainability levels in Model M and Model R will increase.

Figure 5.
Comparing and .
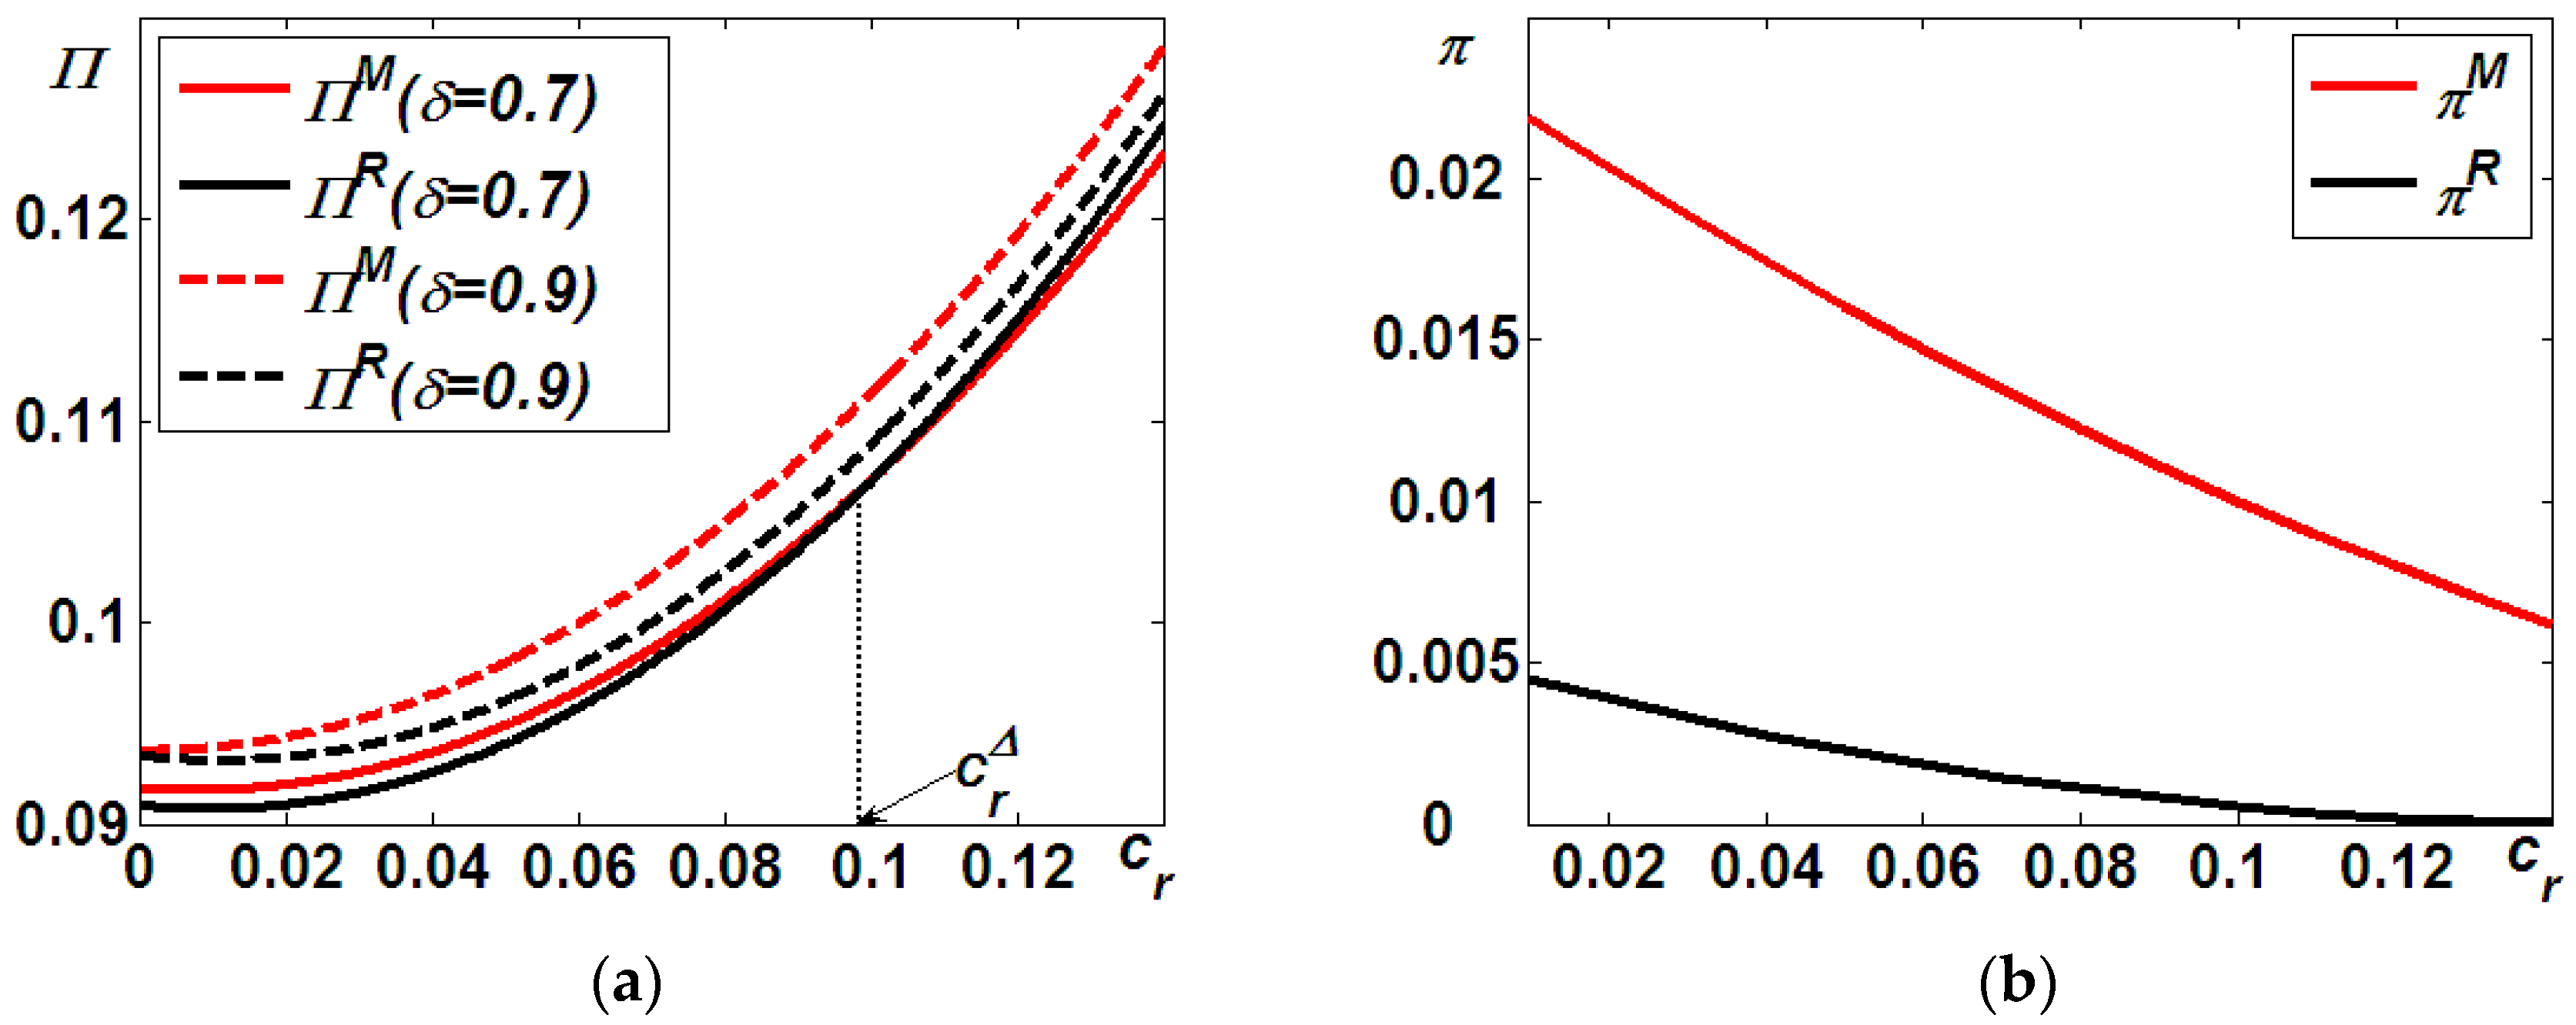
Proposition 4 (i) suggests that when the value of the discount provided by remanufactured products is more pronounced, , the OEM will prefer Model M; otherwise, it will choose Model R when but Model M when . The dashed lines in Figure 6a show that for any , the OEM’s profits under Model M, i.e., , will always be higher than under Model R, i.e., . However, as the solid lines show, if and , the OEM’s profits under Model M, i.e., , will always be lower than those under Model R, i.e., . However, if and , the OEM will prefer Model M to Model R for .
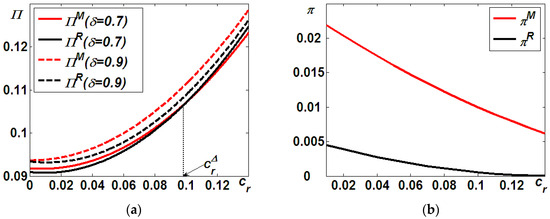
Figure 6.
Comparing the optimal profits (a) Comparing and ; (b) Comparing
and .
Consistent with Proposition 4 (ii), Figure 6b indicates that a third-party remanufacturer will always prefer Model M to model R; that is, . Furthermore, as the remanufacturing costs increase, the rate of decrease in will be higher than that for . The authors can thus conclude that the difference between and narrows with the drop in remanufacturing costs.
5. Conclusions
In recent years, as people has been confronting the environmental problems that have arisen from conflicts between nature and humans, increasing numbers of OEMs have made efforts towards developing eco-designs for environment sustainability. On the other hand, even given the potential detrimental effects on new products’ sales, these OEMs have also recognized that remanufacturing can help to divert materials away from landfills and create environmental sustainability. Further, the outsourcing of remanufacturing is a possible method of controlling the potential detrimental effects caused by remanufacturing.
Interestingly, the outsourcing of remanufacturing not only enables a company to offer remanufactured products alongside the manufacturing of new units; it also raises questions with respect to the eco-design of a closed-loop supply chain [15,16]. Outsourcing remanufacturing provides OEMs with the flexibility required to focus on eco-designs in manufacturing and/or remanufacturing. Based on the observation of actual circumstances, this paper has developed two theoretical models in an attempt to elucidate the possible eco-designs for a closed-loop supply chain with outsourcing. More specifically, the paper addresses the apparent research gap regarding eco-design in manufacturing and remanufacturing.
The paper makes the following contributions to the literature and for practitioners. On the one hand, although are numerous researchers have paid attention to eco-design in manufacturing (see, e.g., Du et al. [17], Gao et al. [21], and Wang et al. [22]) or in remanufacturing (see, e.g., Yalabik et al. [23], Wang et al. [24], and Ke et al. [25]), it is unclear which of the two modes (eco-design in manufacturing and/or remanufacturing) is the better choice. This has been the focus of our paper. On the other hand, our analysis reveals that the OEM would like to dedicate more efforts to eco-design in manufacturing than in remanufacturing. Furthermore, such greater efforts in eco-design may be beneficial for both the OEM and third-party remanufacturer. As such, the authors call for governments to provide more incentive to encourage OEMs invest in eco-design in manufacturing. Furthermore, such greater efforts in eco-design maybe be beneficial for both the OEM and the third-party remanufacturer.
Several possible directions for future researchers are available. First, in the context of an eco-design for a closed-loop supply chain with outsourcing, the authors assume that the OEM in question would remanufacture its used cores. However, in practice, regulations such as those related to WEEE set a bottom line for collection or remanufacturing. As such, future research might address the regulations set out by governments and environmental groups. Second, this paper only highlights possible options related to the outsourcing of remanufacturing. However, in practice, the authorization of remanufacturing is also a possible option for OEMs in developing countries [12]. Hence, future research should address eco-design in a closed-loop supply chain with authorization. Third, this paper has ignored competition among OEMs so including this parameter could expand the applicability of the results. Finally, it would be desirable for further research to substantiate the sustainable model of a closed supply chain with consumer education on the basis of outsourcing.
Author Contributions
Writing—original draft preparation, Q.Y.; writing—review and editing, methodology—calculating and software, L.S. All authors have read and agreed to the published version of the manuscript.
Funding
This research was funded by National Natural Science Foundation of China (71971043).
Data Availability Statement
No new data were created or analyzed in this study. Data sharing is not applicable to this article.
Conflicts of Interest
The authors declare no conflicts of interest.
Appendix A
To ensure all equilibrium outcomes are not negative, we need to include the constraint of and .
Appendix A.1. Proof for Proposition 1
Based on the outcomes shown in Table 1, we can infer the following.
In solving the above function, we find that there is a threshold of , below which is always true.
Comparing and , we find that . Then, we can conclude that for any , always holds.
Appendix A.2. Proof for Proposition 2
Based on the outcomes shown in Table 1, we can infer the following.
Solving the above function, we find that there is a threshold of , below which is always true.
Comparing and , we find that . Then, we can conclude that for any , always holds.
Based on the outcomes shown in Table 1, we can infer the following.
Solving the above function, we find the following.
- (1)
- If , there is a threshold of , above which is always true.
- (2)
- If , for any , the function is always true.
Comparing and , we find that if (), () is true. Then, we can conclude that for any , always holds.
Appendix A.3. Proof for Proposition 3
Based on the outcomes shown in Table 1, we can infer the following.
Solving the above function, we find that there is a threshold of , above which is always true.
Comparing and , we find that . Then, we can conclude that for any , always holds.
Appendix A.4. Proof for Proposition 4
Based on the outcomes shown in Table 1, we can infer the following.
Solving the above function, we find the following.
- (1)
- If , there is a threshold of , above which is always true.
- (2)
- If , there is a threshold of , below which is always true.
Comparing and , we find that if , is true. Then, we can conclude that for any , always holds.
Comparing and , , we find that if , is true. Then, we can conclude that for any , ; otherwise, .
Then, we can conclude that when the value of the discount for remanufactured products is more pronounced, , the OEM will prefer Model M; otherwise, it will choose Model R for but Model M for .
Based on the outcomes shown in Table 1, we can infer the following.
Solving the above function, we find the following.
- (1)
- If , there is a threshold of , above which is always true.
- (2)
- If , there is a threshold of , above which is always true.
Comparing and , we find that if , is true. Then, we can conclude that if , for any , always holds.
Comparing and , we find that if , is true. Then, we can conclude that if , for any , always holds.
Then, we can conclude that whether or , is always true; that is, the third-party remanufacturer always prefers Model M to Model R.
References
- Ahmad, F.; Saeed, Q.; Shah, S.M.U.; Gondal, M.A.; Mumtaz, S. Chapter 11—Environmental sustainability: Challenges and approaches. In Natural Resources Conservation and Advances for Sustainability; Jhariya, M.K., Meena, R.S., Banerjee, A., Meena, S.N., Eds.; Elsevier: Amsterdam, The Netherlands, 2022; pp. 243–270. [Google Scholar]
- European Commission. Waste from Electrical and Electronic Equipment (WEEE). Available online: https://environment.ec.europa.eu/topics/waste-and-recycling/waste-electrical-and-electronic-equipment-weee_en2023 (accessed on 15 December 2023).
- Gu, Y.; Wu, Y.; Xu, M.; Mu, X.; Zuo, T. Waste electrical and electronic equipment (WEEE) recycling for a sustainable resource supply in the electronics industry in China. J. Clean. Prod. 2016, 127, 331–338. [Google Scholar] [CrossRef]
- White, K.; Hardisty, D.J.; Habib, R. The Elusive Green Consumer People say they want sustainable products, but they don’t tend to buy them. Here’s how to change that. Harv. Bus. Rev. 2019, 97, 124–133. [Google Scholar]
- Panizzut, N.; Rafi-Ul-Shan, P.M.; Amar, H.; Sher, F.; Mazhar, M.U.; Klemeš, J.J. Exploring relationship between environmentalism and consumerism in a market economy society: A structured systematic literature review. Clean. Eng. Technol. 2021, 2, 100047. [Google Scholar] [CrossRef]
- Eurobarometer. Attitudes of European Citizens towards the Environment. Available online: https://op.europa.eu/en/publication-detail/-/publication/9a97b30e-15cb-11ec-b4fe-01aa75ed71a12008 (accessed on 15 December 2023).
- Pressbooks. Sustainability Methods and Perspectives. Available online: https://pressbooks.pub/sustainabilitymethods/chapter/individual-action/#:~:text=Individual%20action%20is%20the%20conscientious%20decision%20by%20a,an%20environmental%2C%20social%2C%20or%20economic%20aspect%20of%20sustainability (accessed on 15 December 2023).
- Yan, W.; Xiong, Y.; Xiong, Z.; Guo, N. Bricks vs. clicks: Which is better for marketing remanufactured products? Eur. J. Oper. Res. 2015, 242, 434–444. [Google Scholar] [CrossRef]
- Zhai, M.; Wang, X.; Zhao, X. The importance of online customer reviews characteristics on remanufactured product sales: Evidence from the mobile phone market on Amazon.com. J. Retail. Consum. Serv. 2024, 77, 103677. [Google Scholar] [CrossRef]
- Ferguson, M.E.; Souza, G.C. Closed-Loop Supply Chains New Developments to Improve the Sustainability of Business Practices; CRC Press: Boca Raton, FL, USA, 2010. [Google Scholar]
- Atasu, A.; Guide, V.D.R., Jr.; Van Wassenhove, L.N. So What If Remanufacturing Cannibalizes My New Product Sales? Calif. Manag. Rev. 2010, 52, 56–76. [Google Scholar] [CrossRef]
- Zou, Z.B.; Wang, J.J.; Deng, G.S.; Chen, H. Third-party remanufacturing mode selection: Outsourcing or authorization? Transp. Res. Part E Logist. Transp. Rev. 2016, 87, 1–19. [Google Scholar] [CrossRef]
- Irving, A.W.; Pearson, D.R.; Aranoff, S.L.; Pinkert, D.A.; Johanson, D.S.; Broadbent, M.M. Remanufactured Goods: An Overview of the U.S. and Global Industries, Markets, and Trade. In International Journal of Production Research; United States International Trade Commission: Washington, DC, USA, 2012; Volume 20436, pp. 332–525. [Google Scholar]
- Zhang, Y.; Chen, W.; Li, Q. Third-party remanufacturing mode selection for a capital-constrained closed-loop supply chain under financing portfolio. Comput. Ind. Eng. 2021, 157, 107315. [Google Scholar] [CrossRef]
- Savaskan, R.C.; Bhattacharya, S.; Van Wassenhove, L.N. Closed-Loop Supply Chain Models with Product Remanufacturing. Manag. Sci. 2004, 50, 239–252. [Google Scholar] [CrossRef]
- Pazoki, M.; Samarghandi, H. Take-back regulation: Remanufacturing or Eco-design? Int. J. Prod. Econ. 2020, 227, 107674. [Google Scholar] [CrossRef]
- Du, P.; Yang, X.; Xu, L.; Tan, Y.; Li, H. Green design strategies of competing manufacturers in a sustainable supply chain. J. Clean. Prod. 2020, 265, 121853. [Google Scholar] [CrossRef]
- Chang, T.-W. Double-edged sword effect of packaging: Antecedents and consumer consequences of a company’s green packaging design. J. Clean. Prod. 2023, 406, 137037. [Google Scholar] [CrossRef]
- Rau, H.; Wu, J.-J.; Procopio, K.M. Exploring green product design through TRIZ methodology and the use of green features. Comput. Ind. Eng. 2023, 180, 109252. [Google Scholar] [CrossRef]
- Xerox. You and Xerox: Enabling a Circular Economy. Available online: https://www.office.xerox.com/latest/XOGBR-60U.PDF (accessed on 15 October 2023).
- Gao, C.; Wolff, S.; Wang, S. Eco-friendly additive manufacturing of metals: Energy efficiency and life cycle analysis. J. Manuf. Syst. 2021, 60, 459–472. [Google Scholar] [CrossRef]
- Wang, Z.; Feng, N.; Zuo, W.; Jia, Y. Sustainable recovery through efficient resource markets: Innovations and solutions. Resour. Policy 2024, 88, 104350. [Google Scholar] [CrossRef]
- Yalabik, B.; Chhajed, D.; Petruzzi, N.C. Product and sales contract design in remanufacturing. Int. J. Prod. Econ. 2014, 154, 299–312. [Google Scholar] [CrossRef]
- Wang, Q.; Li, B.; Chen, B.; Wang, Z.; Liu, W.; Cheng, Y. Impact of product design on remanufacturing under environmental legislation. Comput. Ind. Eng. 2022, 165, 107889. [Google Scholar] [CrossRef]
- Ke, C.; Pan, X.; Wan, P.; Jiang, Z.; Zhao, J. An integrated design method for used product remanufacturing scheme considering carbon emission. Sustain. Prod. Consum. 2023, 41, 348–361. [Google Scholar] [CrossRef]
- Zhu, W.; He, Y. Green product design in supply chains under competition. Eur. J. Oper. Res. 2017, 258, 165–180. [Google Scholar] [CrossRef]
- Hong, Z.; Guo, X. Green product supply chain contracts considering environmental responsibilities. Omega-Int. J. Manag. Sci. 2019, 83, 155–166. [Google Scholar] [CrossRef]
- Ko, Y.-T. Modeling an Innovative Green Design Method for Sustainable Products. Sustainability 2020, 12, 3351. [Google Scholar] [CrossRef]
- Gu, W.; Chhajed, D.; Petruzzi, N.C.; Yalabik, B. Quality design and environmental implications of green consumerism in remanufacturing. Int. J. Prod. Econ. 2015, 162, 55–69. [Google Scholar] [CrossRef]
- Dey, B.K.; Park, J.; Seok, H. Carbon-emission and waste reduction of a manufacturing-remanufacturing system using green technology and autonomated inspection. Rairo-Oper. Res. 2022, 56, 2801–2831. [Google Scholar] [CrossRef]
- Shi, H.; Liu, Y.; Petruzzi, N.C. Consumer Heterogeneity, Product Quality, and Distribution Channels. Manag. Sci. 2013, 59, 1162–1176. [Google Scholar] [CrossRef]
- Chai, J.; Yan, W.; Li, Y.; Palmer, M.; Huang, Q. Selling vertically differentiated products under one channel or two? A quality segmentation model for differentiated distribution channels. J. Oper. Res. Soc. 2020, 71, 1180–1198. [Google Scholar] [CrossRef]
- Zhang, X.; Huang, J.; Shen, C. Retailers’ incentives for green investment in differentiated competition channels. J. Manag. Sci. Eng. 2023, 8, 465–489. [Google Scholar] [CrossRef]
Disclaimer/Publisher’s Note: The statements, opinions and data contained in all publications are solely those of the individual author(s) and contributor(s) and not of MDPI and/or the editor(s). MDPI and/or the editor(s) disclaim responsibility for any injury to people or property resulting from any ideas, methods, instructions or products referred to in the content. |
© 2024 by the authors. Licensee MDPI, Basel, Switzerland. This article is an open access article distributed under the terms and conditions of the Creative Commons Attribution (CC BY) license (https://creativecommons.org/licenses/by/4.0/).