Article

Research on Multi-Point Monitoring Data Grid Model and Inversion Positioning Method for Gas Leakage in Oil and Gas Stations

School of Civil Engineering and Architecture, Wuhan Institute of Technology, Wuhan 430074, China
*
Author to whom correspondence should be addressed.
Sustainability 2024, 16(4), 1638; https://doi.org/10.3390/su16041638
Submission received: 30 December 2023 / Revised: 5 February 2024 / Accepted: 6 February 2024 / Published: 16 February 2024
(This article belongs to the Section Hazards and Sustainability)

Abstract

:
The safe and stable operation of oil and gas stations makes a positive contribution to the stability and reliability of the natural gas supply. In order to reduce the impact of leakage and diffusion accidents in the station, it is necessary to develop an effective method to monitor and locate the leakage source quickly and accurately. This study proposes a multi-point monitoring data grid model to achieve the full-coverage monitoring of oil and gas stations. In addition, on this basis, a leakage source inversion positioning model is established to realize the leakage positioning of the station. A field experiment was carried out with an oil and gas station as an example. The results show that the optimal layout of points needs to consider the influence of environmental factors, confirmed by computational fluid dynamics (CFD) simulation. The optimized data interpolation not only reduces the cost of the monitoring point layout. In addition, through the comparison of multi-objective optimization algorithms and a robustness test, it can be found that the convergence efficiency and accuracy of the inversion positioning algorithm in this study have been greatly improved. Compared with the manual auxiliary positioning method, this method effectively solves the problem of leakage monitoring and positioning of oil and gas stations, and can achieve the purpose of leakage risk monitoring and “reducing cost and increasing efficiency”.

1. Introduction

In order to adapt to the energy structure orientation of “carbon peak and carbon neutrality”, oil and gas stations have gradually turned to sustainable energy production and storage methods [1,2]. The development of natural gas and other clean energy will help protect the environment, reduce greenhouse gas emissions, and promote sustainable energy development [3]. Oil and gas stations are, through a series of process equipment and systems, able to ensure the balance of natural gas supply and demand, and to achieve the purpose of natural gas storage and management. They play an important role in ensuring the stable supply of natural gas and safe production. However, a change in the injection–production pressure and various unbalanced factors, coupled with the corrosion of the process device by the external environment and the influence of human factors on the pipe fitting equipment, can easily lead to the failure of the integrity of the oil and gas station [4]. As a kind of flammable and explosive gas, natural gas can easily cause fire and explosion accidents if there are leaks in the pipeline, storage tank and other facilities [5]. In addition, the waste of oil and gas resources and the environmental pollution caused by the leakage and diffusion of oil and gas stations pose a serious threat to sustainable development [6]. Determining how to effectively monitor the integrity of the oil and gas station and quickly locate the leakage source to reduce the expansion of leakage accidents is the focus of this research.
With the maturity of combustible gas monitoring technology, the accuracy of oil and gas station leakage monitoring has been greatly improved, and human, material and financial resources have been greatly saved [7]. In many oil and gas stations, combustible gas leakage monitoring platforms have been established using various sensors, and maintenance personnel can monitor the gas concentration value in the station in real time [5]. Table 1 compares the different combustible gas leak monitoring technologies currently in use at oil and gas stations. Point-type laser methane sensors are widely used in the field of environmental monitoring and safety because of their high accuracy and sensitivity [8]. However, determining how to realize the rational layout of gas monitoring sensor points to attain the full-coverage monitoring of the entire oil and gas station is of great significance to prevent leakage accidents. Previous studies have mainly been based on the risk of leakage at a particular sensor location. Forconi, E et al. proposed an optimal placement of sensors based on the leakage risk that was able to make the detection of large leaks more efficient [9]. Based on a computational fluid dynamics (CFD) simulation of potential leakage risks, Jeon, K et al. presented a method to avoid insufficient sampling while reducing the computational load for gas detector allocation optimization [10]. Dong, JK et al. divided the monitoring area into a uniform grid and calculated the risk information value of each grid node to determine the sensor layout and priority order [11]. However, in order to realize the comprehensive leakage monitoring of oil and gas stations, in the process of sensor layout, it is also necessary to fully consider the effective performance of the sensor and the influence of various factors, such as the effective monitoring radius, obstacles, leakage point height and wind force.
For operation managers, in addition to realizing the coverage monitoring of the whole station, it is more necessary to locate the leak source in time and respond quickly to the risk warning. The research of gas leak source location methods at home and abroad mainly focuses on probability statistical algorithms and multi-objective optimization algorithms. Yee et al. proposed a Bayesian probabilistic inference method to estimate the location and intensity of the leakage source from the concentration data measured by the sensor [12]. Chen et al. introduced a particle swarm optimization algorithm to calculate multiple leakage source parameters, and verified the effectiveness of this method in leakage source inversion through a large number of simulation tests [13]. Under the concept of refined cost management, the deployment of a large amount of gas monitoring equipment in oil and gas stations will increase the operating cost. With limited monitoring data, the former leak location method based on probability theory is no longer used [14]. The latter inversion positioning method based on the optimization algorithm can quickly find the optimal solution under the limited monitoring data, but due to the limitations of the algorithm itself, the accuracy of the positioning results may decline [15].
Therefore, by addressing the technical challenges of gas leakage monitoring and location, the motivation of this research explores an integrated solution for full-coverage monitoring and leakage point location in oil and gas stations. Firstly, based on the leakage risk assessment and an analysis of the gas leakage and diffusion law, the point optimization layout model of a point-type laser methane sensor is established. Then, the data fusion method is used to optimize the data interpolation, and a multi-point monitoring data grid model is developed to achieve full-coverage monitoring. Finally, in order to overcome the influence of monitoring data and the algorithm convergence effect on the results, three optimizations of the genetic algorithm are carried out. The field experiment monitoring of an oil gas joint station is carried out. The location and concentration parameters of the leakage point are given by numerical simulation based on the grid points of the monitoring data.

2. Leakage Analysis of Oil and Gas Stations

2.1. Leakage Analysis of Process Equipment in Oil and Gas Stations

Oil and gas stations cover a large area. There is a lot of equipment in these stations and the layout of the ground pipelines is complicated. Oil and gas stations mainly comprise a separator, crude oil stabilization tower, pump, compressor, heat exchanger, storage tank and process pipeline between the equipment. Each process device is independent and has an influence on the other devices. Natural gas leakage accidents in oil and gas stations caused by the failure of equipment and pipeline integrity occur from time to time. Among them, the natural gas pipeline system is the most prone to integrity failure [16,17]. The key locations are the connection of pipe to pipe and pipe to equipment, which mainly include valves, flanges, connectors and casing [18].
(i)
Valves are the key equipment used to control fluid in oil and gas installation. It is worth noting that major leakage accidents in oil and gas stations occur from time to time due to a poor valve seal or improper operation.
(ii)
At the flange connection between each oil and gas device (separator, heat exchanger and container, etc.) and the transmission pipeline, leakage between the gasket and the flange sealing surface can occur due to a lax fitting between the gasket and the flange sealing surface and insufficient pressing stress.
(iii)
The connector, an essential component of the natural gas pipeline system, is often susceptible to leakage accidents. The aging or dislodging of the rubber pad can result in the connection port not being tightly closed, leading to leakage. Additionally, if the bolt is not tightened or the gasket is not fully embedded, a gap may form in the connection port, leading to leakage.
(iv)
With a change in the transportation pressure in the oil and gas station or the fracture of the rubber sealing ring, a sealing failure in the casing easily occurs.
Figure 1 shows the schematic diagram of leakage at each connection of the natural gas pipeline system of the oil and gas station.

2.2. Gas Leakage Diffusion Model

The gas leakage and diffusion state of an oil and gas station is affected by various factors. In recent years, domestic and foreign scholars have conducted a series of studies on the gas leakage diffusion range and leakage risk prediction, and formed various gas leakage diffusion calculation models. The commonly used diffusion models are as follows: the Gaussian plume model, the Gauss smoke cloud model, the Empirical Model and the gas turbulence model. Both the Gaussian plume model and the Gauss smoke cloud model belong to the Gaussian models, which are mature and widely used in the calculation of light gas and neutral gas diffusion [19,20]. The main difference is that the Gaussian plume model has a better performance in the calculation of the continuous leakage diffusion concentration. The Gauss smoke cloud model is suitable for sudden instantaneous leakage, that is, when the leakage time is relatively short. The Empirical Model is an empirical model and is suitable for both the continuous and instantaneous leakage of heavy gas; however, the error is large and it has few applications [21]. The gas turbulence model is developed on the basis of the Gaussian diffusion model and is applicable to neutral and heavy gases [22].
Natural gas is a colorless and odorless gas mixture whose main component is methane, a typical light gas. In order to simulate the leakage diffusion of natural gas and calculate the theoretical value of the leakage gas concentration, domestic and foreign researchers usually use the Gaussian plume model as the calculation model for the diffusion concentration of non-heavy gas such as natural gas and hydrogen [23,24]. Its expression is shown in Equation (1).
Q x t , y t , z t = Q 0 π σ y σ z v e x p ( y t y 0 ) 2 σ y 2 2 ( z t z 0 ) 2 σ z 2 2
where Q x t , y t , y t z t is the theoretical monitoring concentration value; x t , y t , z t are the coordinate positions of the t monitoring point, m; x 0 , y 0 , z 0 are the coordinate values of the equipment and pipeline in which the leak occurs, m; Q 0 is the concentration value of the leakage source; v is the ambient wind speed, m/s; and σ y   and σ z are the diffusion coefficients on the y and z axes, respectively, determined by   x 0 , x i and the atmospheric stability AT.
In an oil and gas station, due to the coupling of external environment and internal factors, the flange, valve, casing and connecting parts will have different degrees of leakage. It can be seen from the Gaussian plume model that the gas leakage diffusion concentration value is closely related to the horizontal distance and vertical distance from the leakage source. Moreover, the diffusion process of gas leakage is often affected by external environmental factors, such as the wind direction and wind speed. Therefore, based on the natural gas leakage diffusion model, gas leakage monitoring should not only consider the effective distance of the monitoring leak source, but also consider the changes in external environmental factors in the oil and gas station.

3. Gas Leakage Multi-Point Monitoring Data Grid Model

According to the main characteristics of an oil and gas station, in order to improve the accuracy of gas leakage monitoring, the random arrangement of point-type laser me-thane sensors should be avoided. It is considered that the risk of leakage in the process equipment in the station is very different, and that the gas leakage and diffusion are affected by many factors. The efficiency of leakage monitoring and the cost of sensor installation can be improved by focusing on the process equipment with a high leakage frequency and high risk of damage. In this study, the risk of equipment leakage and the law of gas leakage diffusion are considered comprehensively to realize the optimal layout of monitoring points. In addition, based on the optimized data interpolation method, combined with the known monitoring point data information, a gas leakage multi-point monitoring data grid model is proposed to achieve the full-coverage monitoring of the station.

3.1. Optimized Layout of Monitoring Points

3.1.1. Equipment Leakage Risk Assessment

In previous studies, different scholars have used qualitative evaluation methods such as the failure hypothesis analysis method, the risk matrix method and the fish fin diagram method to evaluate the risk at flammable and explosive risk sites [25]. Based on the experience of leakage risk management in oil and gas stations, the leakage situation of different process equipment and pipelines is different. The leakage source is widely distributed and the leakage probability varies greatly. Due to the complex operation equipment layout of oil and gas stations, potential leakage sources mainly include storage tanks, crude oil stabilization towers, separators, heat exchangers, gas pipelines, compressors, pump bodies, etc. A storage tank is a facility used to store natural gas. Aging tanks, in particular, are at a greater risk of leakage due to metal fatigue and corrosion. The oil stabilizer and separator are subject to corrosion, wear, and the risk of leakage. Heat exchangers are usually used for heat exchange in oil and gas stations, which can lead to leakage accidents due to the corrosion of the pipe wall and the loosening of pipe joints. Gas transmission lines are subject to high-pressure gas, and there is also a high risk of gas leakage due to pipeline corrosion, mechanical damage or improper operation. In the case of overpressure and overload, the compressor unit and pump body are also prone to leakage risks due to poor sealing or bearing failure.
Quantitative leakage risk analysis refers to calculating the probability of equipment failure occurring in the process equipment in the oil and gas station. By analyzing the overall safety risk level of process facilities in the station, risk management can be carried out effectively [25]. The leakage accident size is directly related to the leakage flow rate and the leakage aperture size [26,27]. Combined with the typical leakage aperture classification at home and abroad, in order to facilitate the statistical quantification of the probability of leakage in different aperture ranges, the leak source aperture is divided into four categories, as shown in Table 2.
Many researchers at home and abroad have established a quantitative prediction analysis model for the probability of leakage in process equipment in flammable and explosive chemical stations. From the leakage aperture range d1 to d2, the typical leakage probability model formula is shown in Equation (2) [28].
f ( d ) = θ ( 1 + α D n ) d m + f p F x = f ( d 1 ) f ( d 2 )
where f(d) is the frequency at which the diameter of the leak hole is greater than a certain dimension d; D is the diameter of the equipment and facilities; fp is the annual rupture frequency; θ, α, m, n are determined by each process device type; and Fx is the leakage probability value in the leakage aperture range d1 to d2.
According to the process leakage frequency of the International Federation of Oil and Gas Producers and the hydrocarbon leakage statistical frequency of DNVGL [29], the probability of leakage under different leak apertures was further studied. Based on Equation (3), the probability of leakage in equipment with an unknown aperture is calculated, and the leakage situation of each equipment is judged from the perspective of a quantitative leakage risk assessment. The distribution diagram of the probability of leakage in process equipment under different aperture types is shown in Figure 2.
F y = F e F m exp ln ( F x 2 ) ln ( F x 1 ) ln ( x 2 x 1 ) ln ( y x 1 ) + ln ( F x 1 )
where F y is the leakage frequency of leakage aperture y, and F e and F m are the equipment correction coefficient and the management correction coefficient, respectively. F x 1 and F x 2 can be checked from the leakage probability statistics table.

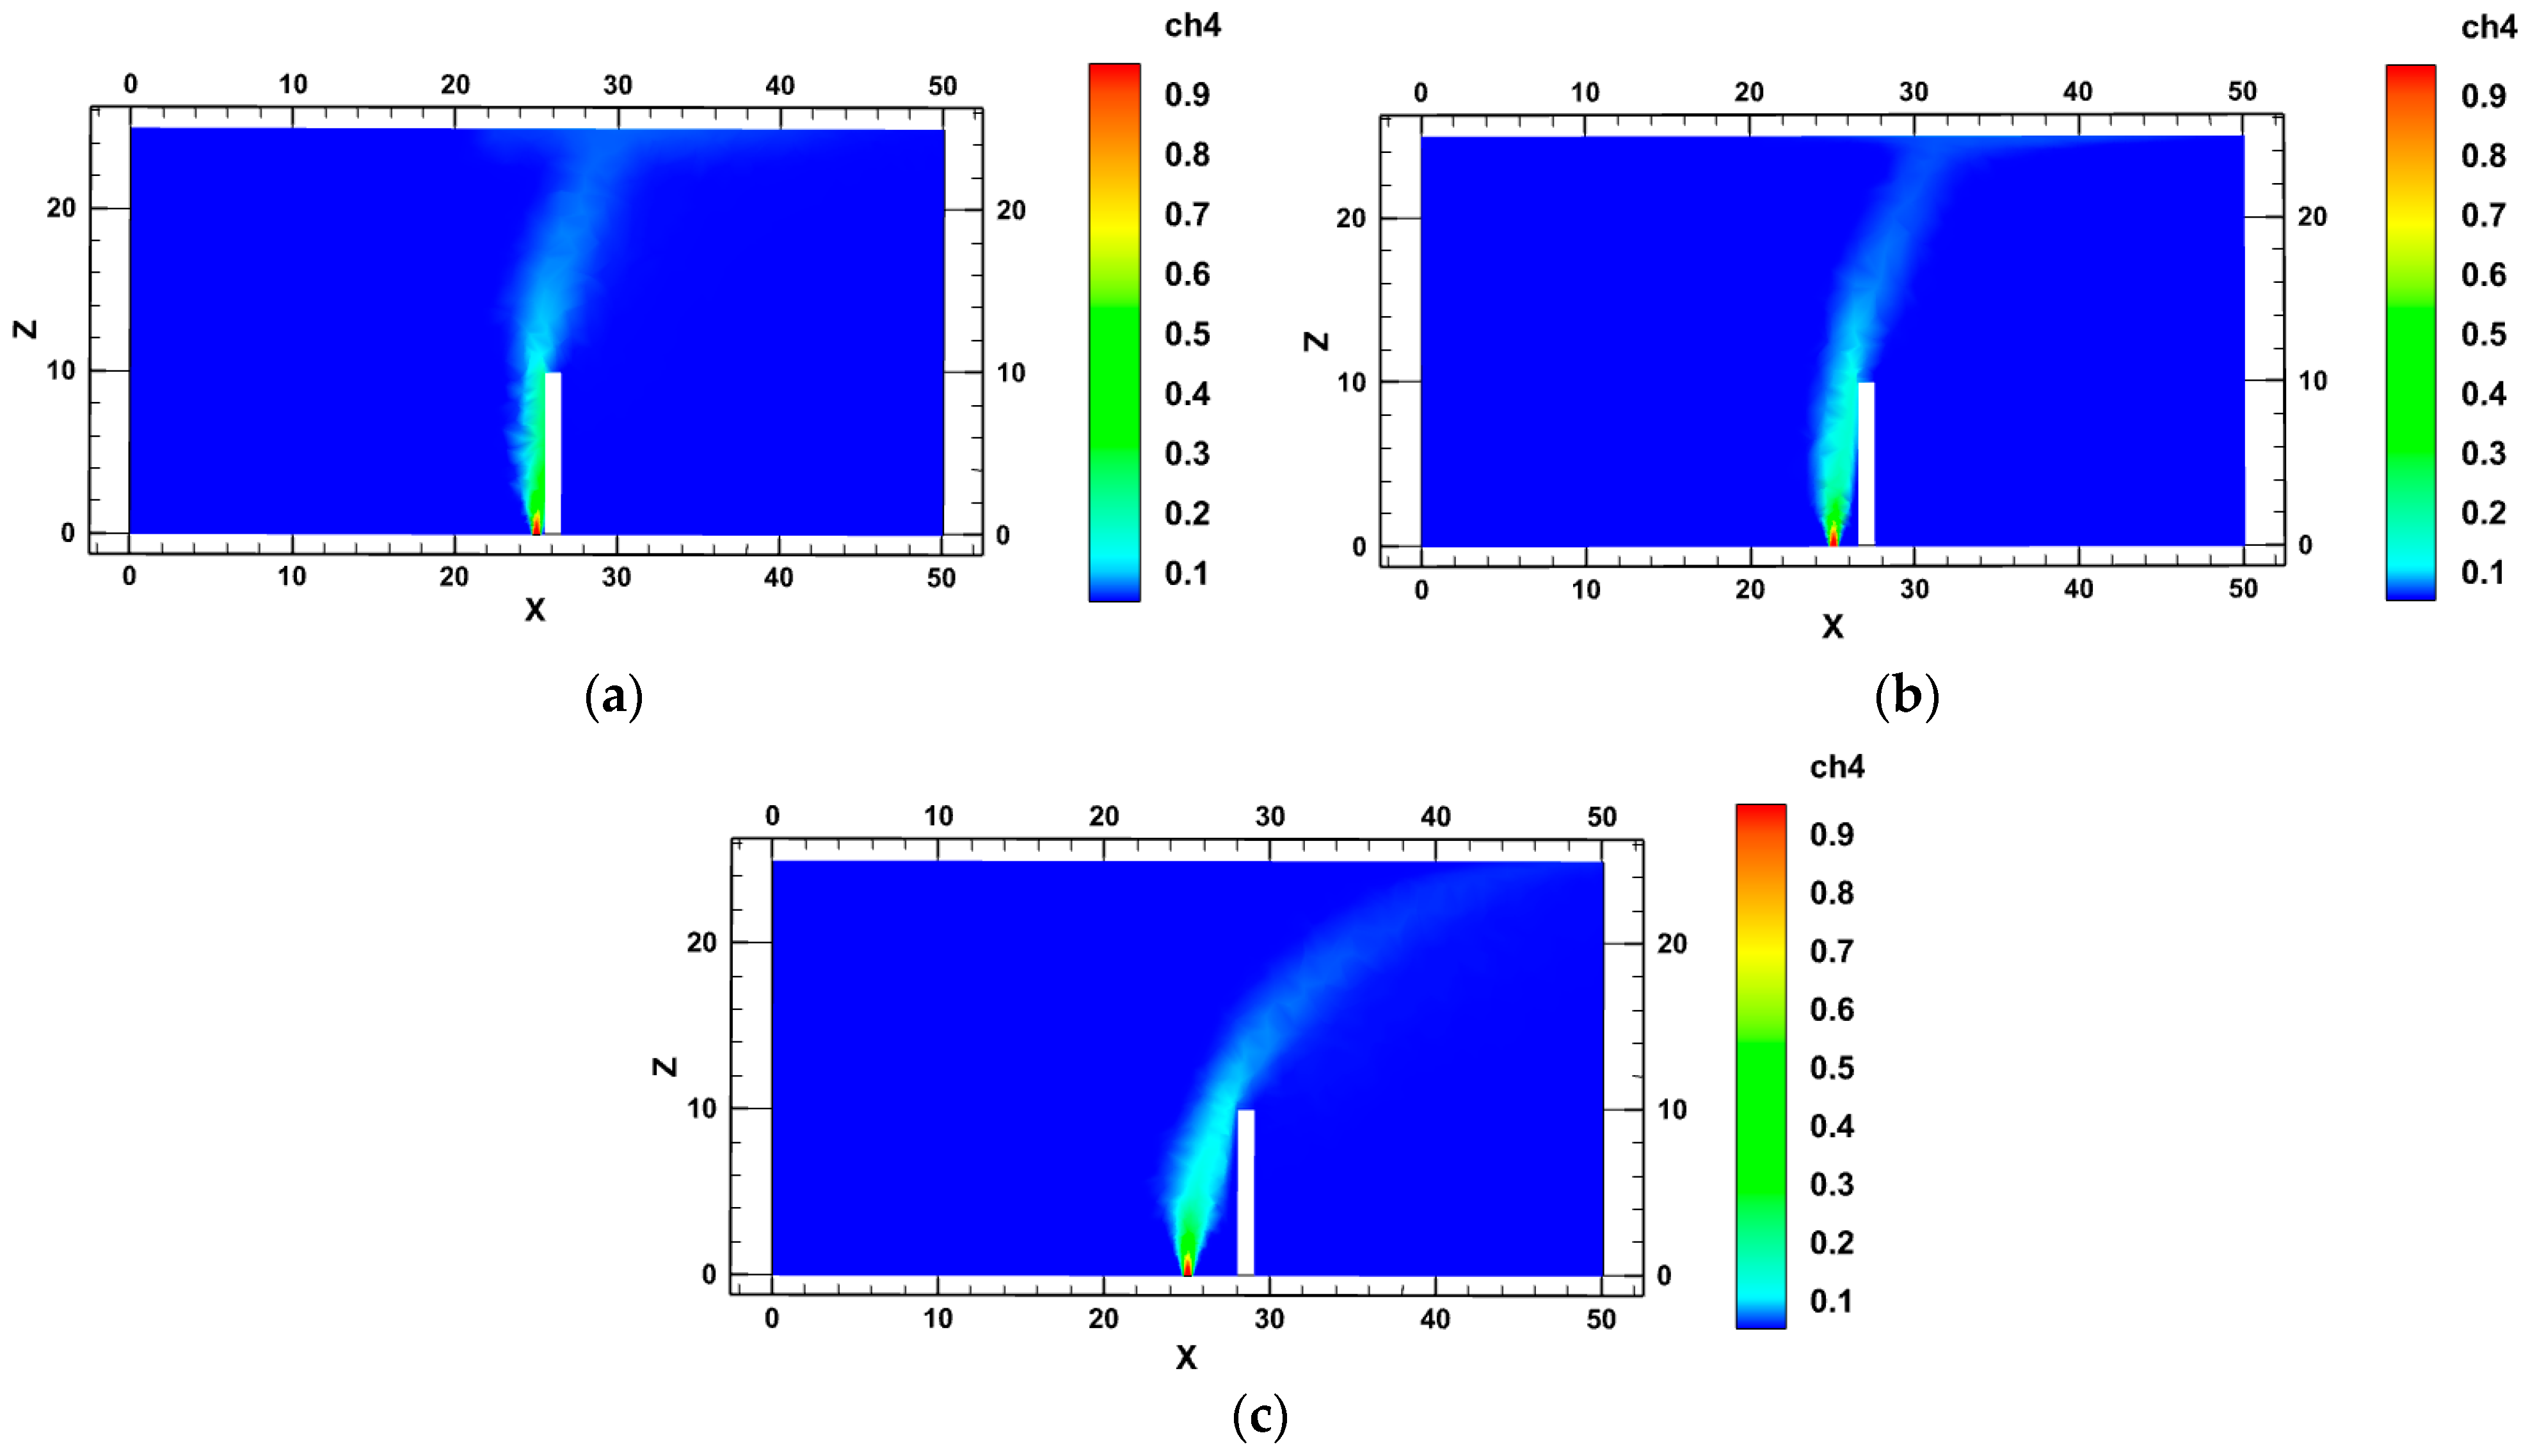
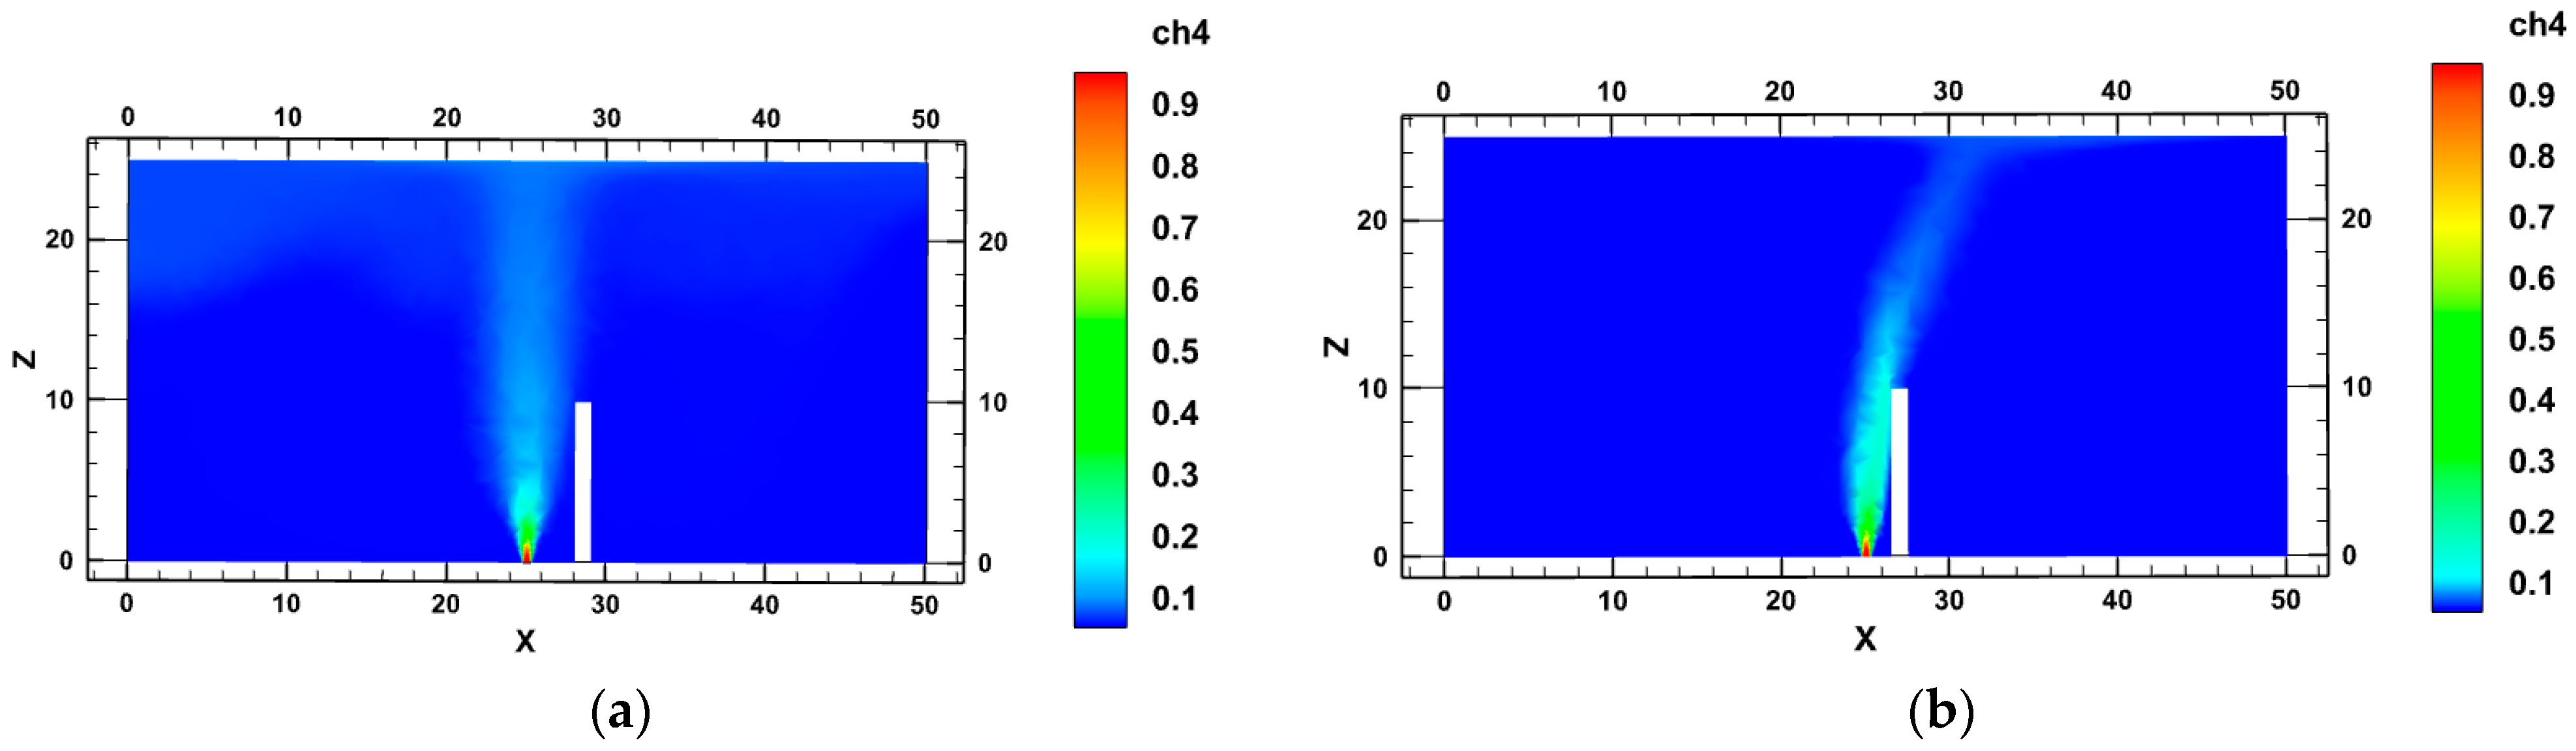
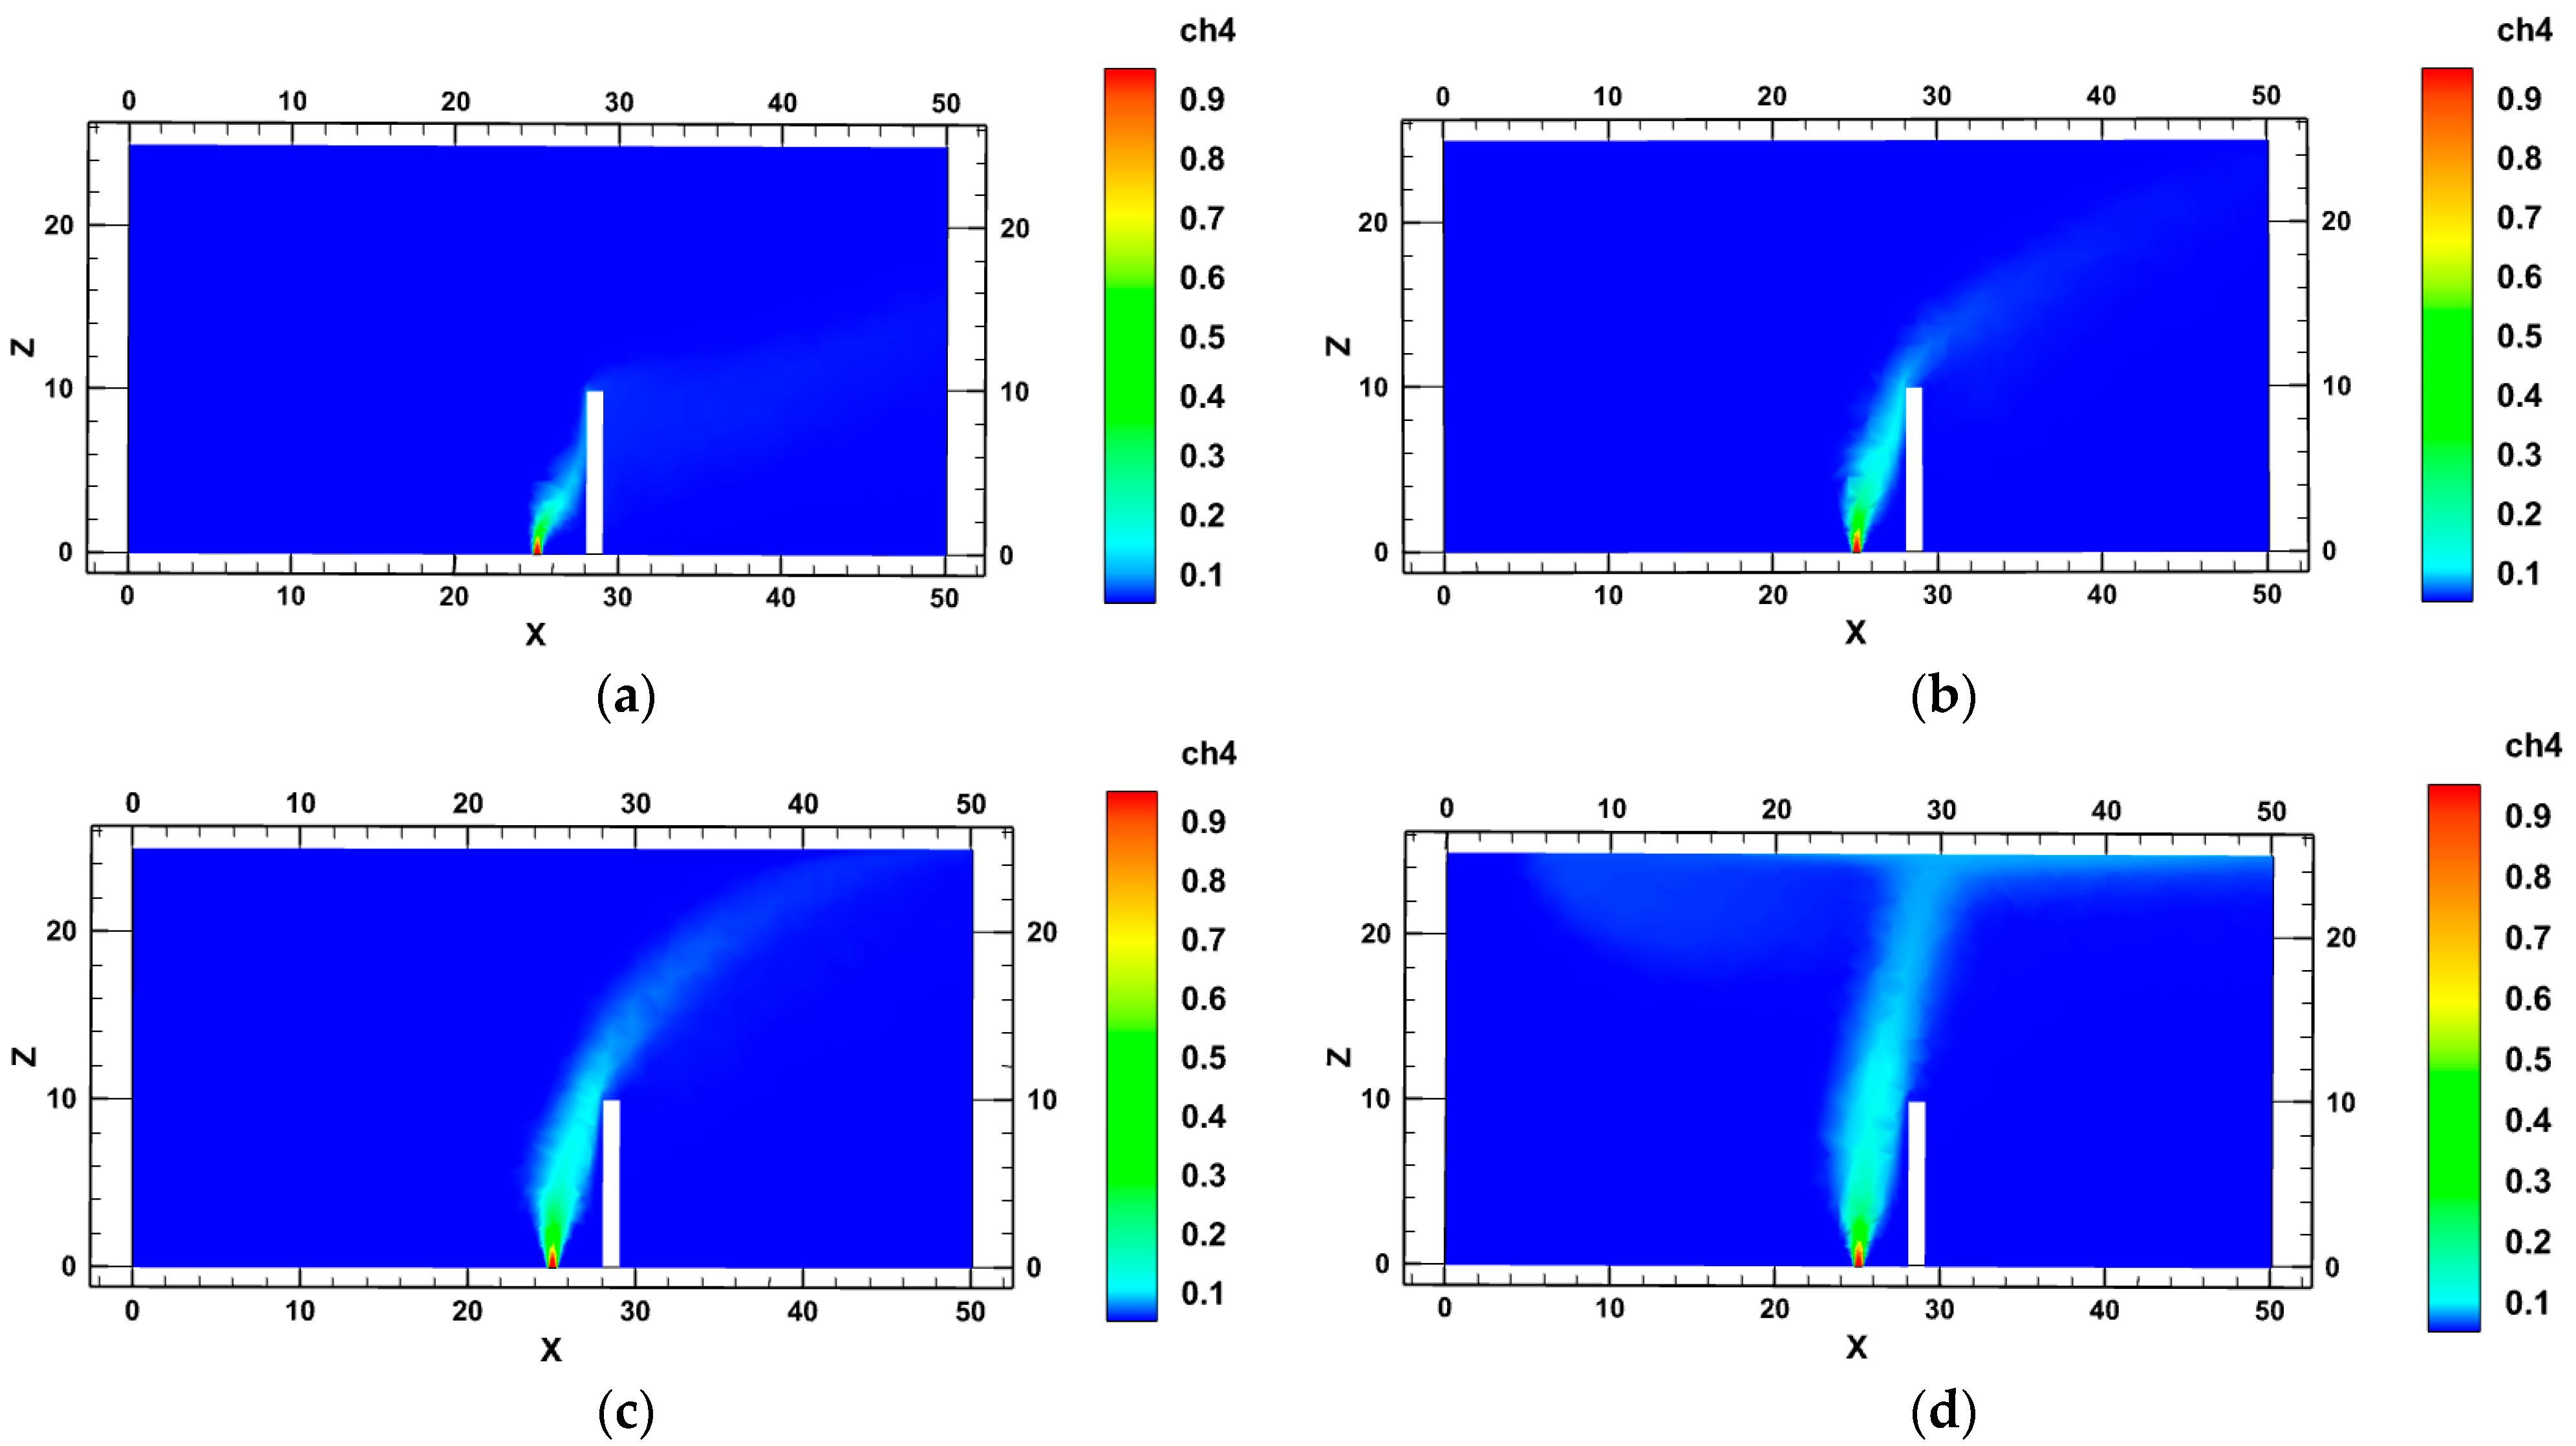
3.1.2. Analysis of Gas Leakage and Diffusion Law

In order to improve the monitoring accuracy, in addition to the key monitoring of major danger sources in the function area, the influence of external wind, the wind direction and obstacles on the equipment layout should be considered. Domestic and foreign scholars have simulated the gas leakage and diffusion state without obstacles, and obtained the leakage and diffusion law of different types of gases under changes in the external conditions. In the absence of obstacles, the leakage gas will spread along the wind direction, and the risk range will continue to expand. With the increase in wind, the speed and scope of gas leakage continue to increase, reducing the concentration of leaking gas and increasing the difficulty of monitoring [30,31,32]. However, in the face of a complex oil and gas station environment, it is also necessary to consider the influence of obstacles such as the process equipment and guardrails on gas leakage and diffusion [33]. Under the influence of obstacles, the theoretical monitoring concentration calculated by the Gaussian plume model is no longer applicable. Therefore, it is necessary to study the law of gas leakage and diffusion when the external environment changes in the case of obstacles, so as to further provide a theoretical basis for optimizing the location of the monitoring equipment. In this study, Fluent software (Ansys Fluent 15.0; Ansys Fluent 2021R1) is used to establish a leakage simulation model and carry out simulation research.
(1)
Distance of obstacle
Via a comparison of Figure 3a–c, it can be found that on the windward side of the obstacle, the leakage gas continues to accumulate, and the concentration value is the largest. The higher the distance from the obstacle, the more the concentration range continues to expand. After reaching the top of the obstacle, due to the influence of wind, the closer the distance from the obstacle, the larger the angle of the leakage gas lifting and the smaller the diffusion range.
(2)
Height of obstacle
Via a comparison of Figure 4a–c, it is evident that the gas leakage concentration is greater on the windward side of the obstacle. Additionally, owing to the presence of gas kinetic energy, the leaked gas ascends along the obstacle. As the height of the obstacle increases, the gas rises. When diffused to the top of the obstacle, the higher the height of the obstacle, the higher the deflection height of the leaking gas, and the shorter the horizontal distance of the leakage.
(3)
External wind speed
A comparison of Figure 5a–d reveals that, in the static wind state, the leaking gas is ejected into the air as a jet, and the angle of jet deviation from the vertical direction increases with the rising wind speed. On the lee side of the obstacle, as the wind speed increases and the gas surmounts the obstacle, it continues to disperse downstream, leading to an expanding leakage range and a decreasing concentration.
(4)
Gas leakage velocity
A comparison of Figure 6a–d reveals that the offset of the leaked gas decreases with an increasing leakage velocity. Under conditions of low-speed leakage, gas accumulates on the windward side of the obstacle. With an increasing leakage speed, the area of high concentration expands, spreading further over the top of the obstacle.
An oil and gas station is mainly divided into seven functional areas: crude oil heating area, crude oil dehydration treatment area, natural gas treatment area, sewage treatment area, fire protection area, power distribution area and office area. Therefore, in addition to the priority layout based on the above oil and gas station process equipment leakage risk assessment, the monitoring points of the point-type laser methane sensor should consider the gas leakage diffusion law to optimize the layout.

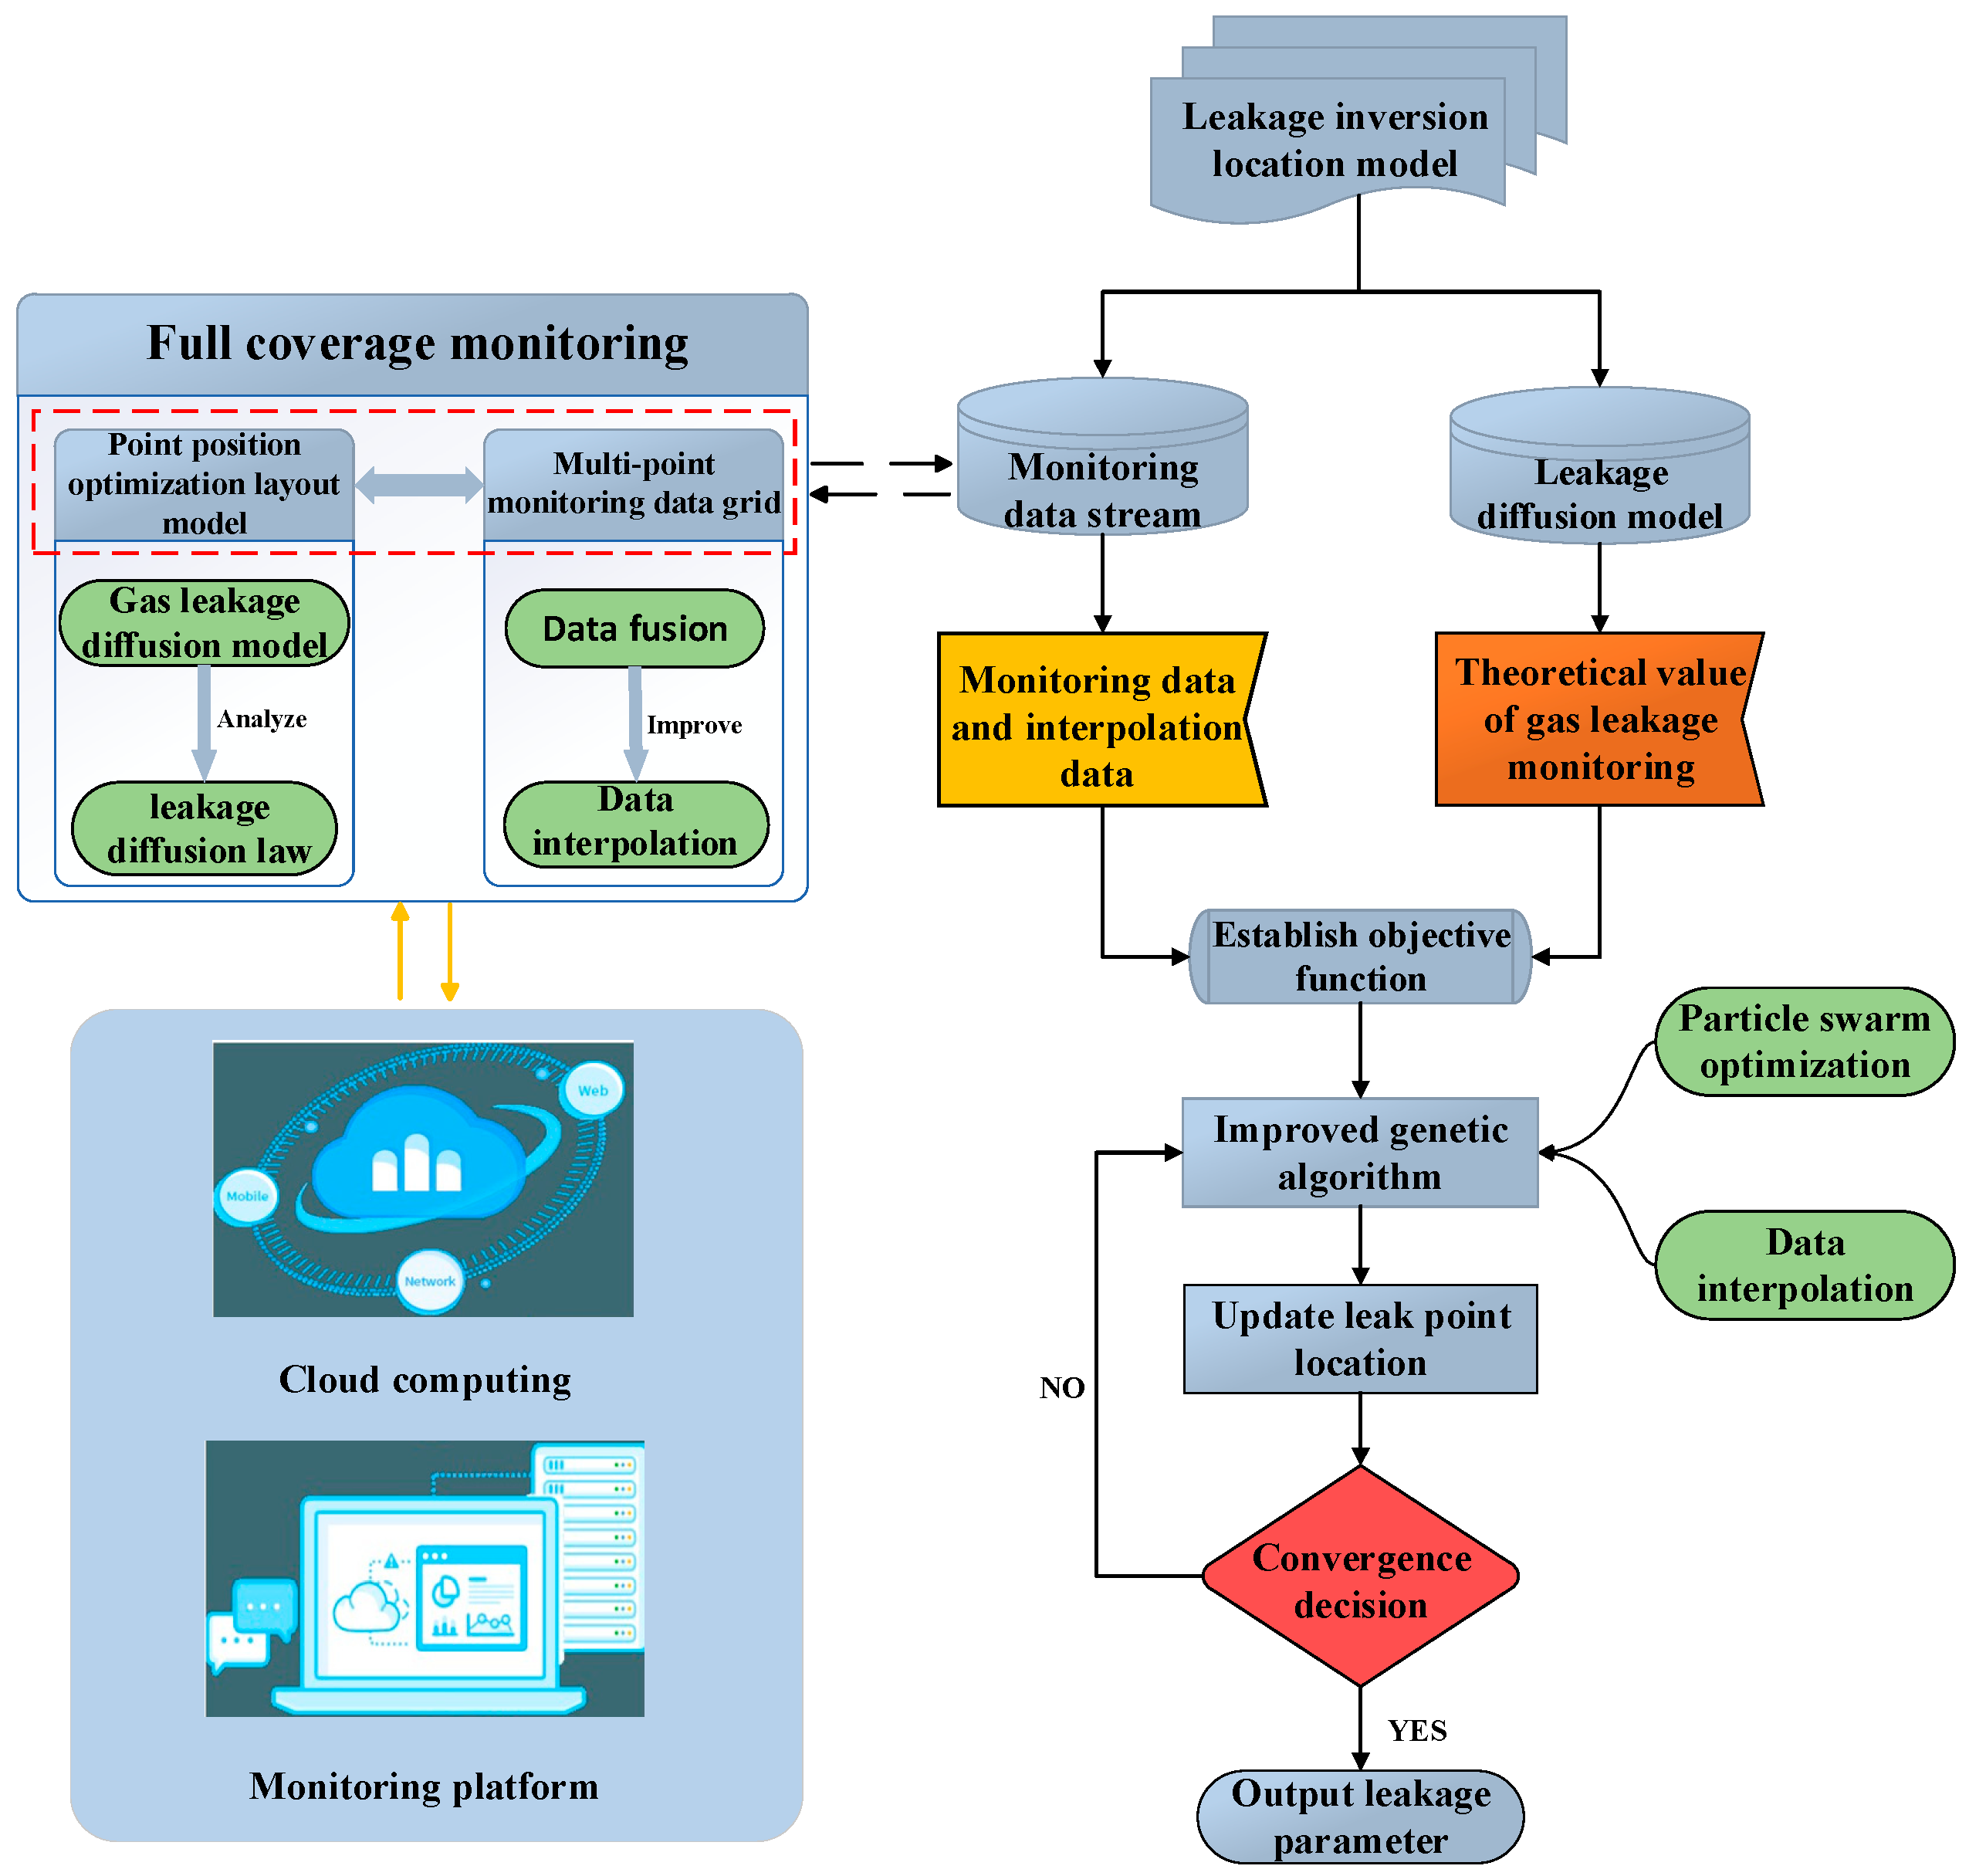
3.2. Full Coverage Monitoring Method of Oil and Gas Station

Based on the optimized layout model of the monitoring points, the real-time monitoring concentration of methane at each monitoring point and the gas leakage state in the monitoring coverage area can be obtained. However, the area of the oil and gas station is large, and the diffusion of the leakage gas is greatly affected by the external environment. It is impossible to achieve the full-coverage monitoring of the station by only using several key monitoring values of the oil and gas station. Therefore, according to the gas concentration value and location distribution of the monitoring points, it is necessary to monitor the gas leakage in unknown areas and calculate the concentration data interpolation of other grid nodes. In order to obtain sample points of the gas leakage concentration with high precision and quality and to assist in the monitoring and early warning of the oil and gas station area, it is necessary to overcome the shortcomings of single-data interpolation in the past and optimize the data interpolation algorithm.
(1)
In order to determine the positioning space coordinates of the point laser methane detector, the southwest corner of the oil and gas station is taken as the origin of the space rectangular coordinate system. The X-axis is the east–west direction of the oil and gas station, and the Y-axis is the north–south direction of the oil and gas station. The coordinate information and concentration information of each monitoring point are expressed as follows: C x i , y i , z i , i = 1...... n; n indicates the number of monitoring points.
(2)
Preferred data interpolation method
In the Kriging interpolation method, it is necessary to fit the variance function of the known data points to obtain a suitable variance function model [34]. Then, according to the spatial relationship between the known points, the value of the unknown position is calculated by the distance between the unknown points and the value of the variance function, whose expression is as follows:
C ( x j , y j , z j ) = i = 1 n λ i C ( x i , y i , z i ) 2 m λ ( h ) = i = 1 m [ C ( x i + h ) C ( x i ) ] 2 i = 1 n λ i = 1
where C x j , y j , z j is the concentration distribution interpolation obtained by the ordinary Kriging method; λ i is the weight coefficient relative to the known monitoring points; λ ( h ) is the variance function; and n and m are the number of known monitoring points and interpolation points, respectively. C ( x i + h ) is the concentration data of h along the x wheelbase.
The inverse distance-weighted interpolation method (IDW) fully considers the spatial unknown relationship between monitoring points and unknown points and the relative positions between monitoring points in the definition of weights, so that the concentration data interpolation has a better effect [35]. The interpolation formula of the inverse distance weighted interpolation method is as follows:
C x j , y j , z i = i = 1 n λ i C ( x i , y i , z i ) d = ( x j x i ) 2 + ( y j y i ) 2 λ i = 1 ( d ) p / i = 1 n 1 ( d ) p
where C x j , y j , z i is the concentration distribution interpolation obtained by the inverse distance-weighted interpolation method; d is the distance between unknown monitoring points and known monitoring points; and p is the power of distance, which has a greater influence on the interpolation result. The higher the power, the smoother the interpolation result. When p = 1, it is called the inverse distance square weighting method.
The Tyson polygon method divides the spatial extent of the known data point into polygon regions; each polygon region surrounds a known data point such that the distance between the data point in each region and its nearest neighbor data point is minimized, and the data point is used as an interpolation for all unknown positions in the region [36]. This method assumes that the variation in values between adjacent locations in space is uniform, and that the influence of each data point is limited to the Tyson polygon region in which it is located.
C ° x j , y j , z i = i = 1 n λ i C x i , y i , z i λ i = a i / A
where C ° x j , y j , z j is the concentration distribution interpolation obtained by the Tyson polygon method; λ i is the weight coefficient; a i is the area of the polygon occupied by the ith monitoring point; and A is the area of the monitoring point.
Spline interpolation is used for smooth curve or surface fitting between a set of known data points [37]. It approximates a curve or surface between data points by constructing a continuous set of piecewise polynomial functions. The advantage of spline function interpolation is that it can carry out smooth fitting between data points and maintain the continuity and smoothness of the interpolation results. However, spline function interpolation also has some limitations, such as a poor interpolation effect for sparse data points and the relatively complex processing of boundary problems.
(3)
Considering the monitoring environment of oil and gas stations and the influencing factors of gas leakage and diffusion, the above commonly used spatial data interpolation method is analyzed. In order to obtain the data interpolation points with high precision and good quality, ordinary Kriging interpolation and inverse distance-weighted interpolation are selected. Considering the characteristics of the above two interpolation methods, the Kriging interpolation method and inverse distance weighted interpolation method are combined, and the advantages of the two methods are fully utilized to obtain new data interpolation results. Among them, the Kriging interpolation result is C x j , y j , z j , the inverse distance-weighted interpolation method is C x j , y j , z j , and the final fusion interpolation result is as follows:
Z x j , y j , z j = C x j , y j , z j C x j , y j , z j j = 1 m C x j , y j , z j C x j , y j , z j
where Z x j , y j , z j is the comprehensive interpolation calculated by Kriging interpolation and inverse distance-weighted interpolation; j = 1…… m, m is the number of interpolation points.

4. Inversion Positioning Method for Gas Leakage in Oil and Gas Station

4.1. Gas Leakage Inversion Positioning Model

By monitoring the leakage gas concentration of the oil and gas station, when the monitoring concentration of the gas leakage reaches the predetermined threshold, the leakage source should be located in time and the corresponding treatment measures should be taken. In order to improve the efficiency of leakage source monitoring and location, the advantages of hardware monitoring equipment and a multi-objective optimization algorithm are combined to achieve the accurate location of the natural gas leakage source. The genetic algorithm (GA) is a widely used and effective inversion method in multi-objective optimization algorithms, but it also has some shortcomings, such as slow convergence, premature convergence and a local optimal solution for complex problems. Therefore, in order to solve the above problems, a gas leakage inversion positioning method based on the improved genetic algorithm (IGA) is proposed in this study.
As can be seen from the Gaussian plume model, only the gas concentration value and data concentration interpolation at the monitored points are known. The distance between the leakage source and the monitoring point and the diffusion coefficient are unknown, so the leakage diffusion model cannot be used to accurately calculate the leakage source coordinates and concentration values. Therefore, a mathematical model is established to convert the problem of determining the location and concentration of the leakage source into a mathematical problem in which the difference between the monitoring value and the theoretical value of leakage diffusion is minimal. The expression of the objective function is as follows:
F = i = t = 1 n C x i , y i , z i Q x t , y t , z t 2
where C x i , y i , z i and Q x t , y t , z t are the actual and theoretical concentration monitoring values, respectively; in this case, t = i = 1...... n.
However, the point optimization layout model can only provide limited monitoring data, which increases the difficulty of solving the mathematical model. Therefore, this study further optimizes the objective function to meet the accuracy requirements of the inversion algorithm. The flow of the natural gas leakage location inversion method in an oil and gas station is shown in Figure 7.

4.2. Inverse Positioning Method Based on Improved Genetic Algorithm

The GA has some inherent limitations, with one major drawback being its slow convergence rate. GA is a population-based meta-heuristic algorithm that guides the population to gradually develop better fitness through several iterations of selection, crossover, and mutation operations. Another important limitation is that it falls into a local optimal rather than finding a global optimal solution. Due to the randomness of the GA, the GA may prematurely converge to local fitting populations before exploring the entire search space. This makes it prone to providing sub-optimal results [38]. Therefore, in order to improve the efficiency and accuracy of problem solving, this paper proposes three optimization points for the above specific problems, as follows.
(1)
Data interpolation expands the database.
In order to improve the computational efficiency and accuracy of the GA, this study introduces the data interpolation of the multi-point monitoring data grid model as the monitoring sample point, and the expression is (7). The data interpolation method expands the database and increases the randomness of the monitoring points to avoid the defect of local convergence. Based on the data interpolation method, the objective function is optimized. Its expression is as follows:
F = t = 1 n + m T x t , y t , z t Q x t , y t , z t 2 T x t , y t , z t { C x i , y i , z i , Z x j , y j , z j }
where Q x t , y t , z t , C x i , y i , z i and Z x j , y j , z j are theoretical monitoring values, actual monitoring values, and data interpolation, respectively. The actual monitoring value and data interpolation can be collectively referred to as the leakage monitoring value T x t , y t , z t . In this case, t = 1...... n + m, where n is the number of monitoring points and m is the number of interpolation points; F is the objective function. When the minimum value is obtained, it is the best leakage inversion location result.
(2)
Optimize algorithm parameters to avoid local optimality.
The primary parameters of the genetic algorithm include the population size, selection probability, crossover probability, mutation probability and fitness function. The configuration of these parameters significantly impacts the algorithm’s performance. The configuration of the crossover probability and mutation probability is linked to the trade-off between the algorithm’s exploration capability and convergence performance [39]. Setting the crossover and mutation probabilities too high can make the algorithm difficult to converge and prone to entering a disordered exploration state. Conversely, setting them too low can make the algorithm easily fall into local optima and hinder a comprehensive solution search.
In this study, an improved adaptive genetic algorithm based on a hormone regulation mechanism used in the literature [40] was used to set the adaptive selection probability (P0), adaptive crossover probability (Pc) and mutation probability (Pm) adjustment formulas. The algorithm not only enhances search precision but also accelerates convergence, thereby preventing it from falling into local optima. The specific algorithm is as follows:
P 0 = 1 P 0 init ( 1 + γ ( q av ) n 0 ( q max q min ) n 0 + ( q av ) n 0 )
P c = 1 P c init 1 + a ( q av ) n c ( q max q min ) n c + ( q av ) n c
P m = P m init ( 1 + β ( q av ) n m ( q max q min ) n m + ( q av ) n m )
where, P c init , P m init and P 0 init are, respectively, the initial crossover probability, the initial mutation probability and the initial selection threshold; qmax, qmin and qav are the maximum, minimum and average of the individual fitness of each generation, respectively; a, β and γ are the adjustment coefficients; and n c , n m and n 0 are also adjustment coefficients, ranging from 1 to 4.
(3)
Particle swarm optimization algorithm updates the local optimal solution.
Particle Swarm Optimization (PSO) is a population-based random search optimization algorithm [41]. This algorithm has a fast convergence speed and high computational efficiency. In this study, after the genetic operator was completed, the particle velocity and position update in Equation (13) of the particle swarm optimization algorithm were used to iteratively calculate the better solution obtained by the GA. Each iteration is controlled by the optimal position of the GA and its own optimal position, which makes the position update more purposeful. With the iteration, the particle swarm will be more and more concentrated near the global optimal position, so as to finally find the optimal solution of the problem. In the process of solving the particle swarm optimization algorithm, the information is transmitted in a single item, which prevents it falling into the early local optimal point and improves the convergence efficiency of the GA.
v i d t + 1 = ω v i d t + c 1 r 1 ( p i d x i d ) + c 2 r 2 ( p g d x i d ) x i d t + 1 = x i d t + ν i d t + 1
where vid is the d dimensional velocity of particle i in the t iteration; xid is the d dimensional position of particle i in the t iteration; c1 and c2 are acceleration factors; r1 and r2 are random numbers in [0, 1]; Pid and Pgd are the historical optimal position of particle I and the historical optimal position in population iteration, respectively; and ω is the inertia factor.
Combined with the above three optimization points, the main process of the inversion positioning method based on the improved genetic algorithm in this study is as follows:
Step 1: Optimize the monitoring database and establish the objective function. Firstly, the point location optimization layout is carried out to obtain the monitoring point data of the leakage sensor. Then, the data interpolation method is used to expand the monitoring database. Finally, the objective function expression is established by combining the monitoring concentration value and data interpolation.
Step 2: Fitness evaluation. The weighted centroid method is used to calculate the weight of the monitoring points. According to the law of gas leakage diffusion, the closer to the leakage source, the greater the concentration of gas leakage monitoring. Therefore, the larger the concentration value in the multi-point monitoring data grid model, the greater the weight of the node coordinates. The fitness of each monitoring node is obtained using Equation (14).
q 1 : q 2 : : q n + m = T 1 : T 2 : : T n + m q t = T t / t = 1 n + m T t
Step 3: Fitness selection. Generate random probability P. The adaptive selection probability P0 based on hormone regulation is set by Equation (10). Several individuals are selected in the random population. Then, the best individual (qmax) and the worst individual (qmin) are marked among them. If the random probability P < P0, the optimal individual is selected to enter the next generation; otherwise, the worst individual is selected to enter the next generation.
Step 4: Crossover operation. The two-points crossover (TPX) is used for iterative operation. The probability of crossover in the genetic algorithm based on the hormone regulation mechanism is set by Equation (11). If P < Pc, select an individual in the random population according to step 3, and then perform the TPX operation with an individual in the high-quality population. If P < 1 − Pc, two individuals in the random population are selected to perform the TPX operation according to step 3.
Step 5: Mutation operation. If P < Pm, perform the mutation rule. Otherwise, the mutation operation is not carried out to judge whether the algorithm converges.
Step 6: Hybrid particle swarm optimization algorithm. After the genetic operator is completed, the better solution obtained in the genetic algorithm is used as the reference individual. Based on the particle swarm optimization algorithm, the velocity and position of each individual are iteratively calculated.
Step 7: Evaluate whether the updated particle swarm satisfies the convergence condition. If not satisfied, continue to perform steps 2 to 6. After the algorithm is terminated, the optimal individual found by the particle swarm optimization algorithm in the whole process is output as the optimal solution.

5. Analysis and Discussion

5.1. Case Study and Analysis

5.1.1. Leakage Monitoring Scheme Design

In order to verify the effectiveness of the multi-point monitoring data grid model and inversion positioning method for natural gas leakage in oil and gas stations proposed in this study, an oil and gas station was taken as an example to conduct on-site leakage monitoring and simulation tests. Assuming that leakage occurs in the pipeline area of the oil and gas station, the gas release test is carried out at the gas transmission line, and the leakage point coordinates are (37.38, 35.12, 1.50). Firstly, the key monitoring function areas of the oil and gas station are divided and the monitoring points are prioritized for deployment according to the leakage risk assessment of the process equipment. In addition, considering the law of gas leakage and diffusion under the influence of obstacles, a leakage monitoring scheme of a point-type laser methane sensor is designed:
(1)
The effective monitoring area of the point-type laser methane sensor is 20~25 m2. Therefore, when the point laser methane detector is deployed, it is necessary to cover the major dangerous leakage sources of the oil and gas station.
(2)
In order to ensure the accuracy of the monitoring data, the point laser methane detector is installed at the point at which the probability of leakage is greatest in each functional area of the oil and gas station. For example, the pump body area is installed in the reciprocating pump body with the greater probability of leakage; the pipeline area should be arranged at the conveying pipe with a larger inner diameter.
(3)
The installation spacing of each point laser methane detector is set to 10~15 m, and the distance between each monitoring node is as equal as possible, so that the time difference of data transmission can be controlled within a certain range.
(4)
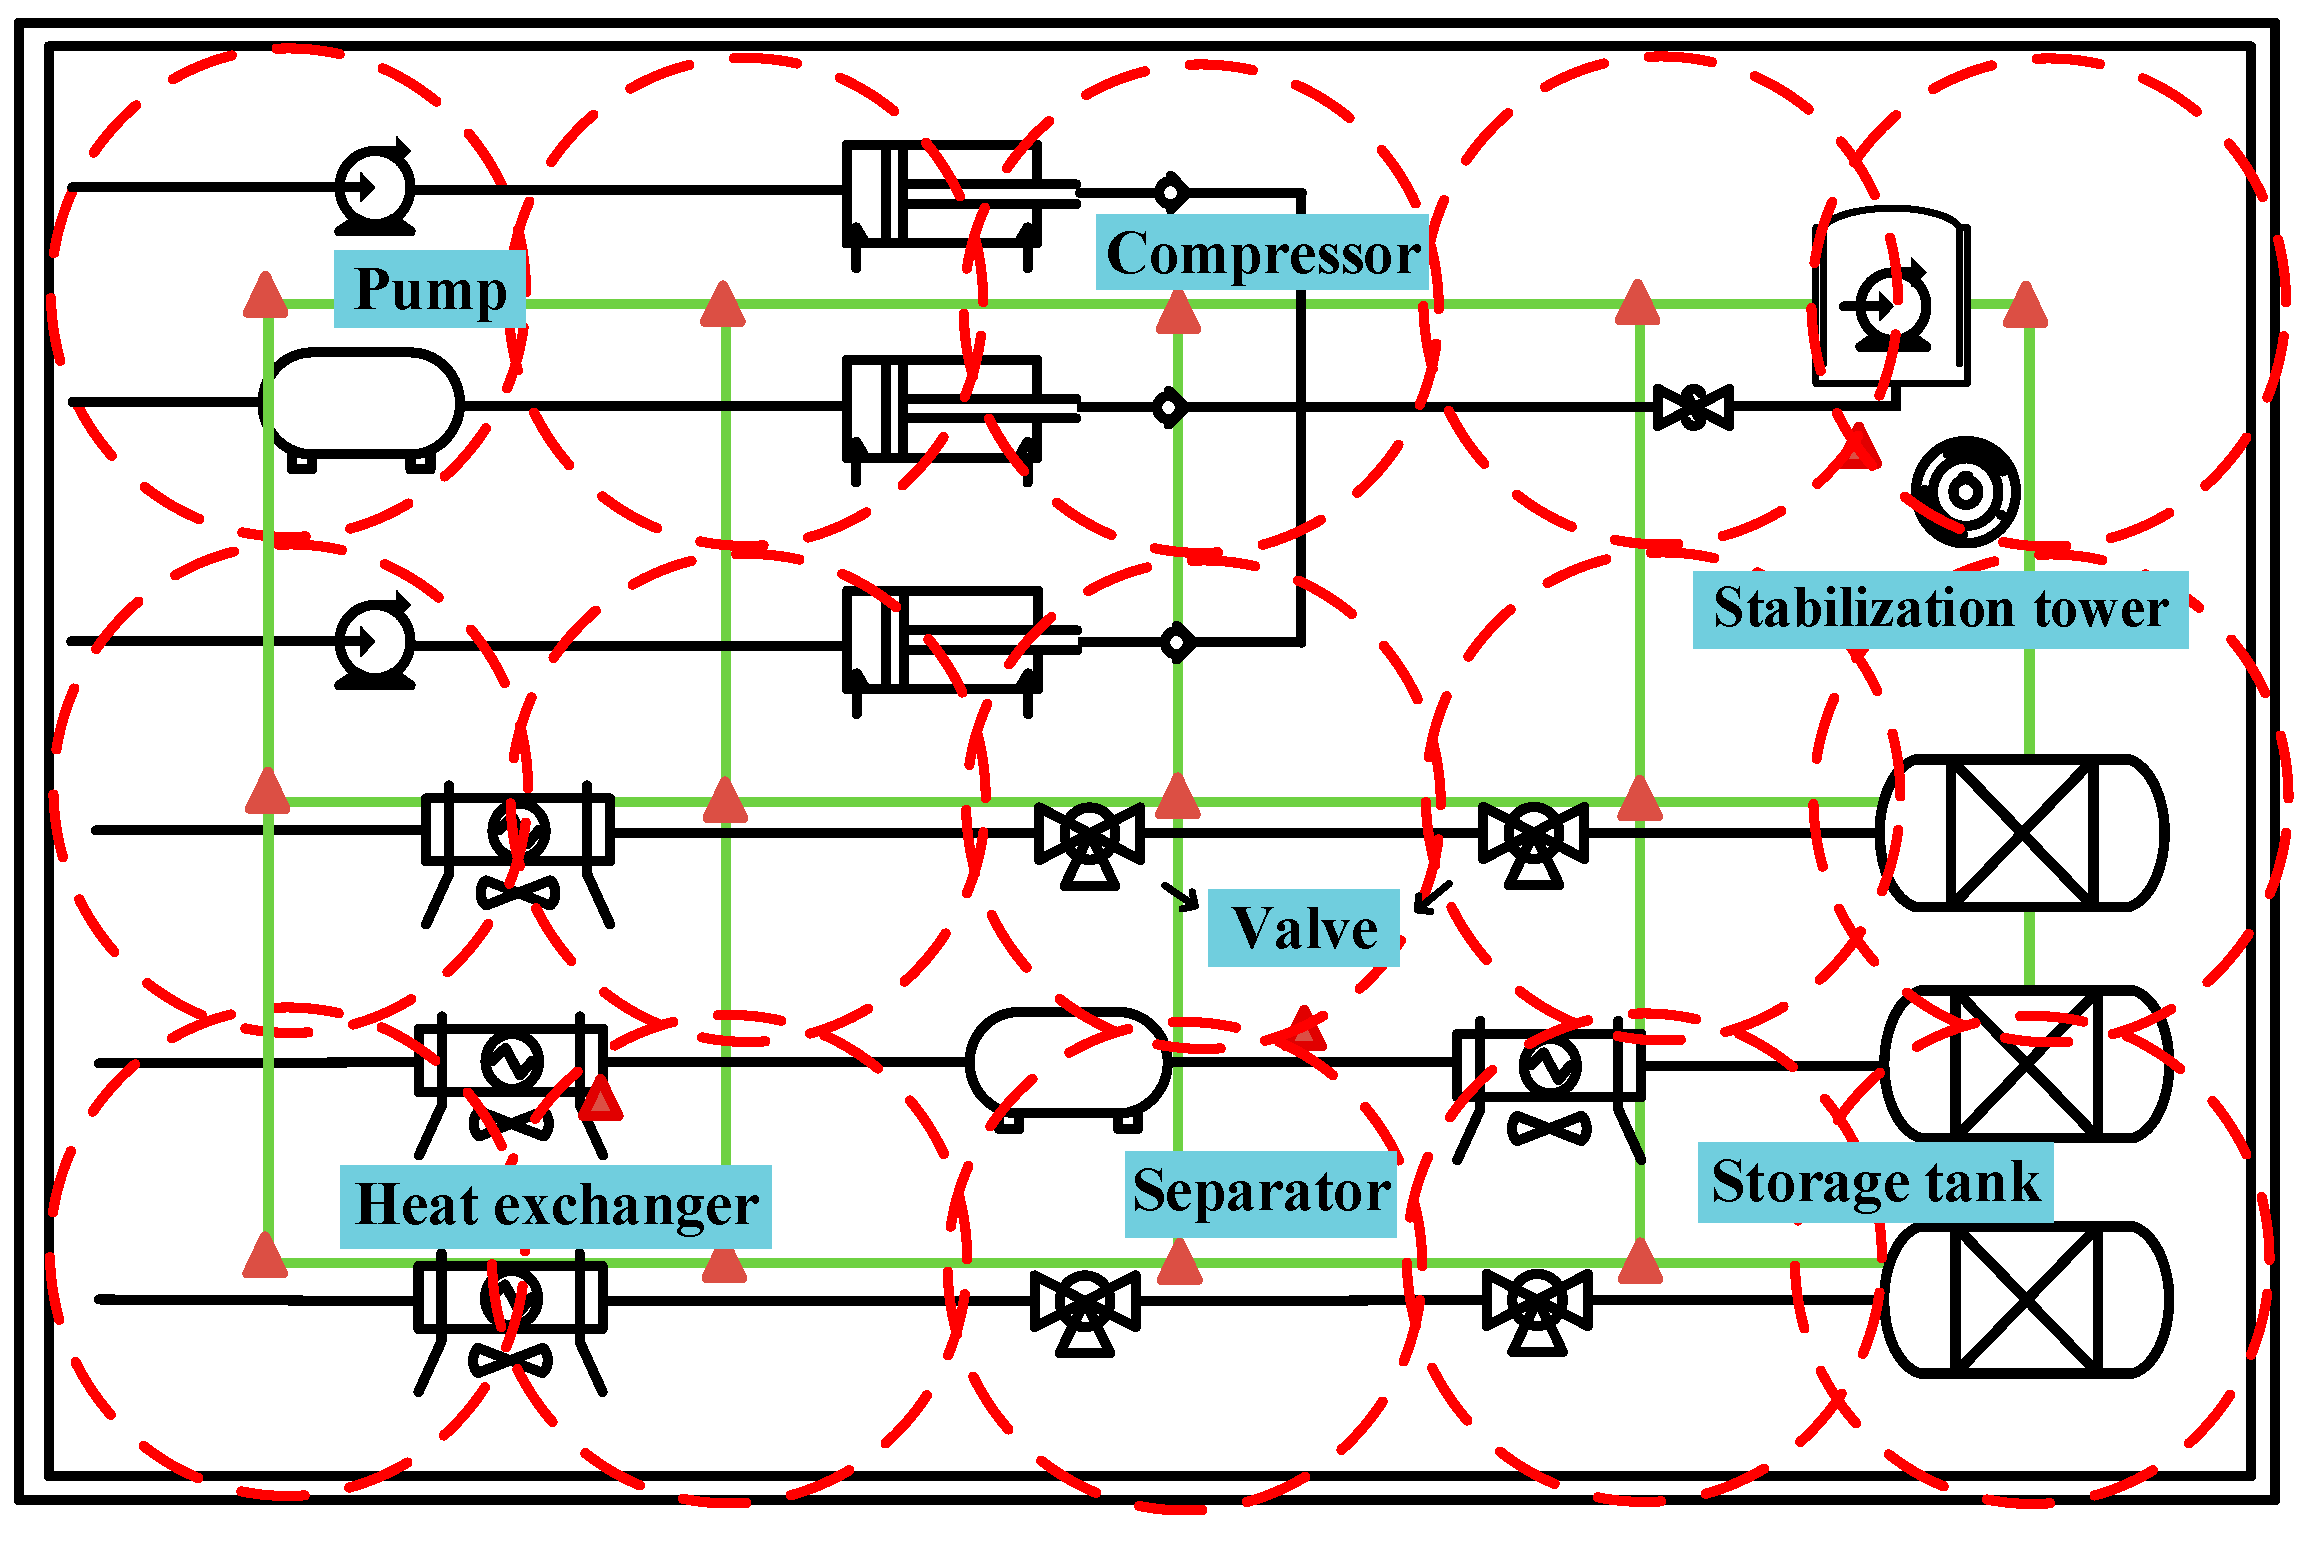
Each point laser methane detector should stagger the ground pipeline to facilitate equipment layout and pipeline maintenance. The effective monitoring area of the point laser methane detector should not be overlapped to make full use of the effective monitoring area.
(5)
The point laser methane detector should be arranged on the wind side of the minimum-frequency wind direction of the major dangerous leak source, and the monitoring point should not be more than 2 m away from the natural gas leak source.
(6)
Monitoring points should not be installed in staggered pipeline ranges. If obstacles such as large devices and pipelines are encountered, these should be installed on the windward side of the obstacles and a certain distance should be kept from the obstacles to avoid monitoring failure caused by obstacles.
(7)
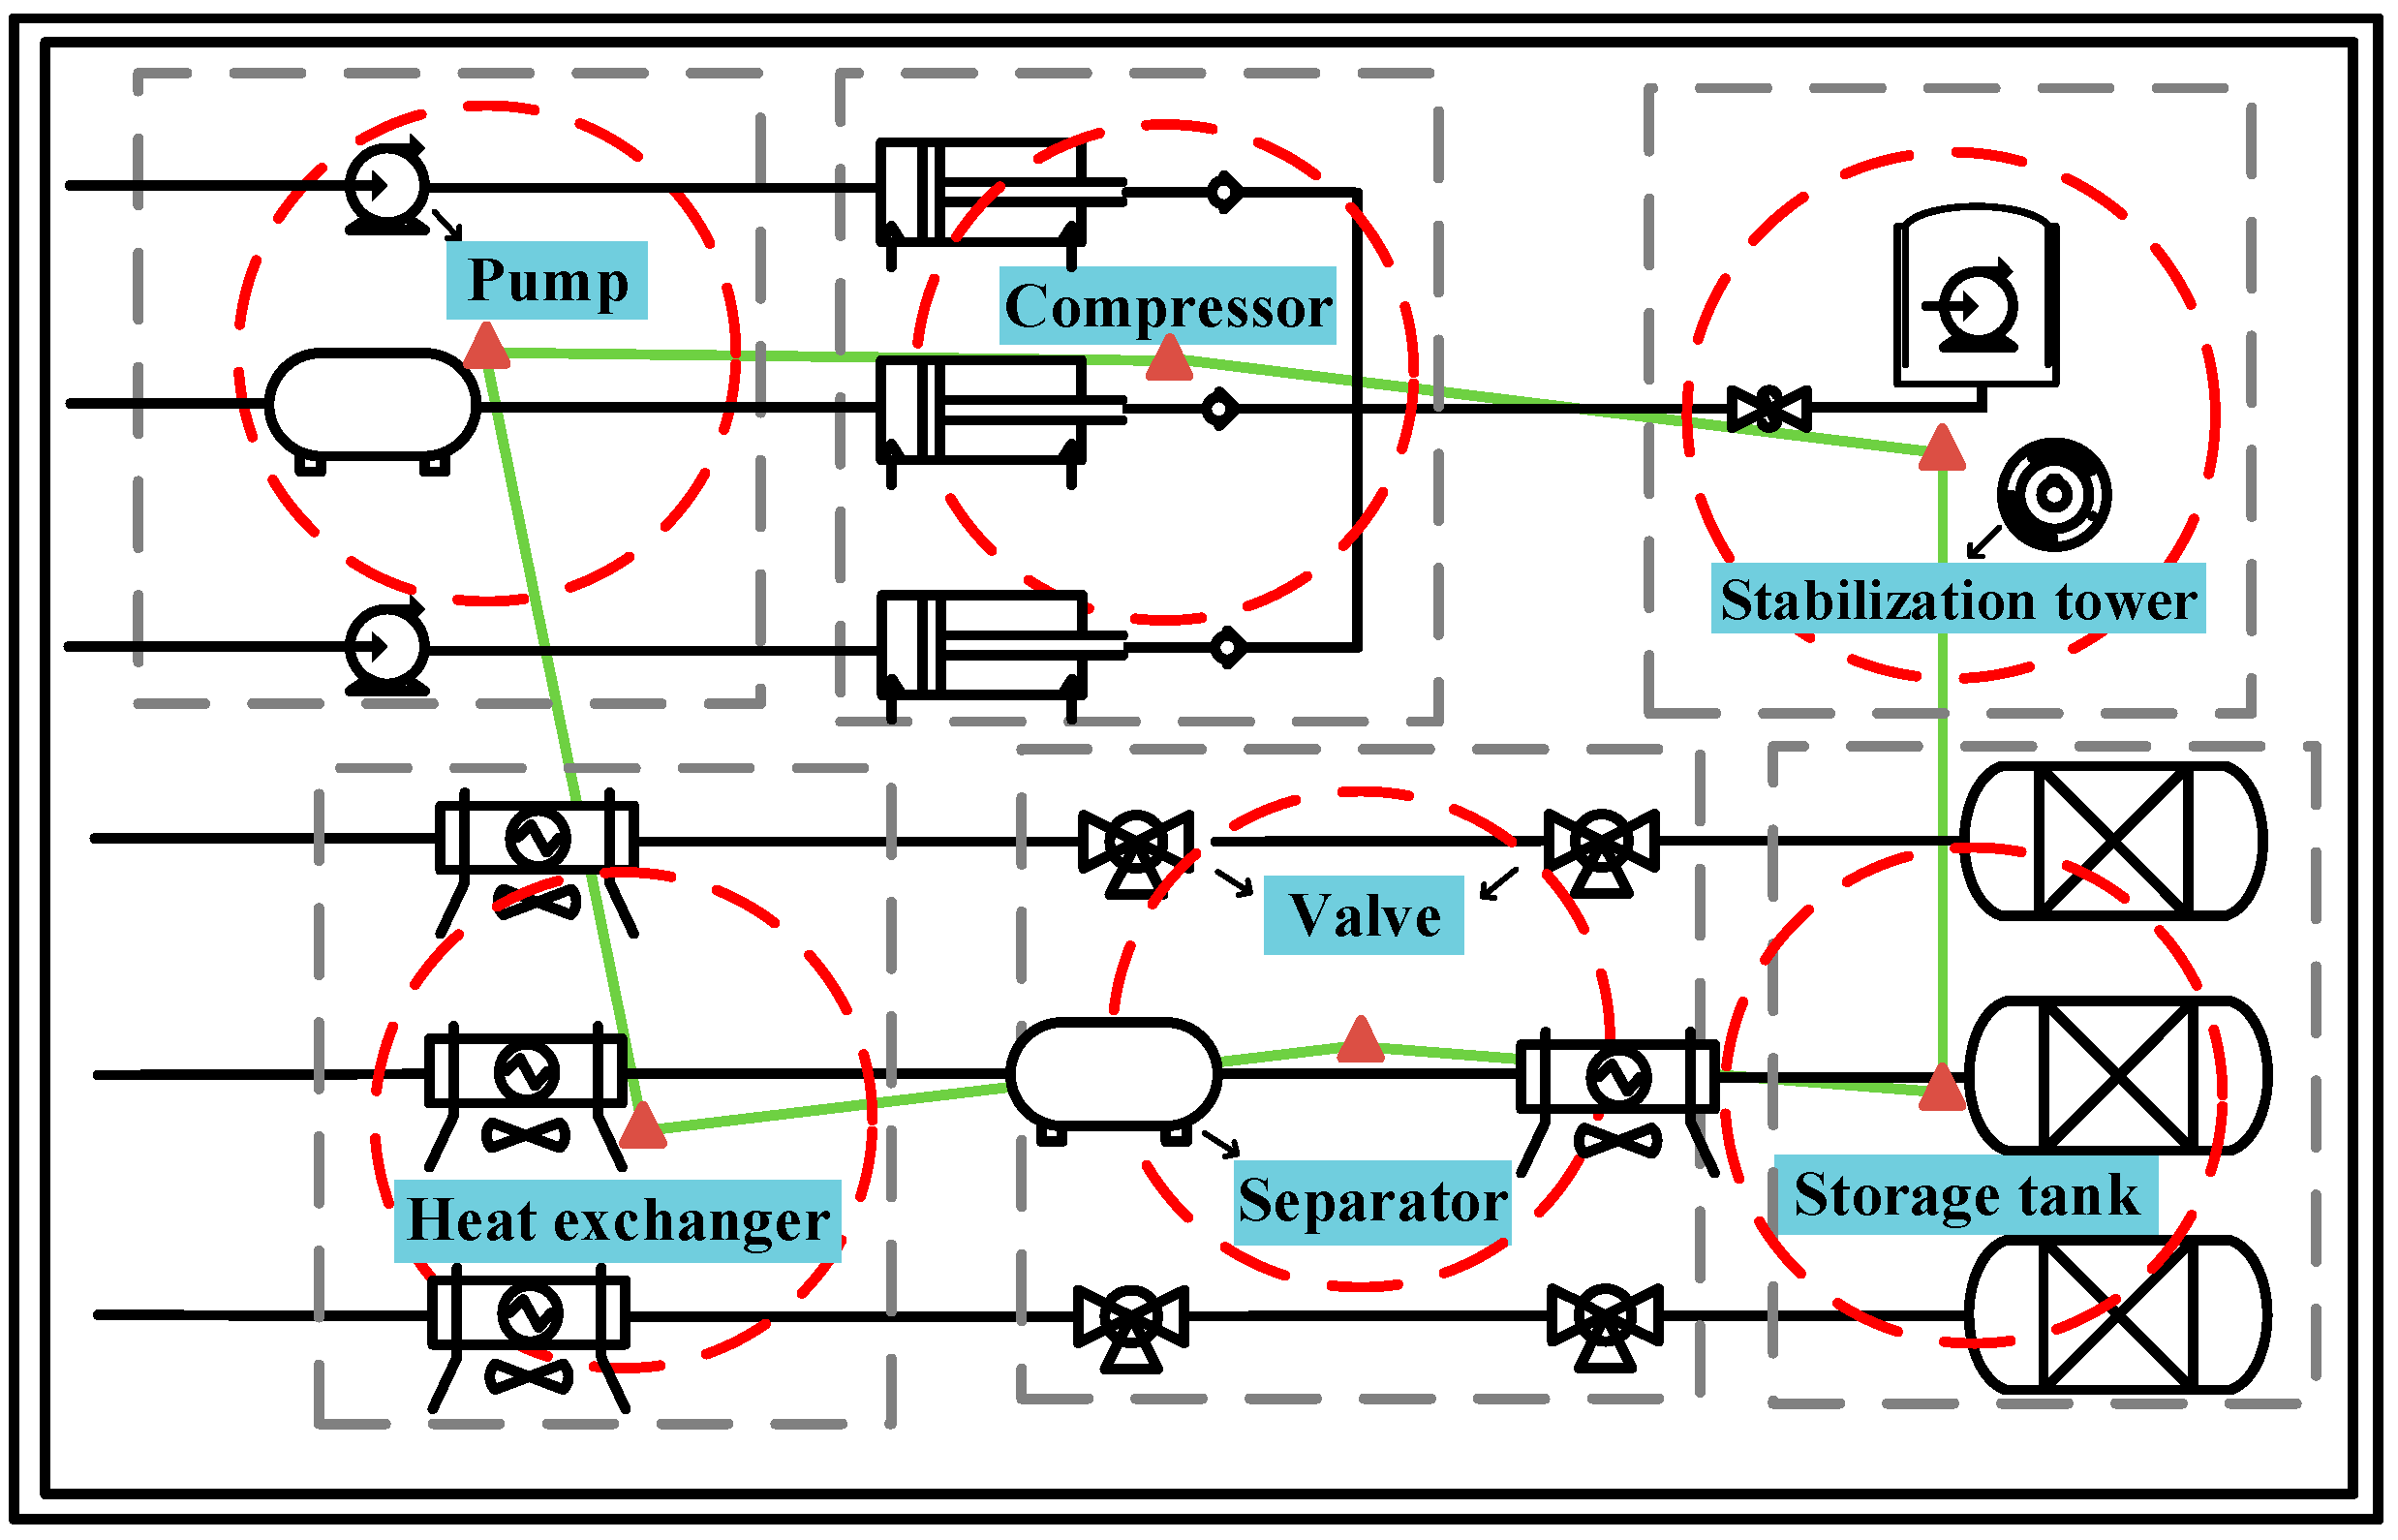
The monitoring point represents the monitoring space coordinate value, considering that the erection height affects the monitoring accuracy. Without the influence of surrounding obstacles, the erection height shall exceed the process equipment. Under the influence of surrounding obstacles, the erection height should be preferably lower than the erection height. An example of the leakage monitoring arrangement of the oil and gas station is shown in Figure 8.
Finally, the monitoring point data C x i , y i , z i are obtained, among which the coordinate data information is shown in Table 3. According to the main characteristics of the oil and gas station, the real-time monitoring value of the leakage gas concentration in the monitoring area is accurately obtained after the point optimization layout in the station function area. In addition, data interpolation is comprehensively used to monitor the unknown region. The known monitoring points are regarded as discrete points, and the values of the unknown points are inferred through the relationship between these points. The monitoring points and data interpolation points constitute the multi-point monitoring data grid model of gas leakage in the oil and gas station (Figure 9). The monitoring data of the gas leakage concentration are stored in the cloud database. After monitoring the leakage in the whole covered area of the oil and gas station, the preliminary monitoring and early warning of the station can be realized.

5.1.2. Analysis of Inverse Positioning Results

Based on the inverse positioning method of the IGA, the leakage location problem is simulated and verified by using MATLAB software (MATLAB R2023b). The values of the set test parameters are shown in Table 4. According to the following test parameters, the convergence of each parameter after simulation is shown in Figure 10. According to the convergence situation, all inversion parameters converge within 60 iterative steps.
Due to the randomness of the leak location and the non-repeatability of the results of the IGA, in order to eliminate accidental interference, it is usually repeated many times in each test to obtain the average performance. In this study, the results of 100 simulation experiments were used to analyze the error between the simulation results and the actual results by using three indexes: Mean Absolute Error (MAE), Root Mean Square Error (RMSE) and R-Square (R2). The error analysis of the simulation results is shown in Table 5. It can be seen that R2 > 0.6, and that the MAE and RMSE of the positioning algorithm meet the practical application requirements. Due to the influence of the external environment and the accuracy of the sensor, errors will inevitably occur, so the inverse positioning method based on the IGA is analyzed.
M A E = 1 N i = 1 N | f ^ f i |
R M S E = 1 N i = 1 N ( f ^ f i ) 2
R 2 = 1 Σ i = 1 N ( f ^ f i ) 2 Σ i = 1 N ( f ¯ i f i ) 2
where f ^ is the actual data value of the leakage source; f i and   f ¯ i are the leakage source simulation value and average value, respectively; and N is the number of simulation results and is 100.
(1)
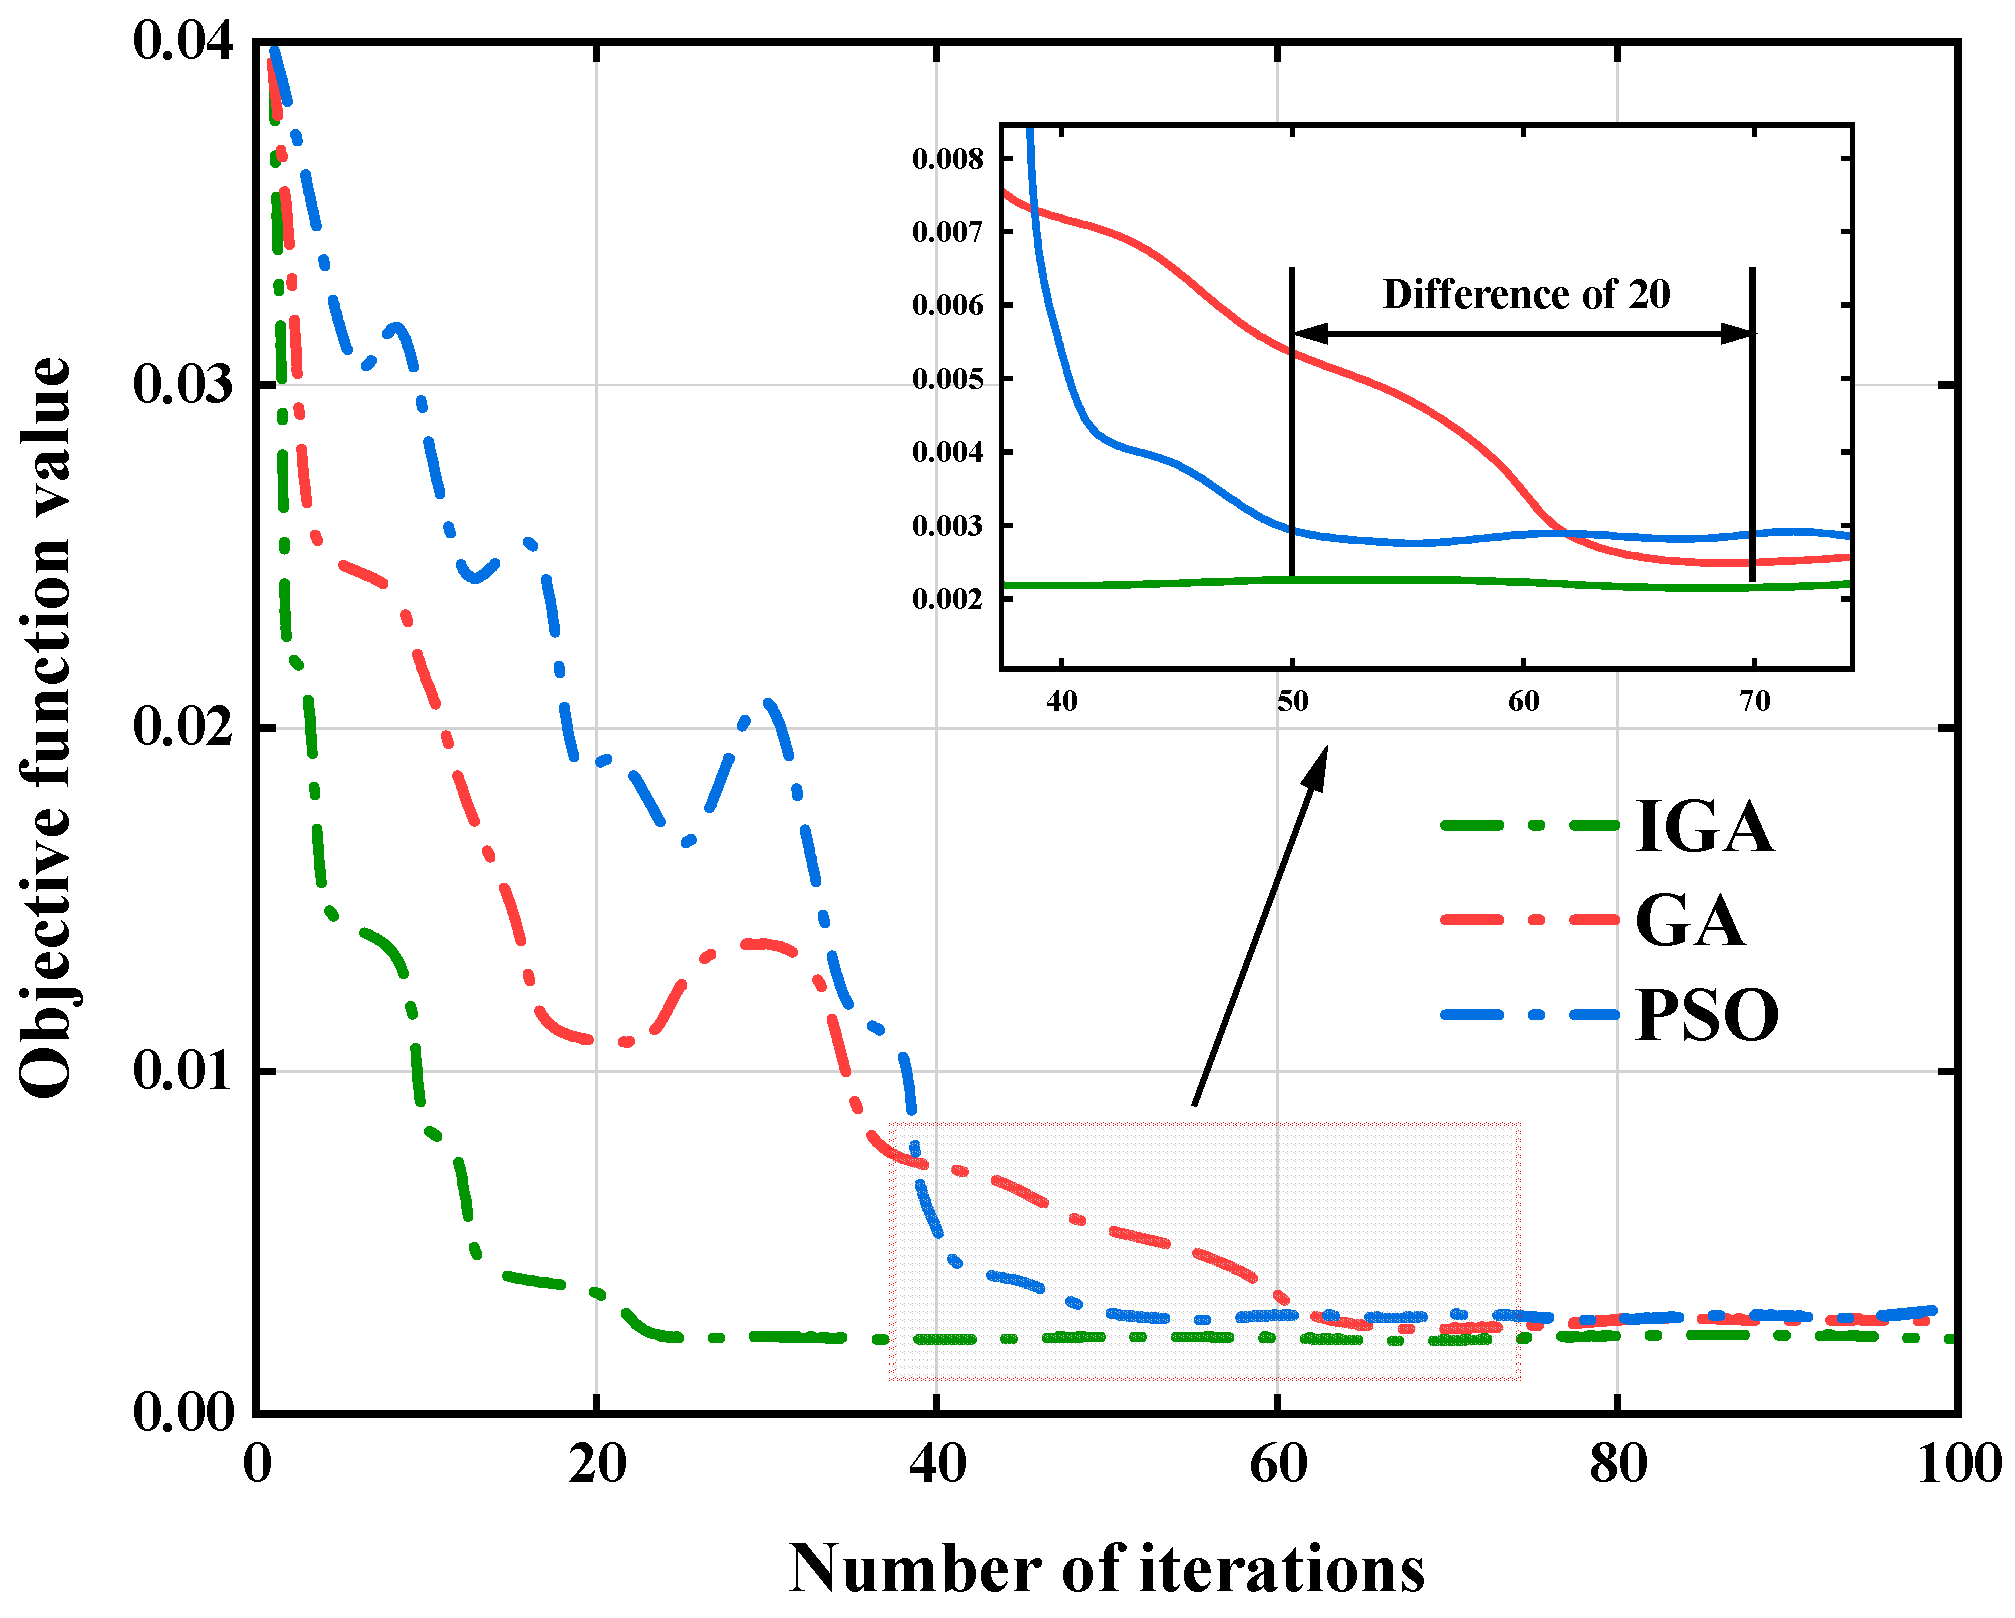
Algorithm performance comparison
With the increase in the number of iterations, the objective function tends to converge after the 25th iteration step and reaches the theoretical optimal value 0. The positioning performance of the GA, PSO and IGA are compared under the same parameters. The simulation results and iterative convergence of the three positioning algorithms are shown in Table 6 and Figure 11. It can be seen from the error parameters that the IGA is more consistent with the real value of the leakage source in terms of location accuracy, and has a faster convergence speed.
(2)
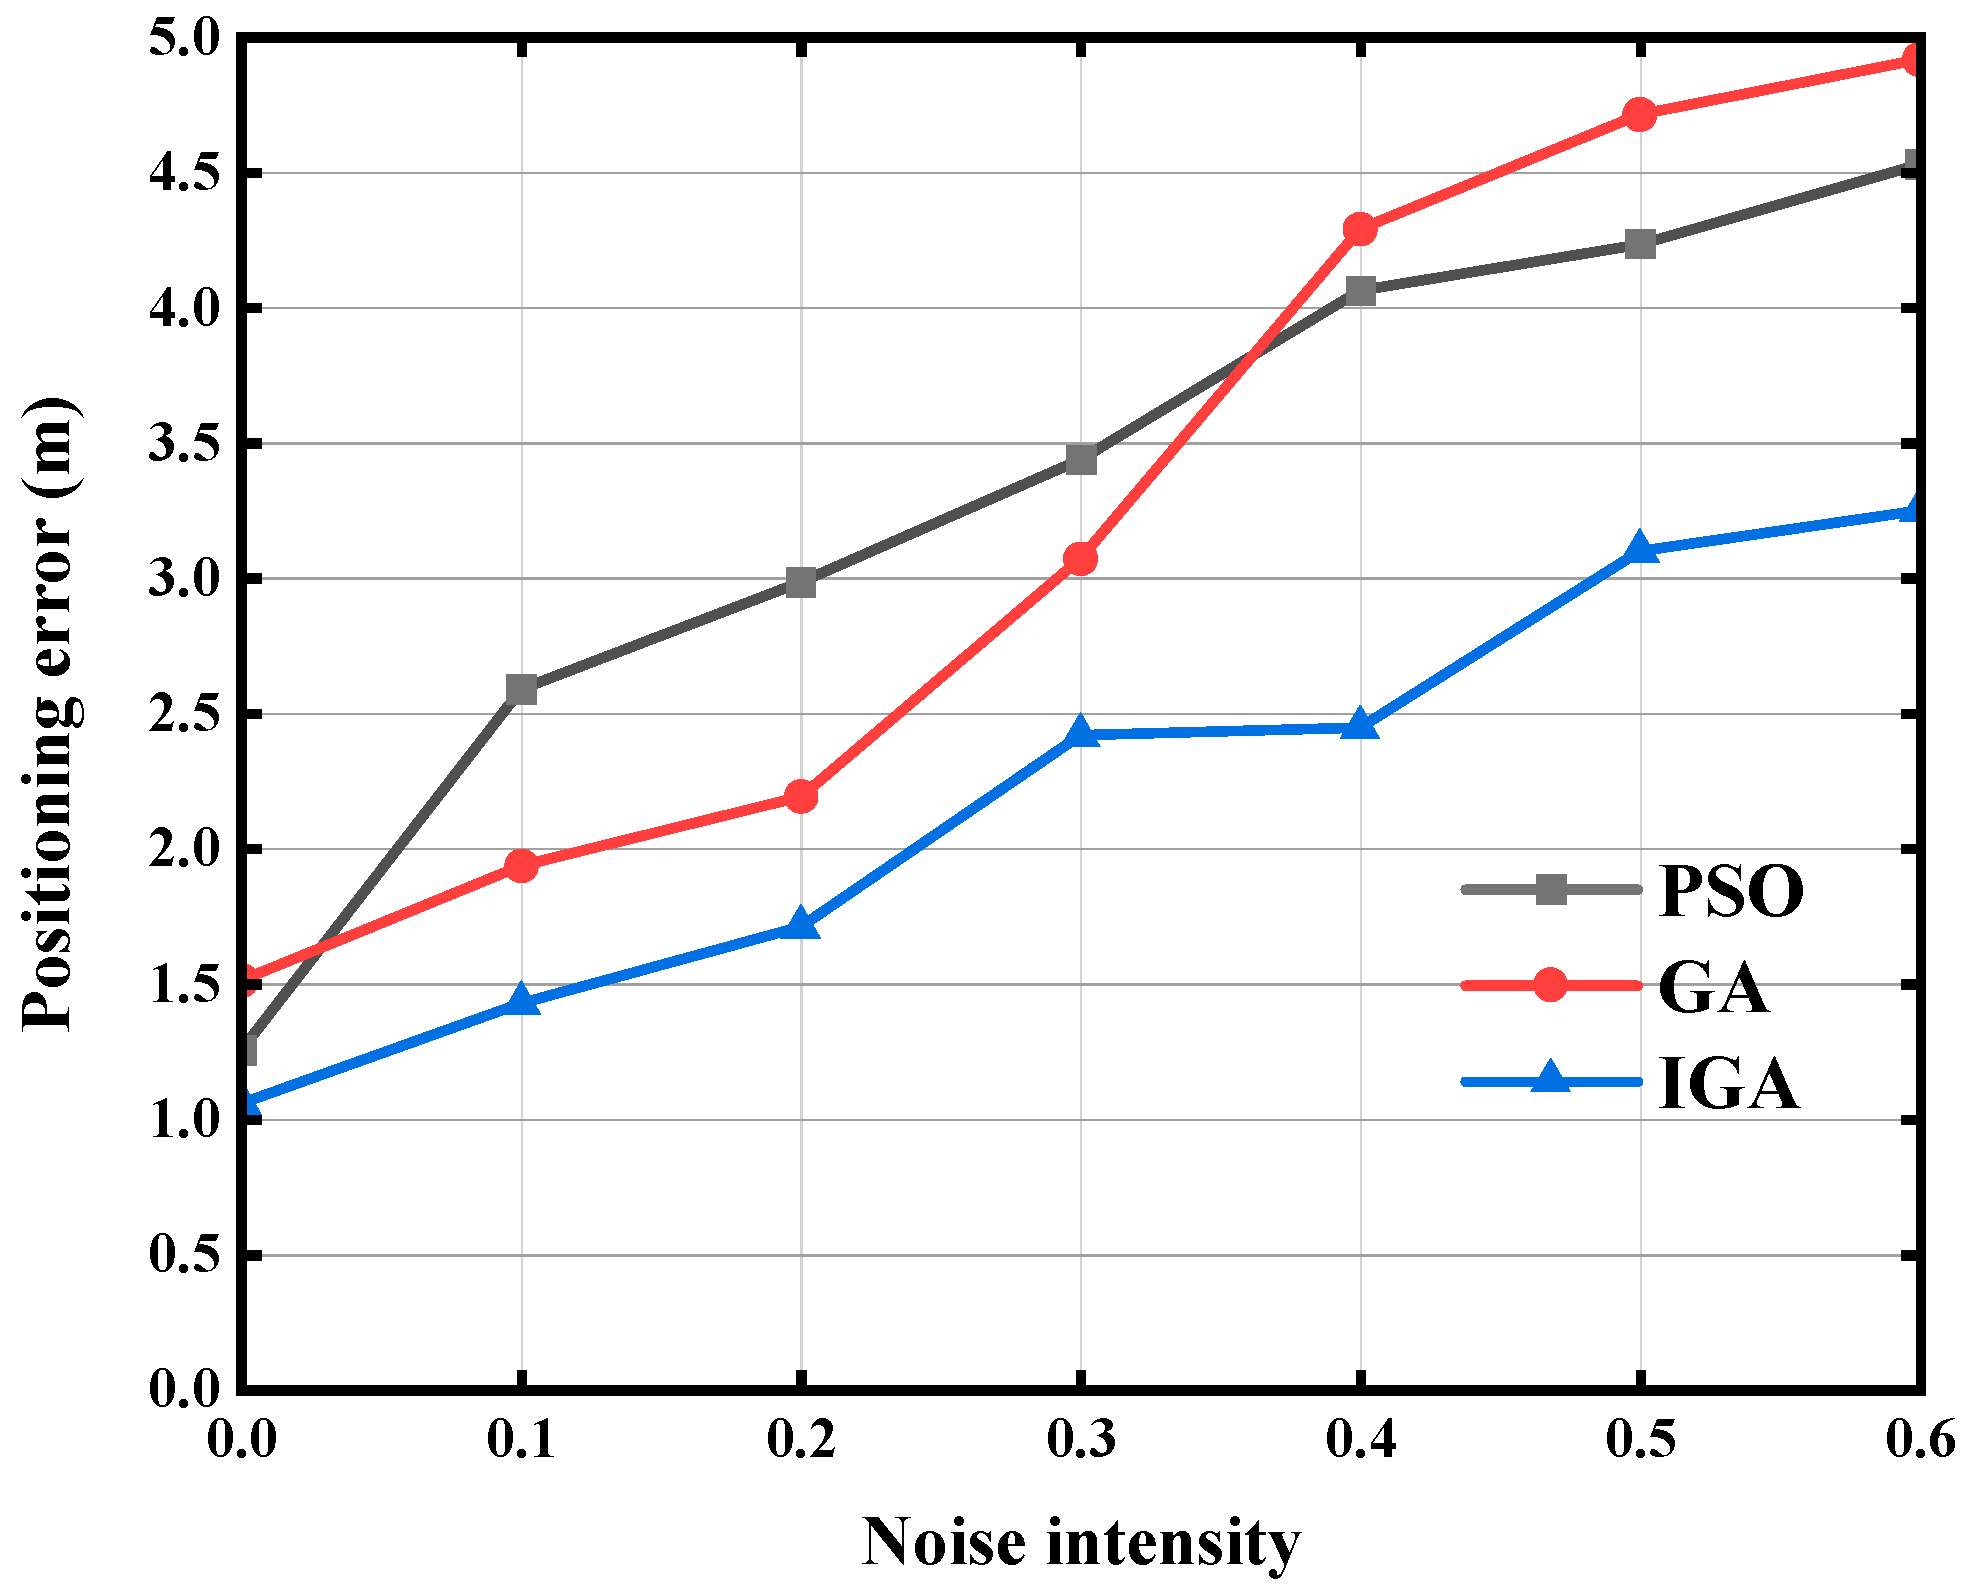
The robustness verification
Considering the difference between the theoretical diffusion model and the actual gas diffusion, as well as the fact that there are errors in the gas concentration collected in the actual monitoring environment, abnormal parameters need to be added in the simulation experiment. Assuming that the gas leak detection sensor is affected by external “outliers”, in order to verify the influence of different outliers on leakage location, white Gaussian noise with different percentages of its own concentration is used to simulate the actual monitoring environment. The gas concentration value collected by each sensor node can be expressed as follows:
D ( x i , y i , z i ) = C ( x i , y i , z i ) + E i
where E i is zero mean Gaussian white noise, satisfying the normal distribution N~ ( μ , σ 2 ) ; D ( x i , y i , z i ) is noise data.
The change results for the positioning accuracy are shown in Figure 12. It can be seen that, as the proportion of Gaussian white noise increases, the positioning error also increases. Compared with other positioning algorithms, the position error of the IGA is more stable. When the noise value reaches 50%, the error of the calculation results of this research method is about 3 m, which has a certain guiding role in the location of leakage sources in oil and gas stations to a certain extent. In addition, in the case of the same noise intensity, the greater the concentration measurement value, the higher the signal-to-noise ratio. Therefore, in the actual calculation of leakage source inversion and location, the nodes with a higher concentration in the multi-point monitoring data grid should be used as much as possible.

5.2. Discussion

(1)
The advantages of optimal layout of monitoring points
Traditional layout method: In previous studies, leakage source inversion localization based on multi-objective optimization algorithms have used an array of point placements to obtain sufficient monitoring point data. An example of a monitoring program is shown in Figure 13. However, an oil and gas station is complex and its equipment is widely distributed, which means that the requirement of a large number of equipment deployments cannot be met. On the one hand, a large number of monitoring points cannot meet the goal of refined cost management. On the other hand, the reduction in monitoring points causes insufficient data sample points, which in turn causes insufficient accuracy in the calculation of the parameters of positioning algorithms. Table 1 summarizes the advantages and disadvantages of the three types of laser methane detectors (point-type laser methane sensor, open-circuit laser methane sensor, gimbal-mounted Laser Methane Remote Sensing Instrument). The optimal layout of the monitoring points of the point-type laser methane sensor is the focus of this research. Previous studies have prioritized the deployment of points based on the probability of leakage risk as a weighting scheme, which did not fully utilize the effective monitoring range of the equipment and made it difficult to achieve the full coverage of oil and gas stations.
Point position optimization layout model: According to the qualitative risk management experience analysis and quantitative risk assessment model, the leakage probability distribution is determined, so as to divide the major hazard sources in the functional area. Based on CFD simulation, the influence of obstacles on leakage monitoring is avoided, which provides theoretical guidance for the optimal layout of monitoring points. This makes the deployment of monitoring points more reasonable, and the effective monitoring range does not overlap, fully utilizing the effective monitoring area of methane detectors. The cost of equipment installation and deployment can be saved, and additional installation and maintenance equipment can be guaranteed. The multi-point monitoring data grid model (Figure 9) is closely related to the accuracy of data interpolation. While the accuracy of the monitoring points is improved, the accuracy of the interpolation of the concentration monitoring data in other areas is improved at the same time. The efficiency and accuracy of leakage monitoring in the oil and gas station are improved.
(2)
Advantages of data interpolation method
The multi-point monitoring data grid model based on the interpolation method does not need to be laid out in every corner of the gas storage well site. It is only necessary to focus on the monitoring of major dangerous leakage sources in the functional area of oil and gas stations. The equipment cost and layout cost can be reduced. The data interpolation method supplements the monitoring value of the gas leakage concentration in the station to achieve the goal of full-coverage monitoring. Compared with high-density layout point monitoring, the multi-point monitoring data grid model has the advantage of a high cost performance, which can achieve the purpose of “reducing cost and increasing efficiency”.
The gas leakage inversion positioning model based on the multi-objective optimization algorithm needs to provide sufficient sample points, so it is necessary to ensure the accuracy of the monitoring points and data interpolation points. The detection accuracy of the point laser methane detector can reach 1 ppm, providing accurate monitoring point concentration data. In this study, the data interpolation method based on data fusion can provide more efficient and accurate gas leakage monitoring data interpolation. As shown in Figure 14a, by comparing the computational efficiency and data error, it can be seen that comprehensive interpolation can obtain interpolation more efficiently and reduce data error. Based on the known monitoring points and data interpolation points provided, abundant and accurate sample points Q x j , y j , y j are provided, and the accuracy of leakage source calculation is improved. The accuracy error of the number of sample points on the leakage location and leakage concentration is shown in Figure 14b. It can be seen that, as the sample points increase, the simulation time increases relatively, and the leakage point position error decreases continuously.

6. Summary and Conclusions

This paper studies how full-coverage monitoring and leakage location in oil and gas stations can be realized. A multi-point monitoring data grid model suitable for oil and gas stations is established. It establishes the optimal layout scheme of the monitoring points of the point laser methane monitor and realizes the full-coverage monitoring of the station based on the optimized data interpolation. Based on the multi-objective optimization algorithm, a numerical model of natural gas leakage inversion positioning is established. Through the comparative analysis of numerical calculation, the following conclusions are drawn:
(1)
Previous studies that are only based on the risk probability of the monitoring point layout are not enough. Through CFD numerical simulation, obstacles increase the difficulty of gas leakage monitoring. Although the point laser methane monitor has the advantages of high precision and a short response time, the influence of obstacles should be avoided in the process of optimizing the layout of monitoring points.
(2)
Optimized data interpolation based on data fusion plays a significant role in leakage monitoring and the inversion positioning of oil and gas stations. The optimized data interpolation generation is more efficient, and the R 2 coefficient reaches 0.867. This not only improves the monitoring efficiency of oil and gas stations, but also provides accurate and abundant sample points for the inversion positioning numerical model. It reduces the economic cost of the point layout and meets the refined cost management goal of “cost decreasing and benefit increasing”.
(3)
The convergence performance of the IGA is improved compared with the GA, as confirmed by the numerical simulation of different algorithms. By studying the influence of the number of sample points and outliers on the convergence effect and positioning accuracy of the algorithm, it can be found that the improved genetic algorithm has a better convergence effect, and the R 2   coefficient reaches 0.915. Through the robustness test of the IGA, considering the spatial characteristics and environmental factors of the oil and gas station, the inversion results basically meet the needs of leakage source location.
(4)
This study belongs to the field of petrochemical industry, and can provide a theoretical basis for the location of leakage sources in gas storage gathering stations, Liquefied Natural Gas (LNG)receiving stations and other stations. At present, in the process of experimental tests and research on oil and gas station leakage location, this paper preliminarily verifies the generalizability of the single-point leakage monitoring and inversion positioning model. We hope to continue to carry out multi-point leakage monitoring and positioning research and promote the optimization of the model.

Author Contributions

Conceptualization, G.M.; methodology, H.H.; software, H.H.; validation, G.M.; writing—original draft preparation, H.H.; writing—review and editing, G.M.; project administration, G.M. All authors have read and agreed to the published version of the manuscript.

Funding

This research received no external funding.

Institutional Review Board Statement

Not applicable.

Informed Consent Statement

Not applicable.

Data Availability Statement

Data are contained within the article.

Acknowledgments

The authors would like to thank the State Key Laboratory of Geomechanics and Geotechnical Engineering, Institute of Rock and Soil Mechanics, Chinese Academy of Sciences, for providing the testing sites and materials used for experiments.

Conflicts of Interest

The authors declare no conflicts of interest.

Abbreviations

CFDComputational Fluid Dynamics
GAGenetic Algorithm
PSOParticle Swarm Optimization
RMSERoot Mean Square Error
LELLower Explosion Limited
IGAImproved Genetic Algorithm
MAEMean Absolute Error
TPXTwo-point Crossover
LNGLiquefied Natural Gas

References

  1. Xiangyu, M.; Mingyun, C.; Alun, G.; Xinguo, W.; Bin, L.; Jian, Z.; Zongqiang, M. China’s hydrogen development strategy in the context of double carbon targets. Nat. Gas Ind. B 2022, 9, 521–547. [Google Scholar]
  2. Xurong, S.; Yixuan, Z.; Yu, L.; Wenbo, X.; Gang, Y.; Xin, L.; Bofeng, C.; Dan, T.; Jinnan, W. Air quality benefits of achieving carbon neutrality in China. Sci. Total Environ. 2021, 795, 148784. [Google Scholar]
  3. Raza, S.S.A.; Qianxiao, Z.; Jaffar, A.; Daniel, B.-L.; Ladislav, P. Technology, Urbanization and Natural Gas Supply Matter for Carbon Neutrality: A New Evidence of Environmental Sustainability under the Prism of COP26. Resour. Policy 2023, 82, 103465. [Google Scholar]
  4. Gao, Q.; Wei, B.; Zhang, Z.; Liu, Q.; Sun, H.; Wang, Z.M.; Song, G.-L. Statistical Analysis of the Spatial Transmission of Pipeline Failures in an Oil Treatment Station at Sinopec Tahe Oilfield. J. Pipeline Syst. Eng. Pract. 2022, 13, 04022023. [Google Scholar] [CrossRef]
  5. Ying, L.; Yueming, L.; Jingwen, W.; Xibei, Z.; Wangsheng, C. Analysis on Causative Factors and Evolution Paths of Blast Furnace Gas Leak Accident. Energies 2022, 15, 5622. [Google Scholar]
  6. Zheng, H.; Kong, S.; Xing, X.; Mao, Y.; Hu, T.; Ding, Y.; Li, G.; Liu, D.; Li, S.; Qi, S. Monitoring of volatile organic compounds (VOCs) from an oil and gas station in northwest China for 1 year. Atmos. Chem. Phys. 2018, 18, 4567–4595. [Google Scholar] [CrossRef]
  7. James, T.; Doug, M.-S.; Chris, G.; George, H.; Alexander, D.; Xiao, A.; Murray, R. Single photon Lidar gas imagers for practical and widespread continuous methane monitoring. Appl. Energy 2022, 306, 118086. [Google Scholar]
  8. Bayrakli, I. A single external cavity laser-based sensor for simultaneous detection and quantification of atmospheric methane and water vapor. Opt. Quantum Electron. 2018, 50, 1–9. [Google Scholar] [CrossRef]
  9. Forconi, E.; Kapelan, Z.; Ferrante, M.; Mahmoud, H.; Capponi, C. Risk-based sensor placement methods for burst/leak detection in water distribution systems. Water Supply 2017, 17, 1663–1672. [Google Scholar] [CrossRef]
  10. Jeon, K.; Yang, S.; Kang, D.; Na, J.; Lee, W.B. Development of surrogate model using CFD and deep neural networks to optimize gas detector layout. Korean J. Chem. Eng. 2019, 36, 325–332. [Google Scholar] [CrossRef]
  11. Dong, J.; Wang, B.; Wang, X.; Cao, C.; Chen, S.; Du, W. Optimization of sensor deployment sequences for hazardous gas leakage monitoring and source term estimation. Chin. J. Chem. Eng. 2023, 56, 169–179. [Google Scholar] [CrossRef]
  12. Yee, E. Theory for Reconstruction of an Unknown Number of Contaminant Sources using Probabilistic Inference. Bound. -Layer Meteorol. 2008, 127, 359–394. [Google Scholar] [CrossRef]
  13. Guohua, C.; Longkai, C. Enhancing Situation Awareness of Chemical Release Through Source Inversion. Procedia Eng. 2014, 84, 742–751. [Google Scholar] [CrossRef]
  14. Soldevila, A.; Blesa, J.; Jensen, T.N.; Sin, S.T.; Canti, R.M.F.; Puig, V. Leak Localization Method for Water-Distribution Networks Using a Data-Driven Model and Dempster-Shafer Reasoning. IEEE Trans. Control Syst. Technol. 2020, 29, 937–948. [Google Scholar] [CrossRef]
  15. Marcos, Q.-G.; Marlon, A.M.; Maibeth, S.R.; Silva Neto, A.J.; Orestes, L.-S. Robust leak localization in water distribution networks using computational intelligence. Neurocomputing 2021, 438, 195–208. [Google Scholar]
  16. Ossai, C.I.; Boswell, B.; Davies, I.J. Pipeline failures in corrosive environments—A conceptual analysis of trends and effects. Eng. Fail. Anal. 2015, 53, 36–58. [Google Scholar] [CrossRef]
  17. Xie, M.; Tian, Z. A review on pipeline integrity management utilizing in-line inspection data. Eng. Fail. Anal. 2018, 92, 222–239. [Google Scholar] [CrossRef]
  18. Yu, W.; Song, S.; Li, Y.; Min, Y.; Huang, W.; Wen, K.; Gong, J. Gas supply reliability assessment of natural gas transmission pipeline systems. Energy 2018, 162, 853–870. [Google Scholar] [CrossRef]
  19. Ma, D.; Zhang, Z. Contaminant dispersion prediction and source estimation with integrated Gaussian-machine learning network model for point source emission in atmosphere. J. Hazard. Mater. 2016, 311, 237–245. [Google Scholar] [CrossRef]
  20. Shuaiqi, Y.; Jitao, C.; Genserik, R.; Ming, Y.; Chao, C.; Jiansong, W. Safety barrier performance assessment by integrating computational fluid dynamics and evacuation modeling for toxic gas leakage scenarios. Reliab. Eng. Syst. Saf. 2022, 226, 108719. [Google Scholar]
  21. Verma, V.; Padding, J.T.; Deen, N.G.; Kuipers, J.A.M. Bubble formation at a central orifice in a gas–solid fluidized bed predicted by three-dimensional two-fluid model simulations. Chem. Eng. J. 2014, 245, 217–227. [Google Scholar] [CrossRef]
  22. Li, X.; Wang, Z.; Tian, G.; Liu, J.; Wang, P. Numerical Simulation of Combustible Gas Diffusion with Obstacle in Space. Procedia Eng. 2017, 205, 3670–3677. [Google Scholar] [CrossRef]
  23. Yingchun, X.; Jie, L.; Zuopeng, H.; Zhen, X.; Jin, Q.; Jinchi, Z. Numerical simulation and experimental study of gas diffusion in a ship engine room. Ocean Eng. 2023, 271, 113638. [Google Scholar]
  24. Zhiheng, X.; Zhao-Dong, X.; Hongfang, L.; Haoyan, P.; Zicong, X.; Yankun, J.; Hui, S. Leakage analysis and prediction model of underground high-pressure natural gas pipeline considering box culvert protection. Process Saf. Environ. Prot. 2023, 180, 837–855. [Google Scholar]
  25. Raoof, G.; Arshad, R.; Stefan, I. Leakage risk assessment of a CO2 storage site: A review. Earth-Sci. Rev. 2021, 223, 103849. [Google Scholar]
  26. Ghasemi, P.R.; Karimi, D.M.; Javad, M.; Esmaeil, Z.; Mohammad, Y. An advanced framework for leakage risk assessment of hydrogen refueling stations using interval-valued spherical fuzzy sets (IV-SFS). Int. J. Hydrogen Energy 2023, 48, 20827–20842. [Google Scholar]
  27. Xueyan, W.; Xiong, Z.; Wei, G. Flammable gas leakage risk assessment for methanol to hydrogen refueling stations and liquid hydrogen refueling stations. Int. J. Hydrogen Energy 2024, 54, 1286–1294. [Google Scholar]
  28. Kang, C.; Bin, S.; Wenling, J.; Wuge, Y.; Tianjie, L.; Hanyue, Z.; Juan, D. Quantitative risk assessment of gas leakage and explosion accidents and its security measures in open kitchens. Eng. Fail. Anal. 2021, 130, 105763. [Google Scholar]
  29. Spouge, J. New generic leak frequencies for process equipment. Process Saf. Prog. 2005, 24, 249–257. [Google Scholar] [CrossRef]
  30. Hao, L.; Xuewen, C.; Huimin, D.; Lin, T.; Yanbo, S.; Jiang, B. Numerical simulation of leakage and diffusion distribution of natural gas and hydrogen mixtures in a closed container. Int. J. hydrogen Energy 2022, 47, 35928–35939. [Google Scholar]
  31. Jitao, C.; Jiansong, W.; Shuaiqi, Y.; Desheng, K.; Xiaole, Z. Prediction of gas leakage and dispersion in utility tunnels based on CFD-EnKF coupling model: A 3D full-scale application. Sustain. Cities Soc. 2022, 80, 103789. [Google Scholar]
  32. Mariagrazia, O.; Giansergio, M.; Marilena, G.; Angelo, S.; Pietro, P.; Hongpeng, W.; Lei, D.; Vincenzo, S. Characterization of H2S QEPAS detection in methane-based gas leaks dispersed into environment. Photoacoustics 2023, 29, 100438. [Google Scholar]
  33. Wei, Y.; Wu, W.; Yu, H.; Lu, J.; Huang, M.; Guo, M. Forecasts for the concentration of petroleum gas leakage diffusion under different liquid level heights of a sealing ring of sizeable floating roof tank. Sci. Rep. 2022, 12, 19124. [Google Scholar] [CrossRef] [PubMed]
  34. Yang, L.; Zhong, B.; Xu, X.; Liang, Z. Application of a semivariogram based on a deep neural network to Ordinary Kriging interpolation of elevation data. PLoS ONE 2022, 17, e0266942. [Google Scholar] [CrossRef]
  35. Xin, S.; Li, K.X.; Xin, D. Application of a Data Interpolation Algorithm in Earthquake Data Interpretation. Appl. Mech. Mater. 2013, 443, 194–197. [Google Scholar]
  36. Luo, X.; Meng, X.; Gan, W.; Chen, Y. Traffic Data Imputation Algorithm Based on Improved Low-Rank Matrix Decomposition. J. Sens. 2019, 2019, 1–11. [Google Scholar] [CrossRef]
  37. Bolun, W.; Xin, J.; Guanying, H.; Cheng, S.; Dongming, Y.; Zhiming, Z. Key-Point Interpolation: A Sparse Data Interpolation Algorithm based on B-splines. J. Phys. Conf. Ser. 2021, 2068, 012010. [Google Scholar]
  38. Alper, K.; Navarro, T.P.R.; Daniele, L. A genetic algorithm tool for conceptual structural design with cost and embodied carbon optimization. Eng. Appl. Artif. Intell. 2022, 112, 104711. [Google Scholar]
  39. Wang, J.; Zhang, R.; Yan, Y.; Dong, X.; Li, J.M. Locating hazardous gas leaks in the atmosphere via modified genetic, MCMC and particle swarm optimization algorithms. Atmos. Environ. 2017, 157, 27–37. [Google Scholar] [CrossRef]
  40. Yachen, L.; Yufan, T.; Qi, Z.; Jiaquan, D. Prediction Model for the Chemical Futures Price Using Improved Genetic Algorithm Based Long Short-Term Memory. Processes 2023, 11, 238. [Google Scholar]
  41. Fangchen, H.; Yuhan, C.; Wenzhou, L. Multi-objective Optimal Scheduling of Small Integrated Energy System Based on Improved Particle Swarm Optimization Algorithm. J. Phys. Conf. Ser. 2022, 2400, 012051. [Google Scholar]
Figure 1. Gas leakage and diffusion at the joint of the pipeline system: (a) Flange leakage condition; (b) Valve leakage condition; (c) Leakage of connector; (d) Casing leakage condition.
Sustainability 16 01638 g001
Figure 2. Leakage frequency diagram of process equipment in oil and gas station.
Sustainability 16 01638 g002
Figure 3. Influence of obstacle distance on leakage diffusion: (a) The gas diffusion of the obstacle 1 m away from the leakage source; (b) The gas diffusion of the obstacle 2 m away from the leak source; (c) Gas diffusion of the obstacle 4 m away from the leak source. The cloud image label is expressed as a mass fraction of methane (the same below).
Sustainability 16 01638 g003
Figure 4. Influence of obstacle height on leakage diffusion: (a) Gas diffusion of a 2 m obstacle; (b) Gas diffusion of a 5 m obstacle; (c) Gas diffusion of a 10 m obstacle.
Sustainability 16 01638 g004
Figure 5. Influence of wind speed on leakage diffusion: (a) Gas diffusion under static wind conditions; (b) Gas diffusion under 2 m/s wind speed; (c) Gas diffusion under 5 m/s wind speed; (d) Gas diffusion under 8 m/s wind speed.
Sustainability 16 01638 g005aSustainability 16 01638 g005b
Figure 6. Influence of leakage velocity on leakage diffusion: (a) Gas diffusion at a leakage rate of 20 m/s; (b) Gas diffusion at a leakage rate of 50 m/s; (c) Gas diffusion at a leakage rate of 100 m/s; (d) Gas diffusion at a leakage rate of 200 m/s.
Sustainability 16 01638 g006
Figure 7. Natural gas leakage location inversion model.
Sustainability 16 01638 g007
Figure 8. Schematic diagram of leakage monitoring layout of oil and gas station: the red dashed line area indicates the effective monitoring range; the red triangle indicates the monitoring point; the green solid line indicates sensor data transmission.
Sustainability 16 01638 g008
Figure 9. Example of gas leakage monitoring: the circle points are the calculated interpolation points; red dots are the known monitoring sites; the five-pointed star is the leakage point; the red dashed line area is the effective monitoring area.
Sustainability 16 01638 g009
Figure 10. Case of function convergence.
Sustainability 16 01638 g010aSustainability 16 01638 g010b
Figure 11. Convergence of different algorithms.
Sustainability 16 01638 g011
Figure 12. The influence of noise on positioning accuracy.
Sustainability 16 01638 g012
Figure 13. Traditional layout method.
Sustainability 16 01638 g013
Figure 14. Advantages of data interpolation methods: (a) Comparison of the effect of different interpolation algorithms; (b) Influence of the number of sample points on leakage inversion calculation.
Sustainability 16 01638 g014
Table 1. Comparison of combustible gas monitoring techniques.
Monitoring TechnologyAdvantagesDisadvantagesTechnical Parameters
Semiconductor gas sensorLow power consumption, simple application circuit and low costPoor gas selectivity and poor stabilityThe linear detection range is narrow.
Solid electrolyte type gas sensorExcellent selectivity.Long response time, high power consumption and high costThe sensitivity is higher than that of semiconductor gas sensor
Catalytic combustion gas sensorHigh sensitivity to hydrogen and methane Low precision, high power consumption and ignition explosion risk.Detection range: 0~100%LEL, Detection accuracy: ±3%LEL
Infrared absorption gas sensorExcellent selectivityHigh cost and vulnerable to humidity effectsDetection radius: 7.5 m
Laser methane sensorPoint-type laser methane sensorHigh precision, short reaction time, selectivity, less affected by the environment.Multi-point layoutSensitivity: 5 ppm.m
Response time: 0.5 s
Open-circuit laser methane sensorInstallation is subject to site restrictionsSensitivity: ±5 ppm.m
Response time: 1 s
Gimbal-mounted Laser Methane Remote Sensing InstrumentHigh costDetection radius: 150 m
Response time: 0.1 s
Table 2. Leakage source aperture classification.
Aperture TypeAperture Size/mmFeature
Pinhole leakage[1, 10)The leakage point is small, and the outflow speed is slow.
Medium hole leakage[10, 50)The leakage point is larger, and the outflow speed is faster than the small hole.
Large hole leakage[50, 150)The leak point is large, the flow rate is fast, and you can see where the fluid is going.
Crush[150, ∞)The leakage site is damaged or broken, and the outflow is large, which may have a greater impact on the equipment and the environment.
Table 3. Coordinate data of each monitoring point.
Monitoring Point x i /m y i /m z i /m
16.9733.791.50
210.6115.691.00
323.8736.911.20
429.2525.231.50
543.7832.321.20
654.4820.791.00
Table 4. Simulation parameters.
Parameter NameParameter Value
Maximum number of iteration stepsG = 500
Population sizeN = 100
Weather stabilityAT = 2
External wind speedV = 3 m/s
Inertia factorω = 0.7
Acceleration factorc1 = 2c2 = 2
Initial crossover probability P c init = 0.1 a = 7.546 n c = 3
Initial mutation probability P m init = 0.01 β = 60 n m = 3
Adaptive selection probability P 0 init = 0.07 γ = 7.055 n 0 = 3
Table 5. Error analysis table of simulation results.
ArgumentTrue ValueArtificial Value M A E R M S E R 2
x/m37.3842.512.1152.5250.915
y/m35.1238.46
z/m1.501.64
Q/g·s−18006851051560.886
Table 6. Parameter estimation results of different algorithms.
Q/g·s−1x/my/mz/mMAERMSE R 2
Real80037.3835.121.50001
PSO85336.1233.541.452.8523.0450.712
GA78538.9238.551.873.8954.2110.654
IGA68542.5138.461.642.1152.5250.915
Disclaimer/Publisher’s Note: The statements, opinions and data contained in all publications are solely those of the individual author(s) and contributor(s) and not of MDPI and/or the editor(s). MDPI and/or the editor(s) disclaim responsibility for any injury to people or property resulting from any ideas, methods, instructions or products referred to in the content.

