Article

Dynamic Assessment of Photovoltaic-Storage Integrated Energy Stations Health Incorporating Subjective and Objective Characteristics

National Electric Power Conversion and Control Engineering Technology Research Center, Hunan University, Changsha 410012, China
*
Author to whom correspondence should be addressed.
Sustainability 2024, 16(4), 1646; https://doi.org/10.3390/su16041646
Submission received: 2 January 2024 / Revised: 4 February 2024 / Accepted: 5 February 2024 / Published: 17 February 2024
(This article belongs to the Section Energy Sustainability)

Abstract

:
Photovoltaic-storage integrated systems, which combine distributed photovoltaics with energy storage, play a crucial role in distributed energy systems. Evaluating the health status of photovoltaic-storage integrated energy stations in a reasonable manner is essential for enhancing their safety and stability. To achieve an accurate and continuous assessment of the health status of photovoltaic-storage integrated energy stations, a dynamic evaluation method is proposed in this study. This method integrates both subjective and objective characteristics. Initially, considering the evaluation needs of low-carbon operation and health status for photovoltaic-storage integrated energy stations, a comprehensive health status evaluation system is developed. The significance of each indicator is subjectively analyzed, while also considering objective characteristics and sensitivity of indicators. The integration of subjective and objective characteristics is achieved using principles from game theory. Subsequently, through the establishment of the Grey-TOPSIS evaluation model, both positive and negative correlations of the health status of photovoltaic-storage integrated energy stations are determined, resulting in the derivation of a health status vector. Furthermore, the introduction of time-weight vectors and the incorporation of a time dimension enable dynamic evaluation and the comprehensive observation of health status. Finally, the scientific validity and effectiveness of the proposed evaluation method are demonstrated through practical examples, with comparisons made to traditional evaluation methods. The results clearly indicate that this method offers higher sensitivity when evaluating the health of photovoltaic-storage integrated energy stations.

1. Introduction

In today’s increasingly digitized world and growing energy demands, energy storage technologies have become crucial. The limitations of traditional energy resources and their adverse impact on the environment have prompted us to actively seek more sustainable and efficient energy storage solutions. In this pursuit, as an emerging energy storage technology, the photovoltaic-storage system combines the advantages of light energy conversion and storage, presenting new possibilities to the energy industry. As a breakthrough energy storage technology, it has garnered extensive attention and research worldwide [1,2].
Currently, scholars at home and abroad have achieved significant results in health status evaluation. To address the challenge of assessing the health status of equipment systems after a large number of new energy sources are connected, K. Ding et al. used GMM and EMD algorithms to propose a performance evaluation model based on the concept of health status for photovoltaic system performance issues [3]. Due to the complexity of evaluating the health status of large-scale systems and equipment, the evaluation process is relatively intricate. Chao Chen et al. have thoroughly considered the health status of electromechanical systems under the influence of various uncertainties, such as monitoring and environmental factors in the field of electromechanical systems [4]. Zhang Y. et al. proposed BiGRU and MMoE models for the health status assessment of aeroengines, effectively evaluating their health status [5]. For the health status assessment of wind turbines, Peng, J. et al. proposed an early warning mechanism and a status assessment model based on MMD and CNN, quantifying the health status of wind turbines by measuring the similarity between the real-time data of wind turbines and the distribution of benchmark data [6]. Some representative dynamic and comprehensive evaluation works are listed in Table 1, including the evaluation index, weight calculation method, and assessment method.
At present, research on dynamic evaluation methods is mainly divided into two categories: one is to determine the weighting coefficients of evaluation indicators at different moments; the second category is the changing attributes of the object in the time series, leading to adjustments in the evaluation indicators at different times. Therefore, the various aspects of comprehensive evaluation are dynamically treated. Liu C et al. proposed a dynamic assessment model for urban natural disaster risk by comprehensively considering the state of change speed and the trend of change speed of risk evaluation indicators [7]. Considering the dynamics of a coupled distribution network-heat pump-energy storage system (DN-HP-ESS), Li M et al. established a dynamic empowerment model to dynamically adjust the static empowerment results of the indicators to realize the dynamic comprehensive evaluation of the DN-HP-ESS [8]. Wang D et al. divided the emergency response capability assessment into four time periods, and established a time-weighted average—time-weighted geometric mean hybrid operator model. Subsequently, a dynamic global evaluation method from the static evaluation model coupled with the time series was proposed to realize the dynamic comprehensive evaluation of power grid emergency response capability [9]. Zhou Y et al. determined the time-sequence weighting vector by using the time-sequence information entropy, and integrated the static evaluation model of each time section to establish the dynamic comprehensive evaluation model of the electric power development level [10].
Currently, domestic and foreign research on health status assessment is mainly divided into two categories: machine learning evaluation methods and index system evaluation methods. The former is generally used when the health characteristics of the research objects are obvious, and the results can be directly analyzed through a large amount of data. The latter is generally used in more complex large-scale systems, considering comprehensive evaluation under the influence of multiple dimensions. Solar energy storage stations comprise numerous pieces of equipment and complex structures, and cover extensive areas. Evaluating their health status should involve a multi-dimensional assessment to comprehensively examine their overall health.
For theoretical research on the evaluation of distributed photovoltaic-storage energy stations or integrated energy systems, the current research mainly focuses on comprehensive efficiency and comprehensive benefits. In order to realize a comprehensive evaluation of energy-saving efficiency, Leng Y et al. proposed an evaluation method based on GRNN and PNN algorithms for the comprehensive energy system evaluation of incomplete data, considering the prediction of missing data and the classification of new evaluation indicators [11]. Zhu X et al. analyzed the mechanism of the circulating cooling water system and used a combined weighting method to evaluate its comprehensive energy-saving effect [12]. The uncertainty of the comprehensive energy system makes comprehensive benefit evaluation complicated. Lu Z et al. conducted a comprehensive evaluation of EMS-RIES, establishing an evaluation system with five dimensions and a hesitant fuzzy language set to reduce the standards and standards of alternatives. This helps to address the double uncertainty in the degree of influence between properties [13]. Simultaneously, a large number of renewable energy sources will also have an impact on the evaluation of comprehensive energy systems. Li W et al. evaluated the reliability of power supply under the condition of high penetration of renewable energy. The index system is built based on the influence of game theory, and the TOPSIS model is established based on the combination weighting method of game theory. This allows the evaluation of power supply reliability from three dimensions: space, index, and time [14]. Yao Zou et al. established a coupling coordination degree evaluation model to evaluate and improve the coupling effect of the power generation system for the power generation system coupled with renewable energy and thermal power. Existing studies have evaluated various aspects of the integrated energy system, but for the key characteristics of the health status of solar energy storage energy stations, no suitable evaluation method for the health status has been proposed [15].
In summary, there are still the following problems that need urgent attention in current research on the health status evaluation of energy stations: First, in the index weighting method, only one or two characteristics of the index are considered, while other characteristics of the index are ignored, which lacks a certain degree of objectivity [16]. For example, Chai Dong et al. only considered the influence of the characteristic of indicator sensitivity on different comprehensive assessment methods and discussed the stability of each evaluation model [17]. Su Yi et al. analyzed the index contribution based on the gray target theory to evaluate the technological innovation capability of Chinese high-tech enterprises [18]. Additionally, in terms of subjective characteristics, the significant uncertainty of the experts regarding the indicators is ignored. Second, without considering the different characteristics of health status evaluation and the current reference values, only linear transformation is used to convert the index value, which causes the evaluation results to lack a realistic basis. Third, static evaluation cannot reflect the dynamic development status of the entire process, which will cause difficulties in the overall observation of the development of things.
In view of these challenges, this paper proposes a dynamic evaluation method for the health status vector of photovoltaic-storage energy stations based on prospect theory and reference values. First of all, considering the multifaceted evaluation needs, a health status evaluation index is constructed, including four dimensions: reliable energy supply, low-carbon operation, equipment health, and system health. According to the characteristics of the importance degree, contribution degree, difference degree, and sensitivity of the index, the information fusion of the multi-characteristics of the index is carried out using the principles of game theory. Second, based on prospect theory and different positional relationships of the reference values, the index values are transformed after considering the characteristics of the health status evaluation. These converted index values are then input into the Grey-TOPSIS evaluation model to calculate the positive and negative correlation degree, which is subsequently converted into the health status vector of the photovoltaic-storage integrated energy stations. At the same time, the time-weight vector and time dimension are introduced to address dynamic evaluation and global observation problems. Finally, an example is used to verify the proposed method, and its effectiveness is analyzed in comparison to other evaluation methods.

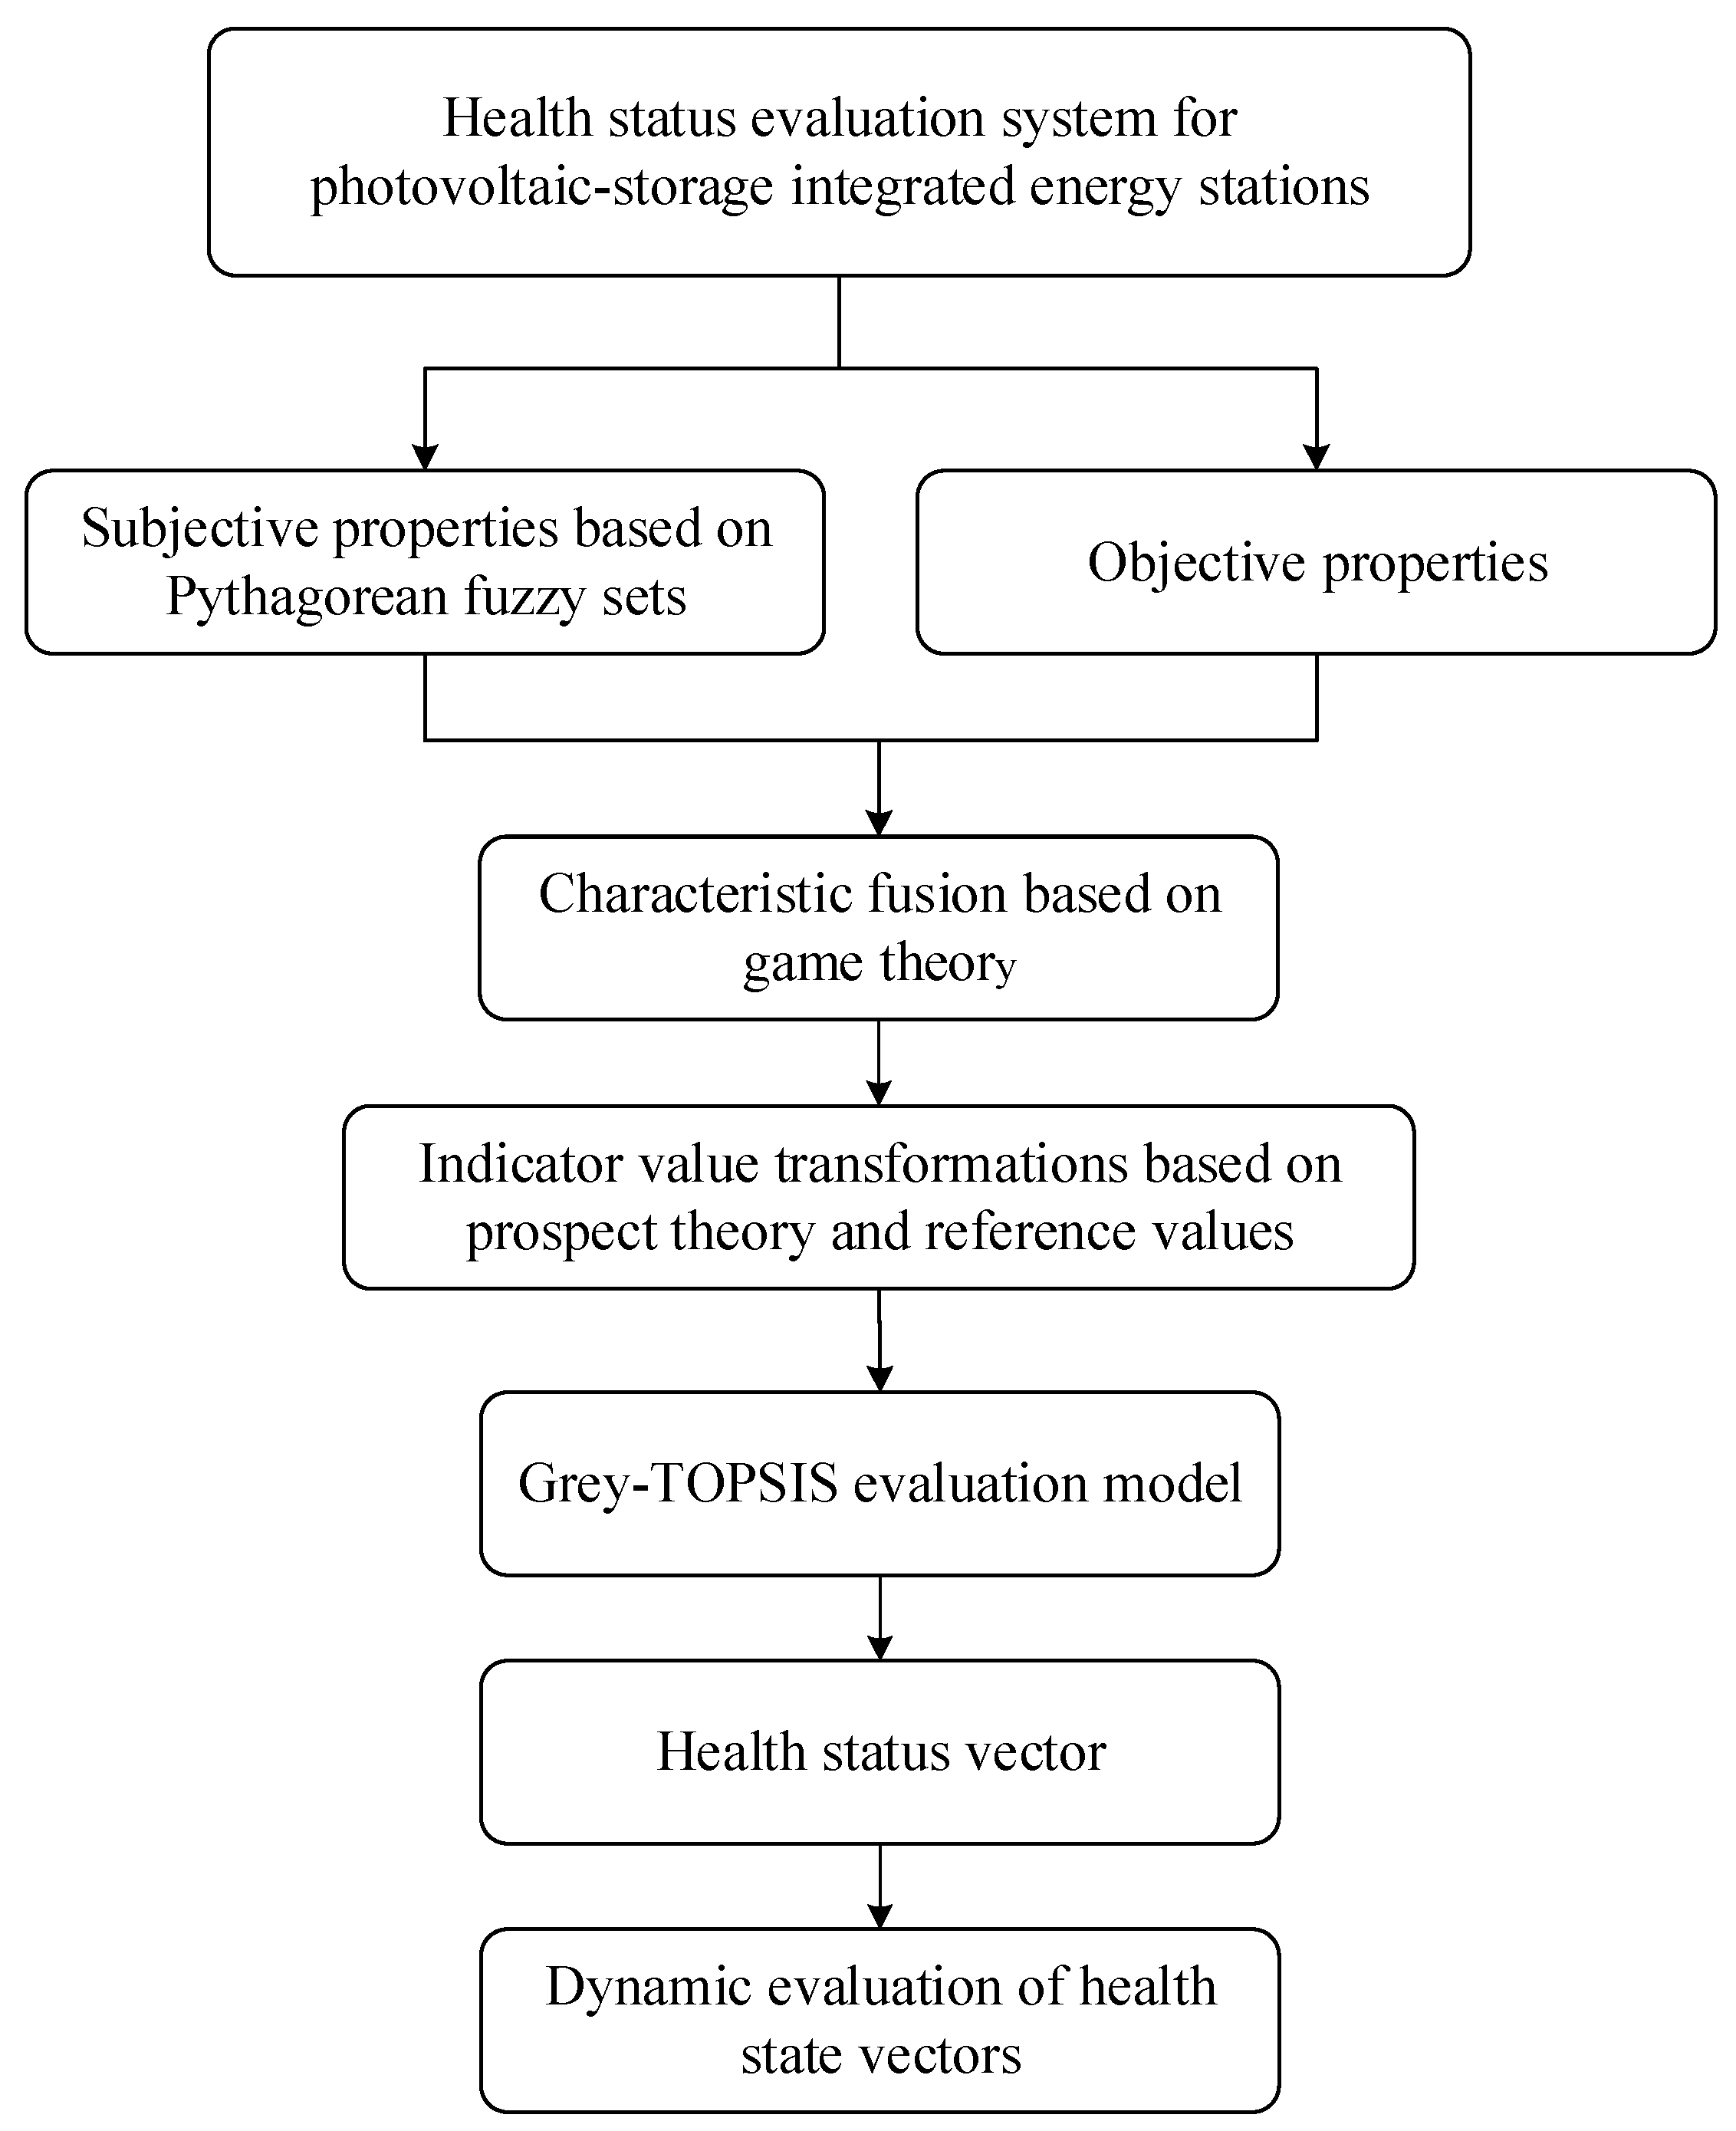
2. Health Status Evaluation Index System of Photovoltaic-Storage Integrated Energy Stations

The health status of the photovoltaic-storage integrated energy station refers to the degree of health concerning the operation of equipment and the reliability of the system. Equipment health status and system health status are internally connected with the health status of the photovoltaic-storage integrated energy station. The former is used to reflect the health status of each piece of equipment and the pipe network, while the latter is used to reflect the health status of each subsystem or specific characteristic parameters [19,20]. A reliable energy supply is an external manifestation of the health status of the photovoltaic-storage integrated energy station and is an essential component of health status evaluation. In the current context of “Carbon Peaking and Carbon Neutrality”, the low-carbon operation of solar energy storage energy stations is an inevitable requirement for future policies and social development. The index system of the photovoltaic-storage integrated energy stations, based on evaluation demand analysis, is illustrated in Figure 1. Due to space constraints, this article only provides construction ideas, and the explanation of the calculation formulas is presented in Appendix B.

2.1. Energy Saving and Low Carbon

In terms of energy conservation and low carbon, it comprises three indicators: renewable energy utilization rate (A1), carbon emission reduction (A2), and energy conversion efficiency (A3). The renewable energy utilization rate (A1) measures the extent to which the system utilizes renewable energy (solar energy) and evaluates the efficiency of converting solar energy into electrical energy through the photovoltaic energy storage system and supplying it to the traction substation. Carbon emission reduction (A2) directly reflects energy conservation and low carbon, including the cumulative reduction in carbon emissions at each stage of the entire life cycle. Energy conversion efficiency (A3) reflects the energy utilization efficiency of the distributed photovoltaic energy storage system, including the power generation efficiency of photovoltaic modules and the energy storage efficiency of energy storage equipment, among other factors.

2.2. Reliable Power Supply

In terms of power supply reliability, it includes three indicators: demand-side satisfaction (B1), qualification rate of power supply quality (B2), and reliability of power supply (B3). Providing high-quality electric energy services for traction substations is the primary goal of photovoltaic-storage integrated energy stations. The demand-side satisfaction of traction substations is an essential and significant indicator of reliable energy supply. The definition of the demand-side satisfaction of traction substations (B1) index is used to evaluate the comfort level of heating and cooling energy consumption. The bus voltage qualification rate (B2) refers to the proportion of the bus voltage within the system that remains within the specified range within a certain time frame. Maintaining the bus voltage within the qualified range is a crucial indicator to ensure the safe and efficient operation of the distributed photovoltaic energy storage system. The energy supply reliability rate (B3) is the most direct indicator to describe the system’s energy supply reliability performance. It has a strong correlation with the health status of the distributed photovoltaic energy storage system. The higher the value, the higher the health level.

2.3. Device Health

Regarding device health, it includes four indicators: the average device overload rate (C1), device failure rate (C2), coupling device conversion rate (C3), and device aging degree (C4). Device overload can lead to damage, which is detrimental to the overall health of the distributed photovoltaic energy storage system. The average device overload rate (C1) is used as the evaluation index. The device failure rate (C2) is a crucial indicator of device health, and the average device failure rate during operational hours simplifies the assessment of the entire energy station’s situation. The coupling device, a key component of the distributed photovoltaic energy storage system, should maintain its conversion efficiency (C3) within a specific range. A significant deviation indicates a defect in the crucial coupling device, reducing the overall health of the photovoltaic energy storage energy station. The device aging degree (C4) significantly influences the health status of the distributed photovoltaic energy storage system, but quantifying it can be challenging. Therefore, it is defined as a qualitative indicator. Comprehensive judgment can be made considering factors such as the device’s service life and operational status.

2.4. System Health

In terms of system health, it comprises five indicators: health indicators of each subsystem, network loss, and operation and maintenance times. Subsystem health indicators include the photovoltaic module health index (D1), energy storage system health index (D2), and grid connection and operational health index (D3). System loss (D4) is a critical indicator of system health, with values ideally lower than a certain threshold under normal conditions, potentially increasing when other issues occur. The number of maintenance actions (D5) indicates how often operation and maintenance personnel attend to the distributed photovoltaic energy storage system within a specified time frame. More maintenance actions can mitigate relevant risks and failures, making it an essential measure to maintain the system’s health.

3. A Variety of Index Characteristic Weighting Methods

The comprehensive evaluation data of photovoltaic-storage integrated energy stations exhibit characteristics such as multidimensionality, multiple indicators, and multiple time points. If only one characteristic of the index data, such as subjectivity or information entropy, is considered, it may not fully account for the advantages of the index in other characteristics. Weighting or screening indicators solely based on one characteristic can lead to a lack of consideration for important information and indicators. Therefore, it is essential to comprehensively consider the characteristics of various indicators.

3.1. Various Indicator Features

  • Based on the subjective properties of Pythagorean fuzzy sets
Based on the subjective properties of Pythagorean fuzzy sets, in the process of traditionally determining subjective characteristics, it is assumed that experts possess infinite experience and can accurately rank each indicator’s importance. However, in practice, determining the importance of some indicators can be challenging. To address this issue, this paper proposes a subjective weight determination method based on Pythagorean fuzzy sets [21]. Please refer to Appendix C for calculation steps.
2.
Contribution characteristics
The contribution characteristic quantifies the degree of a specific indicator’s contribution to the overall evaluation result of the evaluation object, expressing its impact on the system’s overall evaluation. Gray theory can analyze the relationship between the development of things and the degree of standardization, allowing for the evaluation of the contribution attribute of quantitative indicators [16]. Please see Appendix C for the calculation steps.
3.
Differential properties
The difference degree characteristic primarily measures the amount of information contained in the index data and represents the degree of differentiation in the index data. The projection pursuit method can effectively handle high-dimensional data analysis problems while preserving the characteristics of the “small concentration and large divergence” of data [22]. Please refer to Appendix C for the calculation steps.
4.
Sensitivity characteristics
The sensitivity characteristic of an index describes the influence of changes in uncertain factors on the expected results, quantifying each factor’s impact on the results. The principal component analysis method maximizes the retention of data information, quantifies the relationship between the comprehensive value and the index, and effectively analyzes index sensitivity. Please see Appendix C for the calculation steps.

3.2. Feature Fusion Based on Game Theory

To address the poor stability of traditional methods, the characteristics of the indicators are fused using the principles of game theory, aiming for the fusion weight to be as close as possible to the characteristics of each indicator [23]. Assuming that the final fusion feature weight W can be expressed as the following formula.
W = i = 1 D ( a i w i )
where D means that there are D types of index characteristics; ai represents the linear combination coefficient of the i-th type of index characteristics; wi represents the weight of the i-th type of index characteristics. According to the game theory, the objective function is to minimize the deviation:
min h = 1 D i = 1 D a i w i w i 2 s . t . 0 a i 1 i = 1 D ( a i w i ) = 1
After obtaining the linear combination coefficient, normalize it:
W = k = 1 D ( a k ( a i ) w k )
In the problem of solving the optimal fusion weight and projection objective function, there are numerous indicators and high dimensions. In this paper, the whale algorithm, based on Cauchy mutation and adaptive weight, is employed to find the optimal solution. The traditional whale algorithm has issues with inaccurate convergence and slow convergence speed [24]. In this paper, the iterative process of global optimization and local optimization is enhanced by incorporating the concepts of Cauchy mutation and adaptive weight.
During global optimization by a group of whales, a reference individual is randomly selected, and other whales are chosen at random to approach it. The selection of the reference individuals impacts the global search ability, and the Cauchy inverse cumulative distribution is employed, as shown in Formula (4), to enhance the mutation process and prevent blind mutation as in the original algorithm. The original iterative process is modified as per Formula (5).
F 1 p ; x 0 , γ = x 0 + γ tan π p 1 2
X ( t + 1 ) = X ( t ) + A tan π r 1 2
where F−1 is the inverse cumulative distribution function of the Cauchy distribution; xij is the location point of the whale before mutation; when γ = A, the uniform distribution of r ∈ [0,1].
When the whale group conducts a local search, the optimization weight influences the local optimization capability. Utilizing the concept of adaptive weight allows whales to use a smaller weight when close to the target, thereby enhancing the algorithm’s local optimization ability. The adaptive weight improvement formula is as follows:
w = sin π t 2 i t max + π + 1
X ( t + 1 ) = w X ( t ) A D
where itmax is the maximum number of iterations; t is the current number of iterations; A and D are algorithm coefficient variables.

4. Comprehensive Evaluation of the Health Status of Photovoltaic-Storage Integrated Energy Stations

The health status evaluation of photovoltaic-storage integrated energy stations has different characteristics from other evaluations. Considering the mental state of decision-makers’ bounded rationality, they are more sensitive to the results of the indicators when faced with indicators of health values below the standard; when faced with indicators of health values higher than the standard, the opposite is true. Therefore, in order to reflect the different states between the index state value and the reference value, the prospect theory is introduced to fully reflect the health state of photovoltaic-storage integrated energy stations.

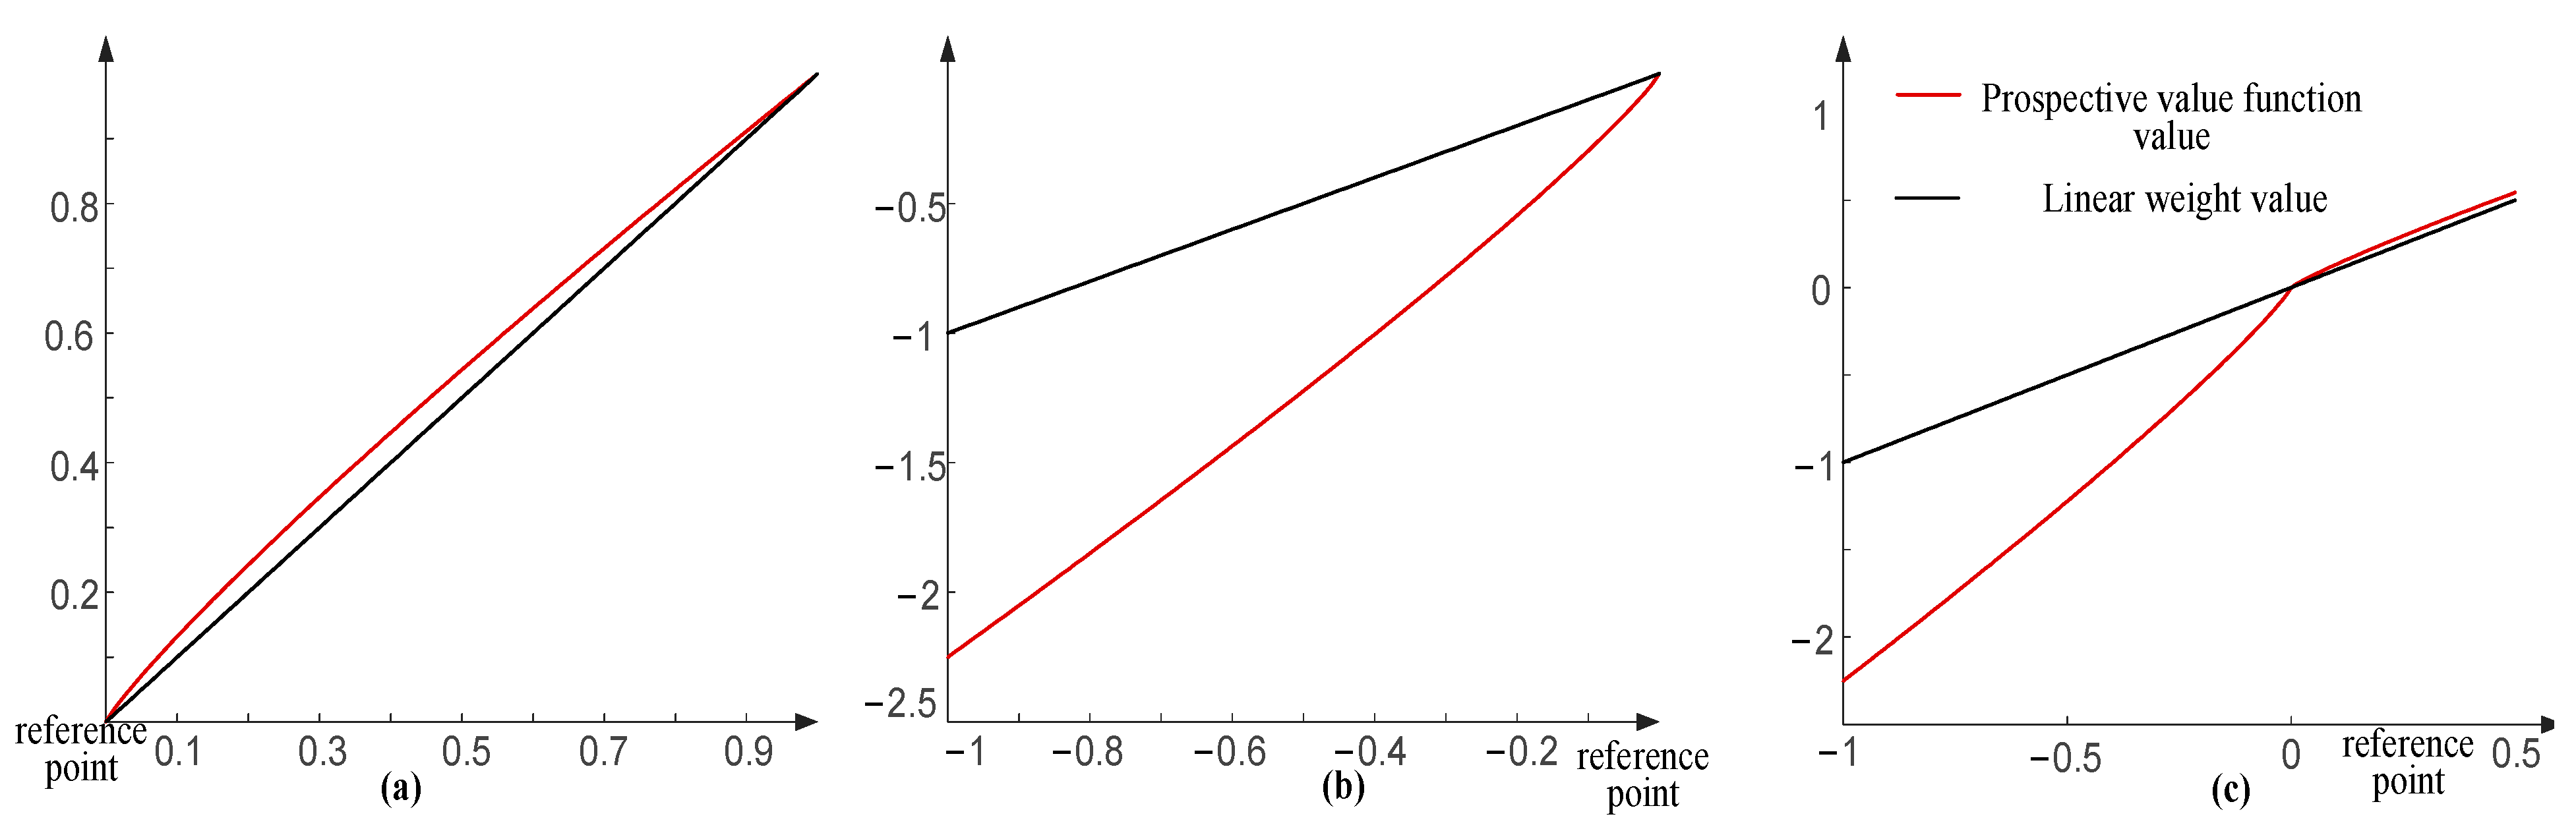
4.1. Evaluative Transformations Considering Prospect Theory and Reference Values Idea

Prospect theory, proposed by Nobel economist Kahneman, explores the impact of decision-makers’ bounded rationality and risk preferences [25]. Its value change curve aligns more closely with the evaluation expectations of photovoltaic-storage integrated energy stations. When applying prospect theory to evaluation theory, the comprehensive prospect value is primarily obtained by constructing the prospect value function v+(−) and the decision weight function z+(−).
V i j = v + z + = s i j α p θ p θ + ( 1 p ) θ 1 / θ s i j > 0 v z = λ s i j β p ε p ε + ( 1 p ) ε 1 / ε s i j 0
where α and β are the sensitivity of decision-makers to profit and loss, respectively, and the larger the value, the higher the risk they are willing to bear. Generally, it is 0.88, and λ is generally 2.25. θ and ε represent decision-makers’ attitudes towards gains and losses, generally 0.61 and 0.69, and p is the index probability [25].
The decision weight function curve is shown in Figure 2, comparing the two decision weight functions with the linear weight function. The decision weight function increases weights in the front end and decreases weights in the back end. However, when evaluating the health status of photovoltaic-storage integrated energy stations, there are no obvious practical problems related to risk-return and index probability. Therefore, its decision weight function is replaced by a linear weight. The prospect value function can reflect the evaluation characteristics of the health status of photovoltaic-storage integrated energy stations, which means that the sensitivity of the evaluation results varies for different health degrees and reference value states. The improved comprehensive prospect value function is then as follows:
V i j = v + W j = s i j α W j     s i j > 0 v W j = λ s i j β W j     s i j 0
However, when the prospect value function is actually used, it is necessary to convert the change in the index value into the interval [−1,1] based on the actual situation. Traditional index transformation uses the average value as the reference point, resulting in a fixed reference point that cannot be adjusted according to the actual development of photovoltaic-storage integrated energy stations. This leads to significant deviations in evaluation results when using the prospect value function. In response to this issue, this paper proposes a method based on reference value index transformation, which can be better applied to the prospect value function. Taking positive indicators as an example, three situations where the reference point appears are illustrated:
When the reference point is lower or higher than all evaluation values, the indicator will be in [0,1] or [−1,0] after transformation, and its transformation formula is as follows:
s i j = x i j x 0 j x j max x 0 j ,   s i j [ 1 , 0 ]
s i j = x 0 j x i j x 0 j x j min ,   s i j [ 0 , 1 ]
where x0,j is the reference value of the j-th indicator, and xij is the actual value of the j-th indicator of the i-th energy station; xjmin and xjmax are the minimum and maximum values of the j-th indicator. When the reference point is located between all the evaluated values, its transformation formula is as follows:
s i j = x i j x 0 j x j max x 0 , j ,   |   x j max x 0 , j | > | x j min x 0 , j | x i j x 0 j x 0 j x j min ,   |   x j max x 0 , j | < | x j min x 0 , j |
After the indicator is transformed based on the reference value, the three situations in which it is combined with the prospect value function are shown in Figure 2.

4.2. TOPSIS Evaluation Model

Following the transformation of the evaluation data in Section 3.1, the final evaluation result is obtained by setting the positive and negative ideal sets and using the gray relational degree model to calculate the gray relational prospect value. In this paper, the worst or best prospect value is used as the ideal point, and the calculation steps of the gray relational degree are detailed in Appendix B. Based on the gray correlation degree of each evaluation object, calculate the fitting degree of each evaluation object.
d i = R i + R i + R i +
The use of the gray relational degree can avoid the situation where, in traditional TOPSIS, when the sum of positive and negative fitting degrees is 0, the fitting degree becomes meaningless.

5. Photovoltaic-Storage Integrated Energy Stations Health State Vector Dynamic Evaluation

The first three chapters focus on static evaluation measurement research, which is used to reflect the current level of photovoltaic-storage integrated energy stations. However, static evaluation measures can only reflect the cumulative effect of the object’s development over a period of time and cannot capture the dynamic development of the entire process. To comprehensively reflect the dynamic development state of photovoltaic-storage integrated energy stations, this paper follows the basic principles of ecological niche theory and proposes a dynamic evaluation method based on positive and negative correlation. We use the negative and positive correlation degree as the horizontal and vertical coordinates, resulting in a state vector diagram representing the health state of photovoltaic-storage integrated energy stations, as shown in Figure 3.
Figure 3 contains state vectors from different time periods. To obtain the synthesized vector of the developmental state over the entire period, we need to aggregate the state information from discrete multiple time points. This aggregation is achieved through the construction of a time-weight vector. The time-weight vector can be subjectively determined according to the G1 method. The G1 method for time weight considers the actual situation at each evaluation time point and the concept of “thick present and thin past” [26]. It ranks the time points based on their importance and compares the importance of neighboring time points to establish the importance scale of the neighboring time points:
R k = θ k 1 / θ k ( k = n , n 1 , …… , 2 )
where θk−1 is the weight of the k−1 time point in the importance ranking; θk is the weight of the k indicator in the importance ranking; Rk is the importance degree between them; n is a total of n time points. From the interrelationship of the weights of each time point, the weights of each time point are obtained as:
θ n = 1 + k = 2 n k = 2 n R k 1 θ k 1 = i = k n ( R i ) θ n , k = n , n 1 , …… , 2 )
Then the synthesized vector X can be expressed as follows:
X = i ( θ i x i )
where θi is the time weight of the i time point; xi represents the state vector of the i time point.
When the health state of photovoltaic-storage integrated energy stations progresses from state vector x1 to state vector x2, a displacement vector ∆x is defined from the end of state vector x1 to the tail end of state vector x2 to describe its development and change. The displacement vector effectively portrays the development process of entities and has two directions: one points to the second quadrant, signifying positive change, while the other points to the fourth quadrant, indicating negative change. However, while the displacement vector can represent state changes over time, its development process diagram can become overly complex from a global observation perspective. This can make it challenging for decision-makers to grasp the development direction of the evaluation object, ultimately impacting their specific judgments and decisions. In this paper, the introduction of the time vector dimension effectively addresses the global observation issue by converting the one-dimensional state vector into multiple time dimensions. This approach provides a more comprehensive view of the development process of the evaluation object’s health. Each state vector under different time periods can be expressed as follows:
x i = i x i
where i is the ith year. The dynamic state vector evaluation diagram is shown in Figure 4.

6. Calculus Analysis

To validate the practicality and scientific rigor of the health state evaluation system and evaluation model proposed in this paper, four photovoltaic-storage integrated energy stations (Station A, Station B, Station C, Station D) were selected for empirical validation. The data for each index derived from simulations and the reference values of the indexes are provided in Table A1 in the Appendix A.

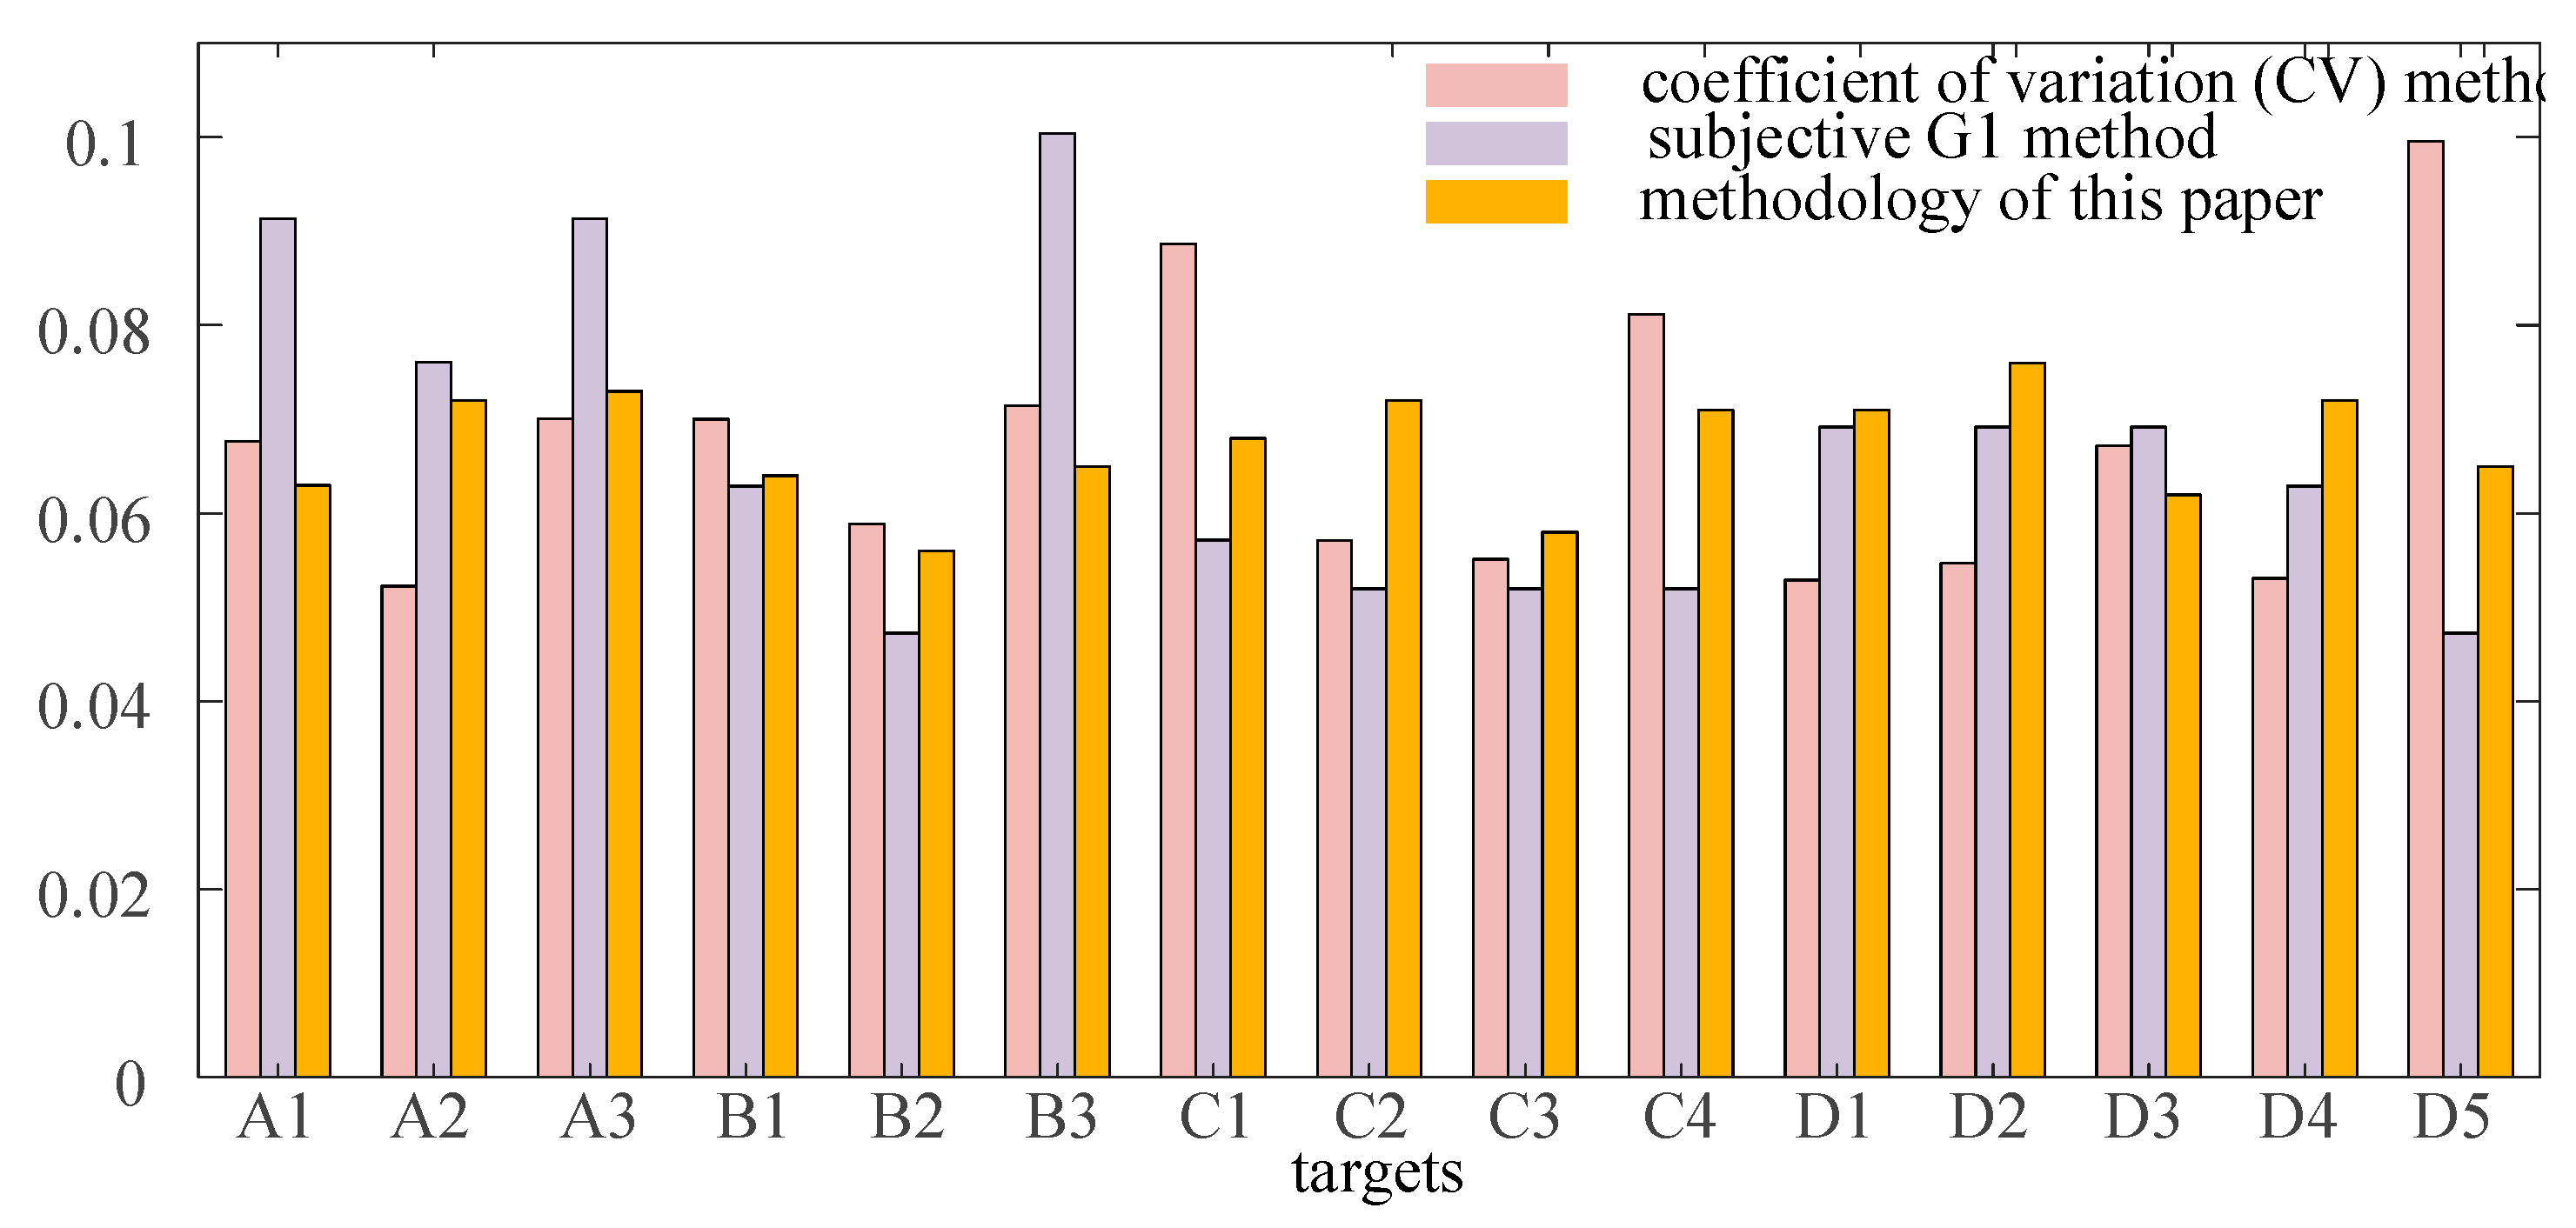
6.1. Calculation of Weighting Factors

Subjective characteristics are determined using a method based on Pythagorean fuzzy sets. Five experts were invited to make empirical judgments based on the importance, uncertainty, and insignificance of the indicators, resulting in the Pythagorean fuzzy set of subjective characteristics, as shown in Figure 5. The subjective characteristics of each index, based on their importance, insignificance, and hesitation, are as follows: w1 = [0.067,0.051,0.076,0.067,0.067,0.08,0.067,0.08,0.051,0.067,0.076,0.067,0.067,0.067,0.051]. The analysis reveals that indicators with higher importance are assigned greater weight. In cases of equal importance, indicators with lower insignificance are assigned higher weights. The results indicate that experts directly place greater emphasis on indicators reflecting the health of photovoltaic-storage integrated energy stations, such as reliability of power supply (B3) and device failure rate (C2).
The contribution degree characteristic is calculated using the gray relational degree, quantifying the contribution of each indicator to the overall evaluation result. The gray relational heat map of the contribution degree is obtained, as shown in Figure 6.
Based on the quantitative results of each indicator’s contribution, the contribution weight is determined as w2 = [0.062,0.082,0.067,0.062,0.044,0.061,0.07,0.068,0.07,0.073,0.076,0.078,0.052,0.077,0.059].
The variability characteristics of the indicators are calculated using the projection tracing method, reflecting the informativeness of the indicator data. The optimization of the projection tracing method with the improved whale algorithm yields the optimal projection vector w3 = [0.042,0.115,0.095,0.022,0.048,0.021,0.056,0.08,0.048,0.054,0.065, 0.109,0.075,0.1,0.069].
The sensitivity properties of the indicators are calculated using principal component analysis, describing the impact of changes in uncertainty factors on expected results. The principal components are determined by selecting the direction of the contribution of variance greater than 90% and are calculated as follows.
X = 0.491 F 1 + 0.303 F 2 + 0.205 F 3
Finally, the sensitivity characteristics are w4 = [0.064,0.057,0.073,0.068,0.064,0.068,0.069,0.059,0.064,0.074,0.065,0.074,0.061,0.069,0.071].
The characteristics of each indicator are taken as the main component of the game, and optimization is performed using the improved whale algorithm to maximize balanced combinations and achieve common interests. The optimal weight is determined as w = [0.063,0.072,0.073,0.064,0.056,0.065,0.068,0.072,0.058,0.071,0.072,0.077,0.062,0.072,0.065].

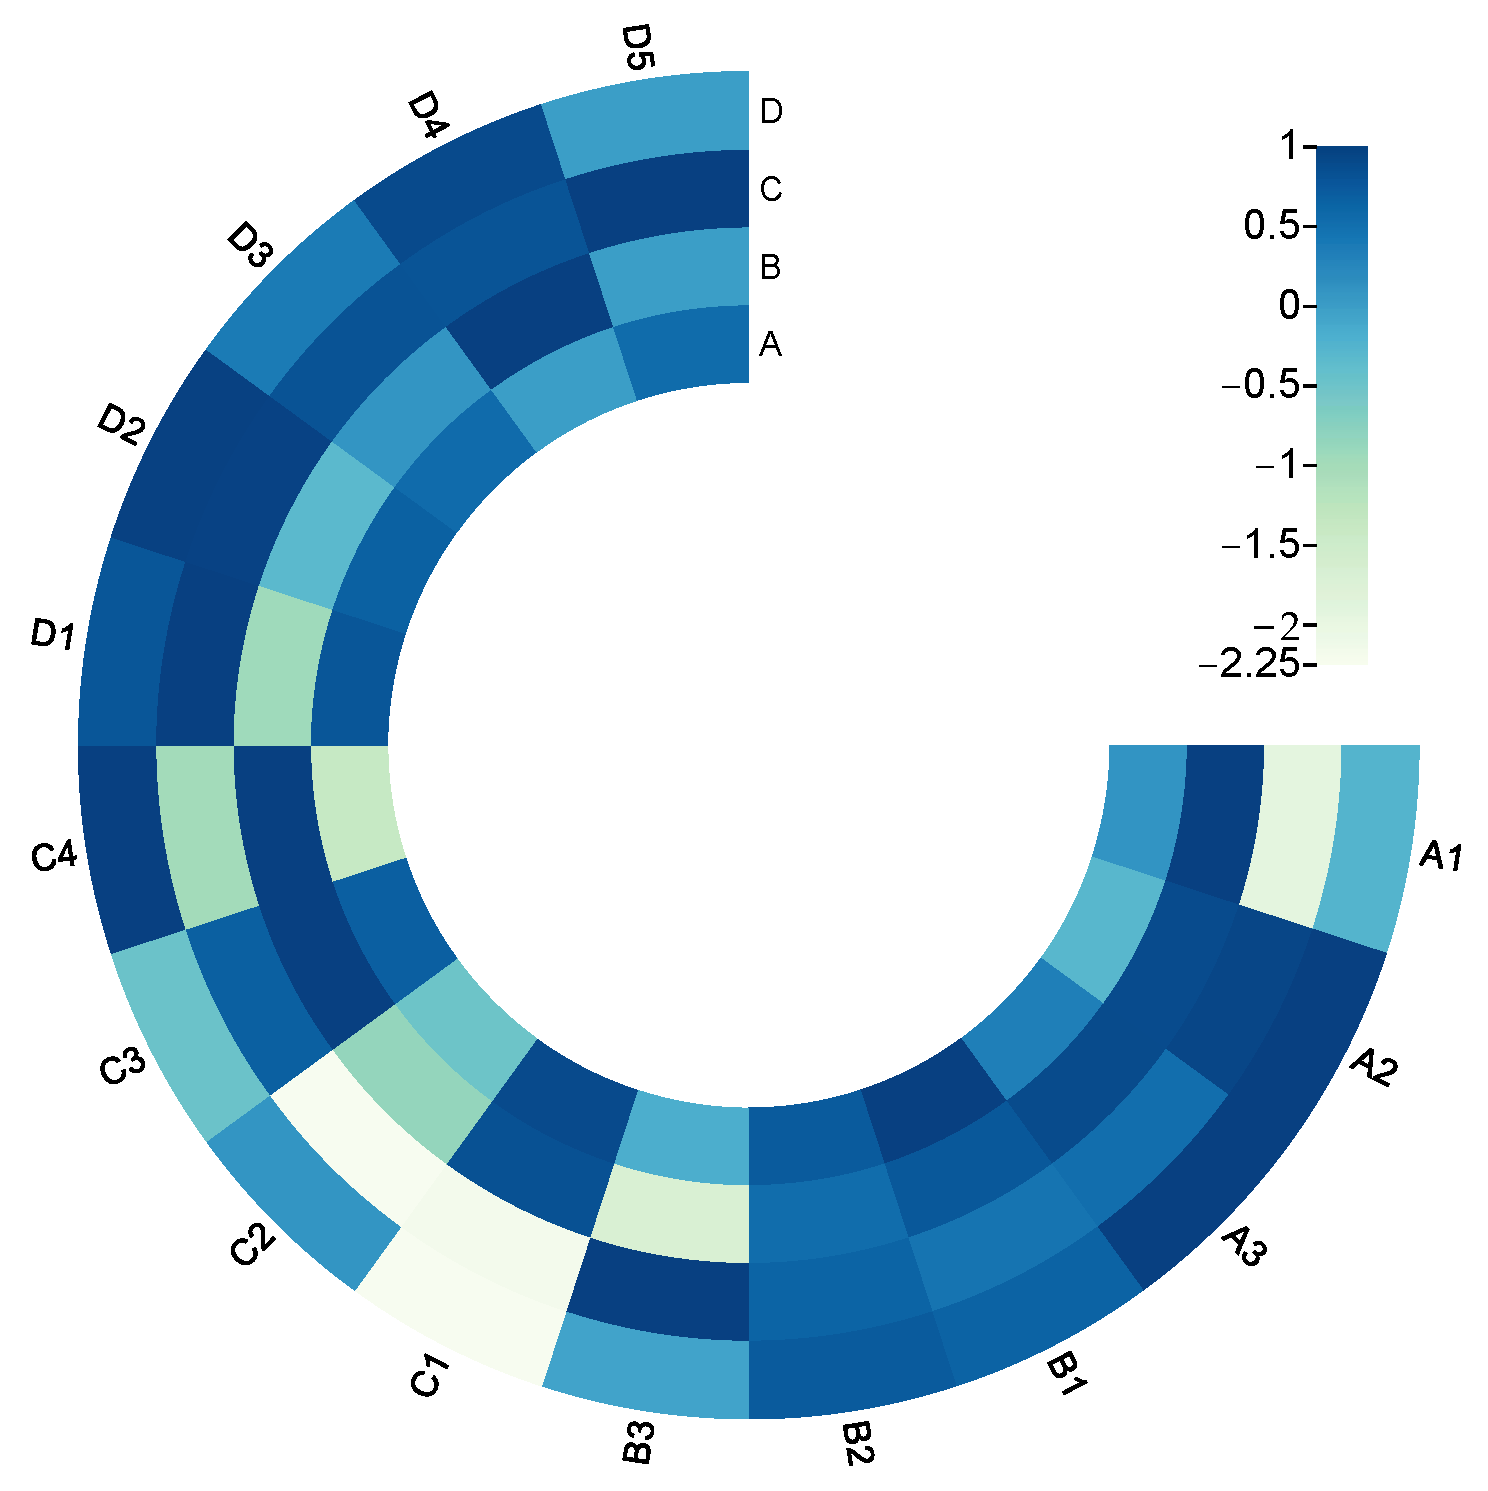
6.2. Comprehensive Evaluation and Dynamic Evaluation

Due to the unique characteristics of health status evaluation for photovoltaic-storage integrated energy stations, it is necessary to convert the evaluation values to meet the specific requirements of health assessment. Please refer to Appendix F for reference values of each index. Each evaluation object index is transformed according to the theory presented in Section 4.1, resulting in a circular heat map as shown in Figure 7.
After obtaining the various evaluation values of the photovoltaic-storage integrated system, the evaluation model in Section 4.2 is applied to obtain the positive and negative correlations of each energy station. From Figure 8b, it can be seen that the state vector of station D, with the highest positive correlation of 0.764 and the lowest negative correlation of 0.646, is located at the leftmost end of the spectrum, indicating a better state of health in this evaluation. Conversely, the state vector of station A, with the lowest positive correlation of 0.703 and the highest negative correlation of 0.712, is located at the rightmost end of the spectrum, indicating a worse state of health in this evaluation. The state vectors of energy stations B and C are closer to each other, and their health states are also closer to each other, falling between the two extremes of stations A and D.
Analyzing Figure 8a, it can be seen that energy station A is penalized due to its poor performance in low-carbon operation and system health dimensions, with health indicators C4, C2, B3, and A2 lower than the reference values, resulting in the lowest health status among the four energy stations. Energy station B is penalized for indicators D2, D1, C2, and B2, but its performance in low-carbon operation and equipment health dimensions is better, resulting in overall performance that is not too poor. Energy station C performs well in both energy supply reliability and system health dimensions, but deviations in A1, C1, and C2 from the reference values impact its overall performance. Energy station D, while not outstanding in individual dimensions, maintains a balance across all dimensions, with better performance in the weighted indexes, resulting in the highest health degree.
To further verify the convenience of global observation based on state vectors, the health state vectors of station D at four time points are synthesized. The dynamic state vector evaluation map of energy station D is obtained, as shown in Figure 9. After time point 1, the displacement vector continuously shifts upward, with increasing positive correlation and decreasing negative correlation, indicating continuous improvement. This graphical representation allows for a more intuitive observation of the global development process of station D.

6.3. Comparative Analysis of Evaluation Results

To validate the validity and scientific nature of the comprehensive multi-indicator characteristic assignment method proposed in this paper, the assignment results obtained from it are compared with those obtained from the objective assignment methods Coefficient of Variation (CV) method and Sequential Relationship Analysis (G1 method), as shown in Figure 10.
As seen in Figure 10, the multi-indicator characteristic assignment method proposed in this paper, compared to the other two assignment methods, takes into account the importance, contribution, difference, and sensitivity of multiple characteristics. Consequently, the assignment results not only emphasize key indicators but also avoid excessive bias toward specific indicators. Conversely, the CV method focuses on highlighting the characteristics of the indicator data, resulting in significant assignment fluctuations and excessively high weights for some indicators, leading to biased results. The subjective weighting method G1 method solely relies on the subjective weight of experts and disregards the characteristics of the indicator data. This leads to a substantial difference between the weights of the most and least important indicators. Given these observations, both single assignment methods introduce bias into the results, which can lead to analyses that do not align with reality.
The evaluation transformation method proposed in this paper, which integrates the transformation of reference values and the degree of health sensitivity, proves to be practical. When compared to the traditional linear evaluation value transformation, the evaluation results are presented in Table 2.
The main difference between the model proposed in this paper and the other three traditional methods revolves around the health rankings of energy stations B and C. This discrepancy arises because the method in this paper is more sensitive to evaluation values below the health value, resulting in larger penalties. Additionally, since traditional evaluation methods solely rely on the average value as the reference point, values below the reference point are linearly calculated without considering actual health requirements, which does not align with practical evaluation needs. Conversely, the method proposed in this paper aligns with the ranking of energy stations A and D in all four methods, indicating its effectiveness in assessing the health levels of photovoltaic-storage integrated energy stations. When all index values are lower than the reference value, the proposed method, integrating the prospect theory, exhibits higher sensitivity compared to traditional methods, aiding in the analysis of each energy station’s health level. Moreover, when the reference value exceeds the evaluation value, the proposed method demonstrates greater sensitivity than traditional methods. Further detailed analysis is available in Appendix D.
The dynamic evaluation method proposed in this paper incorporates the concept of “thick today but thin in the past.” It uses the time weight G1 method to obtain the time-weight vector [0.3811, 0.2932, 0.1954, 0.1303]. Comparing this obtained time-weight vector with the averaged time-weight vector yields the vector map of different health states, as shown in Figure 11.
When compared to the average time-weight method, the time weight G1 method introduced in this paper considers recent performance more significantly, resulting in a better composite vector, especially when there is a notable difference between recent and past performance. The average time-weight method assigns equal importance to each time point, which may not adequately reward better recent performance, leading to weaker results compared to the time weight G1 method and increasing deviation. Consequently, the method proposed in this paper is more practical and reliable.

7. Conclusions

This paper introduces a vector dynamic evaluation approach for assessing the health state of photovoltaic-storage integrated energy stations, based on prospect theory and reference value transformation. This method enables a scientific evaluation of the actual health status of photovoltaic-storage integrated energy stations and carries practical significance for their safe and efficient operation. The conclusions are as follows:
(1).
The health state evaluation system for photovoltaic-storage integrated energy stations proposed in this paper considers the needs of both low carbon and healthy operation. It constructs health evaluation indices at both system and equipment levels, effectively covering health assessment at all levels of photovoltaic-storage integrated energy stations.
(2).
The multi-indicator characteristic assignment method introduced in this paper addresses the limitations of traditional assignment methods that solely focus on individual indicator characteristics. It synthesizes multiple characteristics, including subjective importance, contribution, difference, and sensitivity, employing game theory to integrate these features.
(3).
The index transformation method based on prospect theory and reference values proposed in this paper adapts index values according to actual reference values, enhancing the adaptability and practicality of health assessment.
(4).
The dynamic evaluation based on state vectors, incorporating the concept of “thick today but thin in the past,” utilizes the time-weight vector to consider the development state over multiple time periods. It effectively addresses global and trend observation issues by incorporating the time dimension.
(5).
This paper provides a comprehensive evaluation of photovoltaic-storage energy stations from the perspective of key indicators, but it does not consider the relationship between key parameters at the mechanistic level and operational health status. Future research could focus on analyzing the health status of photovoltaic-storage integrated energy stations from a mechanistic perspective.

Author Contributions

Conceptualization, X.W.; methodology, F.X.; software, C.T.; validation, Q.G.; formal analysis, Y.H.; investigation, Z.L.; resources, X.W.; data curation, C.T.; writing—original draft preparation, X.W.; writing—review and editing, Q.G.; visualization, C.T.; supervision, F.X.; project administration, F.X. All authors have read and agreed to the published version of the manuscript.

Funding

This work was supported in part by the National Key R&D Program of China under Grant 2021YFB2601502.

Institutional Review Board Statement

Not applicable.

Informed Consent Statement

Not applicable.

Data Availability Statement

Data available in a publicly accessible repository.

Conflicts of Interest

The authors declare no conflict of interest. The funders had no role in the design of the study; in the collection, analyses, or interpretation of data; in the writing of the manuscript; or in the decision to publish the results.

Appendix A

Table A1. Description of variables in the text.
SymbolMeaningSymbolMeaning
A1the renewable energy utilization rateA2the carbon emission reduction
A3the energy conversion efficiencyB1the demand-side satisfaction
B2the qualification rate of power supply qualityB3the reliability of power supply
C1the average device overload rateC2the device failure rate
C3the coupling device conversion rateC4the device aging degree
D1the photovoltaic module health indexD2the energy storage system health index
D3the grid connection and operational health indexD4the system loss
Wthe final fusion feature weightDD types of index
aithe linear combination coefficient of the i-th type of index characteristicswithe weight of the i-th type of index characteristics
F−1the inverse cumulative distribution function of the Cauchy distributionxijthe location point of the whale before mutation
itmaxthe maximum number of iterationstthe current number of iterations
Vijthe comprehensive prospect value functionαthe sensitivity of decision-makers to profit
βthe sensitivity of decision-makers to lossθthe decision-makers’ attitudes towards gains
εthe decision-makers’ attitudes towards lossespthe index probability
v+(−)the prospect value functionz+(−)the decision weight function
x0,jthe reference value of the j-th indicatorxijthe actual value of the j-th indicator of the i-th energy station
xjminthe minimum values of the
j-th indicator
xjmaxthe maximum values of the j-th indicator
Sijthe transformation formuladithe fitting degree of each evaluation object
Ri+(−)the correlation degree of each evaluation object with the positive and negative ideal setsθk−1the weight of the k−1 time point in the importance ranking
θkthe weight of the k indicator in the importance rankingRkthe importance degree
Xthe synthesized vectorθithe time weight of the i time point
xithe state vector of the i time pointT1the actual power consumption of the photovoltaic system
T0the total electricity consumptionC1the carbon emissions during the construction stage
C2the carbon emissions during the project’s operation and maintenance stageC3the carbon emissions during maintenance stage and the equipment recycling stage
ETthe electricity input to the traction substationhTthe peak sunshine
Pethe output power of photovoltaic arraysPmaxthe peak value of the original load curve of the substation
PPV.maxthe peak load curvePPVthe active power obtained by the substation from the power grid
Pthe original active power before connectionI(t)indicator function
SAIDIthe average failure time of the photovoltaic-storage integrated energy stationfiwhether the i-th device is overloaded
Ntotal number of equipment in the optical storage energy stationTithe outage time of the i-th equipment due to failure
T0the planned operation timetithe current service life
μA(x)the degree of importancevA(x)the degree of unimportance
πA(x)the degree of uncertainty or hesitancydPFD(a1,a2)the difference in importance of each indicator relative to the origin of the measure
w1,jthe subjective characteristic weightsφjthe convergence degree of each indicator
w2,ithe contribution of each indicatorSzthe standard deviation of the projection value
Zithe projection valueDzthe local density of the projection value
Z ¯ the projected mean value of ZiRthe radius of the local density
rijthe distance separating the ith sample from the jth sampleu(R-rij)the sign step function
w3,ithe indicator variance weightsSithe composite rating value of the energy station
Γ′the principal component variance contributionsYthe each principal component
rzjthe linear weighting coefficient of the jth indicator in the z principal componentw4,ithe sensitivity characteristic weights
s+0,jthe best value of the jth indicators0,jthe worst value of the j indicator
r+ijthe correlation coefficient between the jth indicator of the ith evaluation object and the positive ideal setrijthe correlation coefficient between the jth indicator of the ith evaluation object and the negative ideal set

Appendix B

a.
Energy saving and low carbon
(1).
Renewable energy utilization rate
A 1 = T 1 T 0 × 100 %
where A1 represents the renewable energy utilization rate, with T1 denoting the actual power consumption of the photovoltaic system in the traction power supply system and T0 representing the total electricity consumption in the traction power supply system.
(2).
Carbon emission reduction
A 2 = C 1 + C 2 + C 3
C1, C2, and C3 respectively represent the carbon emissions during the construction stage of the photovoltaic-storage integrated system project, the project’s operation and maintenance stage, and the equipment recycling stage.
(3).
Energy conversation efficiency
The photovoltaic system energy efficiency ratio is defined as the ratio of the system’s input energy under ideal conditions to the net output energy of the photovoltaic array under actual operating conditions.
A 3 = E T P e × h T
A3 is the average system efficiency of the energy station over time period T; ET represents the electricity input to the traction substation by the energy station during time period T (kWh); hT is the peak sunshine duration irradiating the photovoltaic array during time period T (hours);Pe is the output power of photovoltaic arrays.
b.
Reliable power supply
1.
Demand-side satisfaction
This paper takes into account the demand-side satisfaction of the traction power supply station with the photovoltaic-storage integrated energy station, defining demand-side satisfaction (B1) and quantifying it through active power relief and peak clipping rates resulting from the photovoltaic-storage integrated energy station’s connection
B 1 = 1 2 × ( P PV · max P max + P P PV P ) × 100 %
where Pmax is the peak value of the original load curve of the substation, PPV·max is the peak load curve after the photovoltaic-storage integrated energy stations is connected, PPV is the active power obtained by the substation from the power grid after the photovoltaic-storage integrated energy stations is connected, and P is original active power before connection.
2.
Qualification rate of energy supply quality
The bus voltage qualification rate of the photovoltaic energy storage system is defined as the proportion of time that the bus voltage falls within the set qualification range.
B 2 = 0 T I ( t ) dt T × 100 %
T represents the total monitoring time, and I(t) is an indicator function determining whether the bus voltage at time t falls within the qualified range (1 if within, 0 if not).
3.
Reliability of energy supply
B 3 = 1 SAIDI 8760 × 100 %
B3 represents the energy supply reliability rate of the photovoltaic-storage integrated energy stations, and SAIDI denotes the average failure time of the photovoltaic-storage integrated energy station.
c.
Device health
1.
Average device overload rate
r = 1 T i = 1 n ( f i )
T is the time used to calculate the overload rate of the photovoltaic-storage integrated energy stations; fi indicates whether the i-th device is overloaded, and n is the average overload rate of the photovoltaic-storage integrated energy stations equipment.
2.
Device failure rate
Device failure rate is an indicator that cannot be ignored for equipment health. The average equipment failure rate during working hours (C2) is a crucial indicator for equipment health. Its formula is
C 2 = i ( T i ) N T 0
where N is the total number of equipment in the photovoltaic-storage integrated energy stations, Ti represents the outage time of the i-th equipment due to failure; T0 represents the planned operation time.
d.
System health
1.
Subsystem health index
s r j = 10 1 n i = 1 n ( T i t i T i )
Ti represents the specified service life of the i-th equipment in the power supply system, ti is the current service life of the i-th equipment in the power supply system, and n is the total number of equipment in the power supply system. When j takes p, b, or e, they respectively represent photovoltaic modules, energy storage systems, and grid connection equipment.

Appendix C

a.
Subjective properties based on Pythagorean fuzzy sets
First, we invite a panel of c experienced experts to assess the importance of the indicators in the health status evaluation system of photovoltaic-storage integrated energy stations. Pythagorean fuzzy sets are constructed for each indicator in three situations: important, unimportant, and uncertain. Each indicator’s importance is represented as a Pythagorean fuzzy set
A = x , μ A ( x ) , v A ( x ) | x X
where μA(x) represents the degree of importance, vA(x) represents the degree of unimportance, and 0 ≤ μ2A(x) +v2A(x) ≤ 1. Additionally, the degree of uncertainty or hesitancy, πA(x), can be expressed as
π A ( x ) = 1 μ A 2 ( x ) v A 2 ( x ) , x X
For representation, a = (μa, va) is a Pythagorean fuzzy number (PFN), and the subjective importance of each indicator can be represented by one PFN.
Second, using the PFN algorithm, we calculate the difference in importance measure dPFD(a1,a2) between two different PFNs, a1 = (μa1, va1) and a2 = (μa2, va2)
d P F D ( a 1 , a 2 ) = 1 2 ( | ( μ a 1 ) 2 ( μ a 2 ) 2 | + | ( v a 1 ) 2 ( v a 2 ) 2 | + | ( π a 1 ) 2 ( π a 2 ) 2 | )
According to the theory of hesitancy, we establish that the most important indicator PFN = (1, 0), the least important indicator PFN = (0, 1), and the least important indicator is set as the origin of the importance measurement a0 = (0, 1). The difference in importance of each indicator relative to the origin of the measure can then be determined.
d P F D ( a i , a 0 ) = 1 2 ( ( μ a i ) 2 + | ( v a 1 ) 2 1 | + ( π a 1 ) 2 )
Finally, we obtain the subjective characteristic weights w1,j for each indicator from the importance measure of each indicator, which is calculated as follows:
w 1 , j = d P F D ( a j , a 0 ) j = 1 n [ d P F D ( a j , a 0 ) ]
b.
Contribution characterization
First, the reference sequence must be determined. The data for each energy station evaluation index are standardized within the range of [0,1] for each evaluation value. The reference sequence assumes the maximum value [1,1,…,1]Tn×1, and the gray-scale correlation for each indicator can be calculated:
Δ i j = | x i o x i j |
φ i j = min i   min j   Δ i j + λ max i   max j   Δ i j Δ i j + λ max i   max j   Δ i j
where λ is the resolution coefficient, usually set to 0.5. After obtaining the correlation degree of each indicator value, we calculate the convergence degree of each indicator.
φ j = 1 n i = 1 n ( φ i j )
where n indicates the total number of energy station evaluation objects. It is normalized to obtain the characteristic weights w2,i for the contribution of each indicator:
w 2 , j = φ j j = 1 m ( φ j )
where m represents the total number of evaluation indicators.
c.
Difference degree characterization
Assuming the projection direction vector b, the projected value of sample i projected in the b direction is Zi = ∑b(j)xij. With the idea of “small concentration, big divergence,” the target projection function can be constructed:
Q ( b ) = S z D z
where Sz denotes the standard deviation of the projection value Z, reflecting the projection characteristics of large dispersion, while Dz denotes the local density of the projection value Z, reflecting the projection characteristics of small concentration. The specific calculation formula is:
S z = i = 1 n Z i Z ¯ n 1
D z = i = 1 n j = 1 m R r i j u R r i j
where Zi denotes the projected value of the ith sample, Z ¯ denotes the projected mean value of Zi, R denotes the radius of the local density, typically set to 0.1Sz, rij represents the distance separating the ith sample from the jth sample, and u(Rrij) represents the sign step function. The objective function and constraint constraints can then be obtained as follows:
max Q ( b ) = S z D z s . t . j = 1 m [ b 2 ( j ) ] = 1
The optimal projection vector can be normalized to obtain the indicator variance weights w3,i:
w 3 , j = b ( j ) j = 1 m [ b ( j ) ]
d.
Sensitivity characterization
The principal components are first obtained through the variance contribution ratio, then the composite rating value of the energy station can be obtained from the linear weighting of each principal component.
S i = Γ Y = z k ( λ z Y z ) , i = 1 , 2 , , n
where Γ′ = (λ1, λ2,…, λk) represents the principal component variance contributions, and Y = (Y1,Y2,…,Yk) represents each principal component. The composite value can also be expressed as
S i = λ 1 , λ 2 , , λ k R 1 X i R 2 X i R k X i = z = 1 k [ λ z j = 1 m ( r z j x i j ) ]
where rzj represents the linear weighting coefficient of the jth indicator in the z principal component. Equation (A24) reflects the linear weighting relationship between the comprehensive evaluation value and the indicators. According to the principle of sensitivity calculation, the sensitivity of the jth indicator can be obtained:
s j = S i x i j = z = 1 k ( λ z Y z x i j ) = z = 1 k ( λ z r z j )
After normalization, we obtain the sensitivity characteristic weights w4,i.
w 4 , j = s j j = 1 m ( s j )
e.
Grey-TOPSIS model calculation steps
The worst or best foreground value is used as the ideal point in the text.
S 0 + = [ s 0 , 1 + , s 0 , 2 + , , s 0 , j + , , s 0 , m + ] S 0 = [ s 0 , 1 , s 0 , 2 , , s 0 , j , , s 0 , m ]
where s+0,j denotes the best value of the jth indicator, and s0,j denotes the worst value of the j indicator. After defining the positive and negative ideal sets, we calculate the positive and negative correlation coefficients based on Equation (A29).
r + ( ) i j = min n   min m   | S + ( ) 0 , j S i j | | S + ( ) 0 , j S i j | + ρ max n   max m   | S + ( ) 0 , j S i j | + ρ max n   max m   | S + ( ) 0 , j S i j | | S + ( ) 0 , j S i j | + ρ max n   max m   | S + ( ) 0 , j S i j |
where r+ij denotes the correlation coefficient between the jth indicator of the ith evaluation object and the positive ideal set, while rij denotes the correlation coefficient between the jth indicator of the ith evaluation object and the negative ideal set. The discrimination coefficient, ρ, which is generally set to 0.5, is used. Subsequently, the correlation degree of each evaluation object with the positive and negative ideal sets is obtained.
R i + = 1 m j = 1 m ( r i j + ) R i = 1 m j = 1 m ( r i j )

Appendix D

When the reference value is higher than the evaluation value, take index C2 as an example. The comparison results after conversion are shown in Figure A1.
Table A2. Results of the conversion of indicator values.
Conversion MethodEnergy Stations
ABCD
Raw data0.851.031.730.52
Method in this paper−0.502−0.855−2.250.0975
Linear transformation0.7250.57901
Define indicator sensitivity as
S i = d i d max 100 %
where Si is the evaluation sensitivity of sort i; di denotes the conversion value of the index of sort i; and dmax the maximum value of the index after standardization, then the result of the sensitivity of each sorted object is shown in Figure A1.
Figure A1. Sensitivity result chart.
Sustainability 16 01646 g0a1
As shown in Figure A1. the sensitivity of the method proposed in the paper for each sorted object is higher than the traditional linear transformation.

Appendix E

The flowchart of dynamic assessment of photovoltaic-storage integrated energy stations health incorporating subjective and objective characteristics is shown in Figure A2.
Figure A2. Flowchart of dynamic assessment.
Sustainability 16 01646 g0a2

Appendix F

Table A3. Mean failure frequency of critical equipment.
Evaluation IndexABCD
Renewable energy utilization rate (A1/%)90.6799.8281.4288.62
Carbon emission reduction (A2/t)2076.382231.432240.912251.19
Energy conversation efficiency (A3/%)64.9073.0062.4775.66
Demand-side satisfaction (B1/%)99.2798.1196.7597.57
Qualification rate of power supply quality (B2/%)88.1284.6084.3990.12
Reliability of power supply (B3/%)96.8595.5698.9096.95
Average device overload rate (C1/%)20.9323.6437.8438.12
Device failure rate (C2/%)0.751.131.630.62
Coupling device conversion rate (C3/%)72.9874.6372.9569.02
Device aging degree (C4)2.321.482.231.48
Photovoltaic module health indicators (D1)8.677.128.498.86
Energy storage system health indicators (D2)7.677.467.767.77
Grid connection and operation health indicators (D3)7.877.678.327.90
System loss (D4)3.783.153.283.13
Number of maintenance (D5)5464

References

  1. Jiang, F.; Peng, X.; Tu, C.; Guo, Q.; Deng, J.; Dai, F. An improved hybrid parallel compensator for enhancing PV power transfer capability. IEEE Trans. Ind. Electron. 2021, 69, 11132–11143. [Google Scholar] [CrossRef]
  2. Peng, Y.; Yang, Y. Value Evaluation Method for Pumped Storage in the New Power System. Chin. J. Electr. Eng. 2023, 9, 26–38. [Google Scholar] [CrossRef]
  3. Ding, K.; Feng, L.; Zhang, J. A health status-based performance evaluation method of photovoltaic system. IEEE Access 2019, 7, 124055–124065. [Google Scholar] [CrossRef]
  4. Cheng, C.; Wang, J.; Chen, H. Health status assessment for LCESs based on multidiscounted belief rule base. IEEE Trans. Instrum. Meas. 2021, 70, 3514213. [Google Scholar] [CrossRef]
  5. Zhang, Y.; Xin, Y.; Liu, Z. Health status assessment and remaining useful life prediction of aero-engine based on BiGRU and MMoE. Reliab. Eng. Syst. Saf. 2022, 220, 108263. [Google Scholar] [CrossRef]
  6. Peng, J.; Kimmig, A. Wind turbine failure prediction and health assessment based on adaptive maximum mean discrepancy. Int. J. Electr. Power Energy Syst. 2022, 134, 107391. [Google Scholar] [CrossRef]
  7. Liu, C.; Zuo, X. A study on dynamic evaluation of urban integrated natural disaster risk based on vague set and information axiom. Nat. Hazards 2015, 78, 1501–1506. [Google Scholar] [CrossRef]
  8. Li, M.; Du, Y. Dynamic integrated evaluation of coupled distribution grid and heat pump energy storage system. Therm. Power Gener. 2022, 51, 79–87. [Google Scholar] [CrossRef]
  9. Wang, D.; Cai, D. Application of dynamic comprehensive evaluation method in power system emergency management capability assessment. Power Syst. Prot. Control 2019, 47, 101–107. [Google Scholar] [CrossRef]
  10. Zhou, Y.; Hu, W. Dynamic comprehensive evaluation method of power industry development level based on provincial data. Autom. Electr. Power Syst. 2016, 40, 76–83. [Google Scholar] [CrossRef]
  11. Leng, Y.J.; Peng, D.P.; Zhuang, H. Integrated energy system evaluation method based on dimensionality reduction and indexes updating with incomplete information. Energy 2023, 277, 127552. [Google Scholar] [CrossRef]
  12. Zhu, X.; Niu, D.; Wang, X. Comprehensive energy saving evaluation of circulating cooling water system based on combination weighting method. Appl. Therm. Eng. 2019, 157, 1359–4311. [Google Scholar] [CrossRef]
  13. Lu, Z.; Gao, Y.; Xu, C. Evaluation of energy management system for regional integrated energy system under interval type-2 hesitant fuzzy environment. Energy 2021, 222, 119860. [Google Scholar] [CrossRef]
  14. Li, W.Y.; Dong, F.G.; Lin, J. Evaluation of provincial power supply reliability with high penetration of renewable energy based on combination weighting of game theory-TOPSIS method. Sustain. Energy Grids Netw. 2023, 35, 23524677. [Google Scholar] [CrossRef]
  15. Zou, Y.; Wang, Q.; Hu, B. Hierarchical evaluation framework for coupling effect enhancement of renewable energy and thermal power coupling generation system. Int. J. Electr. Power Energy Syst. 2023, 146, 108717. [Google Scholar] [CrossRef]
  16. Wang, Y.; Fu, Y. Improved index weighting method for dynamic comprehensive evaluation of water resources carrying capacity. J. Stat. Inf. 2022, 37, 887–895. [Google Scholar] [CrossRef]
  17. Chai, D.; Tong, Z. Comparision of Air Combat Effectiveness Assessment Methods Based on Sensitivity Analysis of Indicator. Fire Control Command Control 2012, 37, 21–24. [Google Scholar] [CrossRef]
  18. Su, Y.; Jiang, X. Empirical analysis of the technological innovation ability of regional high-tech enterprises based on gray target theory. Guizhou Soc. Sci. 2015, 2, 119–126. [Google Scholar] [CrossRef]
  19. Liu, Y.; Wang, L.; Li, D.; Wang, K. State-of-health estimation of lithium-ion batteries based on electrochemical impedance spectroscopy: A review. Prot. Control Mod. Power Syst. 2023, 8, 41. [Google Scholar] [CrossRef]
  20. Li, J.; Li, Y.; Feng, B. Wind turbine health state assessment based on stochastic combination weighting fuzzy evaluation. Acta Energiae Solaris Sin. 2022, 43, 340–351. [Google Scholar] [CrossRef]
  21. Zeng, S.; Mu, Z. A method based on hybrid weighted distance for pythagorean fuzzy TOPSIS multiple-attribute decision making. Chin. J. Manag. Sci. 2019, 27, 198–205. [Google Scholar] [CrossRef]
  22. Deng, C.; Xie, B.; Li, X. Evaluation of intensive cultivated land use based on a projection pursuit model in Changsha-Zhuzhou-Xiangtan urban agglomeration. Geogr. Res. 2013, 32, 11. [Google Scholar] [CrossRef]
  23. Ma, L.; Zhang, T.; Lu, Z. Comprehensive evaluation of regional integrated energy system based on variable weight extension cloud model. Trans. China Electrotech. Soc. 2022, 37, 2789–2799. [Google Scholar] [CrossRef]
  24. Chu, D.; Chen, H.; Wang, X. Whale optimization algorithm based on adaptive weight and simulated annealing. Acta Electron. Sin. 2019, 47, 992–999. [Google Scholar] [CrossRef]
  25. Hou, J.; Xu, Z.; Yu, W. Multi criteria evaluation framework of building triple supply system in multi climate regions based on Grey-Prospect TOPSIS. Power Syst. Technol. 2023, 47, 2659–2670. [Google Scholar] [CrossRef]
  26. Guo, Y.; Yao, Y.; Yi, P. A method and application of dynamic comprehensive evaluation. Syst. Eng.-Theory Pract. 2007, 27, 154–158. [Google Scholar] [CrossRef]
  27. Tang, X.; Hu, Y. Flexibility Evaluation Method of Power Systems with High Proportion Renewable Energy Based on Typical Operation Scenarios. Electronics 2020, 9, 627. [Google Scholar] [CrossRef]
Figure 1. Photovoltaic-storage integrated energy stations health status evaluation index system.
Sustainability 16 01646 g001
Figure 2. Diagram of different reference values. (a) Less than reference point (b) Greater than the reference point (c) The reference point is located between the evaluation values.
Sustainability 16 01646 g002
Figure 3. Health state vector diagram.
Sustainability 16 01646 g003
Figure 4. Dynamic state vector evaluation chart.
Sustainability 16 01646 g004
Figure 5. Schematic diagram of pythagorean fuzzy sets.
Sustainability 16 01646 g005
Figure 6. Contribution thermodynamic diagram.
Sustainability 16 01646 g006
Figure 7. Annular heat map after index transformation.
Sustainability 16 01646 g007
Figure 8. Photovoltaic-storage integrated energy stations evaluation result chart. (a) Radar charts of indicators (b) Health Status Vector.
Sustainability 16 01646 g008
Figure 9. Dynamic state vector evaluation chart of station D.
Sustainability 16 01646 g009
Figure 10. Comparison chart of different weighting methods.
Sustainability 16 01646 g010
Figure 11. Comparison chart of different time weights.
Sustainability 16 01646 g011
Table 1. The research status of the health statue evaluation.
Ref.Evaluation IndexWeight CalculationAssessment Method
[7]Hazard, exposure, vulnerability, disaster prevention, and mitigation capacityInformation axiomA dynamic assessment model based on fuzzy sets, information axioms and comprehensive assessment
[8]Technology, environmental, economicAHP and Entropy-weight MethodThe fuzzy comprehensive evaluation model modified by the center of gravity method
[9]Legal basis, organizational system, disaster prevention and early warning, disaster response capacity, post disposalAHP and Coefficient of VariationDynamic integrated evaluation method based on time-weighted average-temporal weighted geometric average hybrid operator model
[10]The coordination degree, power generation, power consumption, power supply, developing potentialFuzzy expert evaluation and weights non-dictatorship condition with projection pursuit modelDynamic integrated evaluation method based on time-series weight vectors
[11]Benefit-type indexes, cost-type indexesThe standard deviation weight methodAn evaluation method based on generalized regression neural network and probabilistic neural network
[12]Energy consumption index, energy efficiency index, operation quality index and pollution indexAHP and Entropy-weight MethodComprehensive evaluation based on combination weighting method
[13]Economic, environmental, technical, energy, serviceIT2HF-DEMATEL method and the entropy methodCredibility-based hesitant fuzzy linguistic term set
[14]Electricity supply and demand indexes, renewable energy development indexes, electricity transmission indexes, electricity
Market indexes
AHP, entropy, and CRITIC methodCombination weighting of game theory-TOPSIS method
[15]Resource, economy, environmentHesitant fuzzy preference relationThe coupling coordination degree evaluation model
Table 2. Results of different evaluation methods.
Evaluation MethodologySequencing of Energy Stations
ABCD
Method of this paper4321
Linear transformation + linear evaluation [27]4231
Linear transformation + Grey-TOPSIS [25]4231
Linear transformation + TOPSIS [21]4231
Disclaimer/Publisher’s Note: The statements, opinions and data contained in all publications are solely those of the individual author(s) and contributor(s) and not of MDPI and/or the editor(s). MDPI and/or the editor(s) disclaim responsibility for any injury to people or property resulting from any ideas, methods, instructions or products referred to in the content.

