Article

A Study on the Changes of Green Total Factor Productivity in Chinese Cities under Resource and Environmental Constraints

1
School of Marxism, Sichuan Research Center for Circular Economy, Southwest University of Science and Technology, Mianyang 621010, China
2
School of Life Science and Engineering, Southwest University of Science and Technology, Mianyang 621010, China
3
School of Economics and Management, Sichuan Province Cyclic Economy Research Centre, Southwest University of Science and Technology, Mianyang 621010, China
*
Author to whom correspondence should be addressed.
Sustainability 2024, 16(4), 1658; https://doi.org/10.3390/su16041658
Submission received: 27 December 2023 / Revised: 8 February 2024 / Accepted: 15 February 2024 / Published: 17 February 2024
(This article belongs to the Section Sustainable Urban and Rural Development)

Abstract

:
Confronting the dual challenges of excessive resource consumption and environmental pollution, the traditional extensive economic development pattern significantly impeded the high-quality development of the Chinese economy. Examining variations in green total factor productivity across different types of cities holds substantial practical significance for promoting coordinated regional development and facilitating the green transformation of urban economies. Panel data from 283 cities in China spanning the years 2006 to 2020 were selected for analysis. The window-Malmquist–Luenberger index model, incorporating a mixed distance function, was employed to assess changes in green total factor productivity among the sample cities. The results were then categorized and analyzed based on different city attributes. The findings indicate that (1) the variation in green total factor productivity across China’s four major regions from 2006 to 2020 is generally characterized by an initial decline followed by an increase; (2) the proportion of cities with significantly improved green total factor productivity decreases from the east to the central, western, and northeastern regions; (3) the increase in green total factor productivity is positively correlated with city size, suggesting that larger cities experience higher growth in green total factor productivity; (4) first- and second-tier cities exhibit a relatively high mean value of green total factor productivity growth, while third-, fourth-, and fifth-tier cities demonstrate relatively lower growth.

1. Introduction

The 20th National Congress of the Communist Party of China, as outlined in its report, identified the harmonious coexistence of human beings and nature as a distinctive feature of Chinese-style modernization. The imperative is to expedite the green transformation of the development paradigm, undertake comprehensive measures for the prevention and control of environmental pollution, and actively and steadily advance initiatives such as carbon peaking and carbon neutrality. In the preceding decades, China, while sustaining high economic growth, incurred substantial costs in terms of resources and environmental impact. The crude development model and exploitative resource practices have become unsustainable. Rapid resource depletion poses a significant constraint on China’s aspirations for high-quality and sustainable economic development. BP energy statistics reveal that China’s energy consumption constitutes over 20% of global energy consumption, establishing it as the world’s foremost energy consumer. The demand for energy consumption exceeds domestic supply, leading to a substantial reliance on imports, particularly in crude oil, with projections indicating that China’s crude oil imports will constitute about 75% of its demand by 2035, posing a considerable challenge to economic and social security, as noted by the U.S. Energy Information Administration. Simultaneously, the robust economic growth and heightened energy consumption gave rise to escalating environmental issues, notably urban air and water pollution. The 2022 China Ecological Environment Status Bulletin, released by the Ministry of Ecology and Environment, underscores the severity of the situation, with only 62.8% of China’s 339 prefectural-level and above cities meeting ambient air quality standards. Instances of severe and heavy pollution spanned 1113 days. Recognizing that increasing total factor productivity is a pivotal driver for achieving long-term sustainable economic growth [1,2], it becomes imperative to acknowledge that traditional total factor productivity metrics fall short by neglecting energy inputs and environmental impacts, thereby failing to accurately reflect the genuine level of sustainable economic development [3]. Since 2009, when the Organization for Economic Cooperation and Development posited that environmental challenges could constitute an economic burden on developing nations, global attention has increasingly focused on green development.
While numerous scholars extensively researched the connotation of green total factor productivity and developed evaluation index systems [4,5], the evolution of measurement methods from the Solow residual method to advanced techniques such as Data Envelopment Analysis (DEA) and Stochastic Frontier Production Function (SFA) [6,7,8,9] represents a significant advancement. However, the established studies lack a micro-study of the city level on a national scale, especially a comparative analysis of the quality and efficiency of economic development among cities with different population sizes and different levels of development. In the context of China’s new normal economy and supply-side reform, what is the status of green economy development in different types of cities? What kind of differences exist? How can we better use the market mechanism and the government’s differentiated industrial development policy guidance to promote the green total factor productivity of various types of cities in the next step? This is the focus of this paper. In view of this, this paper selects 283 cities in China as the research object and studies the trend of green total factor productivity (GTFP) under the double constraints of resources and environment, which is of great practical significance for China’s construction of the modernized industrial system, the realization of the goal of “carbon peak and carbon neutrality”, as well as the promotion of the green development of the urban economy in developing countries.

2. Literature Review

As scholarly endeavors continue to delve deeper into the exploration of green total factor productivity (GTFP), the existing literature predominantly concentrates on the national, provincial, or industry levels, with a relatively limited number of studies specifically addressing GTFP at the city level. At the national level [10,11], Shen, Zhiyang, et al. (2017) conducted an analysis using data from 30 OECD countries from 1971 to 2011, employing the Luenberger productivity indicator to measure green productivity, including carbon dioxide emissions [12]. Similarly, Huang et al. (2017) focused on a sample of 42 countries along the “Belt and Road” from 1995 to 2012, determining that pure technological progress, technological scale, and scale efficiency drive the growth of GTFP [13]. Provincial-level studies [14], such as the work of Luo and Xie (2023), measured GTFP for 30 provinces in China from 2000 to 2020, utilizing the Slacks-Based Measure and Global Malmquist–Luenberger index model (SBM-GML) [15]. Meanwhile, Peng et al. (2022) employed the Epsilon-Based Measure (EBM) model to assess GTFP using 30 inter-provincial panel data in China from 2002 to 2020, concluding that the development of carbon emission reduction significantly enhances GTFP [16]. Industry-level studies [17], exemplified by Cui et al. (2021), utilized stochastic frontier analysis (SFA) and Markov chain methods to evaluate the characteristics of GTFP dynamics evolution and convergence trends across 36 industrial industries from 2000 to 2016 [18]. Liu et al. (2020) adopted the SBM–Malmquist index model to measure changes in GTFP in forestry across 30 provinces in China from 2005 to 2016, revealing that differences in changes mainly originated within spatial regions [19]. However, the literature on GTFP at the city level in China, considering resource and environmental cost constraints, remains limited. Only a few scholars have undertaken studies focusing on selected Chinese cities, such as smart cities and low-carbon cities [20,21]. This gap in the literature emphasizes the need for further research at the city level, particularly under the context of resource and environmental considerations.
Upon reviewing the existing literature, this study identifies several shortcomings in prior research. Firstly, a prevalent deficiency lies in the methods employed for measuring green total factor productivity (GTFP), with many studies relying on radial or non-radial directional distance functions while neglecting the consideration of mixed radial functions. In practical production processes, both radial and non-radial relationships exist between inputs and outputs. For instance, energy inputs and environmental pollution often exhibit a proportional change relationship, whereas input factors like labor and environmental pollution may have non-same proportional change relationships. The utilization of traditional models in such scenarios can lead to biased measurement results. This paper addresses this issue by adopting the Epsilon-Based Measure (EBM) model, which accounts for the characteristics of both radial and non-radial models. The EBM model not only distinguishes between desired and non-desired outputs but also remains compatible with the radial ratio between the input frontier value and the actual value. Furthermore, it accommodates the non-radial relaxation of input differentiation. Consequently, the measurement results derived from the EBM model align more closely with the intricacies of the actual production environment.
Secondly, with respect to the scope of research content, the prevailing body of literature predominantly concentrates on assessing changes in green total factor productivity (GTFP) at the provincial, industry, and regional city cluster levels, with a noticeable dearth of studies at the city level. Cities, as manifestations of spatially concentrated factors, serve as the epitome, center, and focal points of regions, representing the most tangible unit for observing changes in GTFP. Recognizing the significance of cities in this context, this paper undertakes an examination of GTFP changes at the city level. This approach facilitates a more precise and realistic reference framework for comprehending the nuances of green economic development across diverse city types. To achieve this objective, the study employs a sample of 283 Chinese cities spanning the period from 2006 to 2020. The Malmquist–Luenberger index model, incorporating a mixed distance function, is selected for measuring urban green total factor productivity. The analysis encompasses a comparative examination from temporal, spatial, city size, and city class perspectives. Building upon these insights, the paper formulates policy suggestions aimed at fostering green development tailored to the unique characteristics of different cities.

3. Research Methodology, Selection of Indicators, and Data Sources

3.1. Research Methodology

3.1.1. Mixed Distance Function (Epsilon-Based Measure Model)

In this paper, we refer to the Epsilon-Based Measure (EBM) model proposed by Tone and Tsutsui (2010) [22], which is a model with both radial and non-radial characteristics, which makes the measurements more accurate. For a decision-making unit (DMU) with m input indicators (x) and q output indicators (y), the model is shown below:
γ * = min θ , λ , s θ ε x i = 1 m w i s i x i 0 s . t . θ x 0 X Y λ s = 0 Y λ y 0 λ s 0 s 0
where γ * is the efficiency target value. θ denotes the planning parameters for the radial component; s represents the slack variables for the non-radial input elements; λ is a vector of weights. w i is the weight of the input, and i = 1 m w i = 1 ( w 0 , i ) . ε x is key parameters containing radial and non-radial relaxation terms, taking values in the range of [0, 1], which, when taking 0, is the radial model, and, when taking 1, transforms into the SBM model. X is the input vector and Y is the output vector.

3.1.2. EBM–Window Model

The traditional EBM model measures obtain the static efficiency value of decision-making unit at a certain point in time, which cannot reflect the green total factor productivity changes. The DEA Window analysis method is based on the principle of moving average to study the performance trend of decision-making units (DMU) over time [23] and is able to achieve an increase in sample capacity by considering each unit in different periods as a different decision-making unit. To reflect changes in urban green total factor productivity from a dynamic perspective over a selected window period. Assuming that the N decision units ( n = 1 , 2 , 3 , ... , N ) have m input indicators and q output indicators in period T ( t = 1 , 2 , 3 , ... , T ), the number of sample observations is N × T , the m -dimensional input vector and q -dimensional output vector of D M U t n are, respectively,
X t n = ( x 1 t n , x 2 t n , ... , x m t n )
Y t n = ( y 1 t n , y 2 t n , ... , y q t n )
Decision unit D M U t n starting from period k with a window width of d , denoted by k d , then 1 d T k , with N × d observations. The input and output matrices for the window analysis are
X k d = ( x k 1 , x k 2 , ... , x k N , x k + 1 1 , x k + 1 2 , ... , x k + 1 N , ... , x k + d 1 , x k + d 2 , ... , x k + d N )
Y k d = ( y k 1 , y k 2 , ... , y k N , y k + 1 1 , y k + 1 2 , ... , y k + 1 N , ... , y k + d 1 , y k + d 2 , ... , y k + d N )
With constant returns to scale (CRS) and multiplier constraints ( Z ), the input-oriented DEA Window measure is formulated as follows. The meanings of some of the parameters are set as in Equation (1):
θ k d t = min θ , λ , z θ s . t . X k d λ + θ x t + C i z 0   Y k d λ y t + C 0 z 0 λ n 0 ( n = 1 , 2 , 3 ... , N × d ) z 0 , z R 0 L
In which θ k d t denotes the optimal efficiency value in window k d , C i denotes an m × L -dimensional matrix; C 0 denotes a q × L -dimensional matrix, z R 0 L denotes the multiplicative constraint.
In this study, with reference to the principle of window analysis method, the EBM model and DEA window analysis are combined, the window width is selected to be 3, and the efficiency of all DMUs is measured by using the EBM model in each window, make measurements more accurate and reliable, and the formula of the EBM–Window model measurement is as follows:
θ k d t * = min θ , λ , s θ ε x i = 1 m w i s i x i 0 , ( 1 t T , 1 n N ) s . t . θ x t n X k d Y k d λ s = 0 Y k d λ y t n λ s 0 s 0
θ k d t * denotes the optimal efficiency value of the EBM–Window model in window k d .

3.1.3. EBM–Window–Malmquist–Luenberger Exponential Model

Since decisions within a given window are measured against each other, this method implicitly assumes that there is no technological change in each window, while in combination with the Malmquist–Luenberger index method, it can effectively compensate for the shortcomings of the Window–DEA Window analysis in not being able to estimate technological change and more accurately measure the dynamics of the green total factor productivity in the t to t + 1 period [24,25]. The Malmquist–Luenberger exponential model is measured by the following formula:
M L t t + 1 = [ D t + 1 ( x t + 1 , y t + 1 ) D t + 1 ( x t , y t ) × D t ( x t + 1 , y t + 1 ) D t ( x t , y t ) ] 1 2
where M L t t + 1 denotes the ML index from period t to t + 1, D t ( x t , y t ) is the distance function in period t, which denotes the distance between the decision unit and the effective production frontier. If M L t t + 1 > 1 indicates an increase in efficiency, M L t t + 1 < 1 indicates a decrease in efficiency, M L t t + 1 = 1 indicates no change in efficiency.
Therefore, this paper draws on the research method of Asmild et al. (2004), combining the Window analysis method with the Malmquist–Luenberger index and using the EMB–Window–Malmquist–Luenberger index model to measure the change in green total factor productivity [26]. At a window width of d , the formula for the change in the green total factor productivity change index (GTFP) of the decision unit between periods t and t + 1 is as follows:
G T F P ( t , t + 1 ) = [ θ t d t + 1 * θ t d t * θ t + 1 d t + 1 * θ t + 1 d t * ] 1 / 2

3.2. Selection of Indicators and Data Sources

3.2.1. Input Factor Indicators

In this study, labor, physical capital, and energy consumption are identified as key input factor indicators. The indicator for labor input is determined by the number of people employed in the municipal area at the end of each year in each city. Energy inputs are gauged through the total energy consumption, categorized by type, in each city. Harmonized unit conversions are applied to ensure consistency across different types of energy consumption. Physical capital inputs are represented by the city’s capital stock, estimated using the perpetual inventory method. Specifically, the annual fixed asset investment in each city is calculated by multiplying the fixed asset investment in the city’s jurisdiction by the ratio of fixed asset investment to total social investment in the respective province.

3.2.2. Output Factor Indicators

This study employs a classification of output factor indicators into desired and non-desired outputs. GDP value added serves as the indicator for desired output, with adjustments made to the GDP value added of each city to constant 2006 prices in the base period. This adjustment is executed using the Gross Regional Product index for the province in which each city is situated. To comprehensively assess the environmental pollution in urban areas, non-desired output indicators include industrial soot, industrial exhaust, and industrial wastewater emissions.
The dataset utilized in this paper consists of panel data spanning 283 cities in China from 2006 to 2020, and the base period for the calculation of the data involved in the paper is 2006. The data come from the China Statistical Yearbook, China Urban Statistical Yearbook, and regional data published by the National Bureau of Statistics (NBS) as well as the statistical bureaus of each city [27]. Initially, sample cities were geographically categorized into four major economic regions—eastern, central, western, and northeastern—based on the criteria outlined in China’s regional coordinated development strategy. Subsequently, the top ten cities in each region with the highest standard deviation of green total factor productivity change were selected as typical cities. City size classification adheres to the standards set forth in China’s “Circular of the State Council on the Adjustment of the Standard for the Division of City Size” issued in 2014, categorizing cities into five categories and six grades based on population size. Lastly, city class categorization follows the city class classification outlined in the Research Report on China’s Social Mentality (2016) [28] by the Chinese Academy of Social Sciences, which classifies sample cities into five categories and seven grades based on their economic and social development status.

4. Analysis of Green Total Factor Productivity Changes in Chinese Cities

The Window–Malmquist–Luenberger index model containing mixed distances was first used to measure the green total factor productivity changes and decomposition values of the 283 sample cities across China from 2006 to 2020. Subsequently, the geometric mean of green total factor productivity change and decomposition values for each city at each time point under different economic regions is calculated and represented in a line graph. Additionally, the spatial evolution of green total factor productivity changes in cities is visually depicted using ArcGIS 10.2 software. Building on a comprehensive analysis of spatial and temporal patterns in green total factor productivity changes across cities in the four regions, the study selects typical cities with substantial changes in green total factor productivity for further analysis. This analysis aims to elucidate the inherent connection between the magnitude of changes in green total factor productivity and the economic development state of each region. Finally, the sample cities are categorized based on two criteria—city size and city grade. The geometric mean of the change in green total factor productivity for cities of different sizes and grades is then calculated and presented in line graphs. These visual representations contribute to a nuanced understanding of how green total factor productivity changes vary across cities of different sizes and economic statuses.

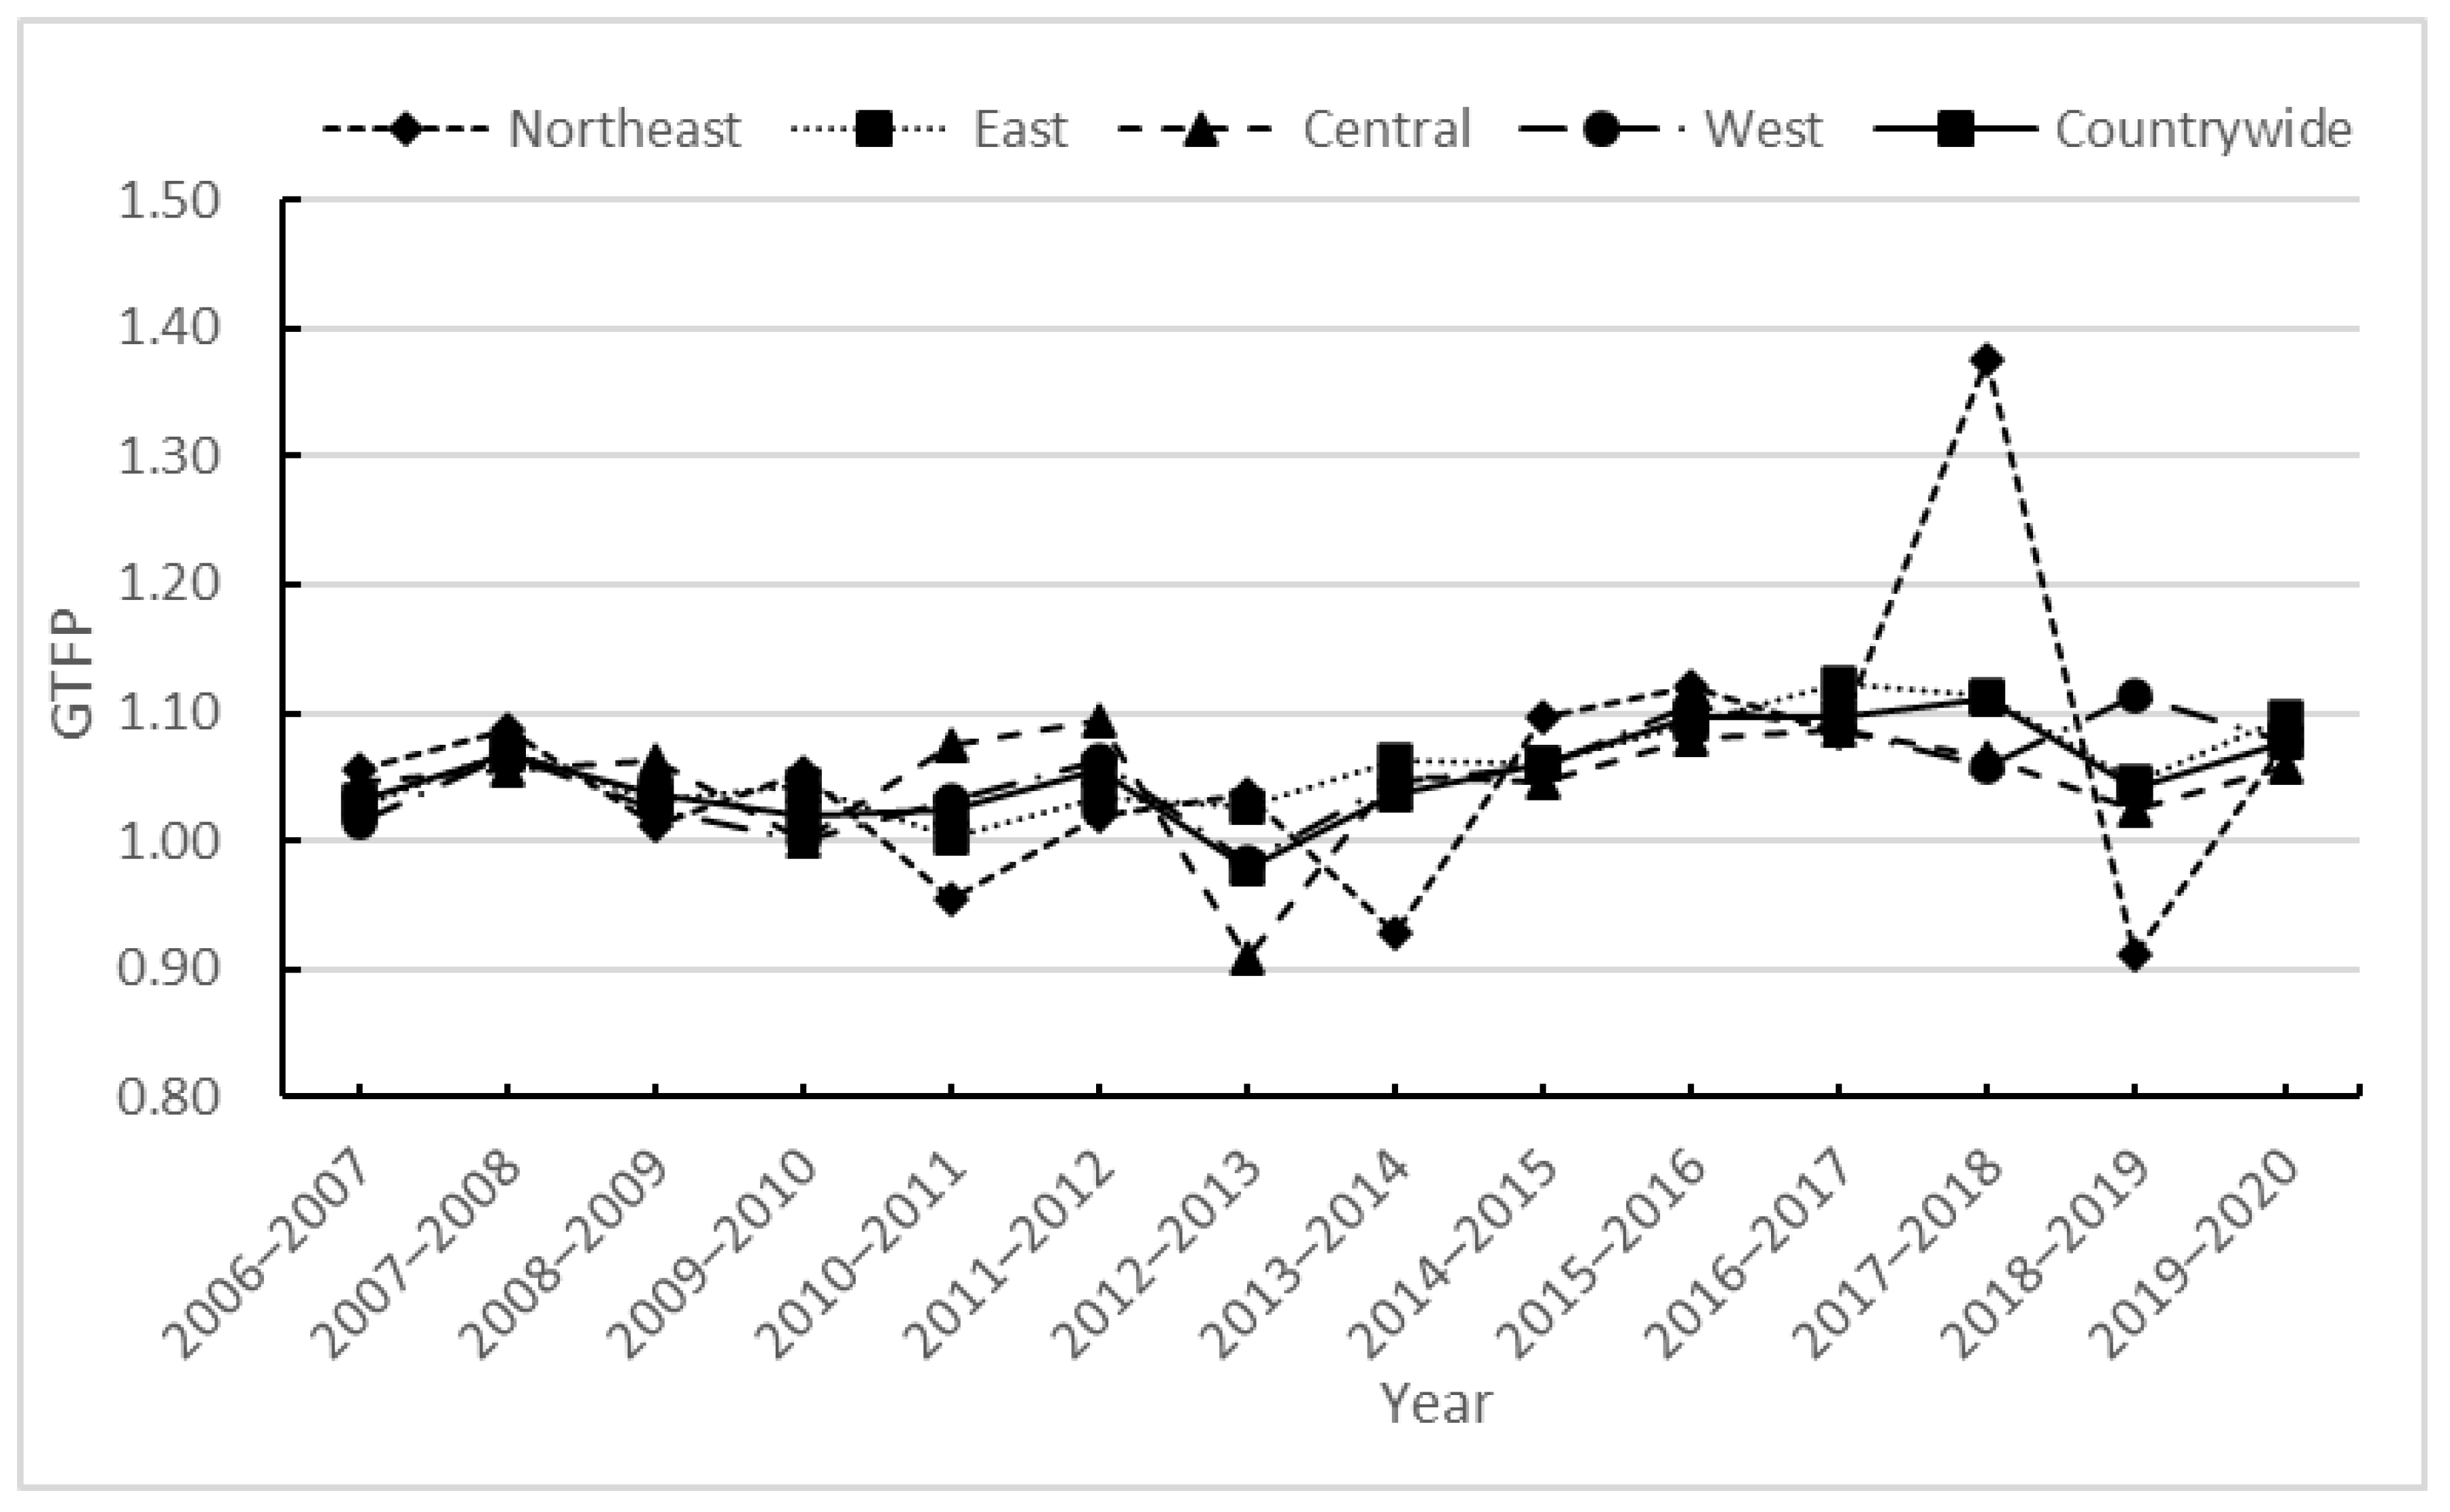
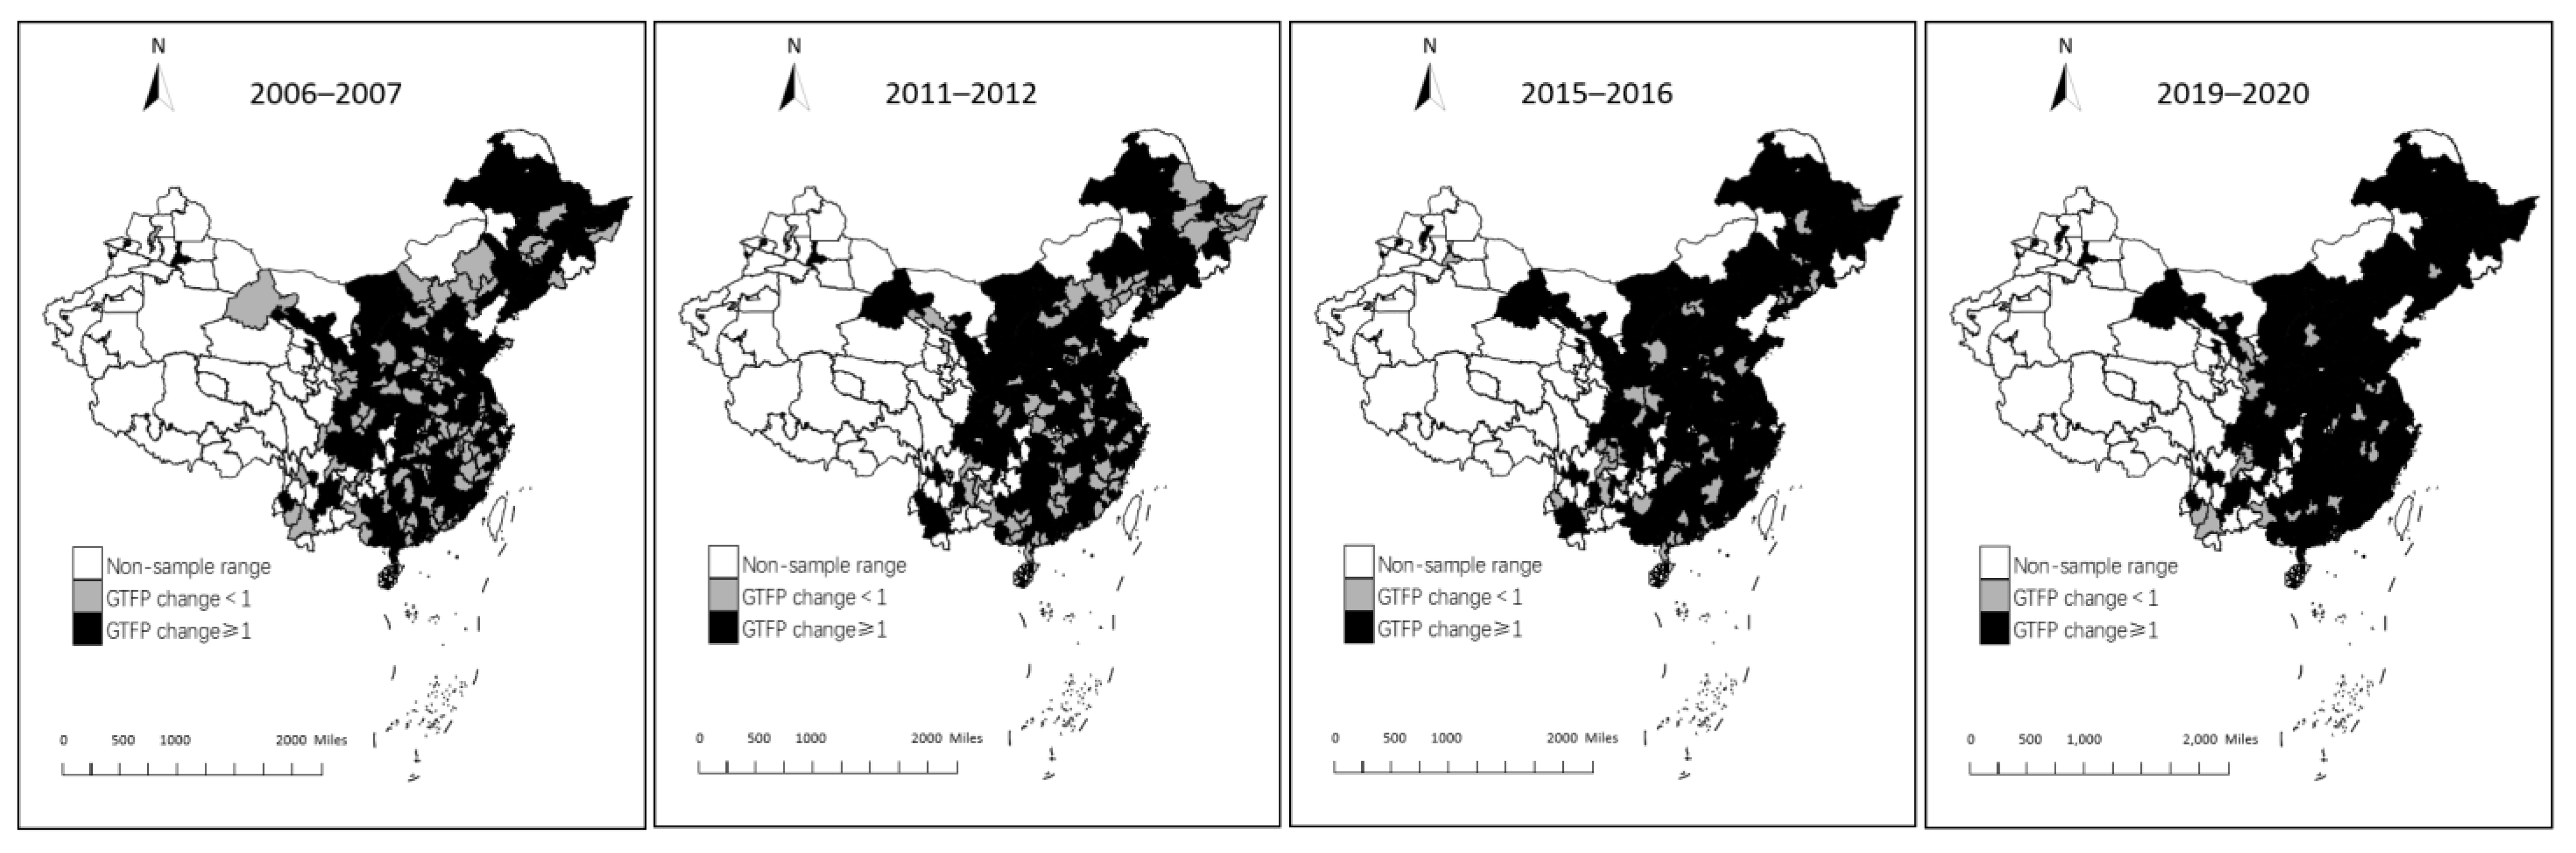
4.1. Analysis of the Evolution of the Spatial and Temporal Patterns of Green Total Factor Productivity in Cities

The analysis presented in Figure 1 reveals that the green total factor productivity levels of cities in eastern, central, western, and northeastern China exhibited predominantly positive growth from 2006 to 2020. The average growth rate over this period stood at 5.21%, with generally consistent fluctuations. Between 2006 and 2015, urban green total factor productivity displayed a stable change, hovering around 1.03. However, following 2015, coinciding with the enactment and enforcement of policy measures such as China’s new Environmental Protection Law and the Overall Program for the Reform of the Ecological Civilization System, green total factor productivity experienced an elevated growth trajectory. The average growth rate surged to 8.4%, reaching its zenith during the 2006–2020 period with a remarkable growth rate of 16.85% in 2017–2018.
From a temporal perspective, as indicated in Table 1, the proportion of cities in China’s four major regions experiencing green total factor productivity (TFP) changes greater than 1 followed a downward and then upward trajectory from 2006 to 2020. During the period 2006–2013, the proportion of cities with green total factor productivity greater than 1 decreased from 62.19% to 45.23%, with the number of cities dropping from 176 to 128. This decline can be attributed to China’s adoption of a crude development model in pursuit of rapid economic growth. Cities predominantly relied on high-pollution and high-emission industries for economic development, incurring a substantial environmental cost and resulting in a clear downward trend in green total factor productivity. The sharp decline in the proportion of cities with green total factor productivity change greater than 1 in 2009–2010 may be linked to the impact of the U.S. subprime mortgage crisis in 2008. During this period, global industries faced a downturn, and China’s economy experienced a certain degree of impact. In response to the crisis, economic stimulus policies led enterprises to invest heavily in factors of production, neglecting the implications for resources and the environment [29]. The time lag in the impact of stimulus policies on green total factor productivity inhibited its increase in the later stages of the crisis. Although there was a brief rebound in the urban share between 2010 and 2012, the year 2013 marked the transition from China’s 12th Five-Year Plan, with economic development shifting from policy stimulus to endogenous growth. Concurrently, as the new economy normally took shape and industrial restructuring continued to evolve, the economic growth rate underwent an adaptive adjustment, negatively impacting the growth of green total factor productivity. Post-2013, with the introduction of the concept of green development and the implementation of the 12th Five-Year Plan’s opinions on ecological and environmental protection, localities accelerated the transformation and upgrading of green production methods. The shift towards green new industrialization became apparent, leading to a significant increase in the percentage of cities with a change in green total factor productivity greater than 1 [30]. The formal implementation of the Environmental Protection Tax Law of the People’s Republic of China in 2018 further compelled production entities to adjust production technology and resource allocation through tax means. This dual approach of promoting economic growth while reducing emissions and addressing pollution contributed to the accelerated green transformation of cities. By 2020, the percentage of cities with green total factor productivity change greater than 1 had reached 90.46%.
From a regional spatial evolution perspective, as depicted in Figure 2, the proportion of cities with green total factor productivity (TFP) changes greater than 1 exhibited a decreasing trend from the east to the central, west, and northeast regions during the period 2006–2020 [31]. The average proportions for each region were 69.68%, 64.93%, 63.01%, and 60.97%, respectively, aligning with the regional economic development situation. Cities in the eastern region, buoyed by resource endowments and policy advantages, historically enjoyed prioritized development. The government’s appraisal mechanism and incentives facilitated early-stage development, particularly in the three major economic circles of the Yangtze River Delta, the Pearl River Delta, and the Beijing–Tianjin–Hebei region. Geographically, the coastal region, home to major ports like Dalian, Shanghai, Shenzhen, and Ningbo Zhoushan, boasts a high degree of openness to the outside world, attracting substantial foreign investment. This openness fostered research, development, and the dissemination of advanced technologies, leading to the emergence of green technologies and clean energy. Consequently, the eastern region serves as a demonstration zone for green development in China, contributing to the notable growth in green total factor productivity. In the western and central regions, the imperative for economic development has driven the acceptance of numerous heavy industries and polluting enterprises transferred from the eastern regions. This resulted in higher polluting emissions and lower output, reflecting a cruder mode of economic development that is yet to prioritize quality and efficiency. As a consequence, there exists a larger gap in overall green total factor productivity compared to the eastern region. The proportion of cities in the northeast region with green total factor productivity changes greater than 1 is the lowest. As China’s old industrial base, the northeast region has long relied on heavy industries with high energy consumption and pollution as the economy’s pillar industries. This reliance consumed significant environmental resources, making it challenging for cities in the region to adapt to the requirements of green development. Consequently, the northeast region experienced persistently low green total factor productivity over an extended period.

4.2. Analysis of Green Total Factor Productivity Changes in Typical Cities

To analyze the amplitude of urban green total factor productivity changes within the regional sample, this study identifies the top ten cities in the standard deviation rankings of green total factor productivity changes in the four regions—northeast, east, central, and west—from 2006 to 2020 as typical cities for individualized analysis.
As shown in Table 2, the mean values of the standard deviation of green total factor productivity for typical cities in the northeast, east, west, and central regions are 0.2796, 0.3745, 0.2552, and 0.2919, respectively. This suggests that the cities in the east exhibit the largest change in green total factor productivity, with the fluctuation amplitudes of the central, northeast, and western regions decreasing in that order. The average change in green total factor productivity for typical cities in each region is greater than 1, indicating that the improvement in urban green total factor productivity is greatest in the eastern regions and least in the western region. Specifically, the change in green total factor productivity for a typical city in the eastern region was 37.45%, with an average annual increase of 8.83%. In 10 typical cities, the change in green total factor productivity was greater than 1, and the degree of improvement in green total factor productivity in four cities—Shaoxing, Hengshui, Weihai, and Liaocheng—is greater than the geometric mean. This indicates that typical cities in the eastern region, leading the way in transforming kinetic energy, adopting green development, constructing eco-industrial systems, and promoting the upgrading and transformation of traditional industries, achieved notable results and consistently maintained a leading position in the economy. For the central region, the change in green total factor productivity was 29.19%, with an average annual increase of 3.98%. Only two cities, Datong and Xuancheng, experienced a decline in green total factor productivity. This may be attributed to the fact that resource-oriented cities like Datong in Shanxi province have long relied on energy inputs for urban economic development, with environmental pollution acting as a constraint on their economic growth. Typical cities in the northeast region witnessed a change of 27.96%, with an average annual increase of 5.20% in urban green total factor productivity. All of the top ten typical cities showed small increases in green total factor productivity. This is likely due to the decline of the old industrial bases in the northeast, limiting the potential for improvement in total factor productivity in the face of declining industrial competitiveness, market share reduction, resource depletion, and brain drain. In the western region, the average change in green total factor productivity for typical cities is 25.52%, with an average annual growth of 4.53% from 2006 to 2020. The development process in the western region is characterized by high-pollution, high-consumption, and high-emission industries. Additionally, it absorbed numerous enterprises transferred from the eastern and central regions in response to strict local environmental protection policies. The slow release of environmental pressure minimized the improvement of green total factor productivity. Therefore, upgrading the quality of green innovation technology and economic development in the western region is crucial for enhancing green total factor productivity and realizing the high-quality development of China’s economy.

4.3. Analysis of Changes in City Size and Green Total Factor Productivity

Utilizing the criteria outlined in the Circular of the State Council on Adjusting the Criteria for the Classification of City Scale issued by China in 2014, with population size as the classification criterion, this study combines the changes in the average green total factor productivity of cities from 2006 to 2020 to categorize the sample cities into five categories and six classes. The detailed classification results are presented in Table 3.
In the six grades of classification detailed in Table 3 and Figure 3, the green total factor productivity of small cities, medium-sized cities, Type II large cities, Type I large cities, super-large cities, and super cities grew by 4.20%, 5.16%, 5.58%, 5.33%, 7.96%, and 7.45%, respectively, with a nationwide average growth of 5.94%. Specifically, super-large cities and super cities experienced relatively large average increases in green total factor productivity, followed by large cities, while small- and medium-sized cities showed relatively smaller average increases. This suggests a positive correlation between the improvement of green total factor productivity and city size. In other words, the larger the city size, the higher the growth in green total factor productivity, directly linked to the scale effect, industrial agglomeration effect, and economic agglomeration effect of the city [32]. During the Twelfth Five-Year Plan period, China was at a critical juncture of accelerating the transformation of its economic development mode. This involved further optimizing the demand structure, industrial structure, and the ratio of factor inputs while significantly enhancing the quality and efficiency of economic growth. Large cities, benefiting from strong factor agglomeration, high technological development, and rapid response to the transformation and upgrading of the industrial structure, played a pivotal role in driving high-quality development in the regional economy.
However, the overall level of green economy development in Chinese cities is not high, leaving ample room for improvement. On the one hand, the number of cities with significant progress in green economy development is limited. Among the 21 super-large cities and super cities, only 5, including Beijing, achieved an average green total factor productivity growth rate of more than 10%. Most super cities still maintain an average growth rate of around 5.5% in green total factor productivity. On the other hand, 14 out of the 283 sample cities exhibited a declining trend in average green total factor productivity, negatively impacting the overall development level. This group includes eight small cities like Jiayuguan, one medium-sized city like Shaoguan, and five Type II large cities such as Shantou and Datong. The average decrease in the 14 cities was 0.8%, with Jiayuguan experiencing the largest decrease at 18.4%. As a small city, Jiayuguan has traditionally relied on the ironmaking and metallurgy industry as its main pillar, with outdated production capacity not phased out in a timely manner and inadequate implementation of pollution prevention and control measures. This led to issues such as excessive energy resource consumption and severe environmental pollution. There is an urgent need to adjust the industrial structure and achieve a green development transformation in the ongoing economic transformation from high growth to high quality. Moreover, the green total factor productivity of small cities exhibits significant fluctuations within the sample interval, with the maximum “amplitude” exceeding 0.2. This variability may be attributed to the challenges faced by small cities situated in the transition zone between rural and urban areas. These cities grapple with constraints such as low-factor agglomeration capacity and low-end industrialization, posing greater challenges to the sustainable development of the regional economy.

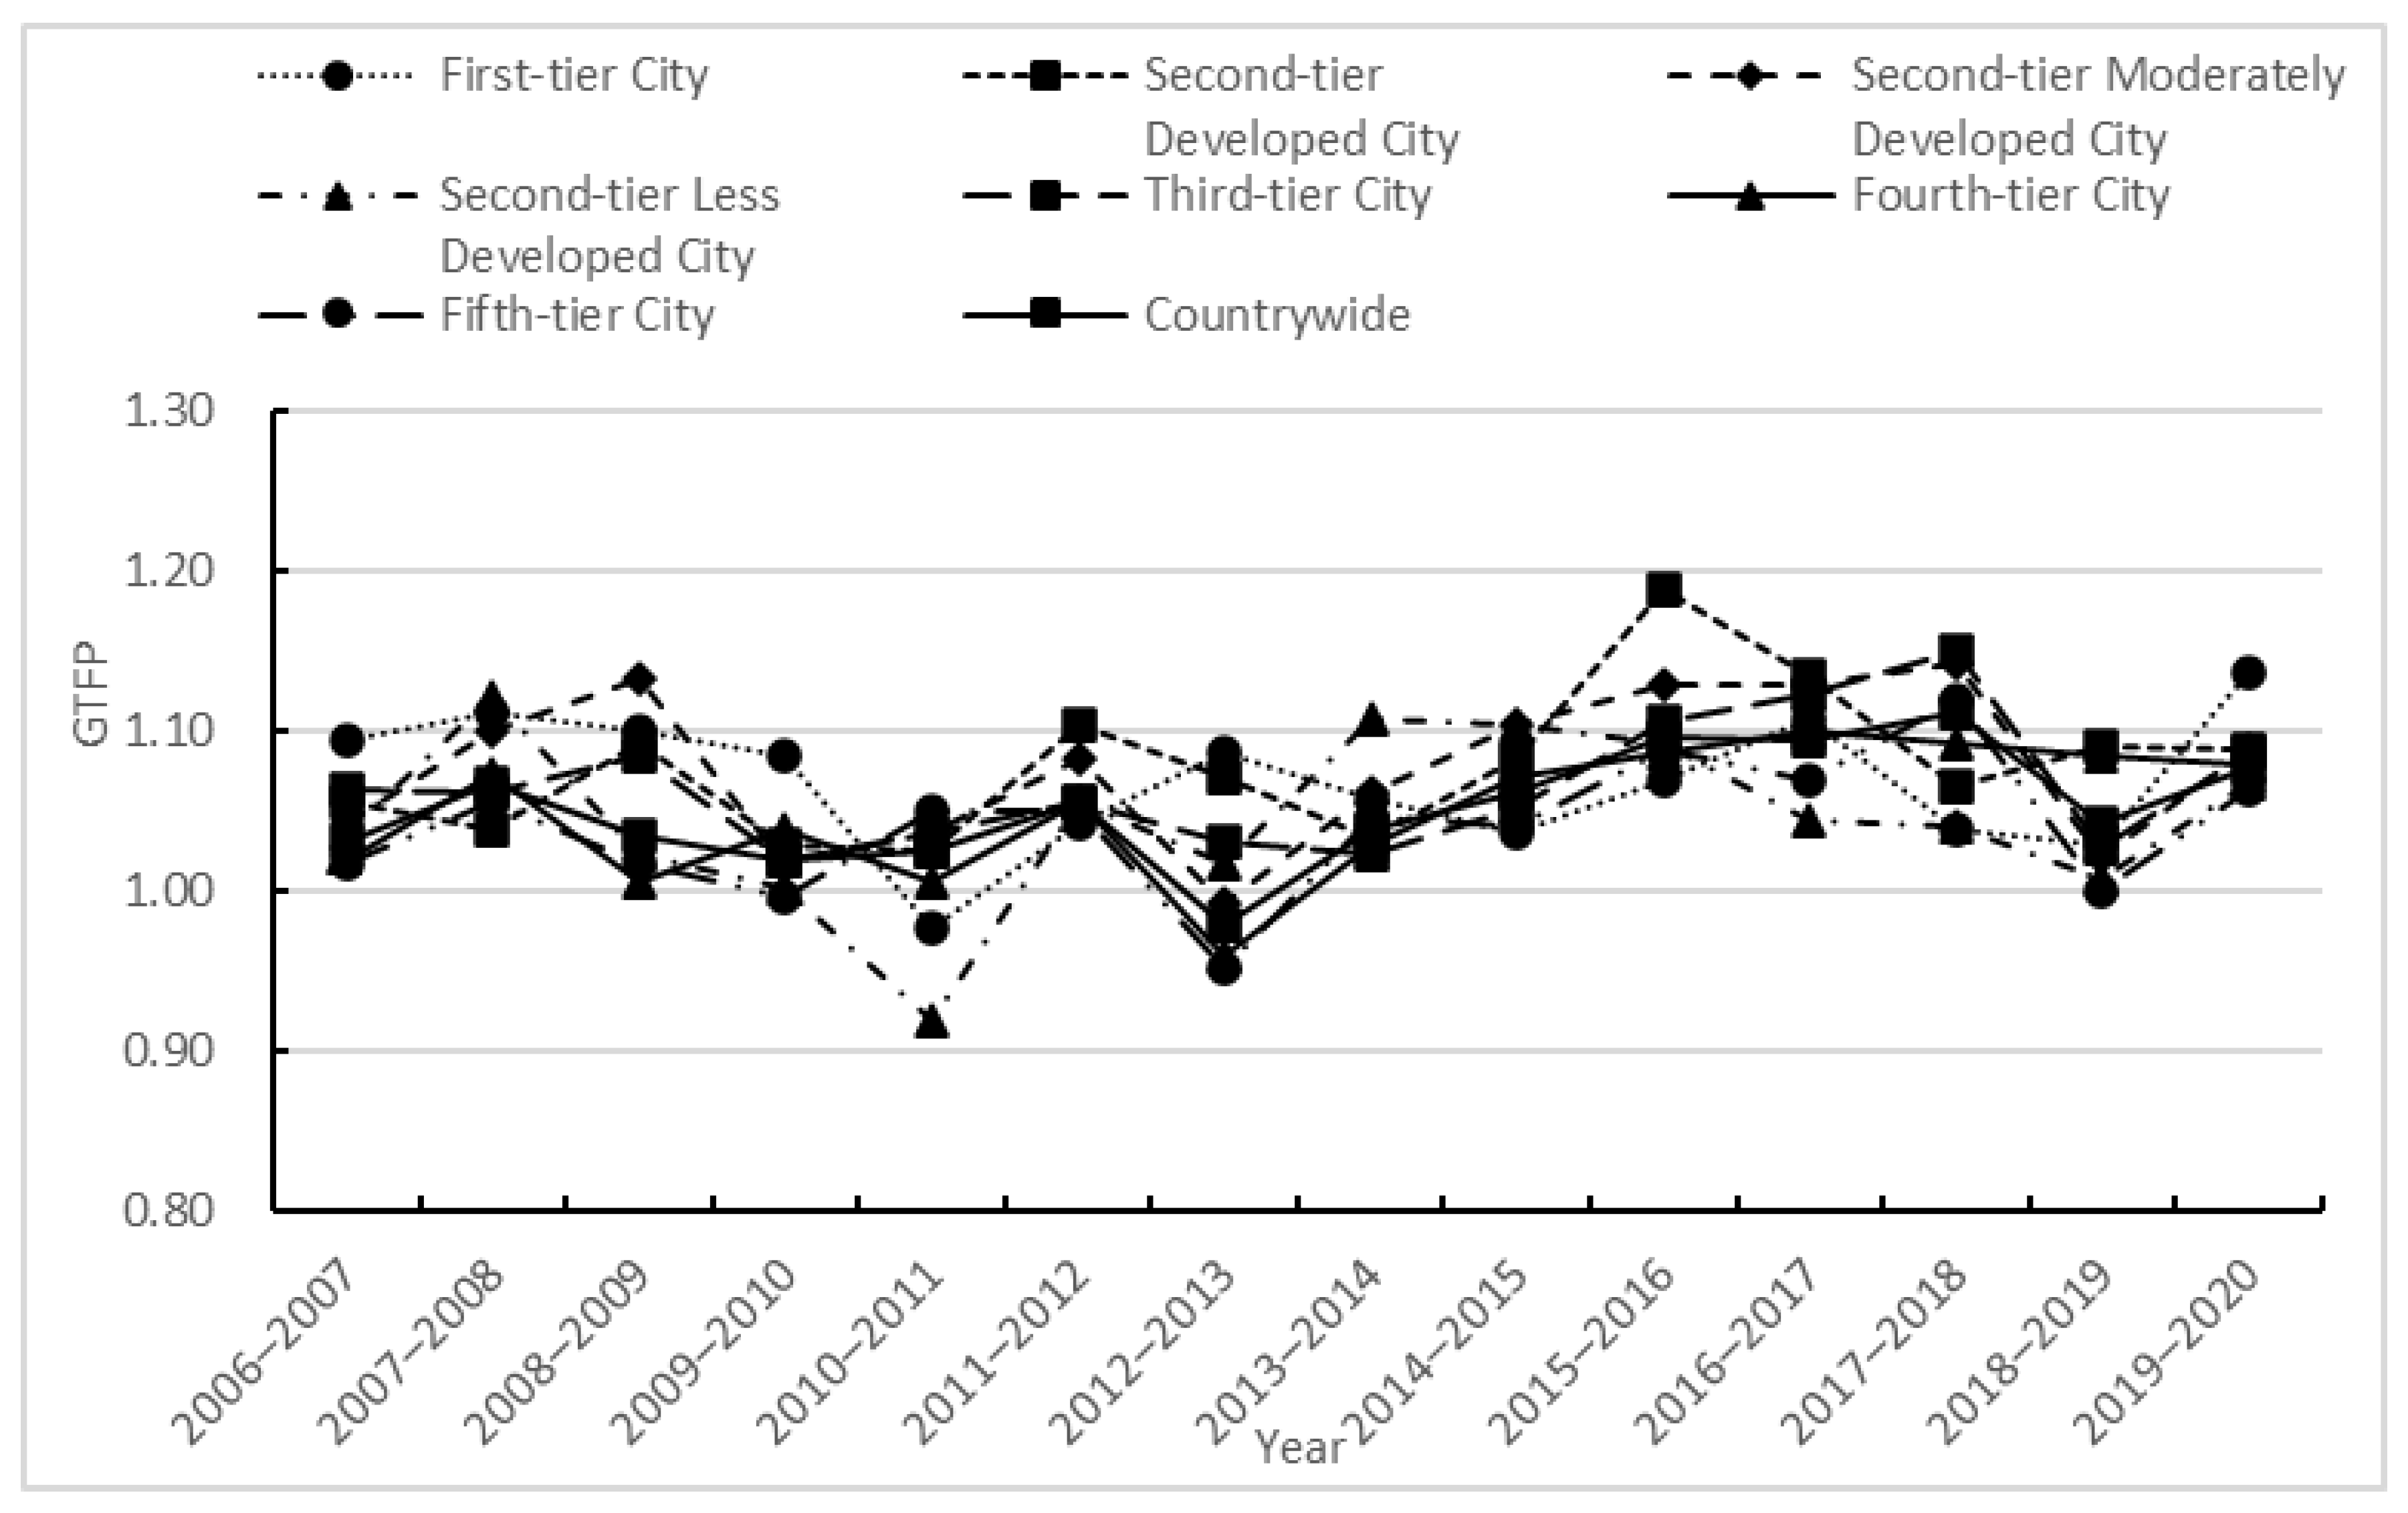
4.4. Analysis of Changes in Urban Class and Green Total Factor Productivity

Referring to the city class classification outlined in the Research Report on Social Mentality in China (2016) released by the Chinese Academy of Social Sciences, the sample cities are classified into seven categories based on their level of economic and social development. These categories include first-tier, second-tier developed, second-tier medium developed, second-tier less developed, third-tier, fourth-tier, and fifth-tier cities. The detailed classification results are presented in Table 4.
Table 4 and Figure 4 reveal that the mean value of green total factor productivity changes in cities of different levels is greater than 1, and the overall trend of fluctuations over time is relatively consistent. The second-tier developed cities exhibit the fastest growth rate, with a rate of 7.77%, while the fifth-tier cities show the slowest growth at a rate of 3.99%. Despite the slower growth, the average green total factor productivity change does not consistently trend upward or downward as the city class decreases. This suggests that the correlation between green total factor productivity change and the economic development of cities across different classes is not clear. Notably, except for first-tier and second-tier developed cities, first-tier cities and second-tier moderately developed cities experience relatively large green total factor productivity growth, at 6.85% and 7.61%, respectively. Between 2006 and 2020, the average value of green total factor productivity changes in first- and second-tier cities was greater than 1, indicating that the driving force for China’s green economic growth primarily originates from these cities. While the average green total factor productivity growth in third-, fourth-, and fifth-tier cities hovers around 5.13%, cities experiencing a decline in green total factor productivity are concentrated mainly in these three tiers. For instance, Jiayuguan witnessed a decline of 18.4%. This underscores the prominent issue of the inadequate and unbalanced development of the green economy in Chinese cities, particularly in third-, fourth-, and fifth-tier cities where the industrial level is predominantly at the “middle and low ends” of the value chain. In these cities, the supply structure is unreasonable, and the contradiction between factor allocation and technological inefficiency becomes increasingly apparent [33]. Consequently, addressing this challenge and steering the economy toward green and high-quality development is an urgent reality.

5. Conclusions and Recommendations

5.1. Conclusions

In this paper, 283 cities in China are selected as samples, and based on the EBM– Window–Malmquist model, the green total factor productivity changes of each city of different types under resource and environmental constraints are measured for the period of 2006–2020, and the research conclusions are as follows: (1) From an overall perspective, the average growth rate of green total factor productivity in Chinese cities was 5.21% in the sample interval. From the perspective of the time trend, the changes in green total factor productivity in China’s four major economic regions were characterized by a decline followed by an increase. That is, the changes in green total factor productivity declined during the period from 2006 to 2013, and the changes in green total factor productivity increased during the period from 2013 to 2020. (2) At the regional level, the average percentage of cities with green total factor productivity changes greater than 1 decreases from the east to the central regions and west and to northeastern regions. (3) In terms of population size, the overall green total factor productivity of all city sizes over time shows a steady upward trend, and the degree of improvement in green total factor productivity is basically positively correlated with city size, i.e., the larger the city size, the higher the growth in green total factor productivity. (4) In terms of the tiers of cities, the average value of the green total factor productivity changes in different tiers of cities is greater than 1, with the fastest growth in the second-tier developed cities and the slowest growth in the fifth-tier cities. The rapid development of first-tier and second-tier cities contributes relatively more to the growth of green total factor productivity; green total factor productivity in third-, fourth- and fifth-tier cities has grown at a relatively slower pace.

5.2. Recommendations

Based on the comprehensive research and analysis conducted, this study asserts that elevating the level of green development in Chinese cities and achieving high-quality economic growth necessitates a strategic focus on top-level design. This involves enhancing the framework of fiscal, taxation, financial, investment, and price policies and standards that specifically endorse green and low-carbon development. Tailored industrial policies, considering diverse resource endowments and environmental capacities across regions and city types, should be devised to foster green and low-carbon industries with competitive advantages. At the regional level, the eastern region should leverage its green development advantages by fostering innovation in green and low-carbon domains. This involves accelerating research and development in advanced energy-saving and carbon-reducing technologies, propagating their adoption, and establishing model cities for green industry development. The central and western regions should elevate environmental standards for industries, embrace advanced technologies, and expedite the transformation and upgrade of traditional industries. This entails optimizing energy production and consumption structures, diversifying from low-end industrial patterns, extending industrial chains, and increasing the contribution of green and low-carbon industries to the overall economy. In the northeastern region, the expeditious industrial transformation of old industrial bases is vital. Achieving the conversion of old and new kinetic energy and innovation-driven growth requires prioritizing the development of the new equipment manufacturing industry; promoting the green upgrading of key sectors like iron and steel, non-ferrous metals, and chemicals; and guiding a portion of the manufacturing industry toward the production and service sector. This approach aims to revitalize old industrial cities. On the urban level, reinforcing the unified planning of urban agglomerations is essential. Accelerating the transformation of super cities and super-large cities involves mitigating the “siphoning effect” observed in large cities. Redirecting resources and elements to small- and medium-sized cities is imperative, necessitating increased investment in the infrastructure of these cities to reduce business transaction costs. Furthermore, the allocation of quality public service resources should be optimized to enhance the attractiveness of small- and medium-sized cities. First- and second-tier cities should persistently pursue green and intelligent development, continuously enhancing industrial quality. In contrast, third-, fourth-, and fifth-tier cities should expedite the shift from low-end industrial chains and high external dependence. Relying on their unique endowments, these cities should develop green-oriented advantageous dominant industries, fostering the creation of environmentally friendly urban environments.
Simultaneously, as the largest developing country, China’s urban development experience serves as a practical benchmark for the green economic transformation of analogous nations. Often, resource-consuming countries, in their pursuit of economic growth, opt for a development-first approach over governance, seeking to position themselves at the forefront of international progress. This inclination can result in significant ecological damage, hindering the promotion of green development. Hence, governments should adeptly coordinate economic ecology and ecological economy development, instigating a revolution in green production and lifestyle. This involves championing green consumption practices and elevating public awareness of ecological environmental protection. Facilitating the realization of ecological product value requires improving mechanisms and fostering the creation of ecological local legislation, technical norms, and standards. This concerted effort establishes a conducive institutional and market environment for the flourishing of the green economy, thereby enhancing the prospects for city-wide green development. A decisive shift from the pursuit of rapid economic growth to a trajectory of high-quality economic development is imperative for the sustained, long-term realization of our economy’s green development.

5.3. Research Limitations and Prospects

This paper undertakes an analysis of the variations in the quality and efficiency of green economy development across diverse city types, offering corresponding countermeasure suggestions based on the measurement of changes in green total factor productivity among the sampled cities. However, due to constraints such as time limitations and data availability, the paper exhibits certain limitations that could be addressed in future studies. Firstly, the absence of research data for the latest year poses a challenge in data acquisition, restricting the sample data update to 2020. Future research endeavors should aim to systematically and comprehensively analyze green total factor productivity changes by incorporating data from the most recent years. Secondly, the paper does not delve deeper into the analysis of green TFP changes by subcategorizing them into alterations in technical efficiency and technological progress. This limitation suggests an avenue for future research to explore the subject with greater depth and nuance. Thirdly, the paper lacks an empirical test on the influencing factors of urban green total factor productivity change. Subsequent research could involve constructing a corresponding causal inference model to precisely examine the impact of each factor on green total factor productivity change. This approach would enable the provision of more targeted countermeasure suggestions for fostering the green development of urban economies.

Author Contributions

L.F.: conceptualization, methodology, data curation, software, funding acquisition, resources, writing—review and editing; S.Z.: conceptualization, formal analysis, investigation, visualization, project administration, validation, writing—original draft preparation; S.G.: conceptualization, resources, investigation, supervision, writing—review and editing. All authors have read and agreed to the published version of the manuscript.

Funding

This research was funded by a grant from the National Social Science Foundation of China (No. 22BKS155) and the Research Center for Circular Economy of Sichuan Province, China (No. XHJJ-2010).

Institutional Review Board Statement

Not applicable.

Informed Consent Statement

Not applicable.

Data Availability Statement

Data from China Statistical Yearbook, China Urban Statistical Yearbook, and regional data released by the National Bureau of Statistics of China.

Conflicts of Interest

The authors declare no conflicts of interest.

References

  1. Chen, C.; Lan, Q.; Gao, M.; Sun, Y. Green total factor productivity growth and its determinants in China’s industrial economy. Sustainability 2018, 10, 1052. [Google Scholar] [CrossRef]
  2. Beugelsdijk, S.; Klasing, M.J.; Milionis, P. Regional economic development in Europe: The role of total factor productivity. Reg. Stud. 2018, 52, 461–476. [Google Scholar] [CrossRef]
  3. Chen, S.; Golley, J. ‘Green’ productivity growth in China’s industrial economy. Energy Econ. 2014, 44, 89–98. [Google Scholar] [CrossRef]
  4. Sueyoshi, T.; Yuan, Y.; Goto, M. A Literature Study for DEA Applied to Energy and Environment. Energy Econ. 2016, 62, 104–124. [Google Scholar] [CrossRef]
  5. Tseng, M.L.; Chiu, A.S.F.; Liang, D. Sustainable consumption and production in business decision-making models. Resour. Conserv. Recycl. 2017, 128, 118–121. [Google Scholar] [CrossRef]
  6. Chung, Y.H.; Färe, R.; Grosskopf, S. Productivity and undesirable outputs: A directional distance function approach. Environ. Manag. 1997, 51, 229–240. [Google Scholar] [CrossRef]
  7. Wu, H.; Lv, K.; Liang, L.; Hu, H. Measuring performance of sustainable manufacturing with recyclable wastes: A case from China’s iron and steel industry. Omega 2017, 66, 38–47. [Google Scholar] [CrossRef]
  8. Wang, X.; Sun, C.; Wang, S.; Zhang, Z.; Zou, W. Going green or going away? A spatial empirical examination of the relationship between environmental regulations, biased technological progress, and green total factor productivity. Int. J. Environ. Res. Public Health 2018, 15, 1917. [Google Scholar] [CrossRef]
  9. Ma, L.; Long, H.; Chen, K.; Tu, S.; Zhang, Y.; Liao, L. Green growth efficiency of Chinese cities and its spatio-temporal pattern. Resour. Conserv. Recycl. 2019, 146, 441–451. [Google Scholar] [CrossRef]
  10. Naughton, H.T. To shut down or to shift: Multinationals and environmental regulation. Ecol. Econ. 2014, 102, 113–117. [Google Scholar] [CrossRef]
  11. Adam, A.; Delis, M.D.; Kammas, P. Fiscal decentralization and public sector efficiency: Evidence from OECD countries. Econ. Gov. 2014, 15, 17–49. [Google Scholar] [CrossRef]
  12. Shen, Z.; Boussemart, J.P.; Leleu, H. Aggregate green productivity growth in OECD’s countries. Int. J. Prod. Econ. 2017, 189, 30–39. [Google Scholar] [CrossRef]
  13. Huang, X.L.; Han, X.F.; Ge, P.F. Spatial and Temporal Evolution of Green Factors and Impact Mechanisms in Belt and Road Countries. Econ. Manag. 2017, 39, 6–19. [Google Scholar]
  14. Guo, L.L.; Qu, Y.; Tseng, M.L. The interaction effects of environmental regulation and technological innovation on regional green growth performance. J. Clean. Prod. 2017, 162, 894–902. [Google Scholar] [CrossRef]
  15. Luo, L.Q.; Xie, H.Y. Study on the Growth Mechanism of Green Total Factor Productivity in China’s Provincial Areas and Its Spatio-Temporal Non-stationarity. J. Appl. Stat. Manag. 2023, 1–16. [Google Scholar] [CrossRef]
  16. Peng, Q.N.; Wang, C.; Tang, W.J. Study on the Impact of Carbon Emission Reduction on Green Total Factor Productivity between Provinces. Sci. Decis. Mak. 2022, 4, 94–113. [Google Scholar]
  17. Söderholm, K.; Söderholm, P.; Helenius, H.; Pettersson, M.; Viklund, R.; Masloboev, V.; Mingaleva, T.; Petrov, V. Environmental regulation and competitiveness in the mining industry: Permitting processes with special focus on Finland, Sweden and Russia. Resour. Policy 2015, 43, 130–142. [Google Scholar] [CrossRef]
  18. Cui, H.R.; Wang, H.R.; Zhao, Q.Z. Study on the Dynamic Evolution Characteristics and Driving Factors of Green Total Factor Productivity in Chinese Industry. Stat. Decis. 2021, 37, 117–120. [Google Scholar]
  19. Liu, T.; Li, J.X. Spatial and Temporal Variability of Green Total Factor Productivity in China’s Forestry Industry and Its Influencing Factors. World For. Res. 2020, 33, 56–61. [Google Scholar]
  20. Xin, B.; Qu, Y. Effects of Smart City Policies on Green Total Factor Productivity: Evidence from a Quasi-Natural Experiment in China. Int. J. Environ. Res. Public Health 2019, 16, 2396. [Google Scholar] [CrossRef]
  21. Yu, H.; Zhao, J. The Impact of Environmental Conditions on Urban Eco-Sustainable Total Factor Productivity: A Case Study of 21 Cities in Guangdong Province, China. Int. J. Environ. Res. Public Health. 2020, 17, 1329. [Google Scholar] [CrossRef]
  22. Tone, K.; Tsutsui, M. An epsilon-based measure of efficiency in DEA: A third pole of technical efficiency. Eur. J. Oper. Res. 2010, 207, 1554–1563. [Google Scholar] [CrossRef]
  23. Yue, P. Data Envelopment Analysis and Commercial Bank Performance: A Primer with Applications to Missouri Banks. Fed. Reserve Bank St. Louis Rev. 1992, 74, 1–35. [Google Scholar] [CrossRef]
  24. Estache, A.; de la Fé, B.T.; Trujillo, L. Sources of efficiency gains in port reform: A DEA decomposition of a Malmquist TFP index for Mexico. Util. Policy 2004, 12, 221–230. [Google Scholar] [CrossRef]
  25. Yang, H.; Pollitt, M. Incorporating undesirable outputs into Malmquist TFP indices with an unbalanced data panel of Chinese power plants. Appl. Econ. Lett. 2012, 19, 277–283. [Google Scholar] [CrossRef]
  26. Asmild, M.; Paradi, J.C.; Aggarwall, V.; Schaffnit, C. Combining DEA window analysis with the Malmquist index approach in a study of the Canadian banking industry. J. Product. Anal. 2004, 21, 67–89. [Google Scholar] [CrossRef]
  27. National Bureau of Statistics of China. China Statistical Yearbook [EB/OL]. Available online: https://www.stats.gov.cn/sj/ndsj/2023/indexch.htm (accessed on 27 April 2023).
  28. Wang, J.X. Research Report on China’s Social Mentality; Beijing, Social Science Literature Press: Beijing, China, 2016; pp. 69–82. [Google Scholar]
  29. Yang, X.M.; Zhang, L.Y.; Li, X.D. A comparative study of green total factor productivity between China and the United States, Japan and Germany. Ecol. Econ. 2022, 38, 50–59. [Google Scholar]
  30. Xu, Y.H.; Deng, H.T. Re-measurement and economic explanation of urban green total factor productivity--Based on the perspectives of scale effect and industry selection. China Circ. Econ. 2022, 36, 27–43. [Google Scholar]
  31. Wang, K.F.; Wu, C.L. The spatio-temporal evolution pattern of green total factor productivity in Chinese cities—Based on Global Malmquist-Luenberger index and ESDA method. Manag. Mod. 2017, 37, 33–36. [Google Scholar]
  32. Hao, A.M.; Tan, J.Y.; Ren, Z. A study on the impact of economic agglomeration on green total factor productivity in China--Based on the perspective of spatial spillovers. China Econ. Issues 2023, 5, 181–196. [Google Scholar]
  33. Zhao, N.; Li, X.J.; Li, G.Q. Fiscal Vertical Imbalance, Factor Price Distortion and Green Total Factor Productivity-Evidence from 266 Prefecture-Level Cities. Financ. Theory Pract. 2021, 42, 91–100. [Google Scholar]
Figure 1. Urban green total factor productivity changes from 2006 to 2020. Note: The total factor productivity change in green in the figure is derived from the authors’ previous calculations.
Sustainability 16 01658 g001
Figure 2. Evolution of the spatial pattern of green total factor productivity change in Chinese cities from 2006 to 2020. Note: The total factor productivity change in green in the figure is derived from the authors’ previous calculations.
Sustainability 16 01658 g002
Figure 3. Geen total factor productivity changes in cities of different sizes from 2006 to 2020. Note: The green total factor productivity change data in the figure are from the authors’ previous calculations.
Sustainability 16 01658 g003
Figure 4. Green total factor productivity changes in different city classes from 2006 to 2020. Note: The green total factor productivity change data in the figure are from the authors’ previous calculations.
Sustainability 16 01658 g004
Table 1. Percentage of cities with green total factor productivity change greater than 1 in four major economic regions from 2006 to 2020 (%).
YearNorth–EastEastCentralWestCountrywide
2006–200773.53%63.95%53.75%63.86%62.19%
2007–200888.24%77.91%70.00%67.47%73.85%
2008–200944.12%58.14%61.25%60.24%57.95%
2009–201070.59%55.81%38.75%40.96%48.41%
2010–201129.41%54.65%53.75%66.27%54.77%
2011–201252.94%67.44%66.25%74.70%67.49%
2012–201358.82%52.33%46.25%31.33%45.23%
2013–201429.41%73.26%68.75%67.47%65.02%
2014–201576.47%81.40%77.50%73.49%77.39%
2015–201679.41%84.88%82.50%78.31%81.63%
2016–201776.47%90.70%82.50%73.49%81.63%
2017–201897.06%75.58%65.00%72.29%74.20%
2018–201941.18%61.63%73.75%56.63%61.13%
2019–202097.06%95.35%92.50%80.72%90.46%
Average Percentage60.97%69.68%64.93%63.01%65.98%
Average number of GTFP > 1 cities21 60 52 52 187
Number of Sample
cities
34 86 80 83 283
Note: The green total factor productivity change data in the table are derived from the authors’ previous calculations.
Table 2. Ranking of the magnitude of change in green total factor productivity of typical cities in each region from 2006 to 2020.
RegionCity Name2006–
2007
2009–
2010
2012–
2013
2015–
2016
2017–
2018
2019–
2020
Geometric
Mean
Standard
Deviation
MinimumMaximum
North–EastHuludao1.13971.15940.93181.23752.55721.04401.03950.45690.53402.5572
Suihua0.93421.22991.02231.40411.43181.04511.18340.45230.73842.6280
Siping0.99800.99421.03740.92532.05361.11701.02490.32070.73202.0536
Songyuan0.93251.80051.21691.19561.58301.08031.04680.32140.61281.8005
Heihe1.13971.01331.22241.60911.37721.08871.01890.29840.59711.6091
Shaungyashan1.05651.16760.90561.12121.74411.05511.06250.23910.77261.7441
Jiamusi1.13371.06400.95351.25621.46391.10501.01170.24890.33451.4639
Dalian1.14041.01621.06491.57231.15401.09781.08300.24010.72021.6207
Tieling1.01240.95091.19141.11931.64810.87771.04470.22970.60151.6481
Panjin0.93411.11291.02781.03580.86731.05171.01530.14020.83061.3669
Geometric Mean1.03851.13201.05171.23021.52731.05411.05200.27960.62981.8078
EastYunfu0.99471.10750.76941.37481.31051.38811.05470.98520.23114.5365
Zhaoqing0.91431.22660.78190.88290.95641.22761.05150.64410.51553.2915
Chaozhou0.76750.91902.98830.97251.06361.22811.10030.53860.76752.9883
Shaoxing0.96331.01482.69471.02241.05671.19651.12060.44340.96332.6947
Langfang1.10520.98901.08631.14822.43461.13001.10370.40370.72102.4346
Xingtai1.06530.94331.03961.06981.11001.03691.03770.13090.84601.3963
Hengshui0.96421.35981.08071.31981.07571.16451.11710.34070.81512.1963
Weihai0.89570.78361.48841.03881.34791.13051.11960.29550.78361.9615
Liaocheng 1.09251.45811.67270.98581.20621.15771.10000.27560.55531.6727
Jining1.02071.02851.37531.01701.25301.12091.08170.24390.72831.7764
Geometric Mean0.97321.06561.35091.07381.23631.17491.08830.37450.65202.3543
WestWeinan1.36200.69180.84971.00341.14481.10351.05170.19980.69181.4685
Baise0.95540.90760.82801.07051.01450.86641.03890.71490.38533.5121
Ordos1.32300.83431.07671.35541.19271.09301.14540.50640.74282.8052
Jinchang1.71520.94470.88910.95071.22300.99780.99430.27720.61271.7152
Neijiang1.34211.37650.70520.96740.86421.09051.02470.18450.70521.3765
Longnan0.94941.10130.75431.10932.18100.91531.05070.34340.74432.1810
Shangluo0.73970.92630.86921.01971.10381.11261.04140.15630.73971.3217
Lijiang0.89581.37240.99091.03450.91481.15791.06730.23490.52811.4026
Guangan0.90800.98920.93621.03651.04141.02610.98140.15640.55291.2139
Guyuan1.30320.96391.19161.10921.29360.83171.06610.16030.83171.3032
Geometric Mean1.11430.99050.89881.06061.15821.01361.04530.25520.63951.7137
CentralShangrao0.91420.89240.26021.14111.07470.89171.08850.97150.26024.4204
Huanggang0.85411.12271.02791.02991.04711.04781.01070.10240.85411.2192
Datong0.93641.97040.93840.92110.73771.11100.98770.36980.42061.9704
Xuchang0.98670.90611.03082.24511.21051.11221.11550.33740.85692.2451
Luan1.12321.05061.31851.61000.31800.91611.03170.31080.31801.6100
Shuozhou1.01730.90990.79010.99011.31941.14861.04930.29560.72921.9367
Pingxiang0.87890.64340.81591.11200.99001.03271.03790.29150.64341.9211
Luohe1.03440.98820.97491.11841.00781.20491.06810.21900.95731.8097
Yichang1.37350.74060.98651.08180.96771.04571.05380.24940.73941.7115
Xuancheng0.70390.85311.08791.19420.99870.85750.96400.24760.57981.5616
Geometric Mean0.96830.96320.86341.20060.91391.03091.03980.29190.58761.9228
Note: The green total factor productivity change data in the table are derived from the authors’ previous calculations.
Table 3. Changes in urban size and green total factor productivity from 2006 to 2020.
City
Scale
Criteria for
Classification
Number of Cities2006–20072008–20092010–20112012–20132014–20152015–20162016–20172017–20282018–20192019–2020Geometric Mean
Small City<500 k730.9980 1.0659 1.0245 0.9369 1.0416 1.0934 1.0522 1.1376 1.0288 1.0600 1.0420
Medium-sized City500–1000 k1091.0385 1.0094 1.0317 0.9857 1.0595 1.0964 1.1057 1.0922 1.0413 1.0872 1.0516
Type II Large City1000–3000 k661.0494 1.0062 1.0219 0.9948 1.0696 1.0891 1.1234 1.1389 1.0519 1.0788 1.0558
Type I Large City3000–5000 k141.0421 1.1315 1.0142 1.0099 1.0871 1.0816 1.1050 1.0517 1.0445 1.0597 1.0533
Super-large City5000–10,000 k141.0534 1.1067 1.0120 1.0456 1.0980 1.1605 1.1404 1.1107 1.0488 1.0918 1.0796
Super City>10,000 k71.0615 1.1169 0.9984 1.0264 1.0693 1.0906 1.0798 1.0169 1.0410 1.1184 1.0745
Countrywide 2831.0403 1.0716 1.0171 0.9993 1.0707 1.1016 1.1007 1.0904 1.0427 1.0824 1.0594
Note: The green total factor productivity change data in the table are derived from the authors’ previous calculations.
Table 4. Green total factor productivity changes based on national urban classification from 2006 to 2020.
City
Classification
Number of Cities2006–
2007
2008–
2009
2010–
2011
2012–
2013
2014–
2015
2015–
2016
2016–
2017
2017–
2018
2018–
2019
2019–
2020
Geometric
Mean
First-tier City51.0938 1.0997 0.9777 1.0868 1.0365 1.0692 1.1077 1.0385 1.0287 1.1361 1.0685
Second-tier
Developed City
81.0554 1.0929 1.0252 1.0712 1.0821 1.1894 1.1351 1.0659 1.0896 1.0888 1.0777
Second-tier Moderately
Developed City
161.0420 1.1320 1.0369 0.9931 1.1046 1.1288 1.1287 1.1426 1.0211 1.0878 1.0761
Second-tier Less
Developed City
71.0374 1.0225 0.9187 1.0172 1.1048 1.0928 1.0445 1.0400 1.0075 1.0670 1.0445
Third-tier City571.0639 1.0842 1.0376 1.0304 1.0520 1.1052 1.1232 1.1510 1.0277 1.0858 1.0650
Fourth-tier City1051.0199 1.0053 1.0061 0.9599 1.0718 1.0867 1.0999 1.0921 1.0850 1.0799 1.0492
Fifth-tier City851.0176 1.0181 1.0499 0.9528 1.0406 1.0891 1.0697 1.1185 1.0006 1.0644 1.0399
Countrywide2831.0306 1.0351 1.0257 0.9784 1.0615 1.0956 1.0950 1.1124 1.0416 1.0767 1.0518
Note: The green total factor productivity change data in the table are derived from the authors’ previous calculations.
Disclaimer/Publisher’s Note: The statements, opinions and data contained in all publications are solely those of the individual author(s) and contributor(s) and not of MDPI and/or the editor(s). MDPI and/or the editor(s) disclaim responsibility for any injury to people or property resulting from any ideas, methods, instructions or products referred to in the content.

