Article

Evolution and Optimization of an Ecological Network in an Arid Region Based on MSPA-MCR: A Case Study of the Hexi Corridor

1
College of Geography and Environment Science, Northwest Normal University, Lanzhou 730070, China
2
Key Laboratory of Resource Environment and Sustainable Development of Oasis, Northwest Normal University, Lanzhou 730070, China
*
Author to whom correspondence should be addressed.
Sustainability 2024, 16(4), 1704; https://doi.org/10.3390/su16041704
Submission received: 22 November 2023 / Revised: 11 January 2024 / Accepted: 18 February 2024 / Published: 19 February 2024

Abstract

:
Under the background of climate change, the problems of water resource allocation and desertification in arid areas are becoming increasingly prominent, which seriously threatens the sustainable development of society. Constructing an ecological network is an important measure to improve the ecological environment and maintain ecological service function. This study takes the Hexi Corridor as an example and relies on land use data from 2000 to 2020, and comprehensively applies methods, such as morphological spatial pattern analysis (MSPA), the minimum cumulative resistance model (MCR), and the network evaluation index to construct and optimize the ecological network of the Hexi Corridor. Our results show: (1) the spatial distribution of the landscape elements in the Hexi Corridor was not uniform and that the ecological foundation in the north was poor; (2) the resistance surface was “low in the south and high in the north”, with low-value areas mainly located to the south of Jiuquan City, Zhangye City, and Wuwei City, and the high-value areas were mainly located in the middle and to the north of Jiuquan City and Wuwei City; (3) the ecological source areas, corridors, and nodes showed a fluctuating upward trend, and they were mainly located to the southwest of Zhangye City, Jiuquan City, and Wuwei City; (4) the network closure (α), line point rate (β), and network connectivity (γ) showed a W-shaped change trend; (5) after the ecological network optimization, 22 new ecological source areas, 78 new corridors, and 61 new nodes were added, as a result, the α, β, and γ indices all increased. Our results provide a reference for ecological environment restoration research and serve as a regionally balanced means of sustainably developing the Hexi Corridor.

1. Introduction

The urbanization process in China is undergoing continuous development and diversified human activities coupled with high population density stimulate the spatial expansion of urban land [1], leading to a shortage of resources, such as the ecological environment of habitat fragmentation, which is an increasingly prominent problem, as well as the gradual increase in resource and environmental costs [2]. To adapt to the diverse needs of urbanization and minimize the effect of environmental matters on society and ecology, the development of an ecological network has shown vital natural potential [3]. Ecological networks are comprised of ecological corridors and ecological nodes that connect different types of land, like nature parks and key areas [4]. They can improve the fragmented landscape effects on biodiversity and landscape connectivity and promote species exchange among patches. Therefore, constructing ecological networks from theory to practice is a good method for solving ecological problems and has important ecological significance for improving the ecosystem service level and restoring the function of natural ecosystems [5,6].
In the early 1990s, after Han Boping [7] first published an article on ecological network analysis in China, scholars, based on this work, began to study ecological networks. At present, the model “identification of ecological source area-construction of resistance surface-simulation and optimization of potential corridor” [8] has basically been followed to construct ecological networks. Within its construct, the minimum cumulative resistance model (MCR) can be coupled with many factors, such as terrain and landform [9], and cleverly combined with landscape map theory [10] to construct a resistance surface, and its operability and practicality have been widely applied. However, in previous studies, it was treated, and more objective methods are needed to identify ecological sources [11]. The cost path tool in ArcGIS is also used in the MCR model to find the least-cost path (LCP) between biological source areas. After that, the path that costs the least is picked as the starting point for the ecological corridor. The operation process requires repeated calculations, and there are redundant corridors [12]. Morphological spatial pattern analysis (MSPA) [13,14] can mitigate the subjectivity of comprehensive analysis and subjective judgment methods, relying only on land use data and natural element types as the focus [15]. The rest of the land types are considered as a background resource. After data processing, the focus is split into seven groups: the core area, the bridge area, the edge area, the branch line, and the loop line, island, and perforation. Ecological source areas can be scientifically and objectively identified. Then, the linkage mapper tool can be employed to combine the ecological source area and resistance surface to draw the lowest cost path between the source and extract the ecological corridor easily and quickly through threshold setting and other operations [16]. Based on this, some scholars have used the linkage mapper tool to carry out ecological network research using the MSPA-MCR model [17]. Foreign scholars carried out research in ecologically fragile areas [18], historical and cultural sites [19], or urban roads [20,21]. However, numerous scholars in China have concentrated their research on different areas. For example, some scholars have used the above methods to explore ecological networks in river basins [22,23,24], plateau lakes [25], mountain areas [26], nature reserves [27], and forests [28]. Other scholars have constructed and analyzed the ecological networks of Linze County [29], the Changtan City cluster [30], Harbin City [31], Fuzhou City [32], and other urban areas. To summarize, ecological network research has mainly focused on the spatial aspect of an ecological network, with a noted lack of analysis and research concerning the changes in ecological networks over different periods. Further, the research scope has mainly targeted cities and natural ecosystems in humid areas; hence, research on arid and semi-arid areas is lacking.
The Hexi Corridor is a sand belt in north China and an important part of the Qinghai-Tibet Plateau ecological barrier. It is located deep in the interior of China’s mainland, where there is drought and little rain, and its natural environment has extremely pronounced spatial heterogeneity. The Siberian cold current induces strong wind erosion in spring and winter, threatening the health of the oasis ecosystem. Extreme rainfall events often occur in the Qilian Mountain system located in the southern part of the Hexi Corridor in summer, exacerbating the risk of hydraulic erosion [33]. The change in the natural environment renders the ecological environment of the Hexi Corridor very fragile. Therefore, this paper took the Hexi Corridor in the arid area as the research area. Land use data from five time-based nodes (2000, 2005, 2010, 2015, and 2020) were selected to construct and analyze the spatial and temporal evolution characteristics of the ecological network, and then the ecological network in 2020 was optimized by using methods such as MSPA, the MCR model, the network evaluation index, and other proposed suggestions. The research results are expected to provide a scientific foundation for regional ecological conservation and restoration.

2. Materials and Methods

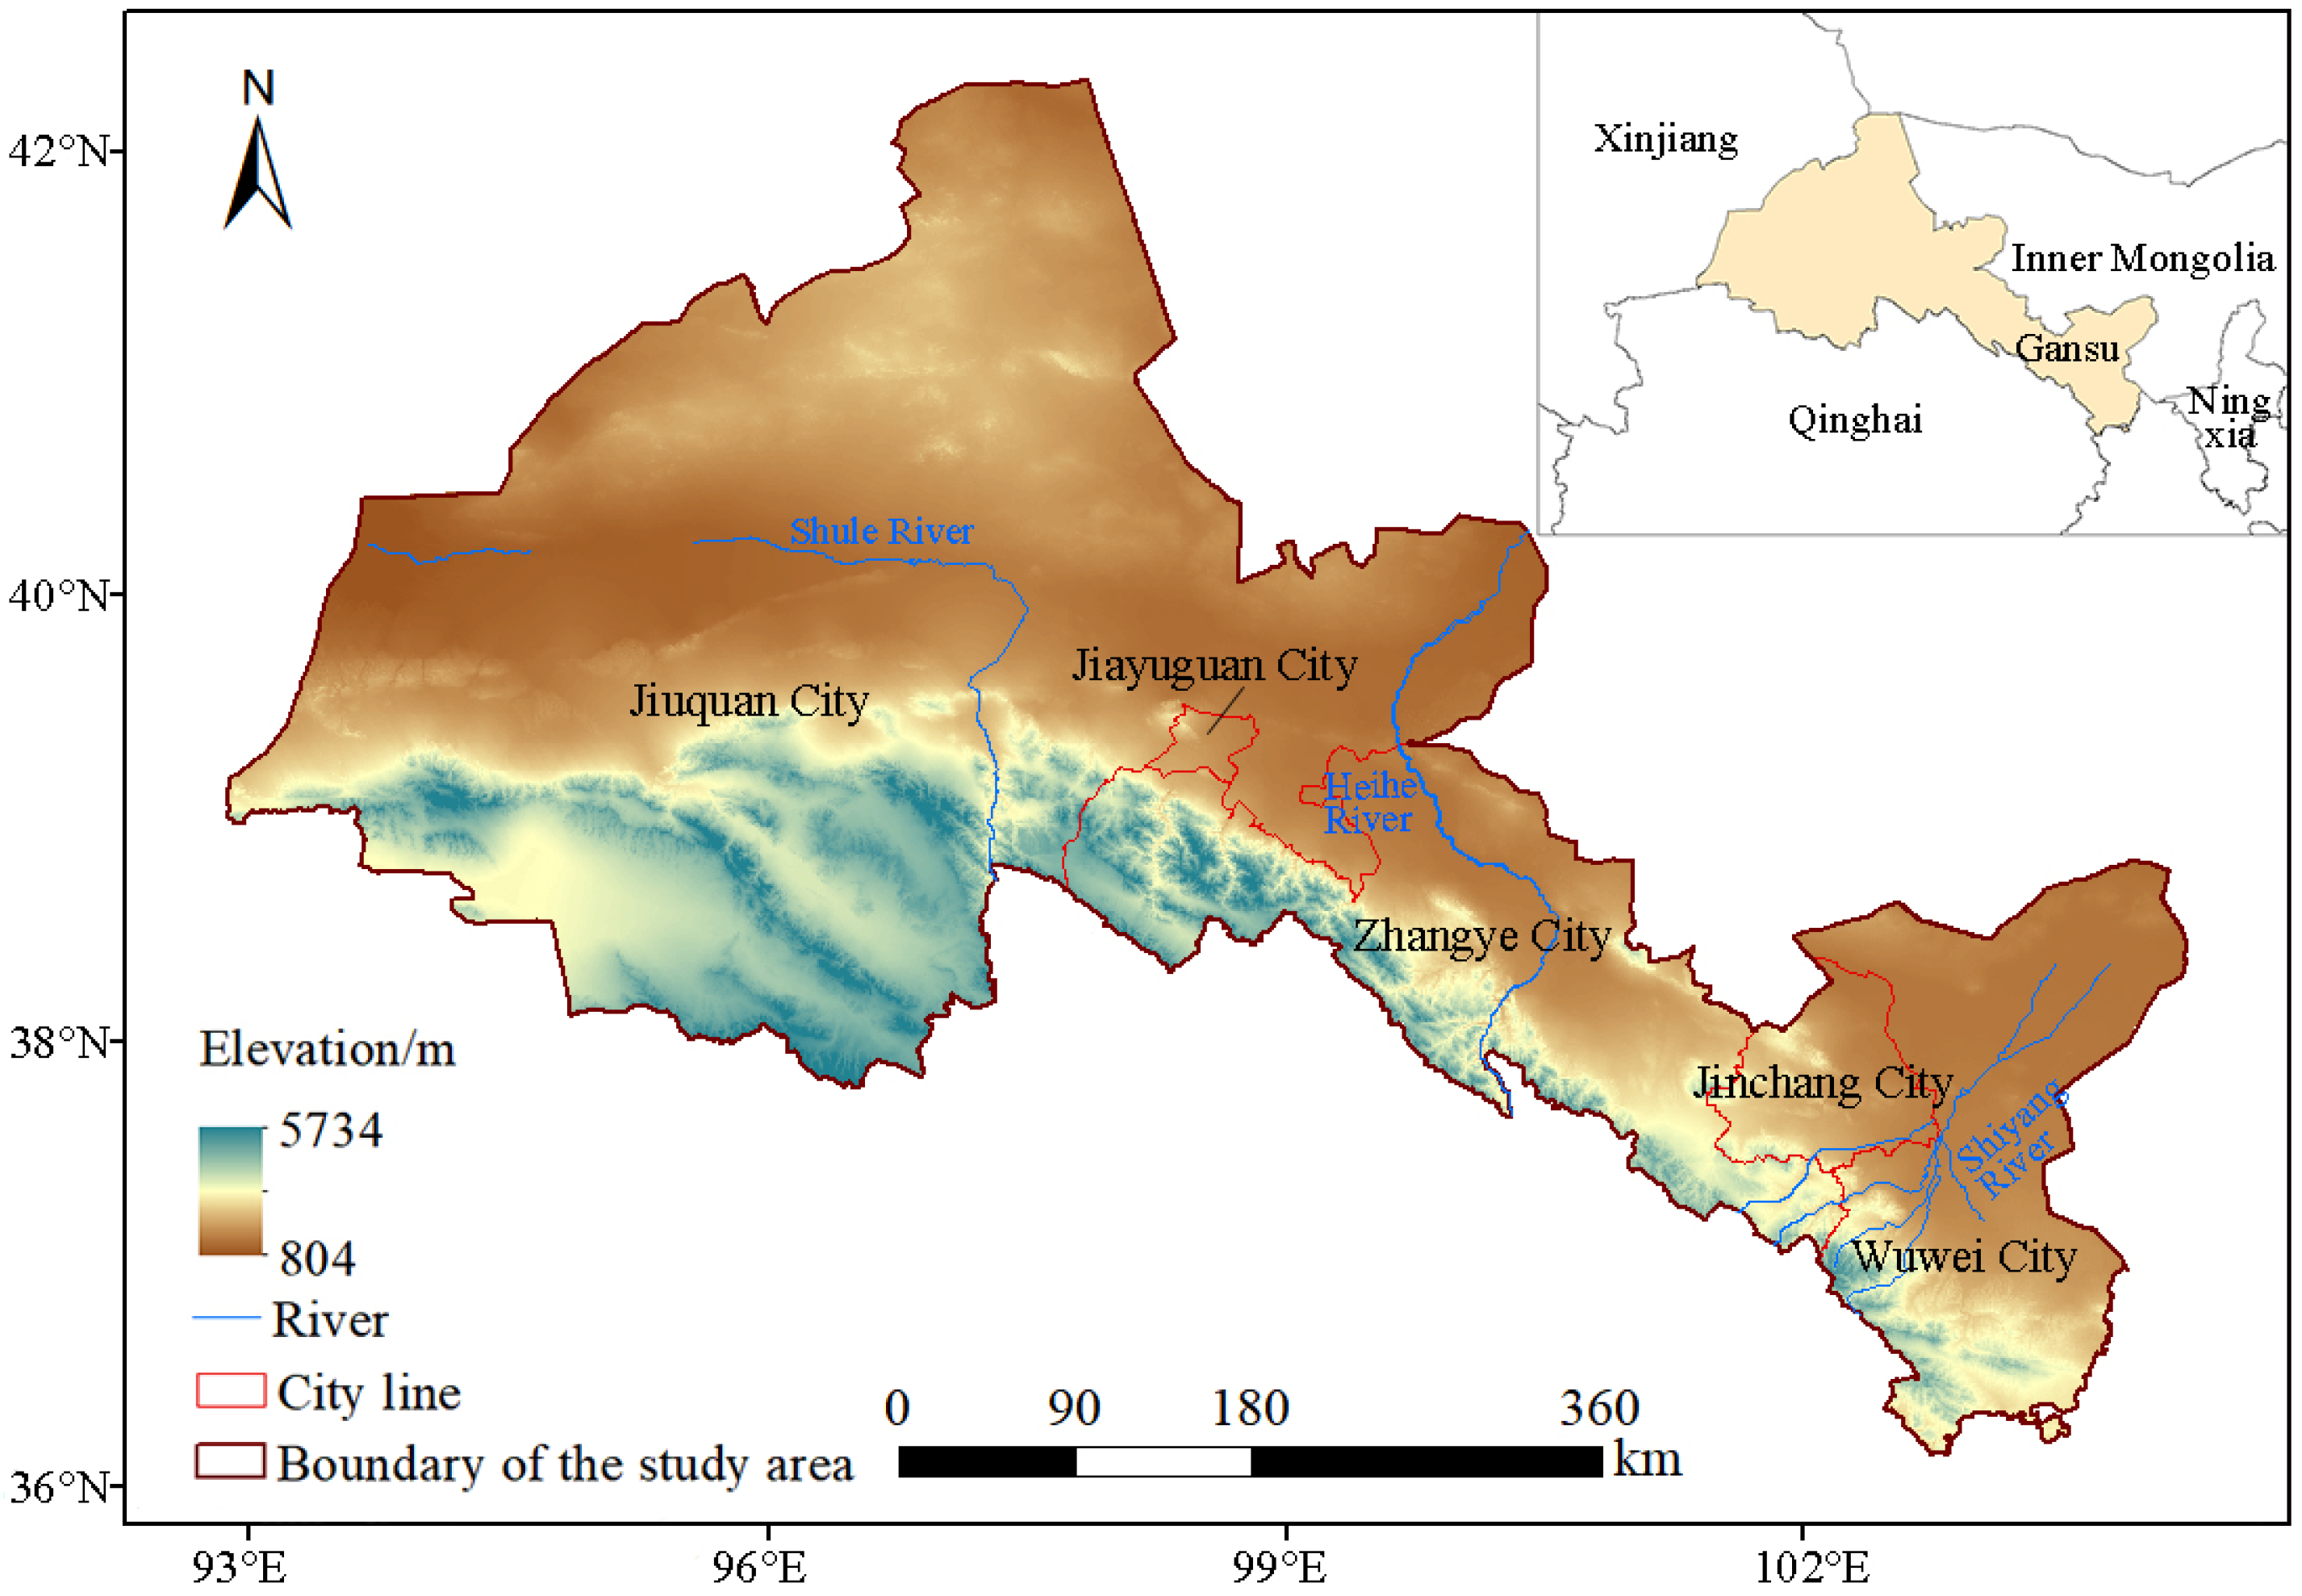
2.1. Overview of the Research Area

In China, the Hexi Corridor is in the northwest of the Gansu Province. It is approximately 1200 km long from east to west and 100 to 200 km wide from north to south. It is comprised of a long, narrow strip of flat land that runs from the northwest to southeast. The southern part has higher elevations than the northern part (Figure 1). It can be split into the southern Qilian Mountains, the middle corridor plain, and the northern Beishan Mountains [34] based on the geological and ecological features. The arid and semi-arid continental monsoon climate describes the area. The average annual temperature is between 5.8 and 9.3 °C, the average annual rainfall is between 15.6 and 527.8 mm, and the average annual potential evapotranspiration is between 2300 and 2600 mm. It becomes hot and windy in the summer and cold and long in the winter [35]. There is also a lot of sand and wind [36]. The Shiyang River, Heihe River, and Shule River all come from the melting glaciers of the Qilian Mountains. They provide a significant amount of water to the Hexi region, and the Shiyang River Basin is a common place where water is scarce [37]. In the middle parts of the Heihe River, farmers use a lot of water downstream, which causes ecological problems like water shortages, droughts, dust storms, and other disasters [38]. The middle and lower parts of the Shule River Basin are flat, and there are both lakes and deserts there. Because of their unique geography and people’s careless actions, the three main river basins are currently experiencing a number of ecological and environmental problems, such as low groundwater levels, desertification, salinization, and the loss of vegetation [39].

2.2. Description of the Data

The datasets used in this study mainly included DEM, land use, NDVI, water network data, and road network data for 2000–2020. The DEM, land use, and NDVI data were sourced from the Institute of Geographic Sciences and Natural Resources Research, with resolutions of 250 m and 1 km, respectively. The data for the water and road networks were obtained from Open Street Map (https://www.openstreetmap.org/ (accessed on 21 November 2023)). More specific information is shown in Table 1.

2.3. Methods

2.3.1. Landscape Element Recognition Based on MSPA

There is a mathematical way to build and work MSPA. Drawing on geometric ideas like erosion, widening, opening, and closing [24,40], it sorts landscapes properly at the pixel level. Three pixels were added to the edges of the trees, field, and water. As background information for the MSPA study, number 1 was assigned to other types of land use. A guide called Guidos Toolbox [41] was used to divide the pixels in the center into seven groups that do not overlap. It has a core area, a bridge area, an edge area, a branch line, a loop line, an island, and perforation [13]. The ecological functions are shown in Table 2. Among them, the habitat patches in the core area are large, and the ecological quality is high, which is a good space for species to inhabit and can be used as an alternative source area.
[Note] forest land: forest land, shrub land, dredge land, and other forest lands; grassland: high-cover grassland, medium-cover grassland, and low-cover grassland; water: canals, lakes, reservoirs, permanent glaciers, snow, beaches, and beaches.

2.3.2. Constructing a Comprehensive Resistance Surface

We can see from the resistance surface that different types of landscapes can have various impacts on living things [42]. According to the environmental conditions of the study area, the six factors of land use, NDVI, elevation, slope, road network density, and water network density were selected as resistance factors in this paper. Referring to previous studies [43,44], land use, NDVI, elevation, and slope were divided into five grades, and the natural breakpoint method [45] was used to divide the density of the road network and water network into five grades (Table 3). In order to eliminate a possible correlation between the factors caused by information redundancy, the weight of each resistance factor was determined using principal component analysis and the calculation is shown in Equation (1):
R i = j = 1 n W j × A i j ,
The grid is represented by i and the resistance factor is shown by j. Ri is the total resistance value of grid i and n is the number of resistance factors. In other words, Wj is the part of j. Aij is the resistance number for j in the i-th grid.

2.3.3. Potential Ecological Corridor Based on the MCR model

Under different resistance conditions, the MCR model can be used to identify species from one ecological source to another ecological source to overcome resistance to the minimum cumulative distance [46]. This has been widely used to simulate potential pathways for species migration [47]. The calculation is shown in Equation (2):
M C R = f m i n j = n i = m D i j × R i ,
MCR is the minimum cumulative resistance value of the source spreading to any point in space; fmin is the positive correlation function between the minimum cumulative resistance of any point in space and the distance of all the other points and the characteristics of the landscape base plane; Dij is the spatial distance of a species from an ecological source j to landscape unit i in the region; Ri is the resistance value of the i-th landscape unit to species movement.
The gravity model is a way to figure out how strong the connections are between ecological source areas [48]. The gravity model was used to remove unnecessary data and select important pathways from them for this study. The method for the calculation is shown in Equation (3):
G i j = L m a x 2 ln S i ln S j L i j 2 P i P j ,
Gij displays the work that natural sources i and j do together. Lmax is the natural path that has the most resistance when all of them are added up. The biological source areas i and j are given by Si and Sj, which are their sizes. Pi and Pj are their resistance rates.

2.3.4. Ecological Network Evaluation Index

Network analysis methods have been widely used to evaluate the connectivity of ecological corridors in the internal structure of ecological networks [49]. Three network structure indices, the network closure (α), line point rate (β), and network connectivity (γ) were used to describe the connectivity of ecological networks [50,51]. The formulas are shown in Equations (4)–(6):
α = L V + 1 2 V 5 ,
β = L V ,
γ = L 3 V 2 ,
V stands for a natural source, and L represents the number of ways to get there.

2.3.5. Optimizing the Ecological Network

Based on the MCR model, the ecological network might not have the right mix of ecological corridors and ecological sources. To add more biological source areas to places that do not have enough of them, we chose patches that were well-connected and the right size. This means that corridors and nodes could be added. The natural network is better because it is more stable and clearer [40]. Our tool of choice was one for finding the PC and dPC of each patch. The formulas are shown in Equations (7) and (8) [52]:
P C = i = 1 n j = 1 n P i j a i a j A L 2 ,
d P C = P C P C r e m o v e P C
PC means the chance that two patches will connect. The number of patches in the scenery is the number n. The best chance that two spots will directly spread a species is Pij. Patch sizes i and j are given by ai and aj. The connectivity probability measure, dPC, is shown in AL2, which shows the whole picture. Maybe the scene will still be linked even after patch i is taken out. The environment in the source area is safer when the dPC number is high.
Using Conefor 2.6 software for the connectivity analysis, based on previous research [53], the connectivity probability parameter for the study area, mainly consisting of grasslands and bare land, was set to a moderate connectivity probability of 0.5, and the critical diffusion distance threshold for the network connectivity was set to 2.5 km [23,25].

3. Results

3.1. Ecological Network Analysis of the Hexi Corridor

3.1.1. Spatial and Temporal Changes in Landscape Element Identification

The spatial distribution of the landscape elements from 2000 to 2020 was uneven, consistent with a distribution trend of “more in the south and less in the north,” with an area of 6.29 × 10⁴–6.34 × 10⁴ km2, which only accounted for approximately 25% of the total area of the study area (Figure 2 and Table 4), indicating that the ecological foundation of the northern part of the study area was poor. From a temporal perspective, the total area of the landscape elements showed a W-shaped decline, with the largest proportion of area in 2000 (25.63%) and the smallest proportion in 2015 (25.41%). Among them, the core area gradually shrunk, with the largest area in 2000 (7.70%) and the smallest area in 2020 (5.14%). The area change trend (a fluctuating upward trend) of the bridging area, loop lines, and islands was similar, with the highest area of all three in 2020 (8.38%, 1.95%, 6.76%). However, the area was the smallest in 2000 (loop line: 1.17%), 2005 (bridge area: 4.12%), and 2010 (island: 5.27%). The trend of changes in the edge area, branch area, and perforation (a fluctuating downward trend) was similar. In 2010, the area of all three areas was the largest (3.62%, 3.26%, and 0.29%), while in 2020, the area was the smallest (1.58%, 1.55%, and 0.14%). In summary, from 2015 to 2020, the area of each landscape element had the largest change in amplitude from 2015 to 2020, in which the core area, edge area, branch area, and perforation became smaller, and the areas of the loop lines, bridge area, and islands became larger. The spatial distribution indicates that there has been minimal change in the landscape elements. The core areas were mainly distributed to the southwest of Zhangye City and Wuwei City, and the bridge areas were mainly distributed in southern Jiuquan City, Zhangye City, and Wuwei City. The edge areas and perforations were mainly distributed around the core areas, and the branch lines, loop lines, and islands were distributed throughout the study area over a wide range.

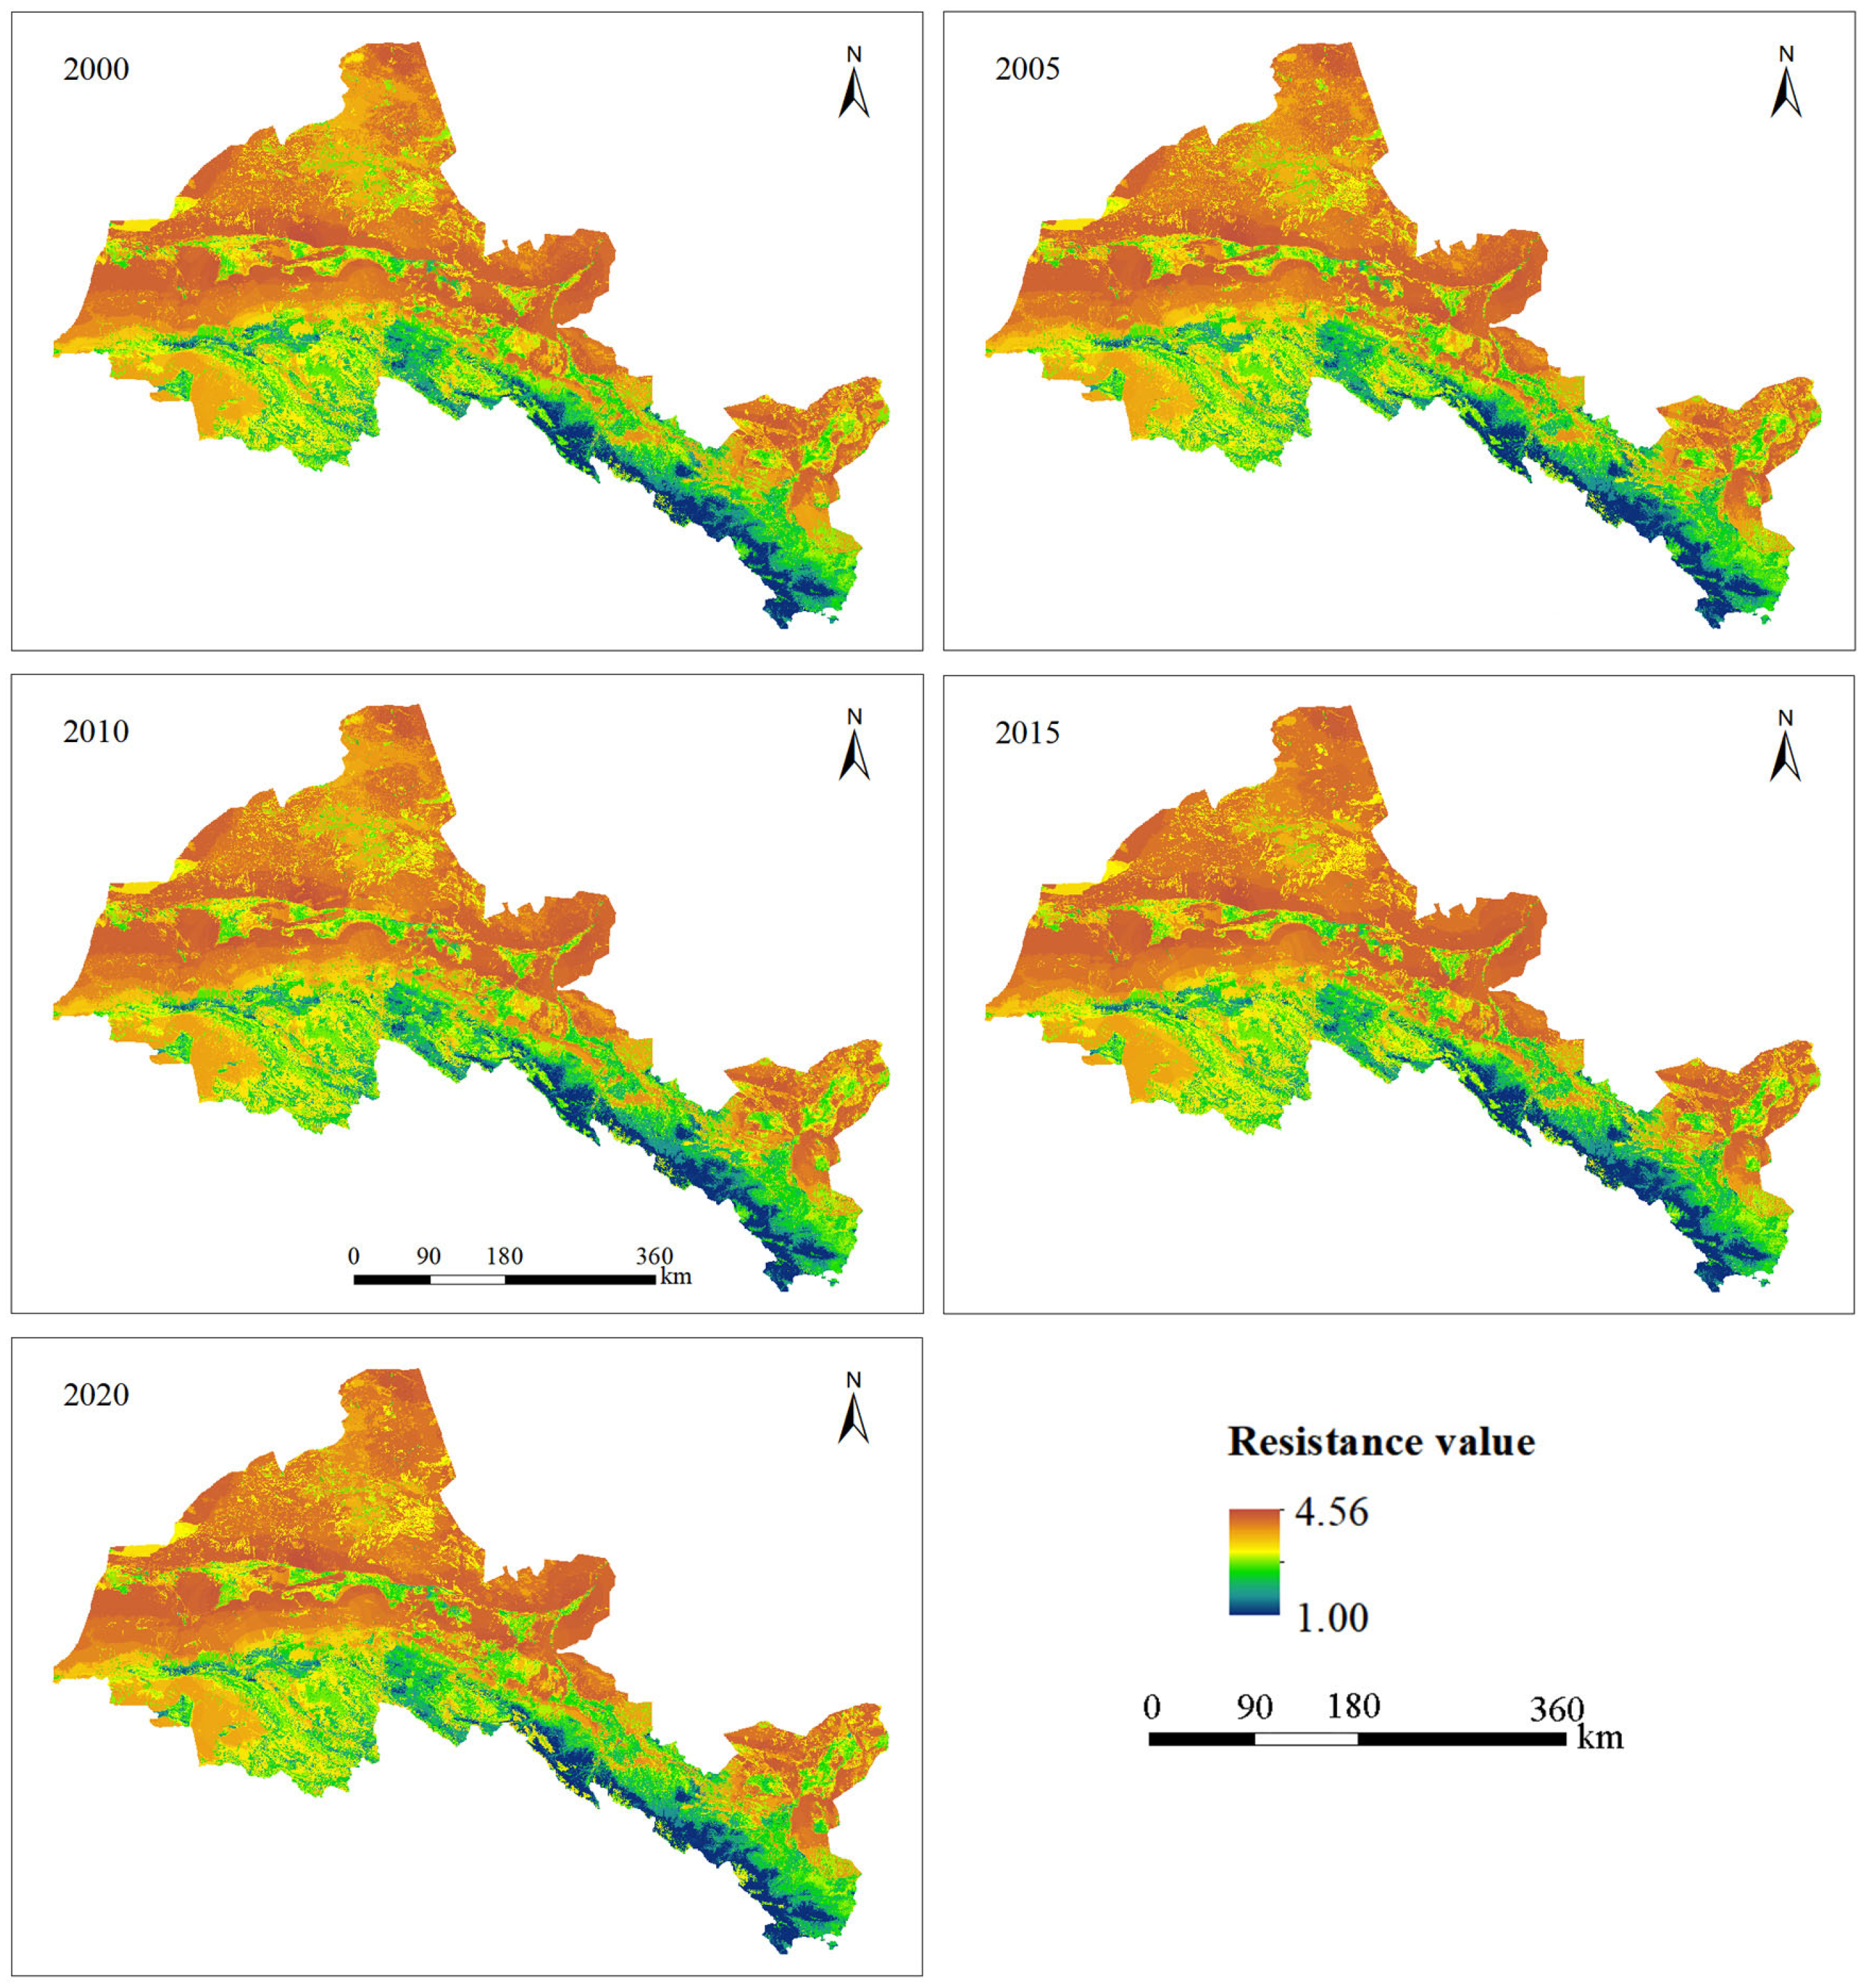
3.1.2. A Shift in the Resistance Surface’s Size and Length of Time

To find the full resistance surface, grade values from the resistance surfaces of each factor were put through a weighted combination analysis (Figure 3). The analysis found that NDVI and land use had slight changes near the Qilian Mountains, Oasis, and Mazongshan, and the changes were all within the classification range of Table 3. The resistance surface had a number between 1.00 and 4.56 from 2000 to 2020. It was “low in the south and high in the north”. Most of the low-value land was in Jiuquan City, Zhangye City, and Wuwei City, which are all in the south and close to the Qilian Mountains. That is, live things that are close to water do not have to deal with a lot of trouble. The most valuable land was in the middle and northern parts of Wuwei City and Jiuquan City, which are close to Mazongshan. It can be seen that unused lands, such as sand and bare rocks, as well as many industrial and mining land for coal mining [54] have high resistance to biological activities.

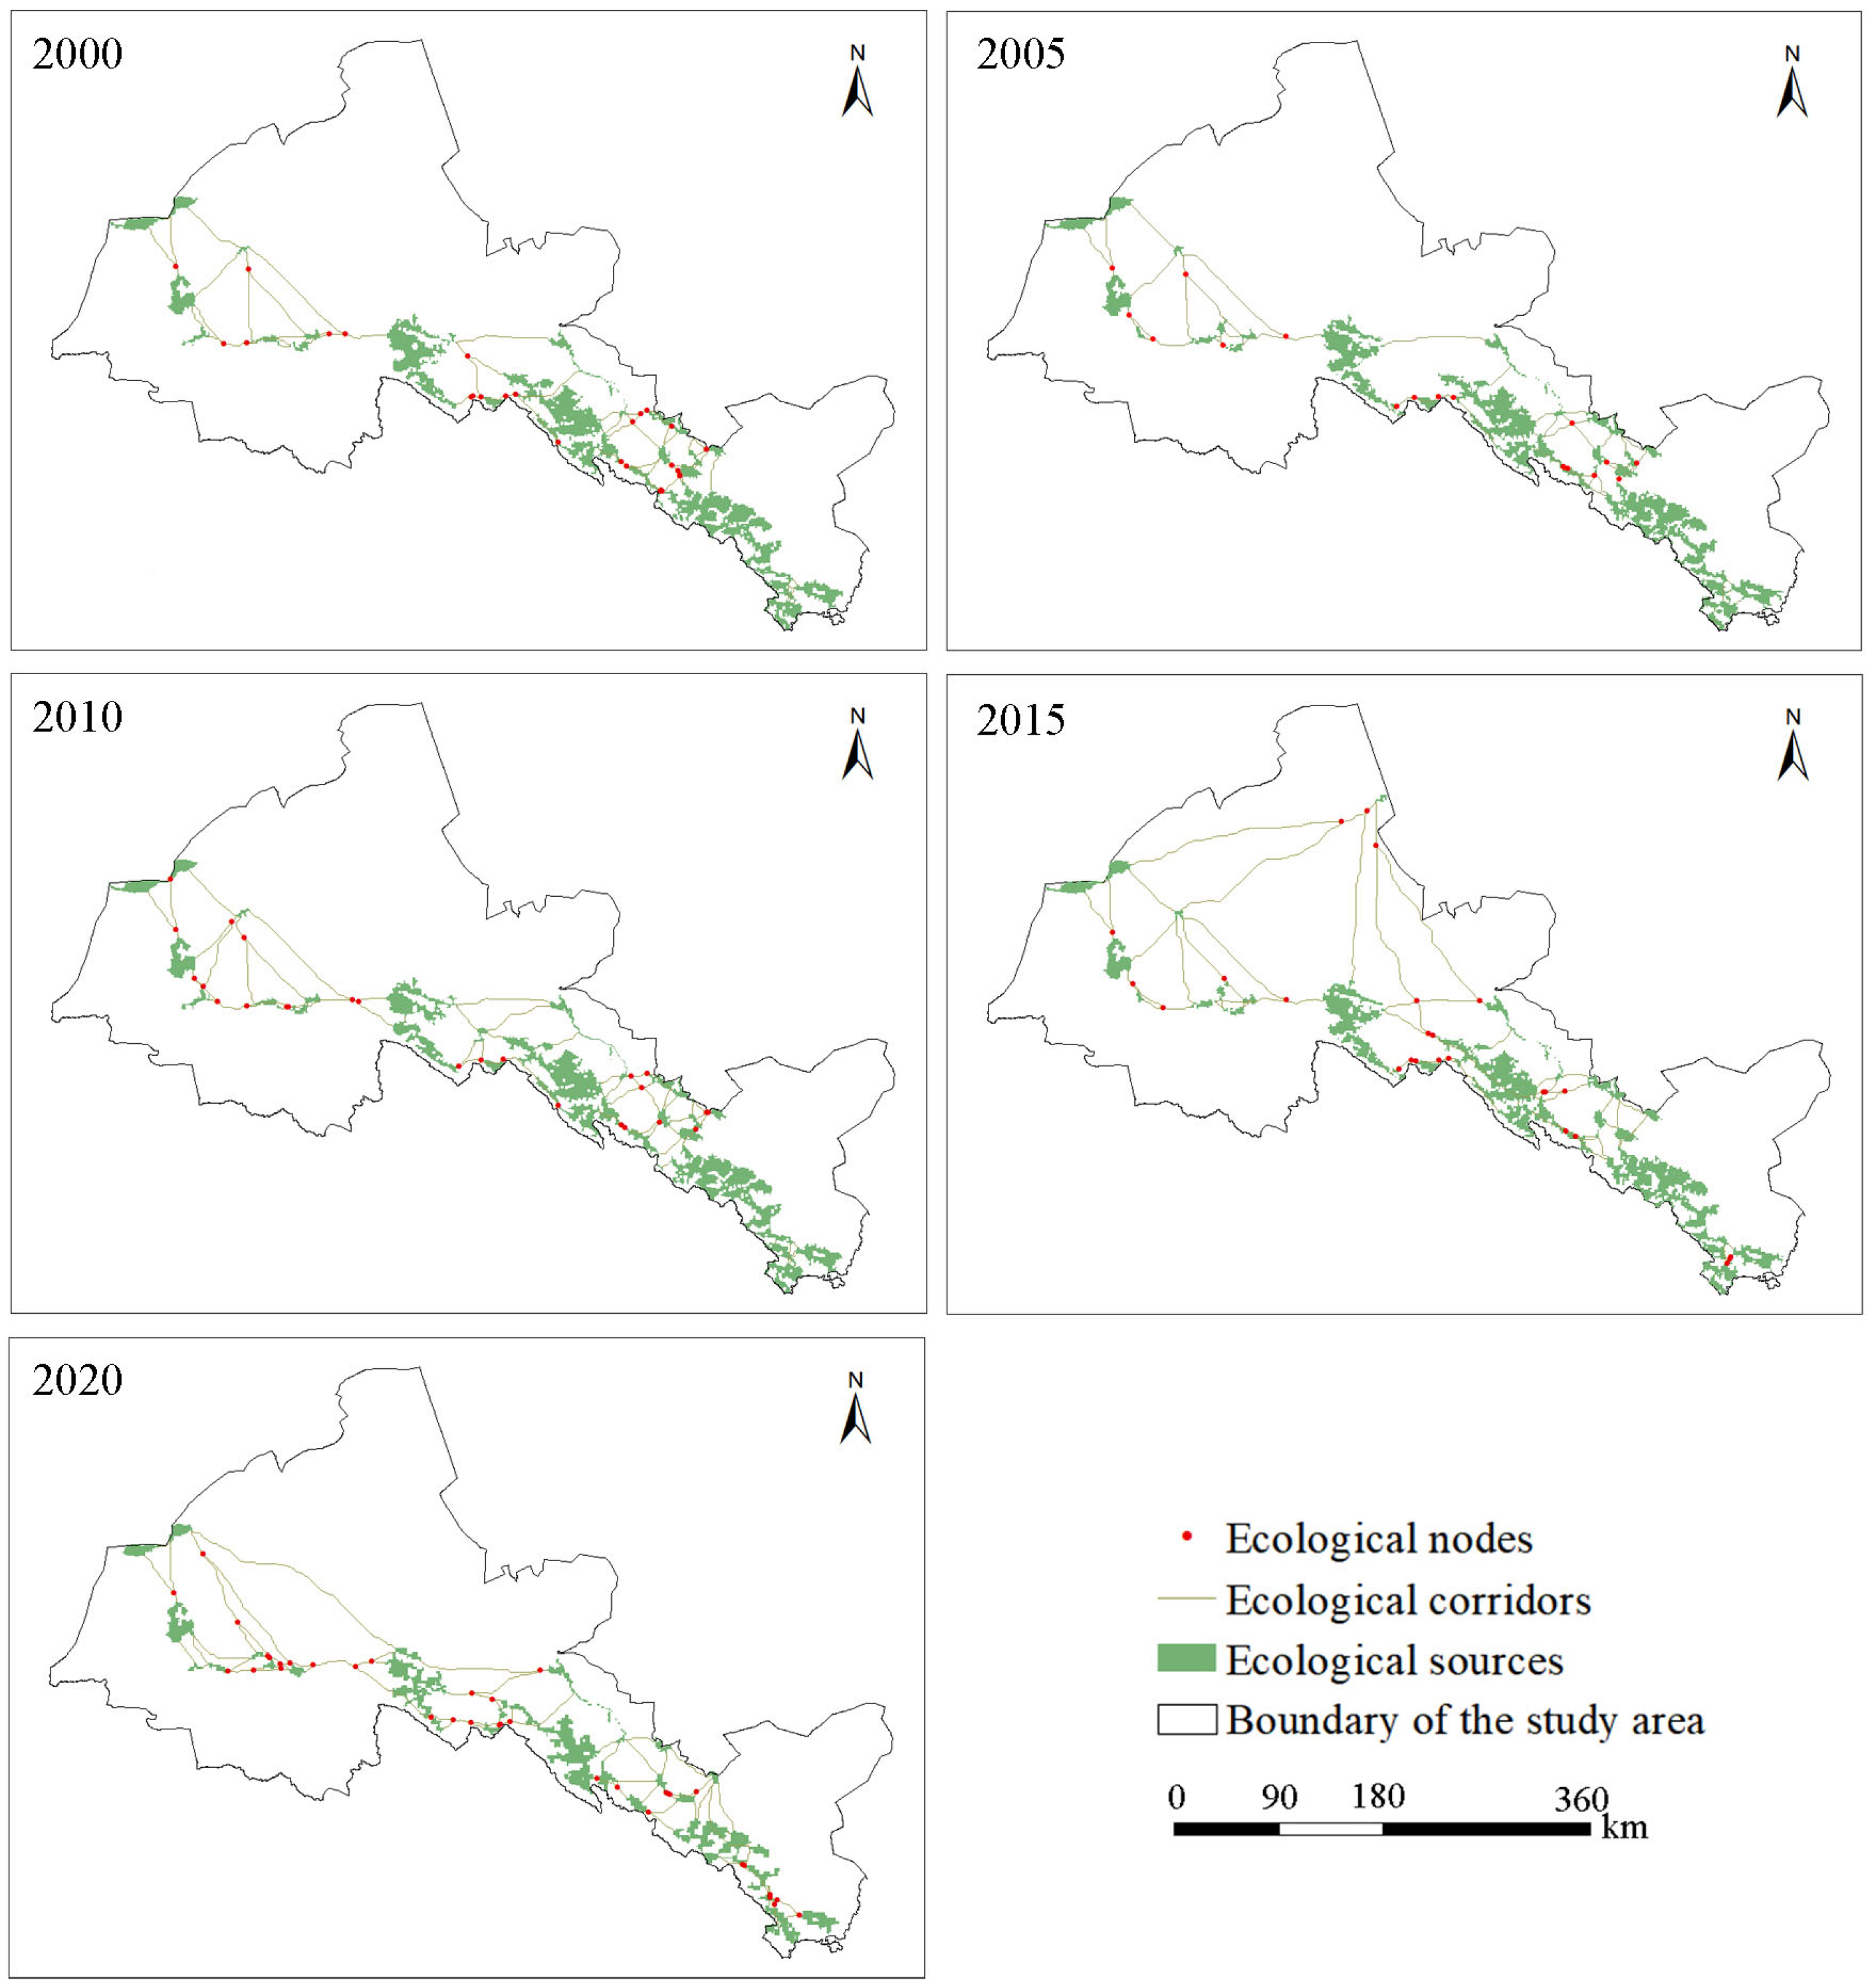
3.1.3. Temporal and Spatial Changes of the Ecological Network

A core area of ≥70 km2 was chosen as the ecological source area based on the landscape features and resistance surfaces, as well as a previous study [55] and the environment of the research area. It was possible to find ecological corridors with the linkage mapper tool. Ecological nodes are parts of the landscape that connect ecological sources that are close to each other in an ecosystem. They are very important for setting up ecological links between two or more ecological sources [56]. This is why the points where ecological paths meet are used as ecological nodes in this paper to produce the ecological network of the study area from 2000 to 2020. The number of ecological source areas that existed grew over time. In 2020, there were 32 of them, most of them in the southwest of Wuwei City and in the places near Zhangye City and Jiuquan City. The ecological corridor between the source areas was between 212.39 km and 533.13 km long. Over time, the number of ecological corridors and nodes increased, with most of them being found in the southwest of Jiuquan City and Zhangye City. In terms of space, the two had the largest changes from 2010 to 2015. In terms of time, the largest change occurred from 2015 to 2020, and the maximum number (75, 36) was reached in 2020 (Figure 4 and Table 5). On the whole, the ecological network was mainly concentrated in the western and southern regions of the study area with abundant water sources. The northwest and northeast regions, mainly dominated by deserts and Gobi, have poor ecological conditions and lack sources, corridors, and node connections.

3.1.4. Change in the Ecological Network Evaluation Indices

The α, β, and γ values for the study area’s overall ecological network showed a W-shaped change trend during 2000–2020. The α index increased from 0.72 to 0.75, indicating an augmentation in both the number of circuits within the ecological network and the optional migration pathways available. The β index decreased from 2.35 to 2.34, indicating a slight decrease because of how complicated the natural network is. The decline in the γ index from 0.85 to 0.83 suggests a decline in the ecological network’s connectedness (Table 5).

3.2. Ecological Network Optimization of the Hexi Corridor

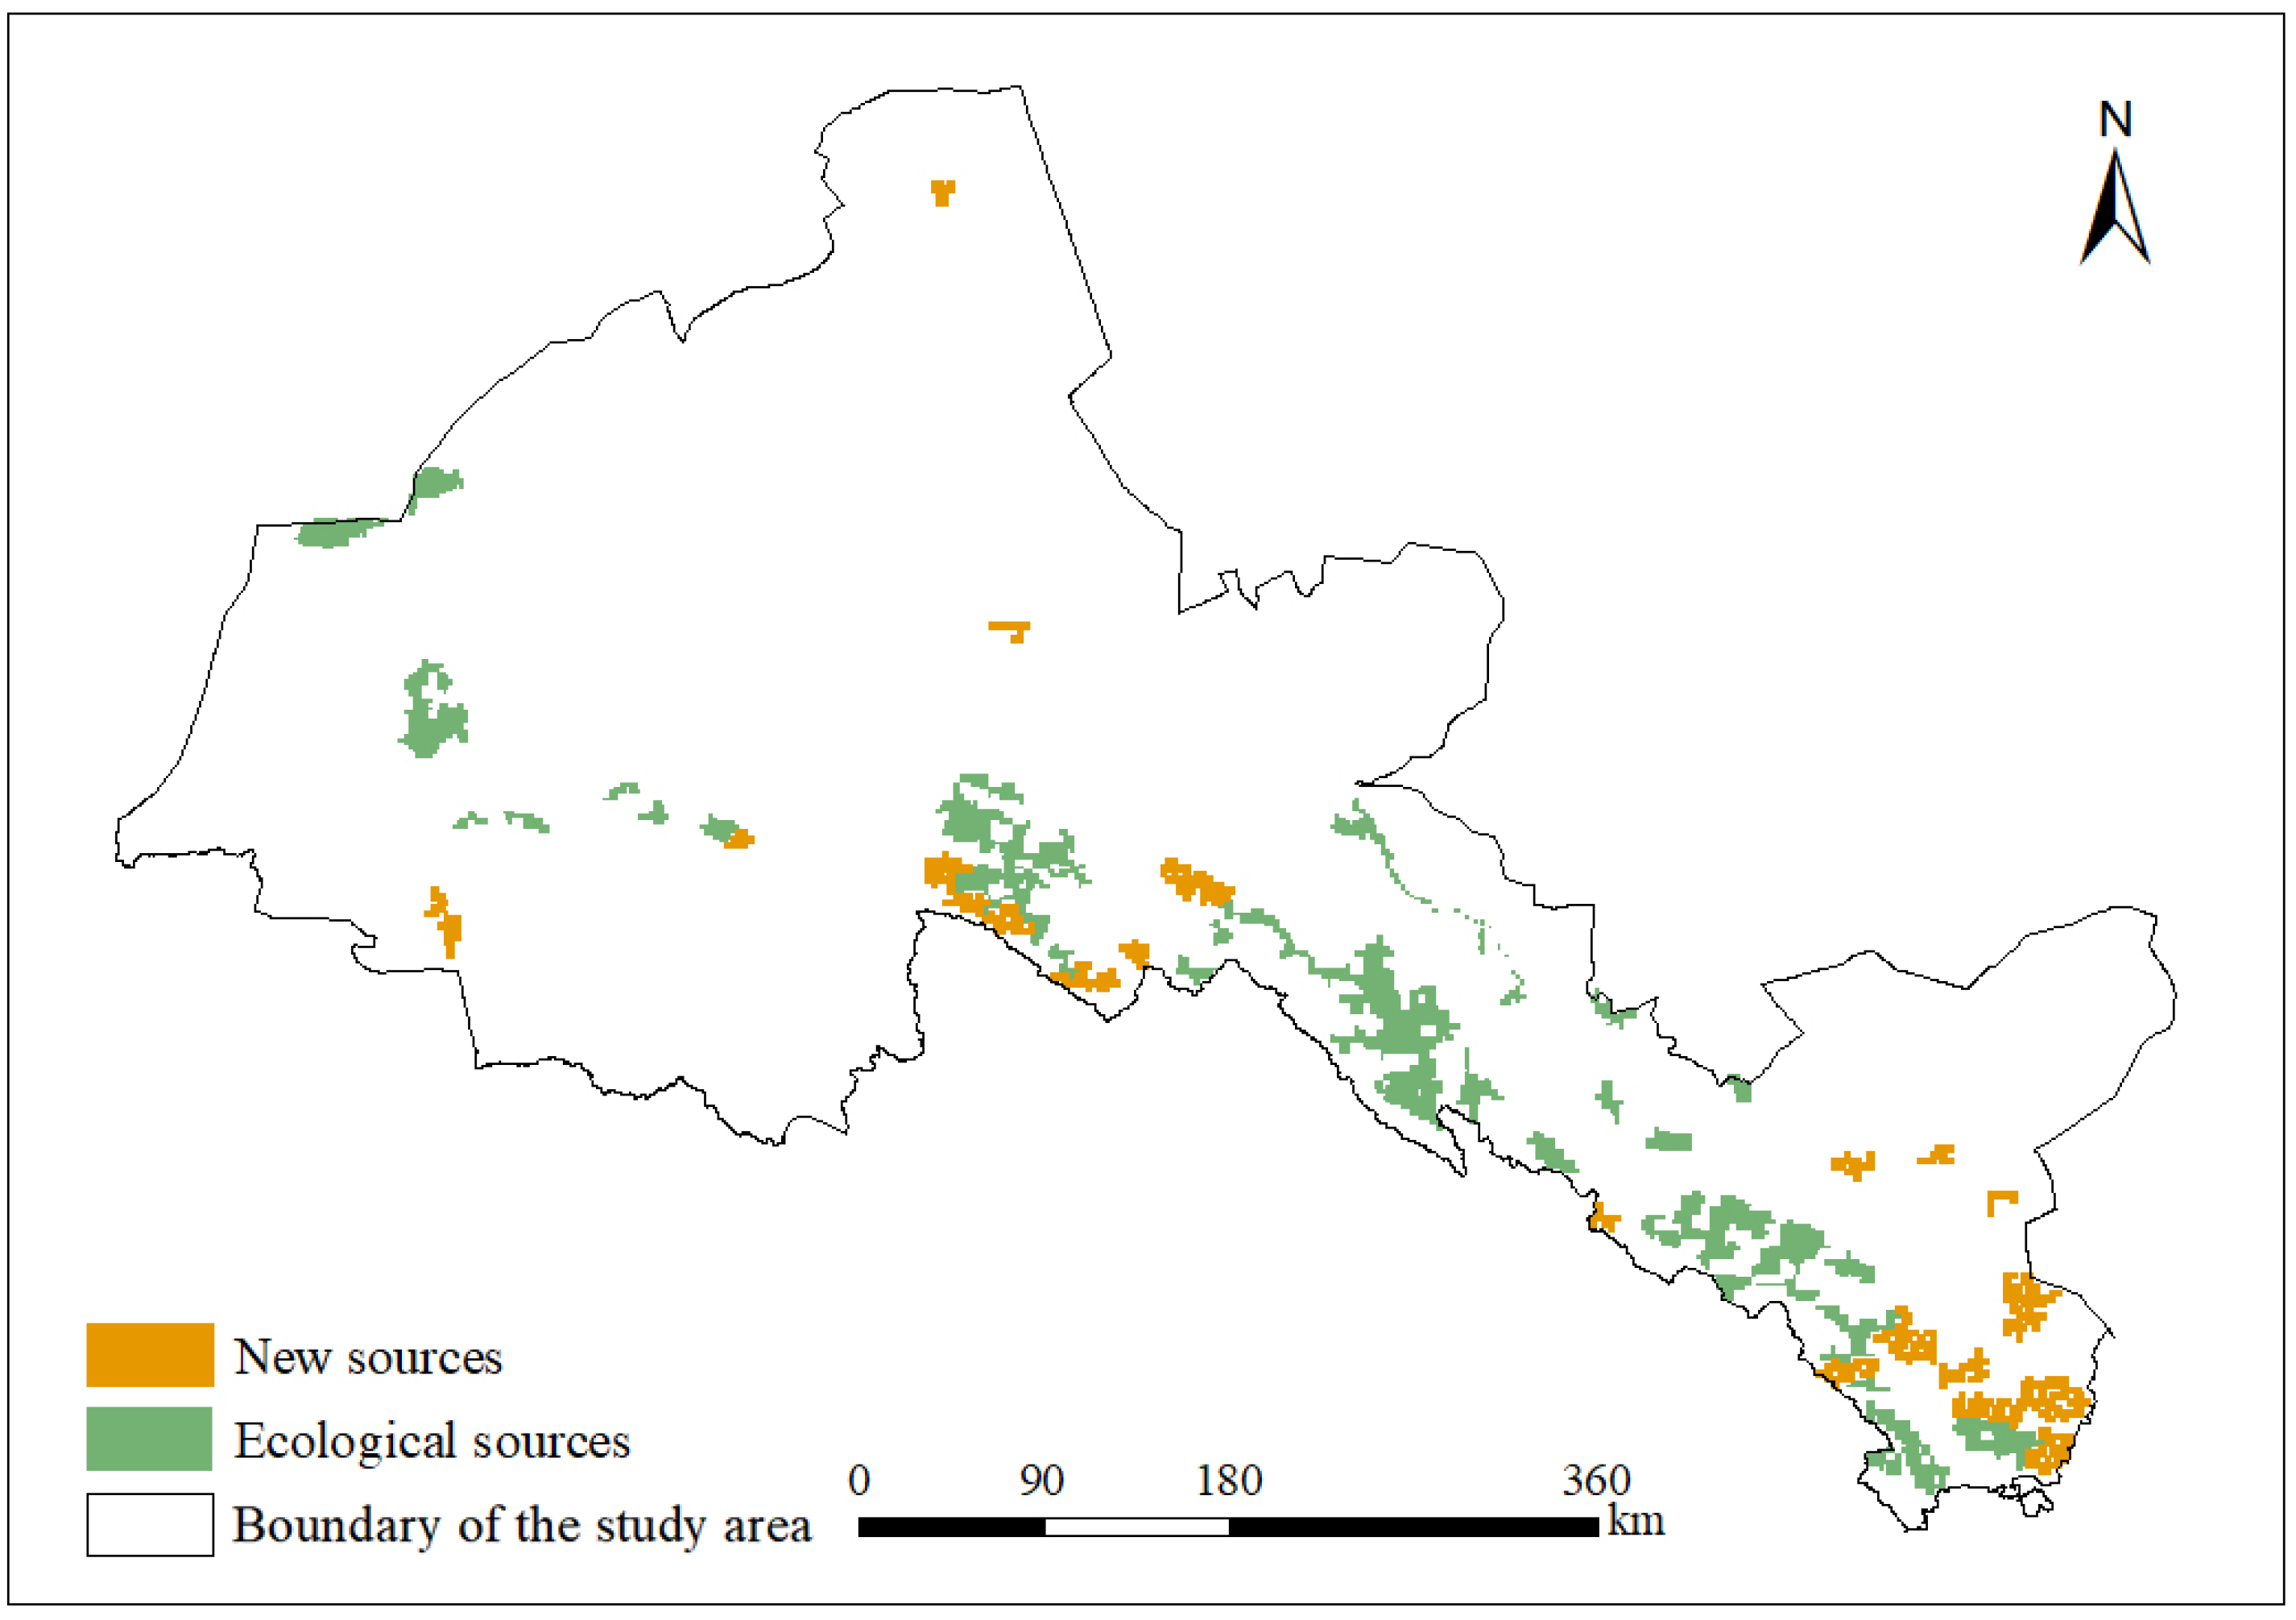
3.2.1. Increasing the Ecological Source Area

This article used area and landscape connectivity as its core based on the ecological network built in 2020 in order to increase the spatial connectivity and stability of the ecological network in the Hexi Corridor. Patches with dPC > 2 and areas ≥ 70 km2 (i.e., bridge areas, loop lines, and islands in the Mazongshan mining area for species migration, material, energy flow channel, and ecological treatment) were selected as new ecological source areas. In this way, 22 new ecological source areas were obtained in the study area. The majority of them were dispersed throughout Jiuquan City’s south and north as well as the central and southern regions of Wuwei City and Zhangye City’s northwest and scattered to the south and north of Jiuquan City (Figure 5).

3.2.2. Setting up the Biological Hubs and Safety Zones

On the basis of adding new source areas, using the linkage mapper tool and gravity model after removing the redundant data, 78 new corridors were obtained. We classified the optimized corridors and obtained 38 key corridors (gravity value > 10,000), 45 important corridors (500 < gravity value < 10,000), and 70 general corridors (gravity value < 500). Among them, key corridors and important corridors were mainly located in the southern part of Zhangye City and Wuwei City, while general corridors were mainly located in the central parts of Jiuquan City and Wuwei City (Figure 6). Based on the corridor data and spatial analysis, 61 new nodes were identified, mainly located in the southwest of Jiuquan City, Zhangye City, and the central and southern parts of Wuwei City (Figure 7). In conclusion, the ecological source areas in Wuwei City and Zhangye City were highly correlated, and organisms were more likely to migrate between the source areas, rendering the corridors more important and with more nodes.

3.2.3. Network Evaluation and Analysis before and after Optimization

How stable and strong the nature network is immediately affected by the effectiveness of the network. Using a network analysis of the α, β, γ indices, we calculated the study area ecological network quality before and after optimization. They were 0.75, 2.34, and 0.83 before optimization, and 0.98, 2.85, and 0.98 after optimization. According to our statistics, the α, β, and γ indices were all improved by 0.23, 0.51, and 0.15, respectively (Table 6). This indicates that the optimized network had more closed loops, strong connectivity between the source areas, a stable network structure, a stronger anti-interference ability, and more flexible material and information flow.

4. Discussion

4.1. Ecological Network Construction

Under the background of rapid urbanization, construction land continues to expand, while grassland and cultivated land continue to shrink [57], leading to the intensification of land desertification. Desertification has not only damaged natural habitats but has also caused a serious loss to local farming and animal husbandry and has large effects on the ecosystem and people’s lives. Early research results indicate that from 2000 to 2017, there was a spatial polarization phenomenon in the ecological environment quality at the boundary of the Hexi region. The areas with low environmental quality were mainly located in the cities of Jiuquan, Jiayuguan, Zhangye, Jinchang, and Wuwei, such as bare land, desert, Gobi, and other unused land. However, the areas with higher environmental quality were mainly concentrated in Jiuquan City, Zhangye City, and the Qilian Mountains to the south of Wuwei City [58]. Because people have taken a series of preventative measures, such as closing mountains for afforestation, restricting grazing, engineering sand consolidation, and shelterbelt construction, they have improved the function of water conservation and curbed land desertification to a certain extent. However, the ecosystem in the Hexi Corridor area is weak because of climate change and the things that people do. The ecological network needs to be identified and optimized.
Landscape features are “more in the south and less in the north” in the Hexi Corridor, according to the ecological network that was built. This is similar to what was found in research projects in the Taolai River basin [23], the Shule River basin [54], and Zhangye City [43]. The southern part of the Hexi Corridor is mostly comprised of wooded, grassy, and water areas with lots of plants. The northern part, on the other hand, is mostly empty land with few plants, which has a big effect on the resistance surface. “Low in the south and high in the north” (1.00–4.56) is the distribution trend of the resistance surface. This matches what Ma Chao et al. [43] and Pan et al. [23] found (low in the south and high in the north, 1.00–5.00 and 1.72–5.31). The ecological network is mostly in the southern part of the Hexi Corridor and was changed by the environment. Landscape separation has gotten worse as the land area used for building oases has grown while the land area used for plants has shrunk. In an ecological network, fragmentation means it is easier to connect and understand, but it also adds more loops and migration routes.

4.2. Suggestions

In summary, it is clear that the Hexi Corridor has rough terrain, a complicated environment, and an ecosystem that is not very stable. The ecological network is an important part of keeping the ecological space safe, so it needs to be looked after and fixed up. The following ideas are offered for ecological source areas, corridors, and nodes. They are based on the idea of regional ecological space control network security.
(1)
Ecological source area
In the central south and southeast of the research area with more ecological source areas, the encroachment of cultivated land expansion on the ecological source areas should be prevented. A buffer zone should be established on the edge of the ecological source areas, and the construction of ecological protection forests should be insisted on for returning farmland to forest and grassland. We also recommend to strengthen the protection of the existing plant and animal resources in the region, maintain biodiversity, and build an intelligent ecological monitoring system. Ecological source areas were less in the west and north areas, so the scale of coal mine development should be controlled and the negative impact of human activities on the environment should be reduced. Additionally, drought-tolerant plants should be planted to prevent wind and fix sand. Geological and geomorphological engineering should also be used to better the area’s ecological environment.
(2)
Ecological corridors and nodes
Protection measures, such as shelter-forest construction should be implemented for key corridors and important corridors in the central and eastern part of the study area, and the current natural ecological patches should be utilized as much as possible to improve construction efficiency. The general corridor in the northwest, which is dominated by desert, Gobi, and other unused land, should be repaired by artificial means. According to different geological and geomorphic characteristics, the construction of nature reserves should be strengthened to ensure the integrity of the corridor system. In the central and eastern ecological node with low resistance values, it is necessary to strengthen management and control to prevent damage by human activities, while in the western ecological node with high resistance values, it is difficult to build, and drought-tolerant vegetation can be planted. At the same time, environmental monitoring stations can be set up near ecological nodes to pay timely attention to biological migration and information exchange, as well as the coordination between humans and the local environment.

4.3. Shortcomings

Only a few papers have looked at dry places, so this one chose to look at the ecological network of the Hexi Corridor. To better protect and restore the environment, we want to rebuild and improve the ecological network. It is hoped that the research results will contribute to scientific and ecological patterns in the future. However, there are some issues with this study. In the construction of resistance surfaces, more natural environmental factors were selected, while less social and economic factors were selected. The influence of human activities on ecological processes is relatively complex, so there needs to be consideration on whether to select or integrate other data (such as GDP and population density) to represent the impact of human factors on ecology. The research community is hopeful that a more scientific method of resistance surface construction will be proposed in subsequent research to further improve the ecological network and avoid artificial subjectivity within the ecological network simulation. Based on this, we still need to predict the ecological network and prevent the intensification of landscape fragmentation so as to improve the stability of the ecosystem as well as the quality of the ecological environment.

5. Conclusions

Our study looked at how a biological network in the Hexi Corridor changed over time and space from 2000 to 2020. It used MSPA, the MCR model, the network evaluation index, and spatial analysis. Things improved with the natural network in 2020. To sum up, these are the main points:
(1)
The main trend from 2000 to 2020 was “more in the south and less in the north” when it came to the Hexi Corridor’s environmental features. These things only took up 25.41 to 25.63 percent of the whole area. It indicated that the ecological foundation in the north was poor.
(2)
The resistance surface value ranged from 1.00 to 4.56. The resistance to biological activity was relatively low near the water source, while the resistance to biological activity was higher on unused land, such as sandy land, bare rock, and industrial and mining land.
(3)
The ecological source area, corridors, and nodes showed a fluctuating upward trend, and they were mainly located on the western and southern regions of the research area with abundant water sources, the northwest and northeast regions dominated by deserts and Gobi had poor ecological conditions, lacking source areas, corridors, and node connections.
(4)
The ecological network grew by adding more loops and migration channels from 2000 to 2020. The α score increased and decreased during that time. Over time, both the β and γ scores decreased, and the ecological network became less complex and connected.
(5)
After ecological network optimization, the α, β and γ indices all increased, indicating that there were more closed loops in the optimized network, the connectivity between source areas was improved, the network structure was stable, and the anti-interference ability was enhanced.

Author Contributions

Conceptualization X.Z.; methodology, X.C. and X.Z.; software, X.C.; formal analysis, X.C. and X.Z.; investigation, X.C. and S.L.; writing—original draft preparation, X.C. and X.Z.; writing—review and editing, X.Z. and X.C.; supervision, X.Z.; funding acquisition, X.Z. All authors have read and agreed to the published version of the manuscript.

Funding

This work was funded by the Education Technology Innovation Project of Gansu Province (No. 2023A-004) and the National Natural Science Foundation of China (Grant No. 41701321).

Data Availability Statement

The data presented in this study are available on request from the corresponding author.

Conflicts of Interest

The authors declare no conflicts of interest.

References

  1. Zeng, C.; Zhang, A.; Liu, L.; Liu, Y. Administrative restructuring and land-use intensity—A spatial explicit perspective. Land Use Policy 2017, 67, 190–199. [Google Scholar] [CrossRef]
  2. Qian, Q.; Liu, H.; Zheng, X. A regional sustainable intensive land use evaluation based on ecological constraints: A case study in Jinan City. Sustainability 2019, 11, 1434. [Google Scholar] [CrossRef]
  3. Yang, J.; Zeng, C.; Cheng, Y. Spatial influence of ecological networks on land use intensity. Sci. Total Environ. 2020, 71, 137151. [Google Scholar] [CrossRef] [PubMed]
  4. Huo, J.G.; Shi, Z.Q.; Zhu, W.B.; Xue, H.; Chen, X. Construction and pattern optimization of ecological network in Zhengzhou metropolitan area. J. Appl. Ecol. 2023, 34, 742–750. [Google Scholar]
  5. Horne, R.; Hickey, J. Ecological sensitivity of Australian rainforests to selective logging. Aust. J. Ecol. 1991, 16, 119–129. [Google Scholar] [CrossRef]
  6. Jongman, R.H. The context and concept of ecological networks. In Ecological Networks and Greenways; Concept; Design; Imprementation; Cambridge University Press: Cambridge, UK, 2004; pp. 7–33. [Google Scholar]
  7. Han, B.P. Progress on the analysis of Econetwork. Chin. J. Ecol. 1993, 12, 41–45. [Google Scholar]
  8. Liu, X.Y.; Wei, M.; Zeng, J.; Zhang, S. Ecological network analysis and construction: A case study of the urban agglomeration of the Min River Delta, China. Resour. Sci. 2021, 43, 357–367. [Google Scholar] [CrossRef]
  9. Huang, H.; Xu, K.Y.; Gao, Y.L.; Liu, J. Building Green Infrastructure Network of Fuzhou Using MSPA. China Landsc. Archit. 2019, 35, 70–75. [Google Scholar]
  10. Abuleti, H. Construction and Optimization of Ecological Network of Urban Agglomerations on the Northern Slopes of Tianshan Mountains Based on MSPA and MCR Models. Master’s Thesis, Xinjiang Normal University, Ürümqi, China, 2022. [Google Scholar]
  11. Li, Y.Y.; Zhang, Y.Z.; Jiang, Z.Y.; Guo, C.X.; Zhao, M.Y.; Yang, Z.G.; Guo, M.Y.; Wu, B.Y.; Chen, Q.L. Integrating morphological spatial pattern analysis and the minimal cumulative resistance model to optimize urban ecological networks: A case study in Shenzhen City, China. Ecol. Process. 2021, 10, 63. [Google Scholar] [CrossRef]
  12. Wei, B.J.; Su, J.; Hu, X.J.; Xu, K.H.; Zhu, M.L.; Liu, L.Y. Comprehensive identification of eco-corridors and eco-nodes based on principle of hydrological analysis and Linkage Mapper. Acta Ecol. Sin. 2022, 42, 2995–3009. [Google Scholar]
  13. Saura, S.; Vogt, P.; Velázquez, J.; Hernando, A.; Tejera, R. Key structural forest connectors can be identified by combining landscape spatial pattern and network analyses. For. Ecol. Manag. 2011, 26, 150–160. [Google Scholar] [CrossRef]
  14. Mann, D.; Agrawal, G.; Joshi, P.K. Spatio-temporal forest cover dynamics along road networks in the Central Himalaya. Ecol. Eng. 2019, 12, 383–393. [Google Scholar] [CrossRef]
  15. An, Y.; Liu, S.; Sun, Y.; Shi, F.; Beazley, R. Construction and optimization of an ecological network based on morphological spatial pattern analysis and circuit theory. Landsc. Ecol. 2021, 36, 2059–2076. [Google Scholar] [CrossRef]
  16. Tian, S.J.; Zhang, W.J.; He, L.; Miao, J.Y.; Zi, Y.K. Construction and optimization of Chengdu ecological network based on Linkage Mapper and complex network. J. Northwest For. Univ. 2023, 38, 176–184. [Google Scholar]
  17. Peng, J.; Zhao, H.J.; Liu, Y.X.; Wu, J.S. Research progress and prospect on regional ecological security pattern construction. Geogr. Res. 2017, 36, 407–419. [Google Scholar]
  18. Rao, P.S.; Gavane, A.; Ankam, S.; Ansari, M.; Pandit, V.; Nema, P. Performance evaluation of a green belt in a petroleum refinery: A case study. Ecol. Eng. 2004, 232, 77–84. [Google Scholar] [CrossRef]
  19. Kihn, C.C.; Eugster, J.G.; Steiner, F.; Judd, M.; Diamant, R.; Gerdtz, N. Conservation options for the blackstone river valley. Landsc. Urban Plan. 1986, 13, 81–99. [Google Scholar] [CrossRef]
  20. Conine, A.; Xiang, W.N.; Young, J.; Whitley, D. Planning for multi-purpose greenways in Concord, North Carolina. Landsc. Urban Plan. 2004, 682, 271–287. [Google Scholar] [CrossRef]
  21. Flink, C.A.; Olka, K.; Searns, R.M. Trails for the Twenty-First Century: Planning, Design, and Management Manual for Multi-Use Trails, 2nd ed.; Island Press: Washington, DC, USA, 2001. [Google Scholar]
  22. Wang, X.R.; Wan, R.R.; Pan, P.P. Construction and adjustment of ecological security pattern based on MSPA-MCR model in Taihu Lake Basin. Acta Ecol. Sin. 2022, 42, 1968–1980. [Google Scholar]
  23. Pan, J.; Wang, Y.; Zhang, Z. Identification and Optimization of Ecological Network in Arid Inland River Basin Using MSPA and Spatial Syntax: A Case Study of Shule River Basin, NW China. Land 2023, 12, 292. [Google Scholar] [CrossRef]
  24. Wei, Q.; Halike, A.; Yao, K.; Chen, L.; Balati, M. Construction and optimization of ecological security pattern in Ebinur Lake Basin based on MSPA-MCR models. Ecol. Indic. 2022, 138, 108857. [Google Scholar] [CrossRef]
  25. Zhou, S.; Song, Y.; Li, Y.; Wang, J.; Zhang, L. Construction of Ecological Security Pattern for Plateau Lake Based on MSPA–MCR Model: A Case Study of Dianchi Lake Area. Sustainability 2022, 1421, 14532. [Google Scholar] [CrossRef]
  26. Wang, Z.; Shi, Z.; Huo, J.; Zhu, W.; Yan, Y.; Ding, N. Construction and Optimization of an Ecological Network in Funiu Mountain Area Based on MSPA and MCR Models, China. Land 2023, 128, 1529. [Google Scholar] [CrossRef]
  27. Liu, G.; Yang, Z.; Chen, B.; Zhang, L.; Zhang, Y.; Su, M. An ecological network perspective in improving reserve design and connectivity: A case study of Wuyishan nature reserve in China. Ecol. Model. 2015, 306, 185–194. [Google Scholar] [CrossRef]
  28. Wang, Y.Y.; Jin, X.B.; Shen, C.Z.; Bao, G.Y.; Liu, J.; Zhou, Y.K. Establishment of an ecological security pattern in the eastern developed regions: A case study of the Sunan District. Acta Ecol. Sin. 2019, 39, 2298–2310. [Google Scholar]
  29. Yao, X.J.; Hu, Y.; Li, J.L.; Jiang, D. Construction of ecological security pattern based on ‘Pressure-state-response model’ in Linquan county of Anhui Province. J. Anhui Agric. Univ. 2020, 47, 538–546. [Google Scholar]
  30. Xie, J.; Xie, B.; Zhou, K.; Li, J.; Xiao, J.; Liu, C.; Zhang, X. Multiple Probability Ecological Network and County-Scale Management. Land 2023, 12, 1600. [Google Scholar] [CrossRef]
  31. Liu, Y.; Lu, Y.; Zhou, H.; Zhang, S.; Yu, X. Construction of an Ecological Security Pattern Based on Ecological Sensitivity and MSPA–MCR Model: A Case Study with the Urban Central District of Harbin. Preprints 2023, 2023100570. [Google Scholar] [CrossRef]
  32. Geng, J.; Yu, K.; Sun, M.; Xie, Z.; Huang, R.; Wang, Y.; Zhao, Q.; Liu, J. Construction and Optimisation of Ecological Networks in High-Density Central Urban Areas: The Case of Fuzhou City, China. Remote Sens. 2023, 1524, 5666. [Google Scholar] [CrossRef]
  33. Li, C.L. Water China: A Survey on the Construction of a “Water Saving Society” in China; Beijing Book Co. Inc.: Linden, NJ, USA, 2016. [Google Scholar]
  34. Yang, L.J.; Yang, H.N.; Yang, Y.C.; Wei, W.; Pan, J.H. Spatial-temporal evolution of ecological environment quality in Hexi Corridor based on Coupled Coordination Model. China Popul. Resour. Environ. 2020, 30, 102–112. [Google Scholar]
  35. Wagner, B.; Liang, E.; Li, X.; Dulamsuren, C.; Leuschner, C.; Hauck, M. Carbon pools of semi-arid Picea crassifolia forests in the Qilian Mountains (north-eastern Tibetan Plateau). For. Ecol. Manag. 2015, 34, 136–143. [Google Scholar] [CrossRef]
  36. Li, Y.Y.; Zhang, C.Y.; Zhang, A.P.; Yang, J.P.; Chen, Y.; Nie, X. Vertical structure characteristics of atmospheric boundary layer in spring sandstorm over Hexi Corridor. Meteorol. Mon. 2022, 48, 1171–1185. [Google Scholar]
  37. Wang, Z.; Ficklin, D.L.; Zhang, Y.; Zhang, M. Impact of climate change on streamflow in the arid Shiyang River Basin of northwest China. Hydrol. Process. 2012, 26, 2733–2744. [Google Scholar] [CrossRef]
  38. Chen, Y.; Niu, J.; Kang, S.; Zhang, X. Effects of irrigation on water and energy balances in the Heihe River basin using VIC model under different irrigation scenarios. Sci. Total Environ. 2018, 645, 1183–1193. [Google Scholar] [CrossRef] [PubMed]
  39. Wang, Y.; Zhao, J.; Fu, J.; Wei, W. Effects of the Grain for Green Program on the water ecosystem services in an arid area of China—Using the Shiyang River Basin as an example. Ecol. Indic. 2019, 104, 659–668. [Google Scholar] [CrossRef]
  40. Nie, W.; Shi, Y.; Siaw, M.J.; Yang, F.; Wu, R.; Wu, X.; Zheng, X.; Bao, Z. Constructing and optimizing ecological network at county and town Scale: The case of Anji County, China. Ecol. Indic. 2021, 132, 108294. [Google Scholar] [CrossRef]
  41. Vogt, P.; Riitters, K. GuidosToolbox: Universal digital image object analysis. Eur. J. Remote Sens. 2017, 501, 352–361. [Google Scholar] [CrossRef]
  42. Mu, H.; Li, X.; Ma, H.; Du, X.; Huang, J.; Su, W.; Yu, Z.; Xu, C.; Liu, H.; Yin, D. Evaluation of the policy-driven ecological network in the Three-North Shelterbelt region of China. Landsc. Urban Plan. 2022, 218, 104305. [Google Scholar] [CrossRef]
  43. Ma, C.; Chen, Y.; Zhang, J.L.; Xie, B.P.; Zhang, Q. Construction and optimization of ecological security pattern in Hexi Corridor. Ecol. Sci. 2023, 42, 206–214. [Google Scholar]
  44. Zhang, Q.; Guo, Z.W.; Qi, K.; Zhao, L.Y. Variation of ecological network in Xiangyang City based on MSPA and MCR model. J. Hubei Univ. (Nat. Sci.) 2022, 44, 162–170. [Google Scholar]
  45. Liu, Y.S.; Li, J.T. Geographic detection and optimizing decision of the differentiation mechanism of rural poverty in China. Acta Geogr. Sin. 2017, 72, 161–173. [Google Scholar]
  46. Liu, C.F.; Li, J.Z.; Li, X.M.; He, X.Y.; Chen, W. Selected urban forest landscape pattern indices based on simulated landscapes. Chin. J. Appl. Ecol. 2009, 5, 1125–1131. [Google Scholar]
  47. Peng, J.; Pan, Y.; Liu, Y.; Zhao, H.; Wang, Y. Linking ecological degradation risk to identify ecological security patterns in a rapidly urbanizing landscape. Habitat Int. 2018, 71, 110–124. [Google Scholar] [CrossRef]
  48. Yue, D.P.; Wang, J.P.; Liu, Y.B.; Li, H.L.; Xie, H.C.; Wang, D.M. Landscape pattern optimization based on GIS and RS in northwest of Beijing. Acta Geogr. Sin. 2007, 11, 1223–1231. [Google Scholar]
  49. Xiao, H.; Liu, Y.; Yu, Z.; Zhang, Q.; Zhang, X. Combination of ecoprofile and least-cost model for eco-network planning. Chin. Geogr. Sci. 2014, 24, 113–125. [Google Scholar] [CrossRef]
  50. Zhao, S.M.; Ma, Y.F.; Wang, J.L.; You, X.Y. Landscape pattern analysis and ecological network planning of Tianjin City. Urban For. Urban Green. 2019, 46, 126479. [Google Scholar] [CrossRef]
  51. Chen, J.; Zhao, C.C.; Zhao, Q.; Xu, C.M.; Lin, S.; Qiu, R.Z.; Hu, X.S. Construction of ecological network in Fujian Province based on morphological spatial pattern analysis. Acta Ecol. Sin. 2023, 43, 603–614. [Google Scholar]
  52. Zhang, R.; Zhang, L.; Zhong, Q.; Zhang, Q.; Ji, Y.; Song, P.; Wang, Q. An optimized evaluation method of an urban ecological network: The case of the Minhang District of Shanghai. Urban For. Urban Green. 2021, 62, 127158. [Google Scholar] [CrossRef]
  53. Liu, S.; Deng, L.; Dong, S.; Zhao, Q.; Yang, J.; Wang, C. Landscape connectivity dynamics based on network analysis in the Xishuangbanna Nature Reserve, China. Acta Oecol. 2014, 55, 66–77. [Google Scholar] [CrossRef]
  54. Zhang, X.; Wang, Z.; Liu, Y.; Shi, J.; Du, H. Ecological Security Assessment and Territory Spatial Restoration and Management of Inland River Basin—Based on the Perspective of Production–Living–Ecological Space. Land 2023, 128, 1612. [Google Scholar] [CrossRef]
  55. Chen, H.Y.; Li, X. Optimization of green space habitat network in beijing central urban area based on MSPA-InVEST Model. Landsc. Archit. 2021, 28, 16–21. [Google Scholar]
  56. Meng, J.J.; Wang, X.D.; Zhou, Z. Integrated Landscape Pattern Optimization in Arid Region: A Case Study of Middle Reaches of Heihe River. Acta Sci. Nat. Univ. Pekin. 2017, 53, 451–461. [Google Scholar]
  57. Li, F.P.; Han, H.; Yang, S.W. Analysis of land use change in Gansu province from 2000 to 2020 and multi-scenario simulation of Gansu’s ecological space based on PLUS. Sci. Technol. Eng. 2023, 23, 6316–6326. [Google Scholar]
  58. Song, Y.; Shi, H.C.; Xie, M.H.; Zhao, P.X. Spatiotemporal evolution pattern and influencing factors of eco-environmental quality in Gansu from 2000 to 2017. Chin. J. Ecol. 2019, 38, 3800–3808. [Google Scholar]
Figure 1. Overview of the research area.
Sustainability 16 01704 g001
Figure 2. MSPA analysis results of the Hexi Corridor from 2000 to 2020.
Sustainability 16 01704 g002
Figure 3. Resistance value results of the Hexi Corridor from 2000 to 2020.
Sustainability 16 01704 g003
Figure 4. Ecological network of the Hexi Corridor from 2000 to 2020.
Sustainability 16 01704 g004
Figure 5. New sources of the Hexi Corridor in 2020.
Sustainability 16 01704 g005
Figure 6. Ecological corridor levels.
Sustainability 16 01704 g006
Figure 7. Ecological network after Hexi Corridor optimization in 2020.
Sustainability 16 01704 g007
Table 1. Data sources.
DatasetResolutionSource
DEM250 mInstitute of Geographic Sciences and Natural Resources Research (http://www.resdc.cn/ (accessed on 21 November 2023))
Land use1 km
NDVI
Water network dataOpen Street Map (https://www.openstreetmap.org/ (accessed on 21 November 2023))
Road network data
Table 2. MSPA landscape types and their ecological significance.
Landscape TypeEcological Significance and Function
CoreBiological processes that start on large areas of land.
BridgeBiological processes that start on large areas of land. Species can move between core areas that are close to each other and have a small space between them. This also allows energy to flow between them.
EdgeBecause of the edge, noise from the outside cannot get into the core room.
BranchThe edge zone, hole, bridge zone, and loop line are all linked to the same end.
LoopThe biological passage lets species move through the same core area. This corridor also lets things and energy flow.
IsletSome spots are spread out and do not easily connect to each other.
PerforationThis is the difference between the main area and the background inside the main area. It is on the inside edge of the core area.
Table 3. Classification and weight of the resistance factors.
Resistance FactorClassification IndexResistance ValueWeight
Elevation/m0–150010.14
1500–20002
2000–25003
2500–35004
>35005
Slope/°0–810.10
8–152
15–253
25–354
>355
NDVI>0.7010.25
0.50–0.702
0.30–0.503
0.10–0.304
0.00–0.105
Land useForest, shrub, sparse forest, high-coverage grasslands, lakes, canals10.41
Land covered with grassland, marsh, reservoir pits2
Other woodland, low-cover grassland, permanent glacial snow, dry land3
beaches, saline-alkali land, bare soil, other4
urban land, rural resident land, other construction land, bare rock gravel land, gobi, sandy land5
Road network density0.00–6.5010.06
6.50–16.002
16.00–29.203
29.20–48.304
48.30–90.655
Water network density0.05–0.0810.04
0.03–0.052
0.02–0.033
0.01–0.024
0.00–0.015
Table 4. Proportion of different landscape elements in the study area from 2000 to 2020.
TimeCoreBridgeEdgeBranchLoopIsletPerforationArea/×104 km2Total
20007.704.313.593.261.175.340.266.3425.63
20057.654.123.573.251.265.370.256.3025.46
20107.604.243.623.261.195.270.296.3125.47
20157.594.133.573.231.205.440.266.2925.41
20205.148.381.581.551.956.760.146.3025.49
TrendSustainability 16 01704 i001Sustainability 16 01704 i002Sustainability 16 01704 i003Sustainability 16 01704 i004Sustainability 16 01704 i005Sustainability 16 01704 i006Sustainability 16 01704 i007Sustainability 16 01704 i008
Table 5. Ecological network statistics from 2000 to 2020.
TimeEcological SourceEcological CorridorLongest Corridor/kmEcological Nodeαβγ
20002661212.39270.722.350.85
20052861212.49180.672.180.78
20102865212.98250.752.320.83
20152863533.13250.712.250.81
20203275301.58360.752.340.83
TrendSustainability 16 01704 i009Sustainability 16 01704 i010Sustainability 16 01704 i011Sustainability 16 01704 i012Sustainability 16 01704 i013Sustainability 16 01704 i014
Table 6. Network evaluation of the Hexi Corridor before and after ecological network optimization in 2020.
Network Evaluation Indexαβγ
Before optimization0.752.340.83
After optimization0.982.850.98
Change0.230.510.15
Disclaimer/Publisher’s Note: The statements, opinions and data contained in all publications are solely those of the individual author(s) and contributor(s) and not of MDPI and/or the editor(s). MDPI and/or the editor(s) disclaim responsibility for any injury to people or property resulting from any ideas, methods, instructions or products referred to in the content.

