Article

Tracing Water Recharge and Transport in the Root-Zone Soil of Different Vegetation Types in the Poyang Lake Floodplain Wetland (China) Using Stable Isotopes

1
School of Geography, Jiangsu Second Normal University, Nanjing 211200, China
2
Coalfield Geological Research of Jiangxi Province, Nanchang 330001, China
3
Changjiang River Scientific Research Institute, Wuhan 430010, China
4
Nanjing Institute of Geography and Limnology, Chinese Academy of Sciences, Nanjing 210008, China
5
Nanjing Centre, China Geological Survey, Nanjing 210016, China
*
Authors to whom correspondence should be addressed.
Sustainability 2024, 16(5), 1755; https://doi.org/10.3390/su16051755
Submission received: 3 January 2024 / Revised: 17 February 2024 / Accepted: 20 February 2024 / Published: 21 February 2024
(This article belongs to the Section Environmental Sustainability and Applications)

Abstract

:
Background: root-zone water transport is crucial in the water transformation from precipitation to groundwater, directly influencing soil moisture distribution and resource acquisition for wetland plants. Methods: This study investigated the movement mechanism of root-zone (0–80 cm) soil water in the Poyang Lake wetland, China, during a dry year. Hydrological observation and stable isotopes (δ18O and δD) were utilized. Results: The root-zone soil water content was low (2.9–12.6%) at the high site covered by Artemisia capillaris, while it remained high (25.2–30.2%) at the median and low sites covered by Phragmites australis and Carex cinerascens, respectively. The isotopic values of shallow soil water (0–40 cm) in the A. capillaris site followed the seasonal pattern of rainfall isotopes, indicating predominantly rainfall recharge. Rainfall was primarily transported by piston flow, with an infiltration depth of approximately 60 cm. Conversely, depleted water isotopes measured at certain depths in P. australis and C. cinerascens sites closely resembled those of rainfall, suggesting that preferential flow dominated. The average groundwater contribution proportions in root-zone soil water were 65.5% and 57.4% in P. australis and C. cinerascens sites, respectively, while no contribution was detected in A. capillaris site. Conclusions: Preferential flow and groundwater recharge occurred in the P. australis and C. cinerascens sites. They enhance the hydrological connection at the profile scale and are useful for maintaining a favorable root-zone moisture environment for wetland ecosystems in dry years. However, the hydrological connectivity between root-zone soil and groundwater was found to be obstructed in the A. capillaris site. This might be the main reason for vegetation degradation at high elevations in the Poyang Lake wetland.

1. Introduction

The hydrological process has been widely recognized as the primary factor controlling the health of floodplain wetland ecosystems [1,2]. Water level fluctuations and precipitation infiltration directly impact the replenishment and movement of water within wetland systems, thereby influencing the growth of vegetation [2]. The root zone serves as a connection and transformation link between the atmosphere, soil, plants, and groundwater, and is critical for plant resource acquisition belowground [3,4]. Soil water movement in the root zone is a critical process within the wetland water cycle, governing rainfall infiltration, soil evaporation, and the conversion of rainfall or surface water into groundwater [5,6,7]. These processes ultimately determine the redistribution of soil water content. Root-zone soil water is the direct water source for wetland plants, and its dynamics directly influence plant water utilization and nutrient acquisition [8]. Investigating the water movement mechanisms in the root zone is crucial for understanding various ecohydrological processes, including water interactions in the river/lake wetland systems, water-mediated biogeochemistry cycling, and the evolution of wetland vegetation under changing hydrological conditions.
Soil water transport is influenced by various factors, including rainfall, evaporation, soil texture, vegetation, and groundwater [4]. Evaporation decreases shallow soil water and water potential, causing deep water to move upward. Precipitation is crucial for wetland water supply. The complex process of rainfall infiltration is influenced by rainfall characteristics, soil heterogeneity, and vegetation. Two common water transport patterns are piston flow and preferential flow [9,10]. Piston flow occurs when rainwater displaces and mixes with pre-existing soil water [11]. In situations with thick and dry unsaturated soil, piston flow may not effectively recharge groundwater, limiting hydrological connectivity at the profile scale [4,12]. Preferential flow, on the other hand, represents the rapid movement of water through macropores such as vegetation roots, earthworm burrows, and soil fissures [13]. It allows recent rainfall to bypass the soil matrix, promoting efficient recharge to groundwater with minimal resistance [14,15]. This means that preferential flow can alter the water flow process in soil and improve the hydrological connection at the profile scale [16]. In areas with shallow groundwater, there is close water exchange between the root zone and groundwater [17]. The dynamics of the groundwater table influence the water fluxes at the bottom boundary of the root zone. Meanwhile, in riparian wetlands, the interaction between nearby surface water and groundwater impacts soil water dynamics [18,19]. Therefore, exploring water transport mechanisms through the root zone in wetlands can be challenging.
Traditional methods for studying soil water movement, such as intensive field observation and numerical simulation, face challenges in wetlands due to complex periodic flooding conditions and limited data availability [7,20]. Water stable isotopes (18O and D) are valuable in tracking various soil hydrological processes, including rainfall infiltration, evaporation, soil water movement, and estimating rainfall recharge to groundwater and capillary rise [5,9,20]. However, previous studies primarily focused on water movement in forests and agricultural land in dry soil regions, where rainfall and soil evaporation are the primary driving factors. Some studies have explored water transport in constructed wetlands but mainly focused on the treatment effect of pollutants in different water flow types [21]. In certain reports, the controlling factors of preferential flow formation in coastal wetlands were investigated by dye-tracing experiments [7,15]. However, few studies have examined the mechanism of root-zone soil water movement in floodplain wetlands with fluctuating groundwater levels. This knowledge gap exists primarily because the water transport process across the soil–atmosphere–groundwater system is complex and influenced simultaneously by variations in rainfall, groundwater, and surface water. Therefore, quantifying the processes of water movement in the root zone of wetlands is necessary to evaluate the impact of hydrological changes on ecohydrological processes in wetlands.
Poyang Lake, situated in the middle reaches of the Yangtze River, is the largest freshwater lake in China. The lake water level fluctuates seasonally, creating an expansive floodplain wetland [22]. This wetland is characterized by diverse vegetation communities [23]. The growth and distribution patterns of vegetation primarily depend on soil moisture and groundwater levels [20,24,25], both of which are highly impacted by the fluctuations in the Poyang Lake water level [22]. However, the water regimes of Poyang Lake have changed dramatically due to climate change and human activities, including the decadal decrease in lake level and notably lower levels in autumn [26,27]. These hydrological changes have caused a dramatic increase in the emergent wetland area and prolonged exposure periods. Since 2003, there has been a 13% increase in the mean annual emergent wetland area [28]. Especially in October, the exposed wetland area has increased by 1078 km2 due to the lower water level [28]. This exposure of wetlands results in changes in wetland water processes and the loss of marsh vegetation.
The vegetation degradation in Poyang Lake wetland is closely linked to changes in root-zone soil moisture and wetland groundwater levels [8,24]. Therefore, studying the recharge and transport processes of root-zone soil water is essential for comprehending wetland vegetation succession and the interaction between wetland groundwater and the root zone under changing hydrological regimes. Previous studies have assessed the influences of Poyang Lake water level changes on wetland inundation duration and groundwater table using numerical simulation and remote sensing [23,26]. Other studies have investigated the sources of water in the Poyang Lake basin and identified that wetland groundwater receives recharge from surface waters [22,29]. However, these field studies are limited to individual months, and a continuous investigation of soil water isotopes in Poyang Lake wetland has not been carried out. The water transformations among rainfall, groundwater, and root-zone soil water under different vegetation types are still poorly understood. Several questions remain unclear, such as the mechanism by which rainfall transfers to soil water and groundwater, and whether preferential flow exists in different vegetation types and enhances the hydrological connection at the profile scale.
This study aims to investigate the root-zone water transport in Poyang Lake wetland, China, in a dry year. The primary objectives are (1) to analyze variations in isotope characteristics of different recharge sources (rainfall, surface water, and wetland groundwater) and root-zone soil water across seasons and vegetation types; (2) to explore the mechanisms of rainfall infiltration, groundwater capillary rise, and the movement pattern of water through the root zone of different vegetation types; and (3) to estimate the recharge fraction from rainfall and groundwater to root-zone soil water in a typical dry year. The results can provide valuable insight into the movement of water in the root zone and its interactions with groundwater in floodplain wetlands. Furthermore, they can enhance our understanding of the biogeochemical cycles and vegetation responses to hydrological changes in wetlands.

2. Materials and Methods
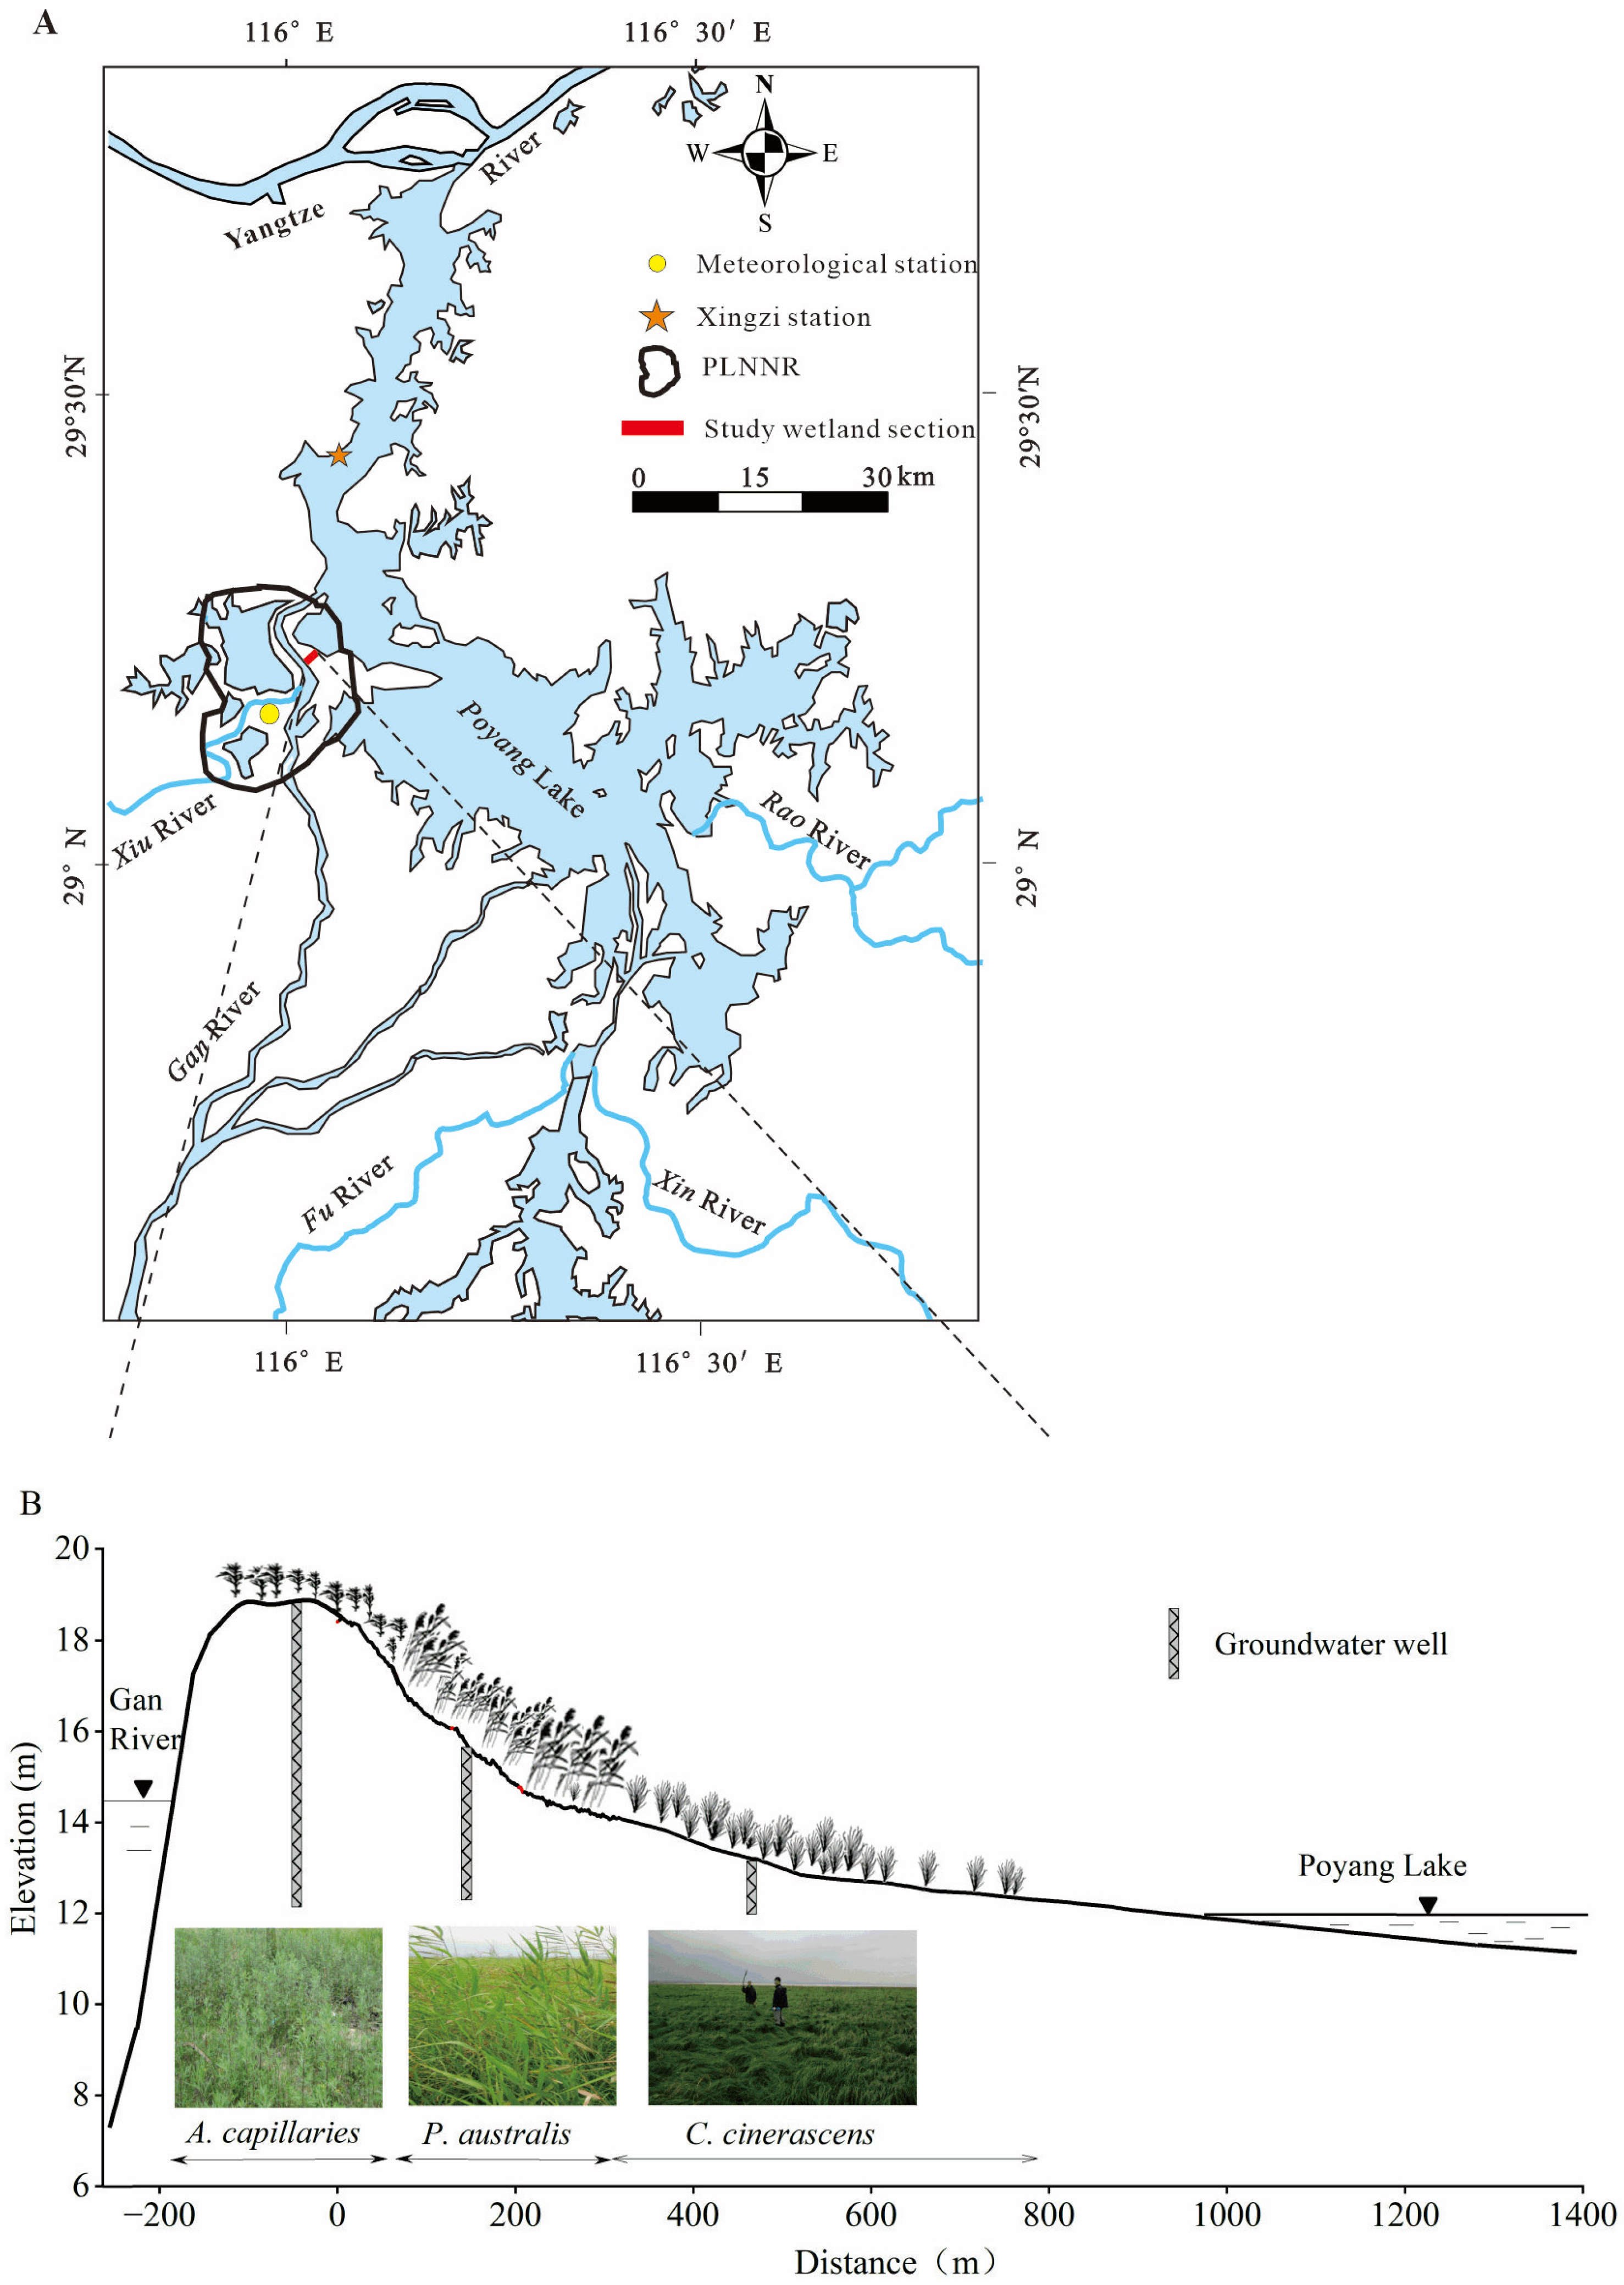
2.1. Study Area

The water level of Poyang Lake undergoes seasonal changes due to the influences of five inflow rivers (Gan, Fu, Xin, Rao, and Xiu Rivers) and the Yangtze River (Figure 1A). During the rainy season, water from these five inflows recharge Poyang Lake, and the lake water level rises such that the area of floodplains inundated by the lake can exceed 4000 km2. Conversely, during the dry season, the lake water level drops such that the lake area shrinks to less than 500 km2 and the floodplain wetlands are exposed [23].
In the northwest of Poyang Lake, the Poyang Lake National Nature Reserve (PLNNR, 29°05′ N–29°15′ N, 115°55′ E–116°03′ E) was established for wetland conservation (Figure 1A). It is situated at the confluence of Gan River and Xiu River and comprises vast wetland meadows. The region is characterized by a subtropical humid monsoon climate. The mean annual precipitation is about 1454 mm, with approximately 55% falling from March to June [30]. The annual mean air temperature is 17.6 °C, peaking in July. The lake water level generally rises from April to June, reaches the highest in July and August, and declines from September to December [27]. The plants in Poyang Lake wetland are zonally distributed along an elevation gradient [23]. The main vegetation types, ranging from upland to low marshland, are mesophytes, emergent plants, hygrophytes, and submerged plants (Figure 1B, Table 1). The Artemisia capillaris community is distributed in the high upland areas (17–18.5 m) and is generally flooded for less than one week during a normal year [20,23]. The Phragmites australis and Carex cinerascens communities are successively distributed in the middle (15–16 m) to low (12–14 m) wetland, and are usually inundated for one or two months, respectively [20,23]. Correspondingly, there is a single growing season (March to October) for plants in the A. capillaries community, and two growing seasons (March to May and September to November) for plants in the P. australis and C. cinerascens communities [23].
In this study, a typical wetland section in PLNNR was selected to investigate the mechanism of soil water movement (Figure 1B). The section is partially flooded in June and completely exposed after September. Three dominant vegetation communities, A. capillaries, P. australis, and C. cinerascens communities, are distributed from the uplands to the lakeshore. Field investigations revealed that the A. capillaries community had significantly lower vegetation coverage compared to the P. australis and C. cinerascens communities (Table 2). Additionally, the soil texture changed from coarse to fine as the wetland elevation decreased. It mainly consisted of sand in the A. capillaries community and silt in the P. australis and C. cinerascens communities. Further details of the study site are listed in Table 2.

2.2. Source of Hydrological Data

The daily lake water level data were collected from the Xingzi hydrological station (Figure 1A). The groundwater level data were obtained from three groundwater wells established in the A. capillaries, P. australis, and C. cinerascens communities (Figure 1B). The wells were monitored 15 m below the soil surface to ensure that groundwater could permeate into the wells even during the driest periods. The groundwater level was measured daily using water pressure sensors (DQC001, LSI-LASTEM) installed inside each well. Daily precipitation and temperature data were collected from the Wucheng meteorological station (Figure 1A).

2.3. Field Sampling and Laboratory Testing

In the study area, three sample sites (30 m × 30 m) were set up in each community of the A. capillaries, P. australis, and C. cinerascens. The three sample sites in each community were horizontally arranged at intervals of 15 m. During each sampling event, one sampling plot (1 m × 1 m) was randomly selected within each sample site. Soil samples were collected monthly from 18 April to 23 October 2018. The sampling depths and intervals were mainly determined by the root distribution of dominant plants. Field investigations have revealed that the roots of A. capillaries and P. australis communities can extend as deep as 80 cm below the soil surface. Additionally, approximately 50% of the fibrous roots are concentrated in the upper 15 cm [24]. The root depth of C. cinerascens is mainly 40 cm [8,26]. Hence, soil samples were taken from the 0–15 cm, 15–40 cm, 40–60 cm, and 60–80 cm soil layers in each sampling plot. The collected soil samples were divided into two parts. One part was placed into 8 mL screw cap glass bottles and stored at −10 °C for soil water isotopic analysis. The other was placed in aluminum boxes to measure gravimetric water content through oven drying.
Rainfall samples were collected on an event basis from April to October 2018 at Wucheng meteorological station (Figure 1A). A total of 34 rainwater samples were collected immediately after rainfall and stored in 50 mL plastic bottles. Groundwater, river water, and lake water were also sampled monthly during this period. Groundwater samples were obtained from three monitoring wells using a vacuum lifting device. However, due to inundation, the groundwater samples of the C. cinerascens community in June to August and the P. australis community in July were not collected. Water samples were collected from Poyang Lake and Gan River with three replications at a depth of 0.5 m below the water surface, and then mixed as a composite sample. All samples were stored in 50 mL polyethylene bottles, sealed with Parafilm, and refrigerated at 4 °C.
Water in soil samples was extracted using the Li-2100 automatic vacuum condensation extraction system, which has an extraction efficiency of over 98%. The stable isotopes (δ18O and δD) of all water samples were analyzed using an Isotope Ratio Mass Spectrometer system coupled with an elemental analyzer (MAT253, Flash 2000HT, Thermo Fisher Scientific, Inc., Waltham, MA, USA) in the Stable Isotope Laboratory, State Key Laboratory of Lake Science and Environment, Chinese Academy of Sciences. The measurement precision was ±0.2‰ for δ18O and ±2‰ for δD. The results are expressed as δ values relative to the Vienna Standard Mean Ocean Water (VSMOW), given by the following equation:
δ sample = R sample R VSMOW R VSMOW × 1000
where R represents the isotopic ratio (D/H or 18O/16O) in sampled water (Rsample) or VSMOW (RVSMOW), respectively.

2.4. Line-Conditioned Excess Calculation

The line-conditioned excess (lc-excess) for all soil and water samples was calculated using the following equation [31]:
l c - e x c e s s = δ D ( a × δ 18 O + b )
where a and b are the slope and intercept of the local meteoric water line (LMWL), respectively. The lc-excess describes the deviation of a water sample from the LMWL in the dual-isotope space, and is used to infer the evaporation degree of different water bodies relative to the local rainfall input [5]. The average lc-excess value for rainfall was approximately 0‰. Negative lc-excess values indicated isotopic enrichment of water samples due to evaporative fractionation, with smaller lc-excess values indicating greater degrees of evaporation [6].

2.5. Calculation of Water Supply Ratio

It should be noted that the sampling sites are located approximately 300 m away from the Gan River, and the riverbank has a high elevation. Thus, direct recharge of the wetland soil water from the river is not possible. The lake water only serves as a direct water source for the root-zone soil during high-water periods, as the wetland is completely exposed in other periods when the lake water level is relatively low. Consequently, the monthly mean δ18O of soil water, groundwater, and rainfall were used to estimate the contribution ratios of different water sources to root-zone soil water.
According to the law of isotope mass conservation, an end-member mixture model can be applied to determine the proportions of water supply between rainfall, soil water, and groundwater by comparing the water isotopes of different water bodies. If rainfall and capillary rise from groundwater are the recharge sources and the root-zone soil water is the mixed pool, then the following linear algebraic equation can be used [32,33]:
C ( V A + V B ) = A × V A + B × V B
C = A × V A / ( V A + V B ) + B × V B / ( V A + V B ) = A × ( 1 x ) + B × x
where A, B, and C are the stable isotope values (‰) of rainfall, groundwater, and root-zone soil water, respectively. VA is the amount of rainfall, VB is the amount of groundwater, x is the recharge ratio of groundwater, and (1 − x) is the recharge proportion of rainfall. The recharge ratio can be calculated as follows:
x = ( C B ) / ( A B )

2.6. Statistical Analysis

All statistical analyses were conducted using the SPSS 17.0. One-way ANOVA was used to evaluate differences (α = 0.05) in variables (soil water content, SWC, δ18O, δD, and lc-excess) among different vegetation types and water bodies. Repeated measures ANOVA was used to analyze changes in SWC and δ values at different depths across various months, as well as their interaction effects. If the interaction effect was not significant, further analysis was conducted through main effects followed by the LSD test (p < 0.05). The data successfully passed normality testing and Mauchly’s test of sphericity (p > 0.05).

3. Results

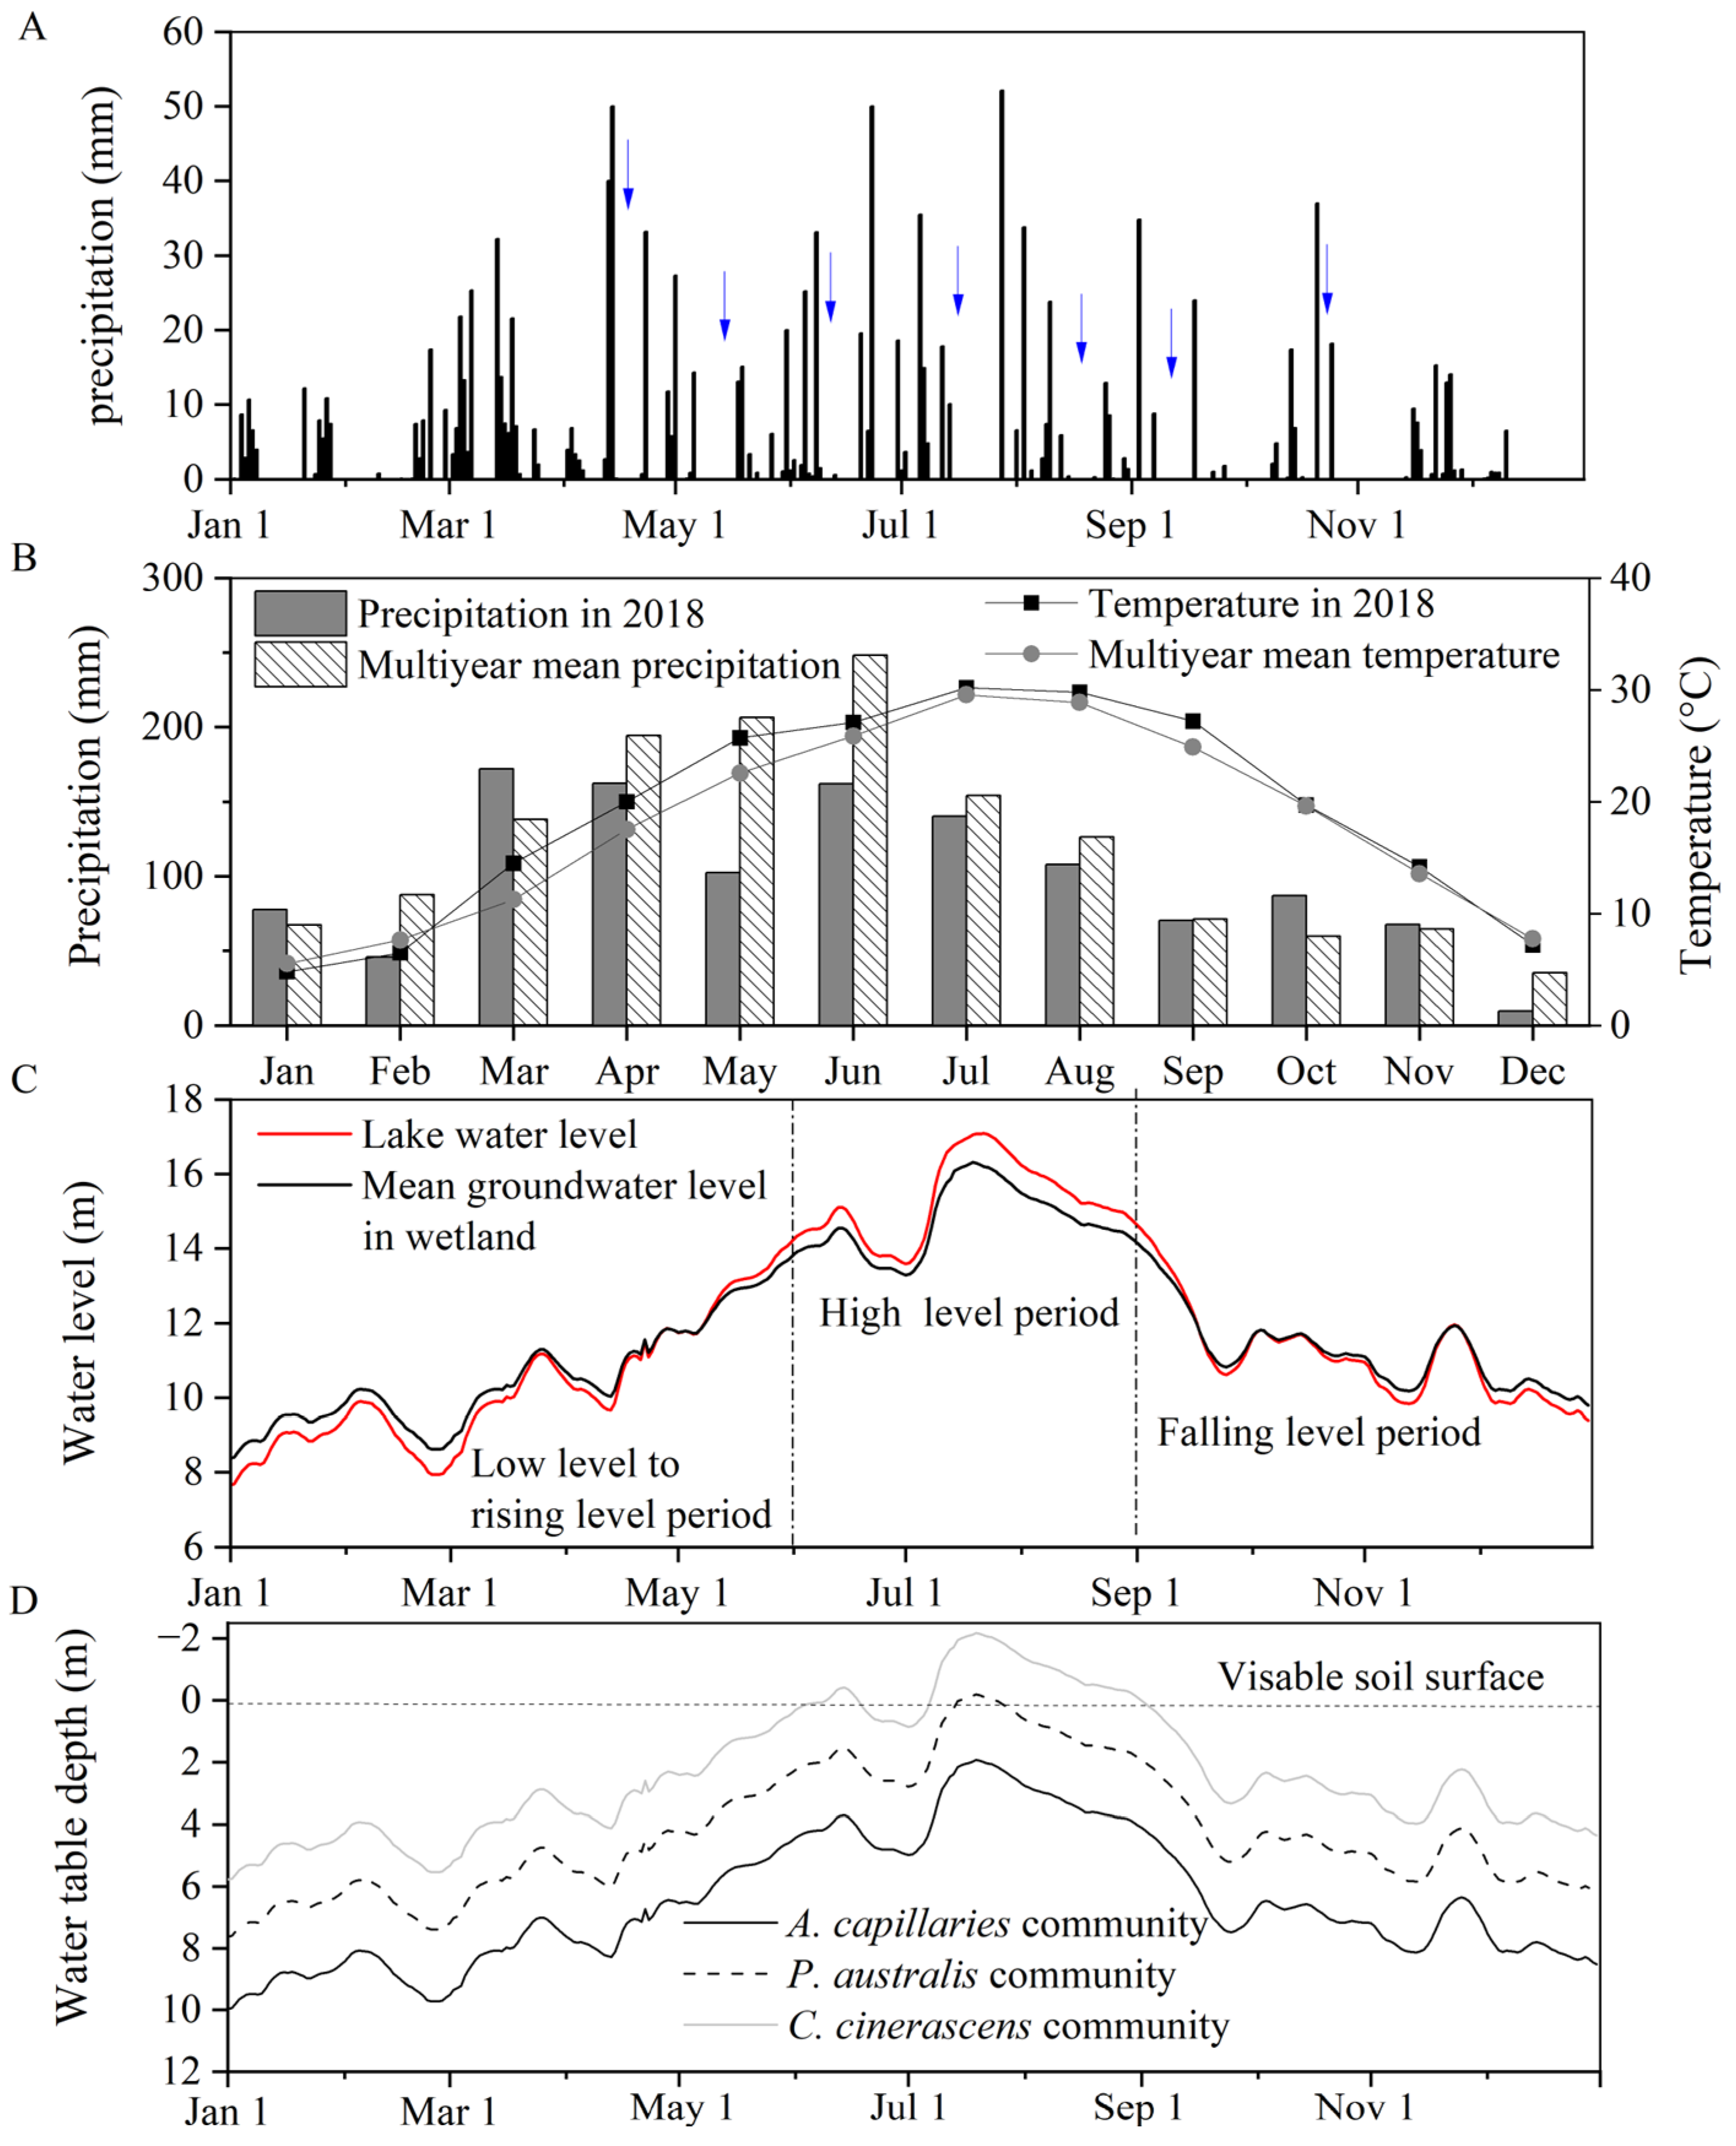
3.1. Characteristics of Hydrometeorological Parameters

In 2018, the precipitation amounted to 1204 mm and was unevenly distributed (Figure 2A). During the rainy season (March to June), the cumulative precipitation accounted for 50% of the annual amount, with rainfall notably decreasing during the drought season (July to October). The distribution of rainfall in 2018 has some differences compared to the multiyear annual average (Figure 2B). The total precipitation in 2018 was 17% lower than the multiyear annual average (1454 mm), indicating a dry year. Particularly, the rainfall during the rainy season (599 mm) was 24% below the average for the same period. Additionally, the monthly air temperature variation in 2018 followed the long-term annual average with a peak in July (Figure 2B). However, the average temperature in 2018 was slightly higher than the annual average, indicating stronger evaporation. Therefore, the findings of this study primarily reflect the characteristics of wetland water movement and recharge processes in drought years rather than normal years.
The lake water level fluctuated between 7.66 m and 17.09 m in 2018 (Figure 2C). The groundwater level in the wetland varied synchronously with the lake level, rising from March to June and declining from September onwards. It is evident that the wetland groundwater is hydrologically connected with the lake water. A noticeable gradient in water-table depth was observed along the wetland section (Figure 2D). The groundwater depth was consistently highest in the A. capillaries community (ranging from 1.93 to 9.97 m), intermediate in the P. australis community (0 to 7.63 m), and lowest in the C. cinerascens community (0 to 5.77 m), with mean depths of 6.47, 4.23, and 2.33 m, respectively (Figure 2D). The maximum amplitude of groundwater depth was approximately 8.0 m. The groundwater table was aboveground in July in the P. australis community and from June to August in the C. cinerascens community.
The SWC ranged from 2.9% to 12.6% in the A. capillaries community, while it ranged from 25.4% to 29.8% in the P. australis community and from 25.2% to 30.2% in the C. cinerascens community (Figure 3). It was significantly lower in the A. capillaries community compared to the P. australis and C. cinerascens communities (p < 0.01), with no significant differences found between the latter two (p = 0.62). Additionally, the SWC in the three vegetation communities varied across different months and soil depths. In the A. capillaries community, the SWC was significantly different among months (F = 35.2, p < 0.001, partial η2 = 0.53), with higher values during April–June (10.9–12.6%) compared to during July–October (2.9–7.6%, Figure 3A). Moreover, the main effect of depth on SWC was also significant (F = 6.55, p = 0.015, partial η2 = 0.71), as well as its interaction with time (F = 3.38, p < 0.001, partial η2 = 0.56). Consequently, the SWC was uniform among depths in April, June, September, and October, while it significantly increased with depths in May, July, and August. However, the SWC in the P. australis community remained stable, with no significant differences found among months (F = 1.42, p = 0.26, partial η2 = 0.26), depths (F = 1.95, p = 0.13, partial η2 = 0.80), and their interaction (F = 1.49, p = 0.20, partial η2 = 0.53) (Figure 3B). In contrast, the SWC in the C. cinerascens community showed significant differences among months (F = 4.85, p = 0.01, partial η2 = 0.38), with noticeably higher values in May than in other months (Figure 3C). The SWC at different depths also showed significant differences (F = 22.9, p < 0.001, partial η2 = 0.89), as the values at 15 cm (average: 34%) were significantly greater than those at 40–80 cm (average: 24–27%). However, the interaction effect of month and depth on SWC was not significant (F = 2.18, p = 0.06, partial η2 = 0.45).

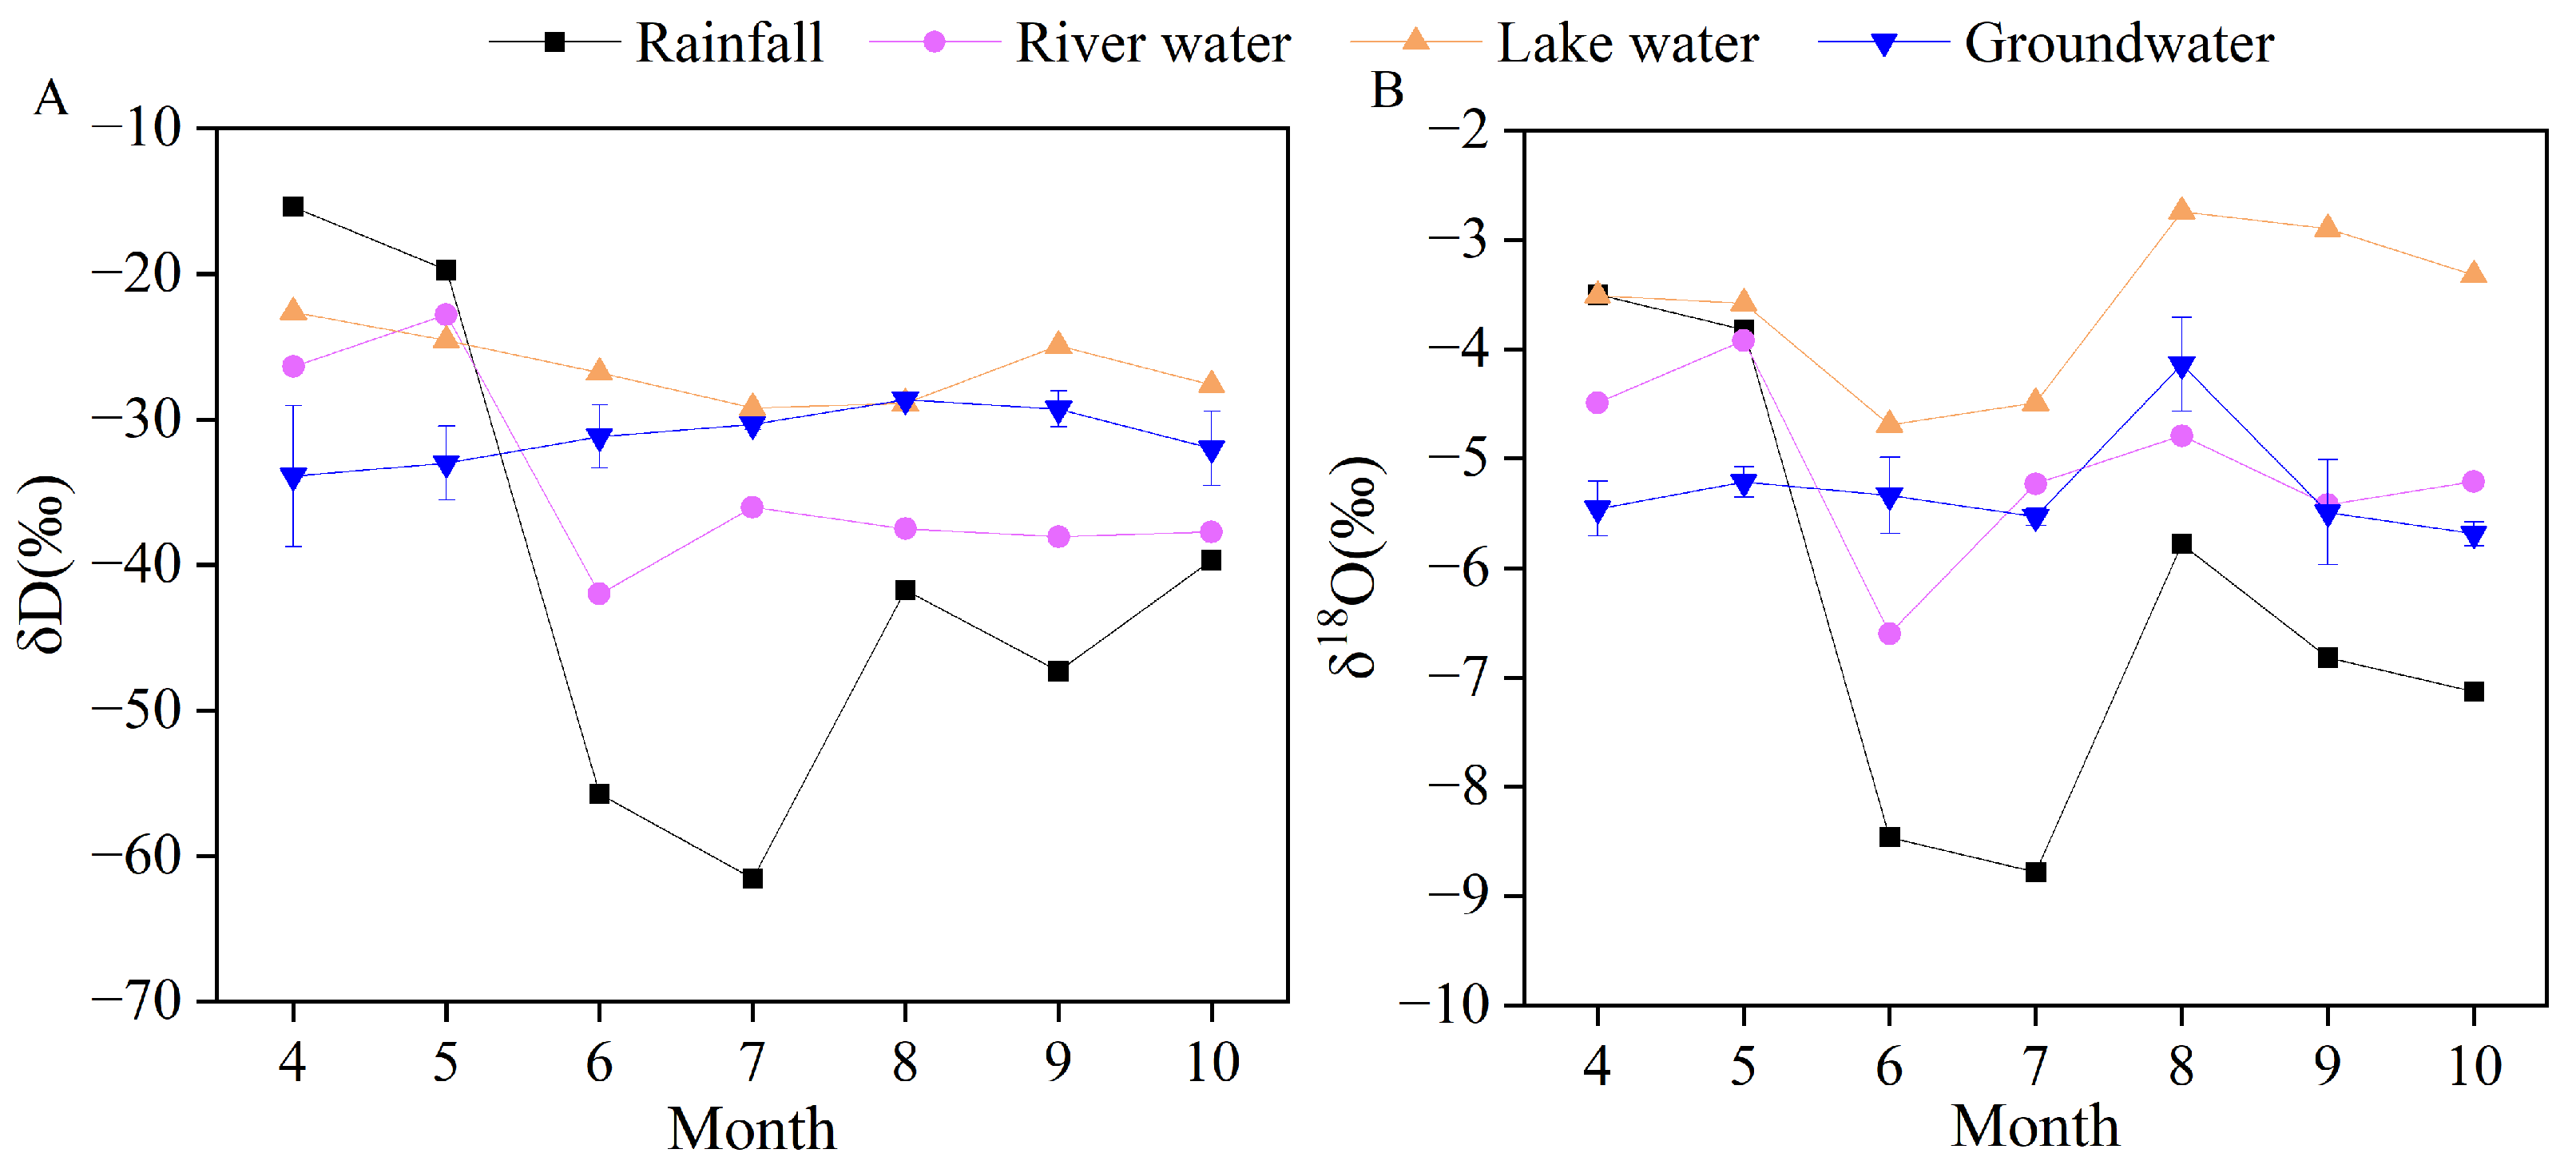
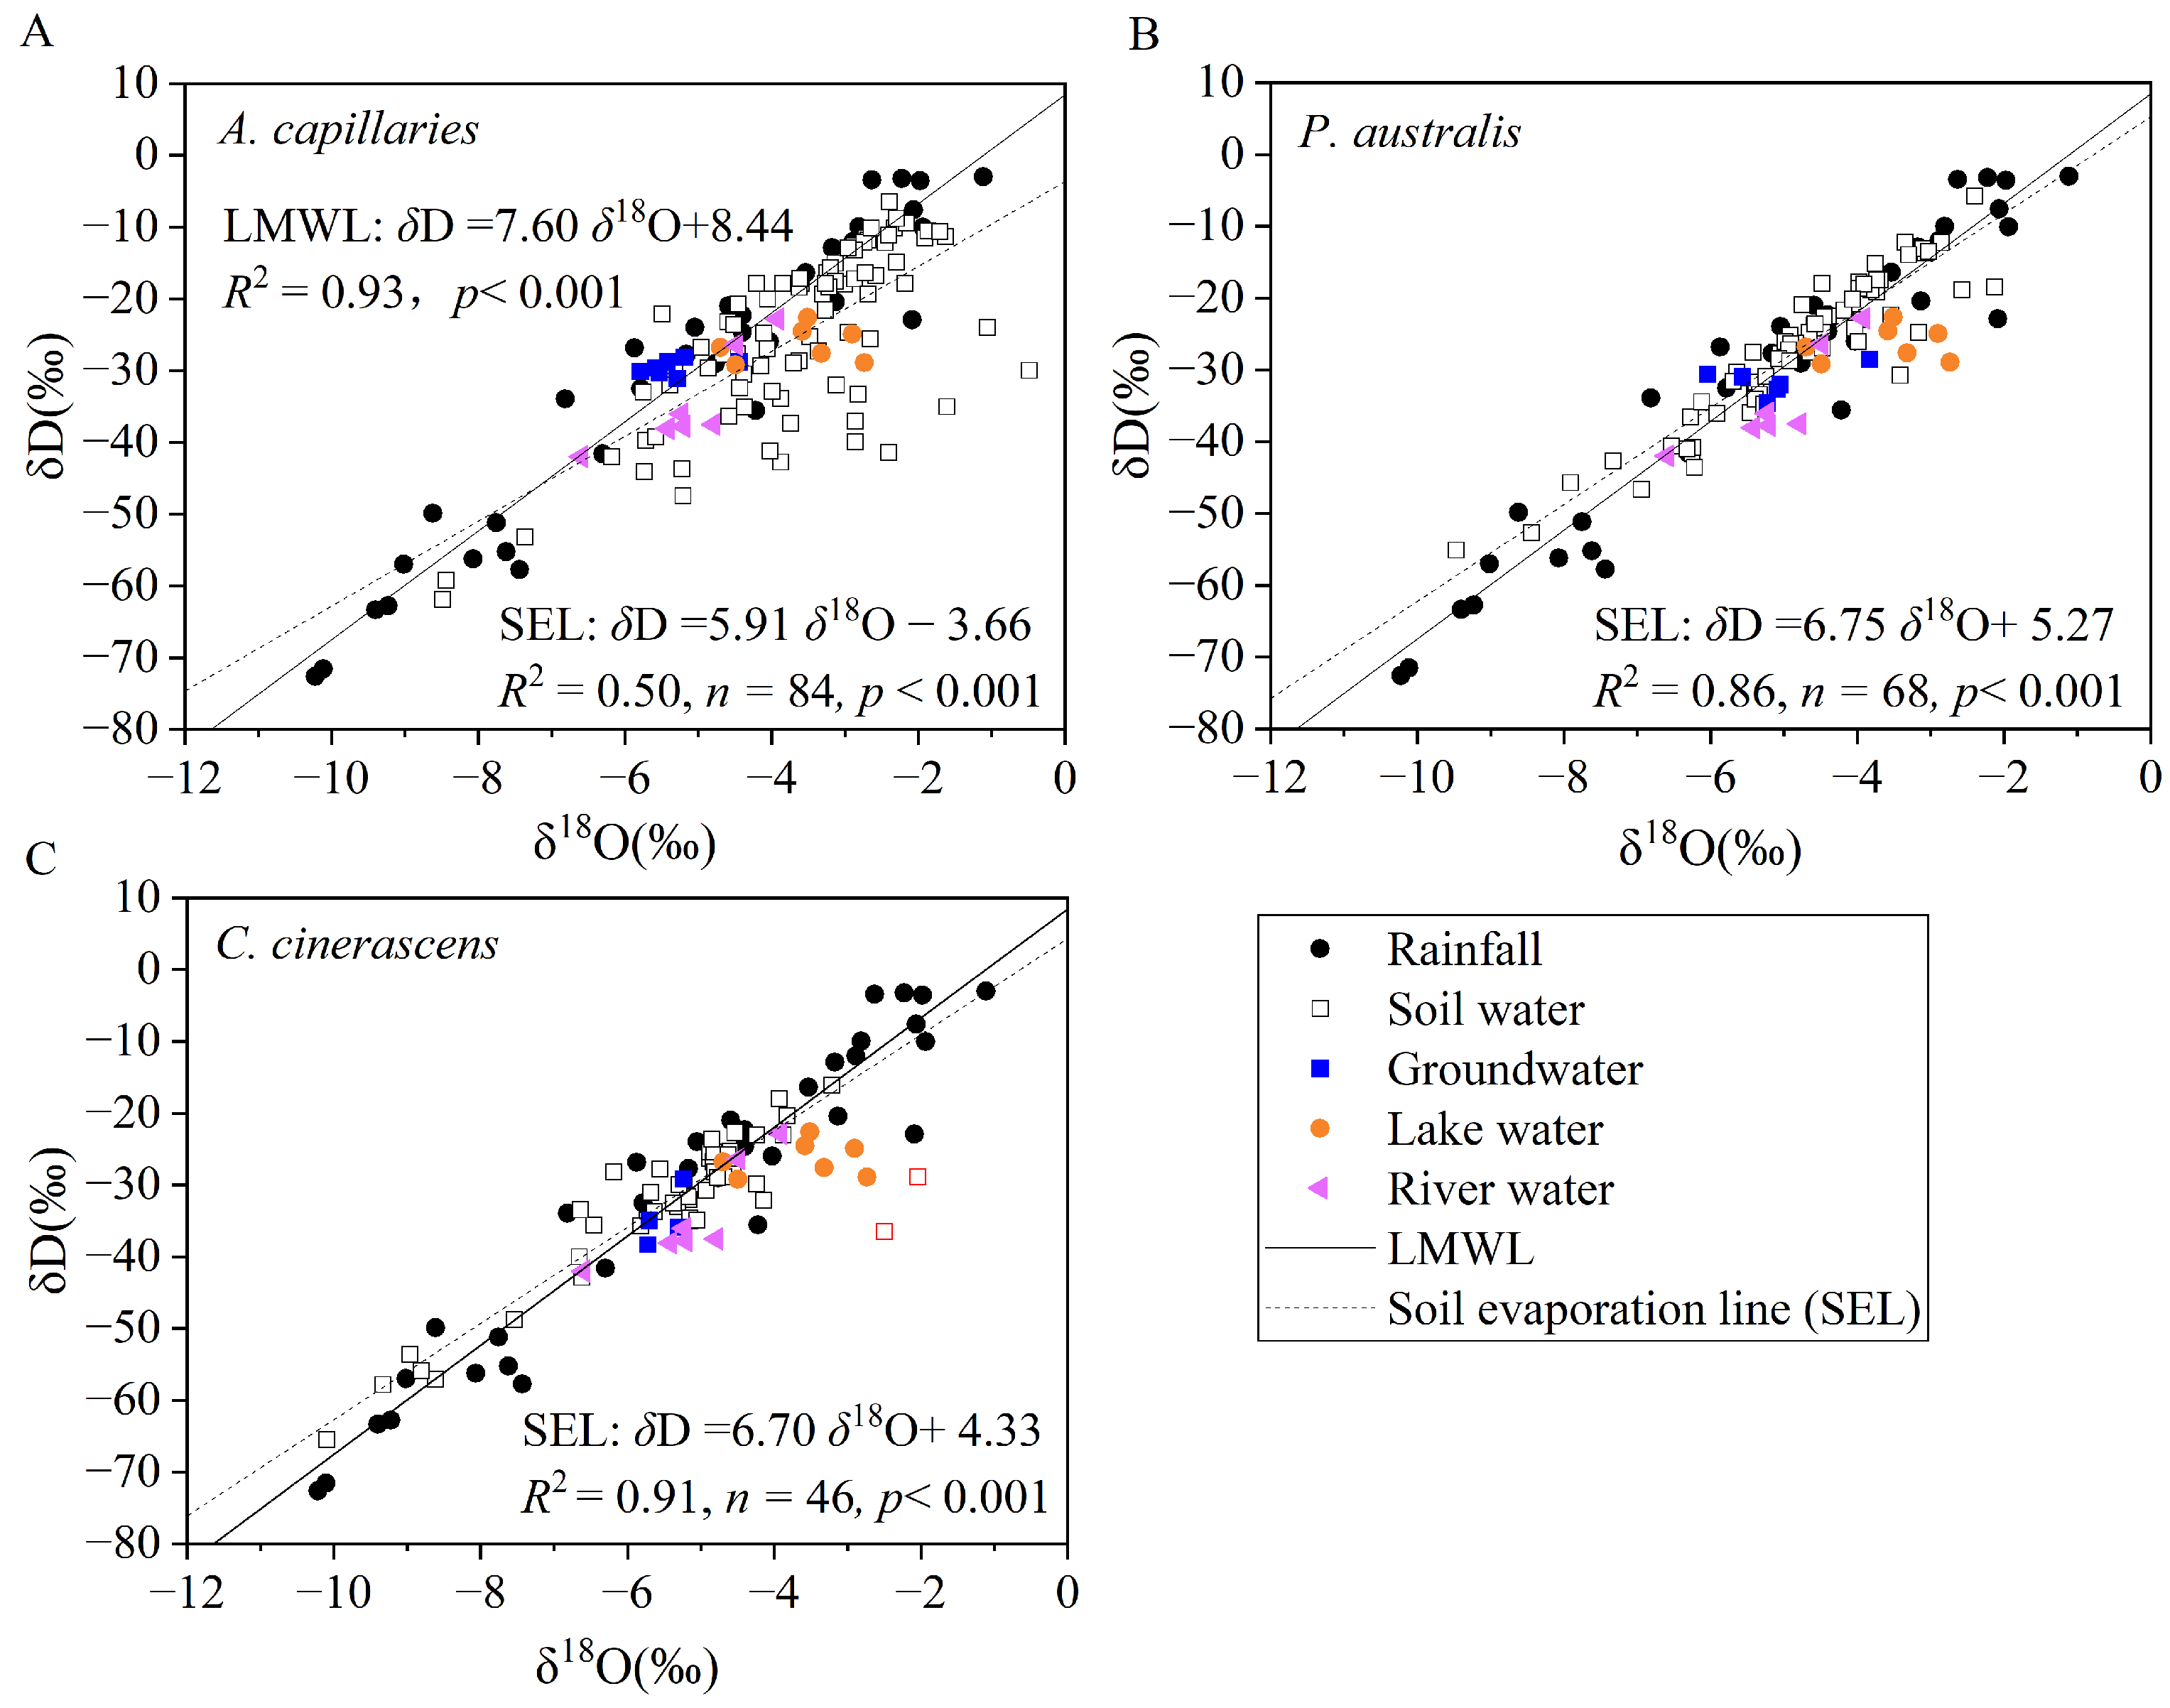
3.2. Isotopic Compositions of Different Water Sources

The isotopic composition of precipitation exhibited significant fluctuations throughout the sampling period (Figure 4). The δ18O and δD values of precipitation ranged from −10.2‰ to −1.1‰ and from −72.9‰ to −3.0‰, respectively, with weighted average values of −6.3‰ and −39.4‰. The δ18O and δD values were most enriched in April and May but noticeably depleted in June and July, gradually increasing between August and October (Figure 5). This seasonal variation is consistent with the isotopic characteristics of precipitation in southern China [29]. The local meteoric water line (LMWL) was expressed as δD = 7.60 × δ18O + 8.44 (R2 = 0.93, n = 34) (Figure 6). The slope of the LMWL was lower than that of the global meteoric water line (GMWL: δD = 8 × δ18O + 10), indicating that the rainfall processes in the region were affected by evaporation fractionation [5,11].
The δ18O and δD values of river water ranged from −6.60‰ to −3.92‰ and from −42.0‰ to −22.8‰, respectively, with mean values of −5.09‰ and −34.4‰ (Figure 4). The seasonal variations in the isotopes of river water were consistent with those of precipitation (Figure 5), but showed smaller ranges of variation. The lake water was the most enriched in heavy isotopes, with values varying from −4.69‰ to −2.74‰ for δ18O and from −29.2‰ to −22.6‰ for δD. Both the river and lake water samples fell below the LMWL (Figure 6) and displayed negative lc-excess values (Figure 4C), suggesting that they originated from precipitation but underwent evaporation, especially the lake water. In comparison to surface water samples, the groundwater isotopes were noticeably depleted and less variable. The δ18O ranged between −5.69‰ and −4.14‰, with a mean of −5.30‰. The δD values ranged between −33.9‰ and −28.6‰, with a mean of −31.4‰. Groundwater samples were distributed above or slightly below the LMWL, and the average groundwater lc-excess was close to 0‰ (Figure 4C), indicating that wetland groundwater is meteoric in origin and minimally affected by evaporation.

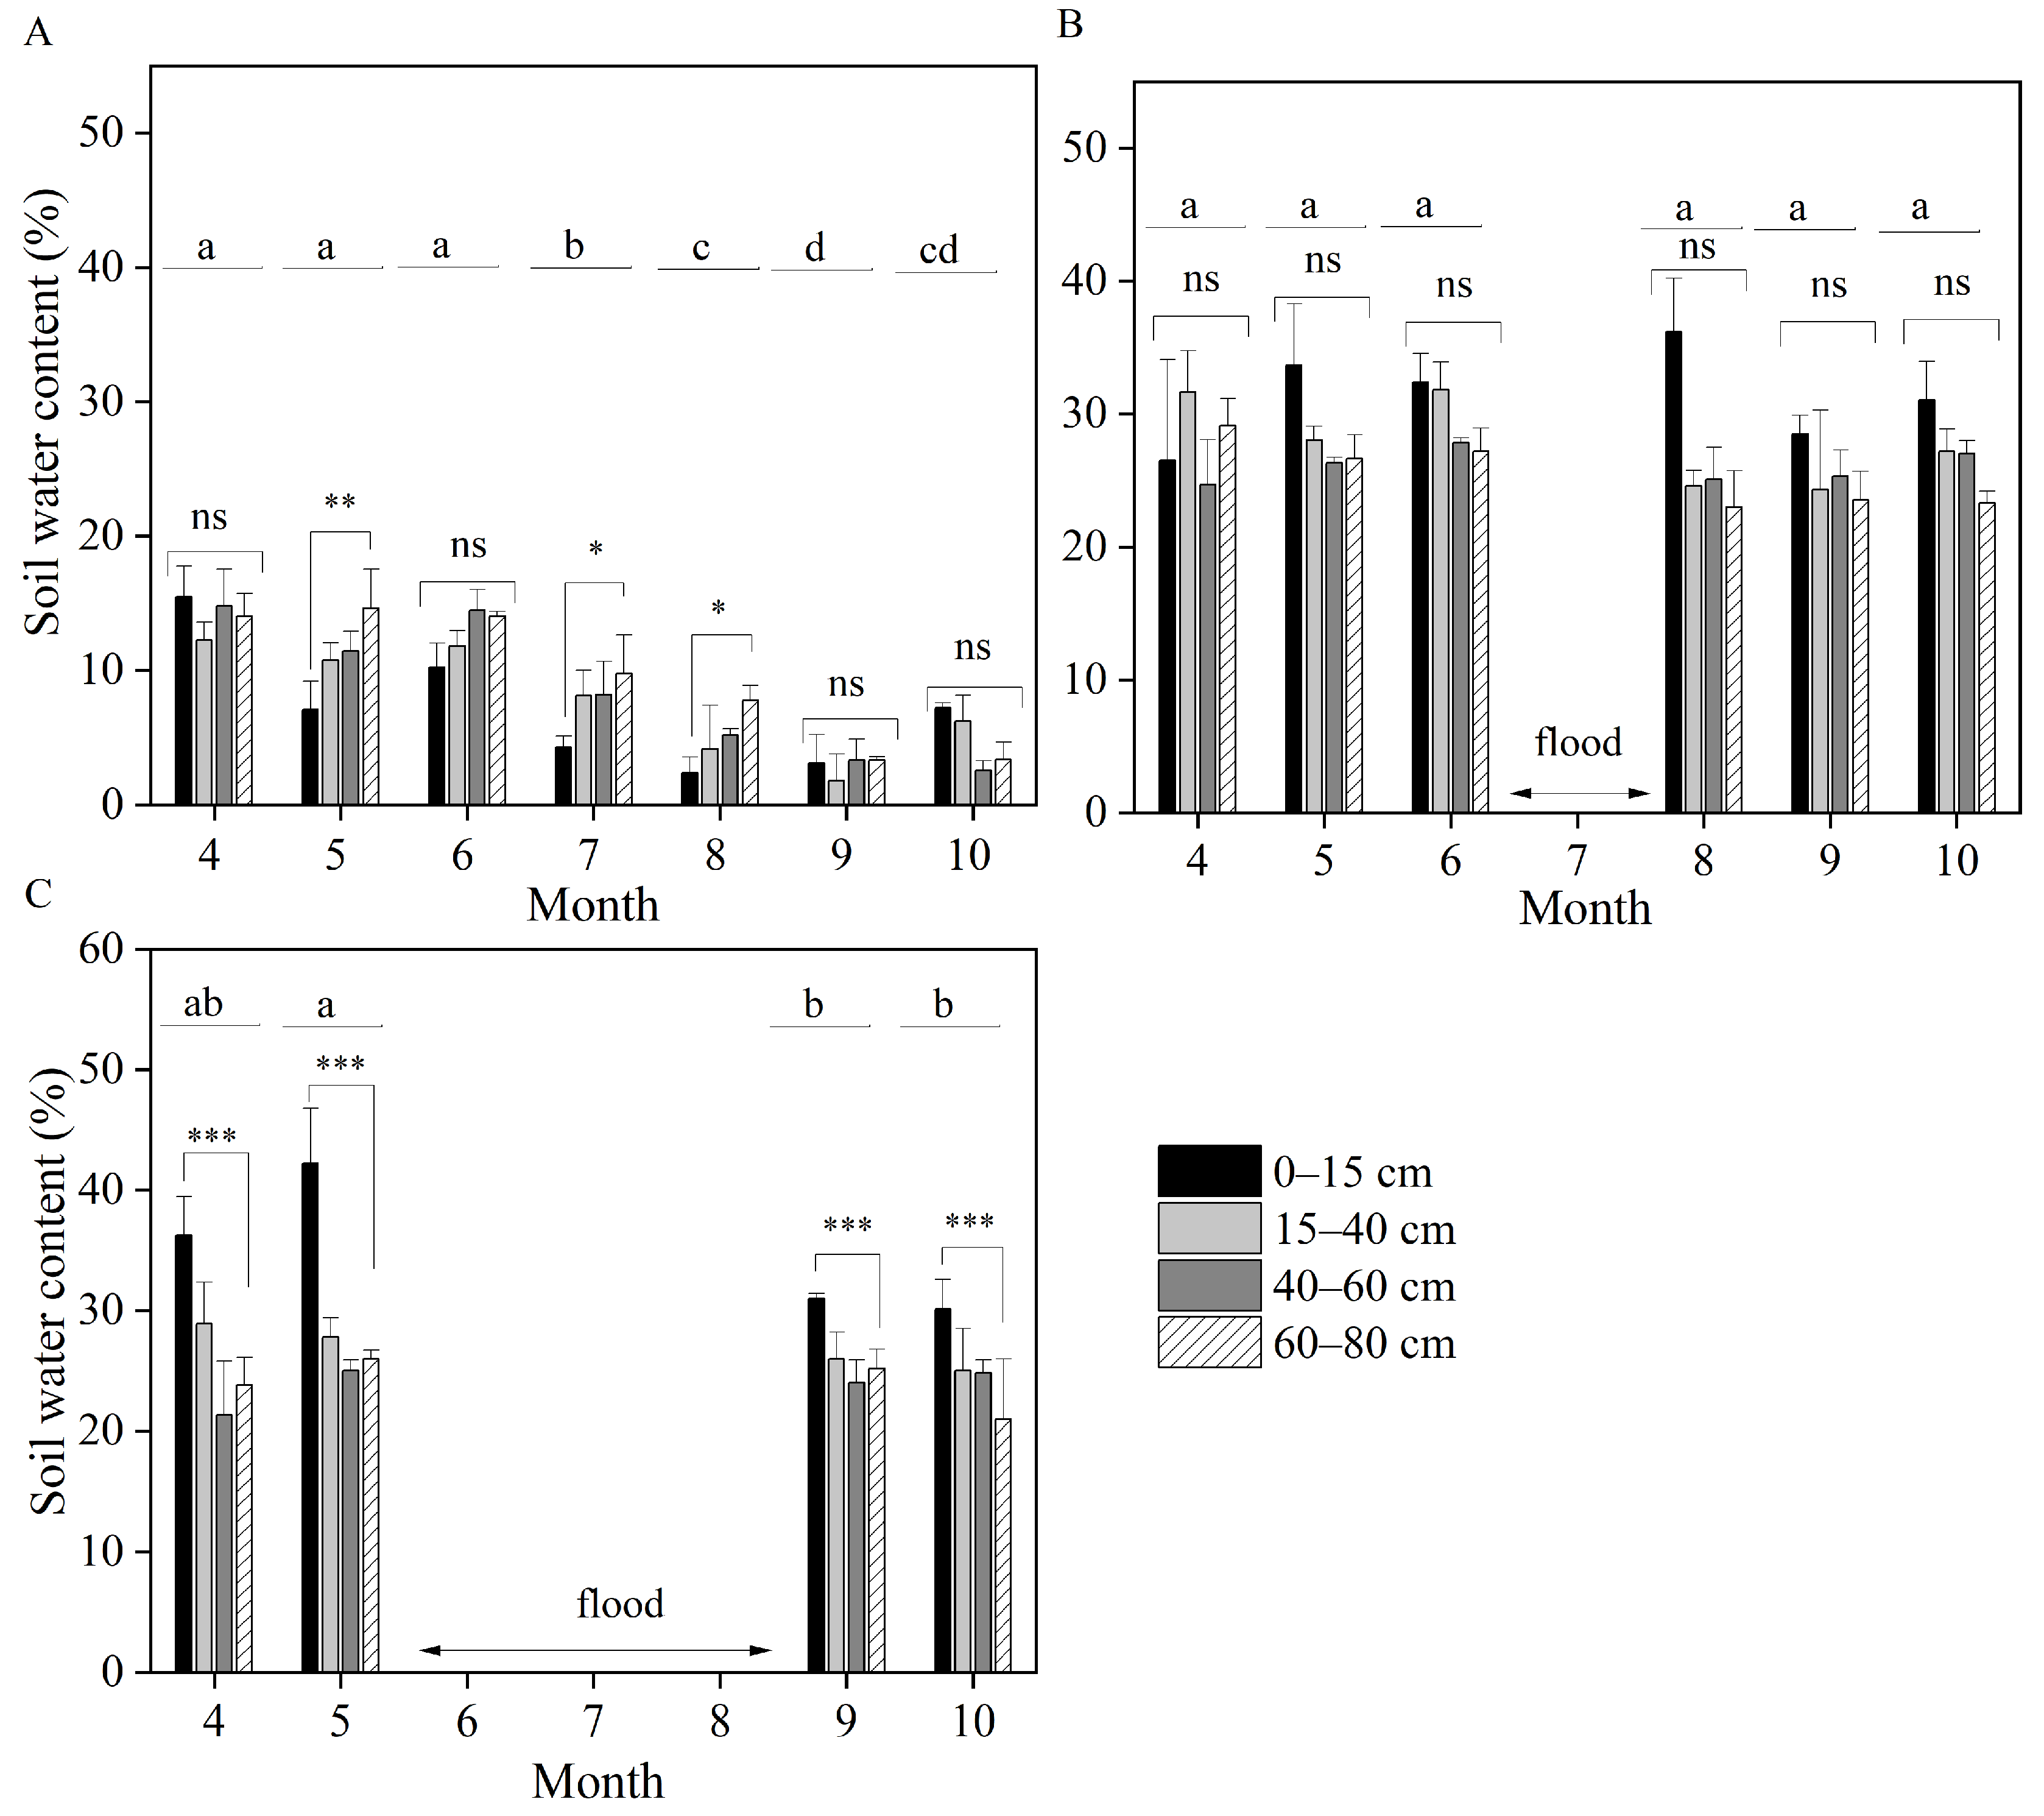
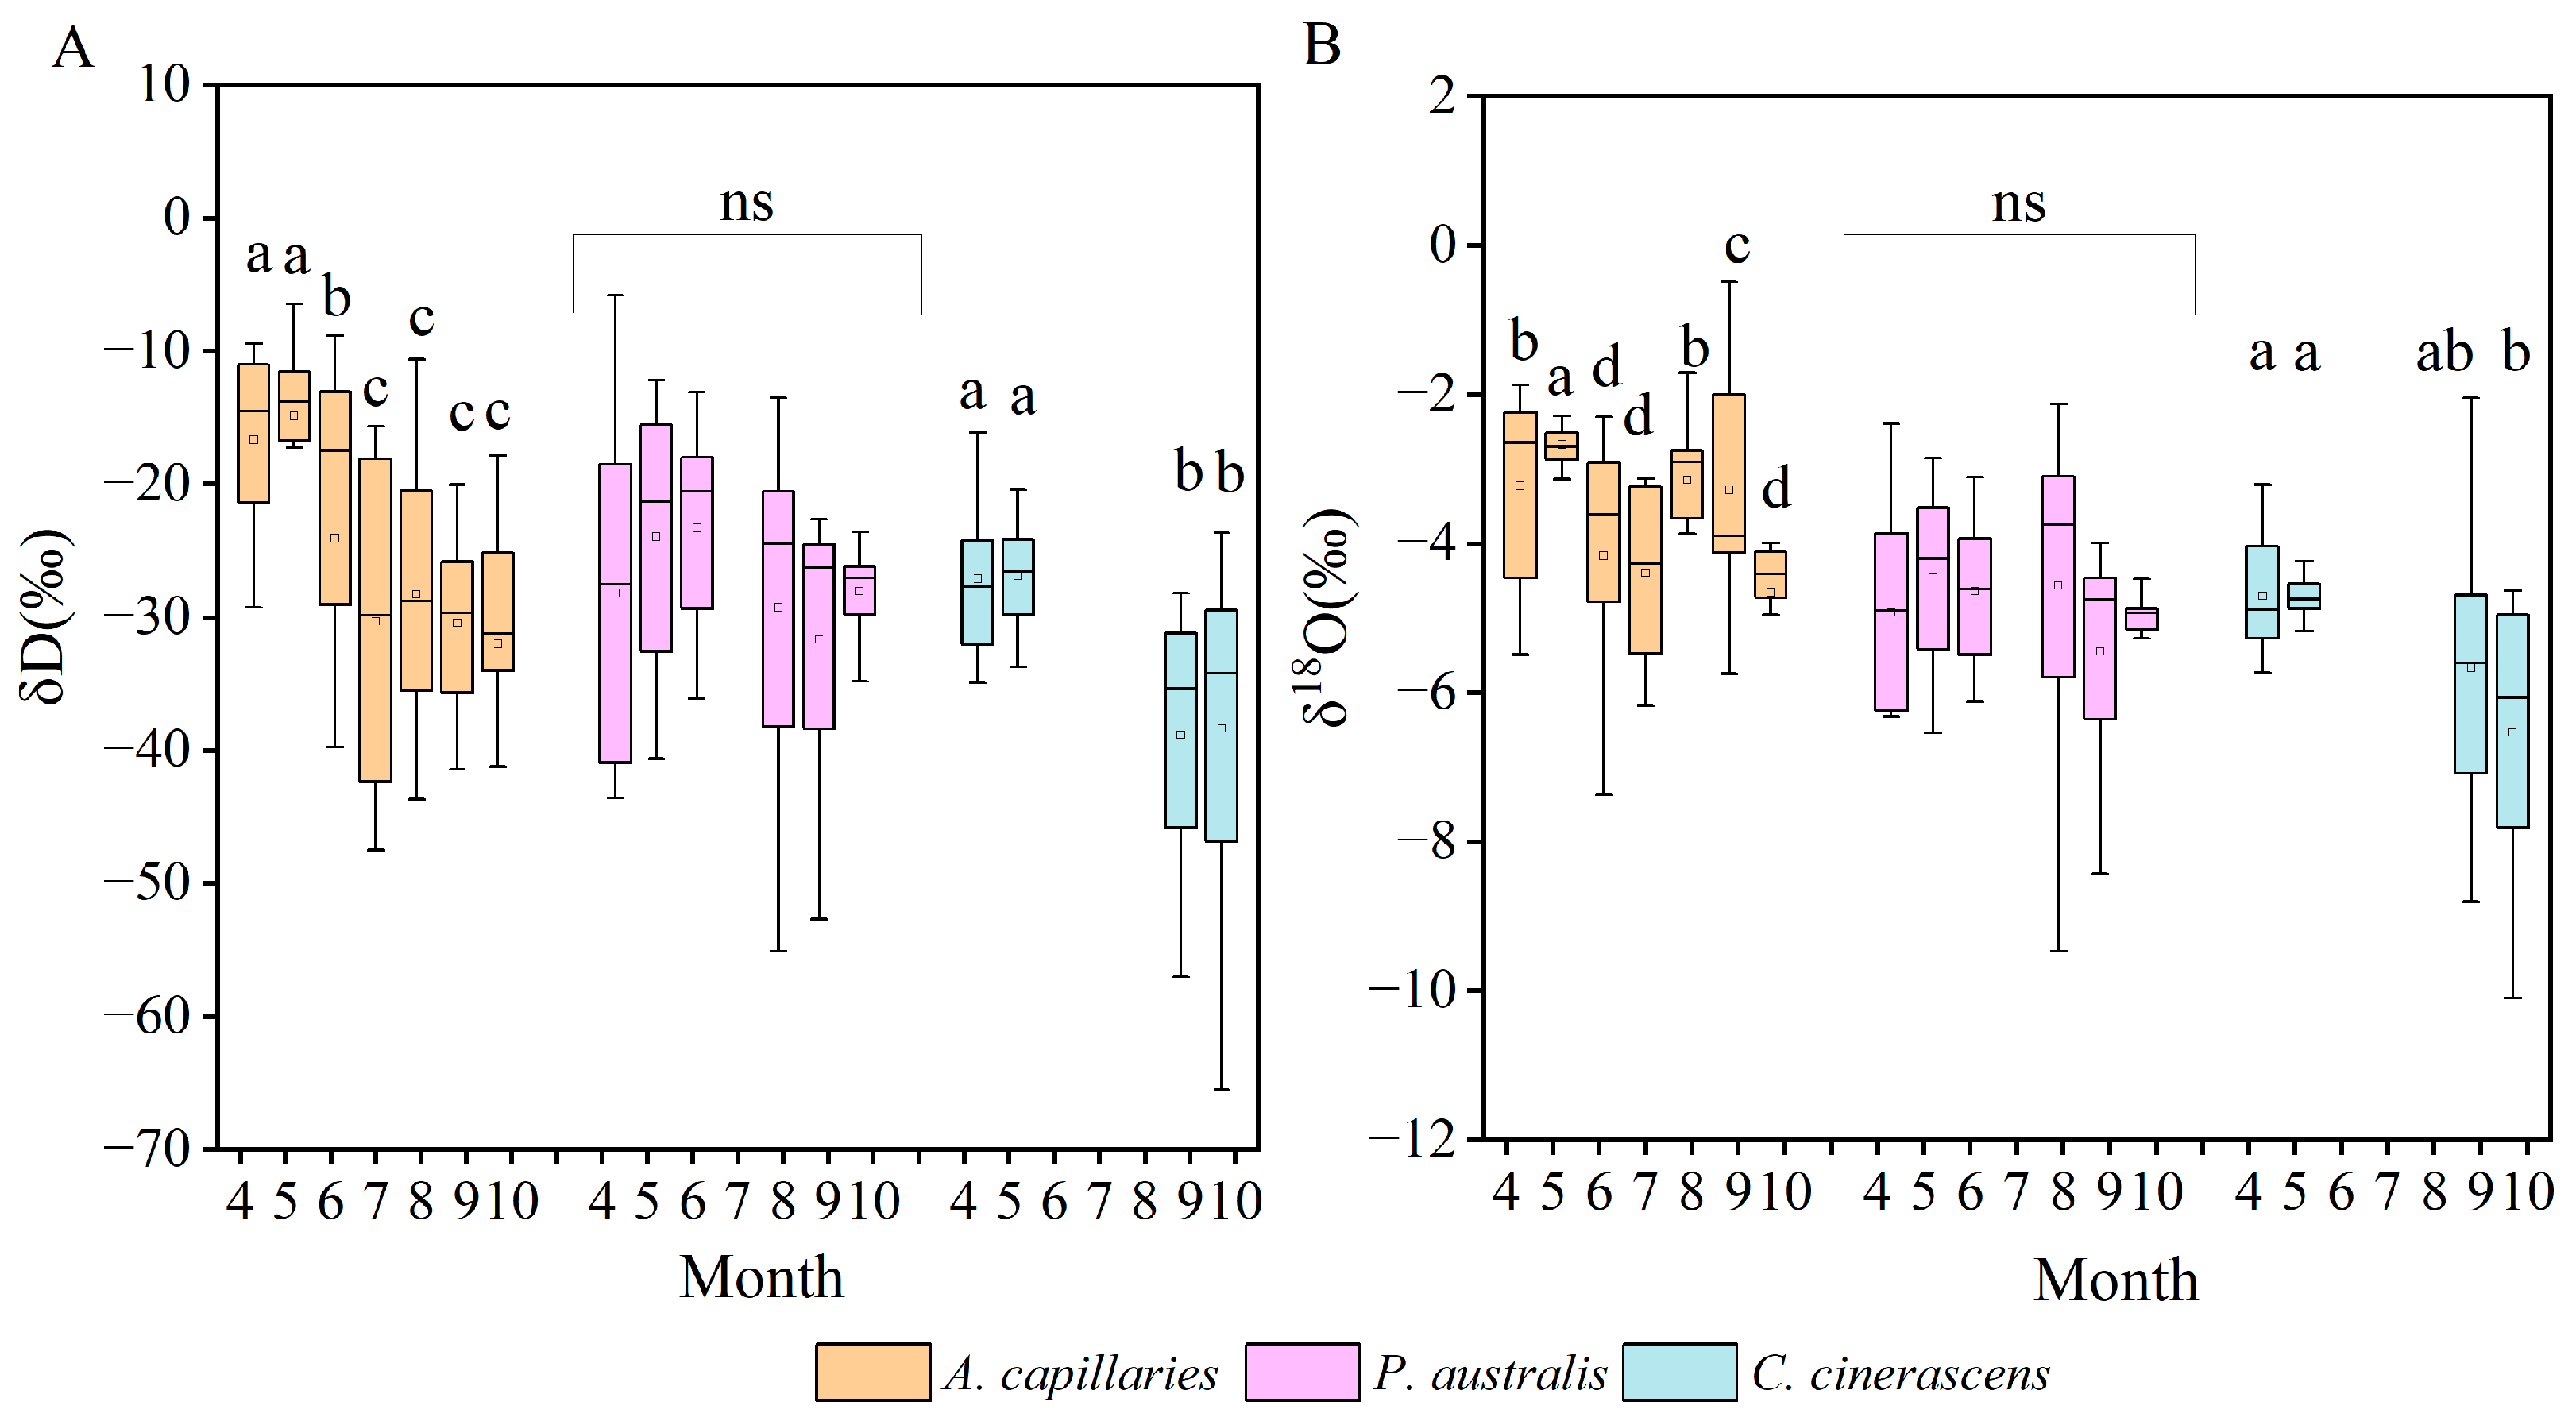
3.3. Isotopic Compositions of Root-Zone Soil Water

The isotopic composition of the soil water ranged from −10.1‰ to −0.5‰ for δ18O and from −65.5‰ to −6.5‰ for δD (Figure 4). The average δ18O (δD) values were −3.66 ± 1.45‰ (−25.4 ± 12.1‰) for the A. capillaries site, −4.80 ± 1.39‰ (−27.2 ± 10.1‰) for the P. australis site, and −5.41 ± 1.64‰ (−32.8 ± 10.6‰) for the C. cinerascens site. The soil water δ18O was significantly enriched in the A. capillaries community compared to that of the P. australis and C. cinerascens communities (p < 0.01). Most samples from the A. capillaries community were distributed below the LMWL, with a lower slope of 5.91 on the soil evaporation line (SEL, Figure 6A). In contrast, the soil water samples from the P. australis and C. cinerascens communities were plotted around the LMWL (Figure 6B,C), with SEL slopes of 6.71 and 6.70, respectively.
The soil water isotopes in the three sites showed different seasonal variations (Figure 7). In the A. capillaries community, there were remarkable monthly differences in the soil water isotopes (δ18O: F = 13.34, p < 0.001, partial η2 = 0.63; δD: F = 14.25, p < 0.001, partial η2 = 0.64). The δD values of soil water decreased from higher values in April and May to lower values from July to October. However, the soil water isotopes in the P. australis community showed relatively small fluctuations with no significant monthly variations (δ18O: F = 8.89, p = 0.45, partial η2 = 1.81; δD: F = 2.26, p = 0.17, partial η2 = 0.36). The soil water isotopes in the C. cinerascens community displayed higher values in spring compared to autumn (δ18O: F = 4.53, p = 0.01, partial η2 = 0.36; δD: F = 6.42, p = 0.01, partial η2 = 0.45).
The soil water isotopes of the three vegetation types showed different patterns of variation with depth (Figure 8). In the A. capillaries community, the mean δ18O showed no significant variations among depths (Figure 8A, F = 0.08, p = 0.97, partial η2 = 0.03), while the mean δD of soil water was enriched from −32.5‰ to −20.4‰ with increasing depth. The interaction effect of depth and time on δD was significant (F = 6.14, p < 0.001, partial η2 = 0.70). In May, September, and October, the δD of soil water at different depths showed no significant differences (p > 0.05, Figure 8B). However, it decreased significantly with depth in April and June, displaying an increasing trend with depth in July and August (Figure 8B). Conversely, in the P. australis community, the interaction effect of depth and time on δ values was not significant (F = 0.61, p = 0.71, partial η2 = 0.35). The soil water isotopes became depleted with increasing depth during most sampling dates (Figure 8C,D), but did not vary significantly among depths (δ18O: F = 2.17, p = 0.23, partial η2 = 0.62; δD: F = 3.99, p = 0.11, partial η2 = 0.75). The mean δ18O (δD) values were −5.3‰ ± 1.4‰ (−30.0‰ ± 9.4‰) at 60 cm depth and −5.4‰ ± 1.4‰ (−32.1‰ ± 9.6‰) at 80 cm depth, closely matching the isotopic composition of groundwater (δ18O: −5.3‰ ± 0.5‰; δD: −31.4‰ ± 2.9‰). This suggests that the deep soil water in the P. australis community is greatly influenced by groundwater. Similarly, the soil water isotopic values of the C. cinerascens community slightly decreased with depth during most sampling periods (Figure 8E,F). However, the effect of depth and its interaction with time on δ values were not significant (F = 0.60, p = 0.63, partial η2 = 0.18; F = 1.18, p = 0.35, partial η2 = 0.31). The mean δ values of soil water among different depths resembled those of groundwater (δ18O: p = 0.64, δD: p = 0.80).

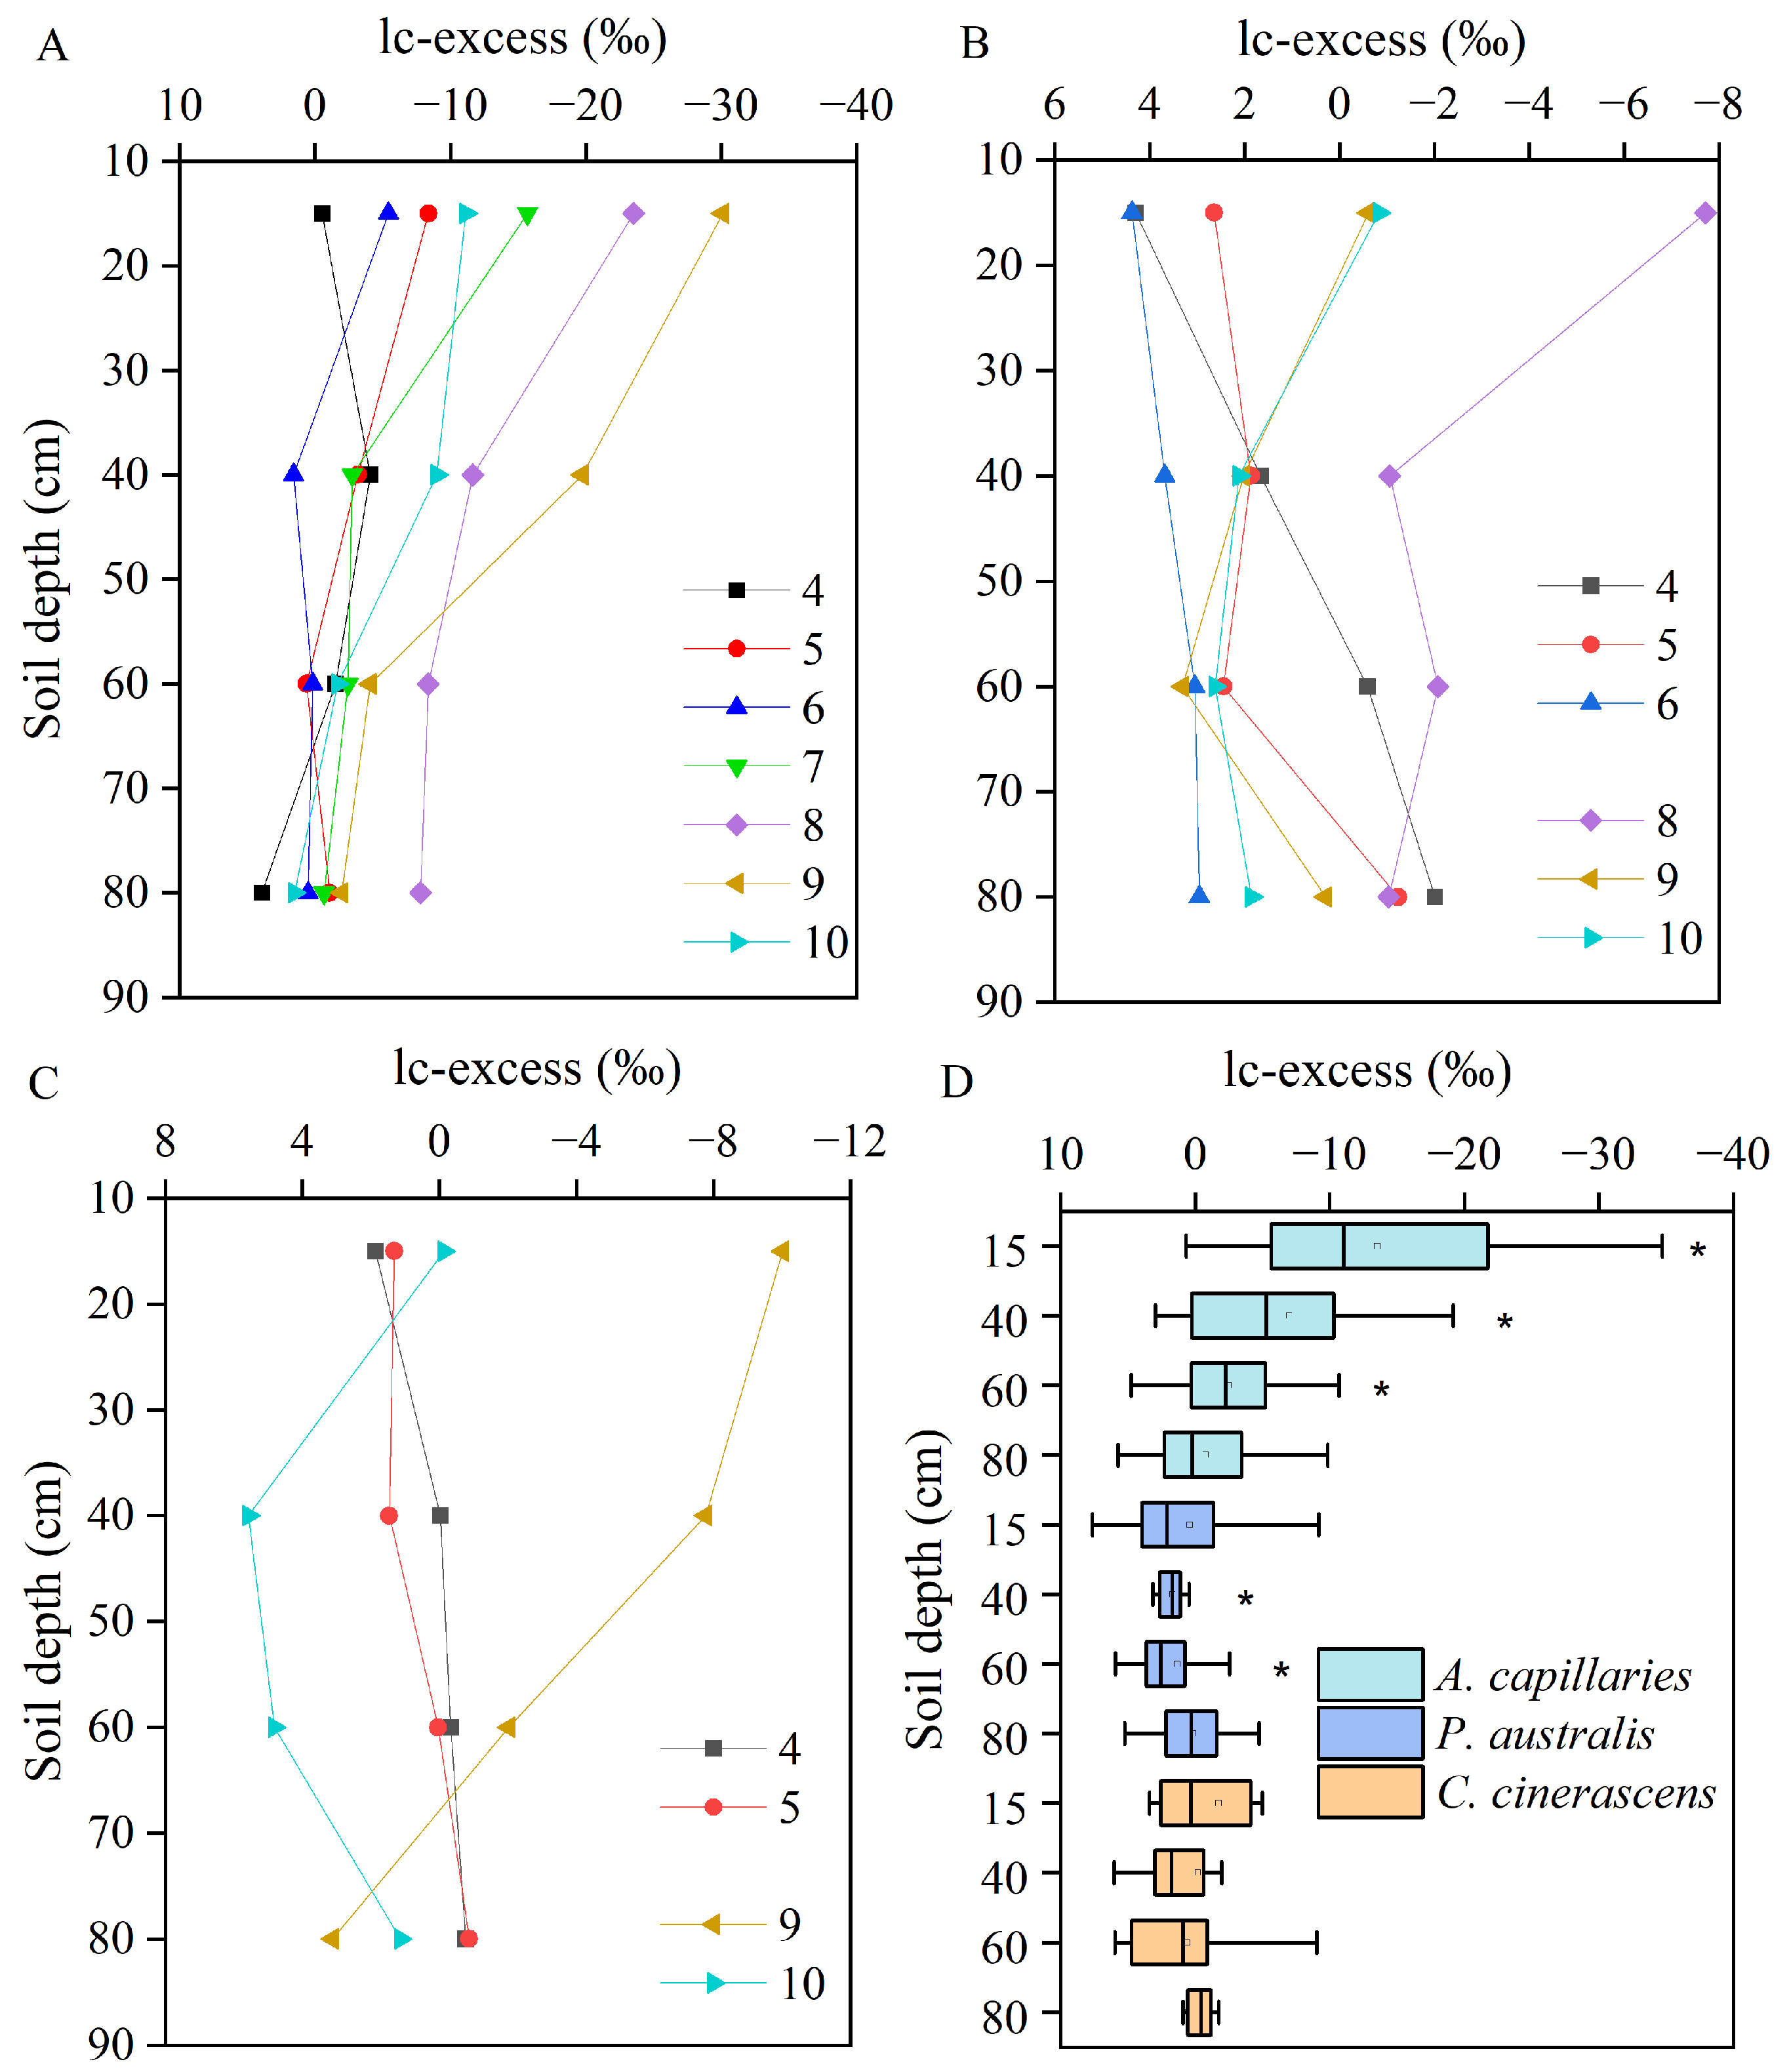
3.4. Line-Conditioned Excess of Soil Water

In this study, the lc-excess of precipitation ranged from −15.9‰ to 9.4‰, with an average of 0‰ (Figure 4C). The soil water lc-excess values were highly variable for the three vegetation types. Most negative lc-excess values were observed in the A. capillaries community (average of −5.94‰), while the values in the P. australis and C. cinerascens communities (1.29‰ and 0.23‰) were close to the value of precipitation (Figure 4C). The lc-excess of soil water for the A. capillaries community also showed temporal variation (Figure 9A), with averaged values ranging from −0.23‰ to −2.69‰ between April and June and from −4.7‰ to −13.6‰ between July and October. However, the lc-excess values for the P. australis and C. cinerascens communities were only negative in August and September, respectively (Figure 9B,C), and showed weak temporal dynamics. Moreover, the vertical profiles of the mean lc-excess values showed an increasing trend with increasing depths in the A. capillaries community (Figure 4C). The lc-excess for the upper 60 cm soil layers was significantly less than 0‰ (p < 0.05). The mean lc-excess values for different soil layers were all close to 0‰ in P. australis and C. cinerascens communities.

3.5. Contribution of Rainfall and Groundwater to Soil Water

In the A. capillaries community, the root-zone soil water consistently exhibited enriched δ18O values compared to rainfall and groundwater (Figure 5 and Figure 8A,B). Depleted isotopic signatures were not observed in the root-zone soil water, indicating no groundwater recharge. Therefore, the contribution ratio of groundwater was not calculated for this community. However, in the P. australis community, the isotopic values of root-zone soil water fell within the range of mean values for rainfall and groundwater in April, May, and August (Table 3), indicating that the soil water is jointly replenished by rainfall and groundwater during periods of rising and high levels. The average proportions of root-zone soil water recharged from rainfall and groundwater were 34.5% ± 15.9% and 65.5% ± 15.9%, respectively. Additionally, the mean δ18O of soil water for the P. australis community in June (−4.64‰) was identical to that of lake water (−4.69‰), suggesting that lake water also recharges the root-zone soil water during the high-level period. In the C. cinerascens community, the soil water consistently received recharge from rainfall and groundwater (Table 4), with contributions of 42.6% ± 13.0% for rainfall and 57.4% ± 13.0% for groundwater.

4. Discussion

4.1. Mechanisms of Rainfall Infiltration, Mixing, and Piston Flow

Precipitation serves as the primary source of terrestrial soil water. The variation in rainfall isotopes can be used as a reference to explore the characteristics of soil water movement [9,34]. In this study, the seasonal isotopic variations in soil water in the A. capillaries community were found to be similar to those of rainfall (Figure 7). The monthly mean δD and δ18O in rainfall demonstrated a strong positive correlation with soil water at 0–15 cm (δD: r = 0.92, p < 0.01) and 15–40 cm (δ18O: r = 0.80, p < 0.05), indicating that the isotopic variation in shallow soil water (0–40 cm) in the A. capillaries community is mainly affected by rainfall input. However, the isotopic values of deep soil water (40–60 and 60–80 cm) showed markedly different variation patterns compared to rainfall, with no significant correlations observed between them (r = 0.01–0.23, p > 0.05). This suggests that the deep soil water weakly responds to rainfall. This might be due to the mixing effect between infiltrated rainfall and the antecedent soil water in the form of piston flow.
To investigate soil water movement in the A. capillaris community, vertical profiles of soil water δ18O and SWC were further analyzed. In the rainy season (e.g., May and June), the soil water δ18O increased with depth, with the most negative value occurring in the top 15 cm (Figure 8A,B). These findings suggest that rainfall is transported by piston flow. According to piston flow theory, new water from rainfall pushes the enriched old soil water deeper down the soil profile [5,9,34]. Similarly, during the dry season (e.g., July and August), the negative peak of δ18O at a depth of 40 cm also indicates the prevalence of piston flow (Figure 8A,B). Because the rainfall in July (−8.78‰) and August (−5.78‰) had relatively depleted δ18O values, shallow soil layers (15 and 40 cm) should show more negative signals than deep soil (60 and 80 cm) if piston flow occurred [9]. Indeed, the shallow soil water did have lower δ18O values than the deep soil water (Figure 8A), supporting piston flow theory. Additionally, soil sampling in July was carried out four days after a moderate rainfall event, with δ18O of −8.07‰ (17.8 mm, 12 July). However, the soil water δ18O values at depths of 60 and 80 cm did not decrease correspondingly, indicating that the moderate rainfall only recharged the shallow soil layers of the root zone.
The process of piston flow was accompanied by the mixing of recent rainfall with old soil water following heavy rain events. After a heavy rainfall event (33 mm, 8 June) with a δ18O of −10.2‰, the δ18O soil profile (15 June) in the A. capillaries community revealed that the most depleted value in the top 15 cm (−7.19‰) was not as depleted as the rainfall value (Figure 8A). This discrepancy suggests that the difference in δ18O may be caused by mixing between rainfall and antecedent soil water prior to the event, as evaporation was limited during this short period. Additional support for this interpretation is provided by the SWC profile in June (Figure 3A). The SWC in the 0–60 cm soil layers increased by 3% after the rainfall, with no response observed in the 60–80 cm soil layer. This observation further indicates that heavy rainfall events only replenish the deep soil at a depth of 60 cm.

4.2. Evidence for Preferential Flow and Its Formation Mechanisms

In this study, the isotopic composition of soil water in the P. australis community showed no significant monthly variations (Figure 7, p > 0.05). The monthly mean δ18O of soil water in the C. cinerascens community was found to have weak positive correlations with rainfall (r = 0.60–0.88, p > 0.05). These limited seasonal variations and inconspicuous responses of the soil water isotopes to rainfall indicate the dominance of preferential flow in the P. australis and C. cinerascens communities [35,36]. Additionally, preferential flow can be identified through the high variability in isotopic signals at a certain soil depth [6,37,38]. In this study, significant variability in soil water isotopes was observed in the P. australis and C. cinerascens communities, as indicated by the standard deviations shown in Figure 8C–F. This suggests the coexistence of preferential and matrix flow. However, the interaction between preferential flow and the soil matrix is weak, leading to strong spatial heterogeneity in soil water movement. This is because preferential flow is characterized by non-equilibrium, as infiltrated water does not have sufficient time to reach equilibrium with the soil matrix along this pathway [37].
The isotope profiles of the P. australis and C. cinerascens communities after flood exhibited sudden decreases in values at certain depths (Figure 8C–F). In September, the soil water δ18O of P. australis showed a reverse S-shaped profile, with pronounced depletion and large standard deviations (−6.21 ± 3.14‰, −5.89 ± 2.04‰) observed at depths of 15 and 60 cm. Similarly, negative δ18O peaks were observed at depths of 40 and 80 cm (−8.80‰ and −8.61‰) in the C. cinerascens community. These depleted signals corresponded to the heavy rainfall event (38 mm, on 3 September; −9.40‰) that occurred approximately one week prior to the sampling date, indicating the occurrence of preferential flow in different soil layers. Furthermore, the preferential flow may have ultimately recharged the groundwater, as evidenced by a significant decrease in groundwater δ18O (−6.04‰) in the P. australis community. In October, the most negative δ18O values in the C. cinerascens community were observed at the depths of 15 and 60 cm (−10.1‰ and −9.33‰) for one sampling plot, and at an 80 cm depth (−8.97‰) for the other. These values corresponded to the heavy rainfall event (37 mm, on 21 October; −8.26‰) that occurred two days prior to the sampling date. These observations suggest that preferential flow is common in wetlands covered by P. australis and C. cinerascens and can even penetrate deep into the soil to recharge groundwater. Moreover, the soil water lc-excess values in the P. australis and C. cinerascens communities (average: −0.16‰ and 0.92‰) approached precipitation (0‰), which also provides support for the occurrence of preferential flow [6,39].
The movement of soil water in the root zone is influenced by various factors, including vegetation type, soil characteristics, and hydrological conditions [37,40,41]. In this study, preferential flow was observed in the P. australis and C. cinerascens communities rather than in the A. capillaries community. This might be because the P. australis and C. cinerascens communities had significantly higher vegetation coverage and belowground biomass compared to the A. capillaries community (Table 2). P. australis possesses extensive vertical and horizontal rhizomes, and C. cinerascens has a tuft root system [16,25]. The well-developed root networks in these areas have enhanced soil macroporosity and provide pathways for preferential flow [13,42,43].
The occurrence of preferential flow is also influenced by soil moisture conditions [40,44]. In this study, preferential flow was particularly found at the two wetter sites of the P. australis and C. cinerascens communities. This finding is consistent with Liu et al. [15], who found a positive correlation between the percentage of preferential flow and soil water content in the Yellow River wetland. However, the influence of soil moisture on preferential flow may vary in different areas [45]. In hydrophobic soils, dry soil conditions often facilitate the occurrence of preferential flow due to water repellency [44,46], whereas in other areas, preferential flow is more prominent under wetter soil conditions [10,47]. This is because increased soil moisture leads to a more connected network of soil macropores, allowing rainfall to rapidly penetrate the soil [40,41]. Additionally, the periodic flooding in Poyang Lake wetland enhanced soil heterogeneity through decayed roots, plant remains, and the formation of soil fissures during the water drainage process [25,48]. These factors may contribute to the high spatial and temporal variability in preferential flow. In conclusion, our findings indicate that dense vegetation coverage, high soil moisture, and seasonal flooding promote the occurrence of preferential flow in wetland systems.

4.3. Evaporation Fractionation Depth of Soil Water

At the soil–atmosphere interface, evaporation is the major process driving soil water upward as well as causing water loss to the atmosphere, leading to enriched soil water isotopes and lower slopes of SEL [31,49]. According to Figure 6, the slope for the A. capillaris community (5.91) was lower than that of the P. australis and C. cinerascens communities (6.75 and 6.70), indicating that evaporation was more pronounced at the dry site (A. capillaris community). Moreover, the negative lc-excess values at soil layers above 60 cm in the A. capillaris community implied that the influencing depth of soil evaporation is about 60 cm. The slightly positive lc-excess values in the P. australis and C. cinerascens communities, and the weak seasonal variation in soil water isotopes, indicated that the influence of evaporation on soil water occurred at a depth lower than 15 cm in the P. australis and C. cinerascens communities.
Many studies have found that the influence of soil evaporation on isotopes is confined to the surface. Sprenger et al. [5] reviewed 25 references and highlighted that the enrichment of soil water isotopes due to evaporation is generally limited to the upper 30 cm. Additionally, Sprenger et al. [6] explored the seasonal variations in soil isotope dynamics in a low-energy, wet environment and found that the fractionation signal was within the upper 15 cm. Through laboratory evaporation experiments in soil columns, Rothfuss et al. [50] discovered that soil water fractionation primarily occurs in the top 20 cm in temperate climates. In our study, we found that the evaporation depth at wet sites (15 cm) aligns with the findings of Sprenger et al. [6], but is shallower than the values reported by Sprenger et al. and Rothfuss et al. [5,50]. Conversely, the evaporation depth of 60 cm at the dry site is consistent with the observations in arid and Mediterranean environments, where negative lc-excess (<−20‰) indicates that evaporative fractionation can extend down to a depth of 70 cm [5,51].
Vegetation coverage and soil water movement type are likely reasons for the differences in evaporation depth among the three sampling sites [52]. The soils beneath the P. australis and C. cinerascens communities are densely vegetated, with coverage exceeding 95%. These plants shade almost all of the land surface during the growing season and suppress soil evaporation. In contrast, the soils beneath the A. capillaries community are only partially covered, with a coverage of 50–60%, allowing for free vapor exchange between the soil and the atmosphere. Similar findings have been reported by Midwood et al. and Sprenger et al. [6,53], who found higher soil water enrichment under woody plants compared to low shrubs and grasses due to the microclimate conditions beneath the vegetation. In addition, the slow movement of piston flow extended the period of evaporation exposure in the root zone, while the rapid infiltration of preferential flow reduced soil water evaporation.

4.4. Groundwater Recharge and Capillary Flow

During the study period, the variation in groundwater level lagged behind that of rainfall, but was consistent with the lake level (Figure 2B,C), indicating that groundwater dynamics are influenced by surface water fluctuations [22,29]. During rising level periods (March to May), the groundwater level and lake level rose synchronously, with a small hydraulic gradient between them. This was due to the increased river runoff in the rainy season, which recharged both the riparian wetland and the lake [29]. However, during the high water level period (June to August), the wetland groundwater level was below the lake level (Figure 2C), indicating that the lake water recharges the wetland groundwater system [20]. Isotope analysis also showed that groundwater isotopes were similar to lake water during July and August (Figure 5). Conversely, during the falling level period (September to December), the wetland groundwater level was mostly above the lake level (Figure 2C), and the groundwater mainly discharged into the surface water. Additionally, the isotopic similarity between the Gan River and groundwater (δ18O: p = 0.49, δD: p = 0.12) emphasizes their strong interaction, with stream waters serving as the primary source of wetland groundwater. This is because river channels usually consist of coarse-grained sand and gravel, unlike the fine sediments on the lakebed, thus maintaining a close relationship with adjacent wetland aquifers [29,54]. If future stream water levels decline excessively, it would reduce recharge to the wetland groundwater and result in a declining groundwater level. This, in turn, may lead to drying of the root-zone soil in the wetland.
In floodplain wetlands, changes in groundwater levels can result in variations in the recharge of groundwater to the root-zone soil [55]. This study found that root-zone soil in the P. australis and C. cinerascens communities was predominantly replenished by capillary water from wetland groundwater (Table 3 and Table 4). This was attributed to the shallow groundwater table and fine-textured soils (silt), as well as the dense root channels of herbs in these sites [15,16] which promote the upward movement of shallow groundwater. Considering that the depth of the groundwater table in the P. australis and C. cinerascens communities varied within 1.26–5.14 m and 1.47–3.26 m, respectively, from April to October (Figure 2D), the maximum height of capillary rise was approximately 4.5 and 3.1 m, respectively. In contrast, the root-zone soil in the A. capillaries community was not affected by capillary flow from groundwater due to the deep groundwater table (more than 1.9 m, Figure 2D) in the dry year and the low capillary rise in coarse soil (sand).

4.5. Hydrological Connection at the Profile Scale

At the soil profile scale, hydrological connectivity refers to the ease of water transport between the root zone and groundwater [56]. Preferential flow facilitates the rapid infiltration of rainfall into deeper soil [9], and is often used as an indicator of strong hydrological connection [16,41,56]. In this study, rapid preferential flow and substantial groundwater recharge were commonly observed in the P. australis and C. cinerascens communities. The average lc-excess of groundwater in wetlands (0.4‰) closely resembled that of rainfall (0‰), suggesting that rainfall primarily replenishes groundwater through preferential flow. Water transported through preferential flow undergoes minimal evaporation loss, resulting in an increased net recharge to the deep soil layers and wetland groundwater reservoirs. The capillary flow from groundwater provides a considerable water supply to the root-zone soil (Table 3 and Table 4), creating a favorable moisture environment for wetland ecosystems. This steady water source is crucial for meeting the high water demands of wetland plants, particularly during drought periods, which further impacts vegetation growth and reproduction [9,13]. Therefore, it can be inferred that preferential flow and groundwater recharge significantly enhance hydrological connectivity in marshland covered by emergent plants and hygrophyte in Poyang Lake wetland. In contrast, the A. capillaries community no longer experiences groundwater recharge, suggesting a disruption in hydrological connectivity. Changes in hydrological connectivity have significant impacts on the colonization and expansion of biota by altering their habitats [7,16]. A decrease in the hydrological connectivity of wetlands usually indicates disruptions of internal energy flow, nutrient circulation, and biological information, leading to ecological function degradation and decreased biodiversity [16,37]. Therefore, the interrupted hydrological connectivity in the dry year is likely the main cause of vegetation degradation at high elevations in the Poyang Lake wetland.
Field experiment design and data analysis should take care to avoid pseudo-replication [57]. In this study, soil sampling was randomly conducted from three different sites established within each vegetation community at 15 m intervals. There was no case of simple pseudo-replication. However, the monthly data collected within each community were pooled to analyze the soil isotopic differences among sites, as sacrificed pseudo-replication seemed to be present. According to Hurlbert, sacrificed pseudo-replication means that treatments are not replicated, and statistical tests only assess differences in location rather than differences in treatment effects [57]. This is consistent with the primary objective of this study, which was to explore the differences in water movement at different vegetation sites (high, median, and low), rather than the treatment effect. Moreover, Hurlbert argues that to avoid sacrificed pseudo-replication, the correct approach is to use analysis of variance (ANOVA) rather than a chi-square test [57]. In fact, we used ANOVA to examine the differences in variables in this study. In summary, given the complexity and heterogeneity of wetland ecohydrological processes, future research should expand the spatial scale of the investigation and focus on water movement across different study areas.

5. Conclusions

This study aimed to investigate the movement of water in the root zone (0–80 cm) and its interaction with groundwater in Poyang Lake wetland during a dry year using stable isotopes. Our findings revealed distinct patterns in the root-zone soil water dynamics depending on the vegetation type. In the high upland covered by the Artemisia capillaris community, the root-zone soil water was primarily recharged by rainfall rather than groundwater due to the deep groundwater table. The infiltrated rainfall was predominantly transported through piston flow and underwent significant evaporation fractionation. Consequently, rainfall events mainly replenished the soil moisture within the 0–60 cm depth but did not significantly contribute to groundwater recharge. This interrupted hydrological connection at the profile level in a dry year could potentially explain the degradation of vegetation in the upland areas of Poyang Lake wetland. In contrast, preferential flow was found to be dominant in the median and low wetlands covered by dense communities of Phragmites australis and Carex cinerascens, respectively. The occurrence of preferential flow was associated with high soil moisture, extensive vegetation coverage, and periodic flooding conditions. Soil evaporation was low for these vegetation types, and thus, rainfall was mostly transported into wetland groundwater by preferential flow. The isotope signature of deep soil water in the P.australis and C. cinerascens communities resembled that of groundwater, indicating that the deep root-zone soil primarily relies on recharge from wetland groundwater. The enhanced hydrological connection facilitated by preferential flow and groundwater recharge has important implications for root-zone water conditions and vegetation water use during drought periods. The findings provide valuable insights into the complex relationships between precipitation, soil water, and groundwater in the Poyang Lake wetland, contributing to our understanding of ecohydrological processes in wetland ecosystems.
This work serves as a preliminary investigation into water transformation within the river/lake wetland system. It is important to note that this study was conducted during a dry year (2018). As a result, the findings may not align with the long-term average or normal years, but rather primarily reflect the characteristics of wetland water movement during a drought year. Exploring wetland water transport in dry years is of great significance for ecosystem preservation, especially considering the frequent occurrence of drought events. The contributions of groundwater highlight its critical role in maintaining the moisture condition of the root zone in wetland ecosystems during dry years. In fact, we have collected isotopic data in different years. Subsequent research will focus on exploring the impact of varying hydrological conditions and precipitation patterns on the movement and recharge processes of wetland soil water.

Author Contributions

Conceptualization, X.X. and J.Z.; methodology, X.X. and Y.L.; software, X.X.; validation, L.H. and G.W.; formal analysis, X.X.; investigation, X.X. and J.Z.; resources, Y.L.; data curation, X.X.; writing—original draft preparation, X.X., Y.L. and L.H.; writing—review and editing, Y.L.; visualization, J.Z.; supervision, Y.L. and L.H.; All authors have read and agreed to the published version of the manuscript.

Funding

This research was funded by National Natural Science Foundation of China (41601031, 42071036, 52009006), the Scientific Research Fund of Jiangsu Second Normal University (928201/030), Science Foundation of Nanjing Institute of Geography and Limnology, Chinese Academy of Sciences (NIGLAS2022GS08), Jiangxi “Double Thousand Plan” (jxsq2023101105), and the Fundamental Research Funds for Central Public Welfare Research Institutes (CKSF2023315/TB).

Institutional Review Board Statement

Not applicable.

Informed Consent Statement

Not applicable.

Data Availability Statement

The data are unavailable due to privacy reasons.

Conflicts of Interest

The authors declare no conflicts of interest.

References

  1. Henszey, R.J.; Pfeiffer, K.; Keough, J.R. Linking surface- and ground-water levels to riparian grassland species along the Platte River in Central Nebraska, USA. Wetlands 2004, 24, 665–687. [Google Scholar] [CrossRef]
  2. Hammersmark, C.T.; Rains, M.C.; Wickland, A.C.; Mount, J.F. Vegetation and water-table relationships in a hydrologically restored riparian meadow. Wetlands 2009, 29, 785–797. [Google Scholar] [CrossRef]
  3. Helliwell, J.R.; Sturrock, C.J.; Mairhofer, S.; Craigon, J.; Ashton, R.W.; Miller, A.J.; Whalley, W.R.; Mooney, S.J. The emergent rhizosphere: Imaging the development of the porous architecture at the root-soil interface. Sci. Rep. 2017, 7, 14875. [Google Scholar] [CrossRef]
  4. Jiang, B.F.; Cui, B.L.; Wang, Y.; Wang, Y.X.; Li, D.S.; Wang, L.S.; Li, X.Y. Stable-isotope tracing of vadose-zone water transport in Achnatherum splendens grassland of the Qinghai Lake Basin, NE Qinghai–Tibet Plateau, China. Catena 2021, 200, 105088. [Google Scholar] [CrossRef]
  5. Sprenger, M.; Leistert, H.; Gimbel, K.; Weiler, M. Illuminating hydrological processes at the soil-vegetation-atmosphere interface with water stable isotopes. Rev. Geophys. 2016, 54, 674–704. [Google Scholar] [CrossRef]
  6. Sprenger, M.; Tetzlaff, D.; Soulsby, C. Soil water stable isotopes reveal evaporation dynamics at the soil–plant–atmosphere interface of the critical zone. Hydrol. Earth Syst. Sci. 2017, 21, 3839–3858. [Google Scholar] [CrossRef]
  7. Cui, Y.; Zhang, Y.H.; Zhou, S.J.; Pan, Y.Y.; Wang, R.Q.; Li, Z.; Zhang, Z.M.; Zhang, M.X. Cracks and root channels promote both static and dynamic vertical hydrological connectivity in the Yellow River Delta. J. Clean. Prod. 2022, 367, 132972. [Google Scholar] [CrossRef]
  8. Zhang, M.D.; Wang, H.R.; Wang, C.Y.; Wang, K.Y.; Zhou, Y.K.; Bai, X.L. Water use strategy of Carex cinerascens and its response to water condition changes in Poyang Lake Wetland, China. Ecol. Indic. 2023, 146, 109863. [Google Scholar] [CrossRef]
  9. Gazis, C.; Feng, X.H. A stable isotope study of soil water: Evidence for mixing and preferential flow paths. Geoderma 2004, 119, 97–111. [Google Scholar] [CrossRef]
  10. Demand, D.; Blume, T.; Weiler, M. Spatio-temporal relevance and controls of preferential flow at the landscape scale. Hydrol. Earth Syst. Sci. 2019, 23, 4869–4889. [Google Scholar] [CrossRef]
  11. Song, X.F.; Wang, P.; Yu, J.J.; Liu, X.; Liu, J.R.; Yuan, R.Q. Relationships between precipitation, soil water and groundwater at Chongling catchment with the typical vegetation cover in the Taihang mountainous region, China. Environ. Earth. Sci. 2011, 62, 787–796. [Google Scholar] [CrossRef]
  12. Wan, H.; Liu, W.G. An isotope study (18O and D) of water movements on the Loess Plateau of China in arid and semiarid climates. Ecol. Eng. 2016, 93, 226–233. [Google Scholar] [CrossRef]
  13. Luo, Z.; Niu, J.; Zhang, L.; Chen, X.; Zhang, W.; Xie, B.Y.; Du, J.; Zhu, Z.J.; Wu, S.S.; Li, X. Roots-enhanced preferential flows in deciduous and coniferous forest soils revealed by dual-tracer experiments. J. Environ. Qual. 2018, 48, 136–146. [Google Scholar] [CrossRef]
  14. Bogner, C.; Gaul, D.; Kolb, A.; Schmiedinger, I.; Huwe, B. Investigating flow mechanisms in a forest soil by mixed-effects modelling. Eur. J. Soil. Sci. 2020, 61, 1079–1090. [Google Scholar] [CrossRef]
  15. Liu, Y.; Zhang, Y.H.; Xie, L.M.; Zhao, S.Q.; Dai, L.Y.; Zhang, Z.M. Effect of soil characteristics on preferential flow of Phragmites australis community in Yellow River delta. Ecol. Indic. 2021, 125, 107486. [Google Scholar] [CrossRef]
  16. Dai, L.Y.; Zhang, Y.H.; Liu, Y.; Xie, L.M. Assessing hydrological connectivity of wetlands by dye-tracing experiment. Ecol. Indic. 2020, 119, 106840. [Google Scholar] [CrossRef]
  17. Boswell, J.S.; Olyphant, G.A. Modeling the hydrologic response of groundwater dominated wetlands to transient boundary conditions: Implications for wetland restoration. J. Hydrol. 2007, 332, 467–476. [Google Scholar] [CrossRef]
  18. Elci, A.; Molz, F.J. Identification of Lateral Macropore Flow in a Forested Riparian Wetland through Numerical Simulation of a Subsurface Tracer Experiment. Water Air Soil. Pollut. 2009, 197, 149–164. [Google Scholar] [CrossRef]
  19. Chen, X.; Chen, L.; Stone, M.C.; Acharya, K. Assessing connectivity between the river channel and floodplains during high flows using hydrodynamic modeling and particle tracking analysis. J. Hydrol. 2020, 583, 124609. [Google Scholar] [CrossRef]
  20. Zhang, X.; Xiao, Y.; Wan, H.; Deng, Z.M.; Pan, G.Y.; Xia, J. Using stable hydrogen and oxygen isotopes to study water movement in soil-plant-atmosphere continuum at Poyang Lake wetland, China. Wetl. Ecol. Manag. 2017, 25, 221–234. [Google Scholar] [CrossRef]
  21. Sun, H.M.; Hu, Z.; Zhang, J.; Wu, W.Z.; Liang, S.; Lu, S.Y.; Liu, H.Q. Determination of hydraulic flow patterns in constructed wetlands using hydrogen and oxygen isotopes. J. Mol. Liq. 2016, 223, 775–780. [Google Scholar] [CrossRef]
  22. Li, Y.L.; Yao, J.; Zhao, G.Z.; Zhang, Q. Evidences of hydraulic relationships between groundwater and lake water across the large floodplain wetland of Poyang Lake, China. Water Sci. Technol. Water Supply. 2018, 18, 698–712. [Google Scholar] [CrossRef]
  23. Tan, Z.Q.; Li, Y.L.; Xu, X.L.; Yao, J.; Zhang, Q. Mapping inundation dynamics in a heterogeneous floodplain: Insights from integrating observations and modeling approach. J. Hydrol. 2019, 572, 148–159. [Google Scholar] [CrossRef]
  24. Xu, X.L.; Zhang, Q.; Li, Y.L.; Li, X.H. Evaluating the influence of water table depth on transpiration of two vegetation communities in a lake floodplain wetland. Hydrol. Res. 2016, 47, 293–312. [Google Scholar] [CrossRef]
  25. Feng, W.J.; Mariotte, P.; Xu, L.G.; Buttler, A.; Bragazza, L.; Jiang, J.H.; Santonja, M. Seasonal variability of groundwater level effects on the growth of Carex cinerascens in lake wetlands. Ecol. Evol. 2020, 10, 517–526. [Google Scholar] [CrossRef]
  26. Feng, L.; Hu, C.; Chen, X.; Zhao, X. Dramatic inundation changes of China’s two largest freshwater lakes linked to the Three Gorges Dam. Environ. Sci. Technol. 2013, 47, 9628–9634. [Google Scholar] [CrossRef]
  27. Zhang, Q.; Ye, X.C.; Werner, A.D.; Li, Y.L.; Yao, J.; Li, X.H. An investigation of enhanced recessions in Poyang Lake: Comparison of Yangtze River and local catchment impacts. J. Hydrol. 2014, 517, 425–434. [Google Scholar] [CrossRef]
  28. Mei, X.F.; Dai, Z.J.; Fagherazzi, S.; Chen, J.Y. Dramatic variations in emergent wetland area in China’s largest freshwater lake, Poyang Lake. Adv. Water Resour. 2016, 96, 1–10. [Google Scholar] [CrossRef]
  29. Zhan, L.C.; Chen, J.S.; Zhang, S.Y.; Li, L.; Huang, D.W.; Wang, T. Isotopic signatures of precipitation, surface water, and groundwater interactions, Poyang Lake Basin, China. Environ. Earth. Sci. 2016, 75, 1307. [Google Scholar] [CrossRef]
  30. Wu, H.W.; Huang, Q.; Fu, C.S.; Song, F.; Liu, J.Z.; Li, J. Stable isotope signatures of river and lake water from Poyang Lake, China: Implications for river–lake interactions. J. Hydrol. 2021, 592, 125619. [Google Scholar] [CrossRef]
  31. Landwehr, J.M.; Coplen, T.B.; Stewart, D.W. Spatial, seasonal, and source variability in the stable oxygen and hydrogen isotopic composition of tap waters throughout the USA. Hydrol. Process. 2014, 28, 5382–5422. [Google Scholar] [CrossRef]
  32. Yeh, H.F.; Lin, H.I.; Lee, C.H.; Hsu, K.C.; Wu, C.S. Identifying seasonal groundwater recharge using environmental stable isotopes. Water 2014, 6, 2849–2861. [Google Scholar] [CrossRef]
  33. Du, K.; Zhang, B.Y.; Li, L.J. Soil Water Dynamics Under Different Land Uses in Loess Hilly Region in China by Stable Isotopic Tracing. Water 2021, 13, 242. [Google Scholar] [CrossRef]
  34. Zheng, W.B.; Wang, S.Q.; Sprenger, M.; Liu, B.X.; Cao, J.S. Response of soil water movement and groundwater recharge to extreme precipitation in a headwater catchment in the North China Plain. J. Hydrol. 2019, 576, 466–477. [Google Scholar] [CrossRef]
  35. Gehrels, J.C.; Peeters, J.E.M.; De Vries, J.J.; Dekkers, M. The mechanism of soil water movement as inferred from 18O stable isotope studies. Hydrolog Sci. J. 1998, 43, 579–594. [Google Scholar] [CrossRef]
  36. Orlowski, N.; Kraft, P.; Pferdmenges, J.; Breuer, L. Exploring water cycle dynamics through sampling multitude stable water isotope pools in a small developed landscape of Germany. Hydrol. Earth Syst. Sci. 2015, 12, 1809–1853. [Google Scholar]
  37. Zhang, Y.H.; Chen, J.H.; Zhang, J.C.; Zhang, Z.M.; Zhang, M.X. Novel indicator for assessing wetland degradation based on the index of hydrological connectivity and its correlation with the root-soil interface. Ecol. Indic. 2021, 133, 108392. [Google Scholar] [CrossRef]
  38. Thomas, E.M.; Lin, H.; Duffy, C.J.; Sullivan, P.L.; Holmes, G.H.; Brantley, S.L.; Jin, L.X. Spatiotemporal patterns of water stable isotope compositions at the shale hills critical zone observatory: Linkages to subsurface hydrologic processes. Vadose Zone J. 2013, 4, 1–16. [Google Scholar] [CrossRef]
  39. Wang, J.X.; Zhang, M.J.; Argiriou, A.A.; Wang, S.J.; Qu, D.Y.; Zhang, Y.; Su, P.Y. Recharge and Infiltration Mechanisms of Soil Water in the Floodplain Revealed by Water-Stable Isotopes in the Upper Yellow River. Sustainability 2021, 13, 9369. [Google Scholar] [CrossRef]
  40. Wiekenkamp, I.; Huisman, J.A.; Bogena, H.R.; Lin, H.S.; Vereecken, H. Spatial and temporal occurrence of preferential flow in a forested headwater catchment. J. Hydrol. 2016, 534, 139–149. [Google Scholar] [CrossRef]
  41. Kang, W.M.; Tian, J.; Bogena, H.R.; Lai, Y.; Xue, D.X.; He, C.S. Soil moisture observations and machine learning reveal preferential flow mechanisms in the Qilian Mountains. Geoderma 2023, 438, 116626. [Google Scholar] [CrossRef]
  42. Jiang, X.J.; Liu, W.J.; Chen, C.F.; Liu, J.Q.; Yuan, Z.Q.; Jin, B.C.; Yu, X.Y. Effects of three morphometric features of roots on soil water flow behavior in three sites in China. Geoderma 2018, 320, 161–171. [Google Scholar] [CrossRef]
  43. Porporato, A.; D’odorico, P.; Laio, F.; Ridolfi, L.; Rodriguez-Iturbe, I. Ecohydrology of water-controlled ecosystems. Adv. Water Resour. 2002, 25, 1335–1348. [Google Scholar] [CrossRef]
  44. Hardie, M.A.; Cotching, W.E.; Doyle, R.B.; Holz, G.; Lisson, S.; Mattern, K. Effect of antecedent soil moisture on preferential flow in a texture-contrast soil. J. Hydrol. 2011, 398, 191–201. [Google Scholar] [CrossRef]
  45. Merdun, H.; Meral, R.; Riza Demirkiran, A. Effect of the initial soil moisture content on the spatial distribution of the water retention. Eurasian Soil. Sci. 2008, 41, 1098–1106. [Google Scholar] [CrossRef]
  46. Edwards, W.M.; Shipitalo, M.J.; Owens, L.B.; Dick, W.A. Factors affecting preferential flow of water and atrazine through earthworm burrows under continuous no-till corn. J. Environ. Qual. 1993, 22, 453–457. [Google Scholar] [CrossRef]
  47. Liu, H.; Lin, H. Frequency and Control of Subsurface Preferential Flow: From Pedon to Catchment Scales. Soil. Sci. Soc. Am. J. 2015, 79, 362–377. [Google Scholar] [CrossRef]
  48. Ghestem, M.; Sidle, R.C.; Stokes, A. The influence of plant root system on subsurface flow: Implications for slope stability. BioScience 2011, 61, 869–879. [Google Scholar] [CrossRef]
  49. Zimmermann, U.; Ehhalt, D.; Munnich, K.O. Soil water movement and evaporation: Changes in the isotopic composition of the water. In Proceedings of the IAEA Symposium on Isotope Hydrology, Vienna, Austria, 14–18 November 1966; IAEA: Vienna, Austria, 1967; pp. 567–585. [Google Scholar]
  50. Rothfuss, Y.; Merz, S.; Vanderborght, J.; Hermes, N.; Weuthen, A.; Pohlmeier, A.; Vereecken, H.; Brueggemann, N. Long-term and high-frequency non-destructive monitoring of water stable isotope profiles in an evaporating soil column. Hydrol. Earth Syst. Sci. 2015, 19, 4067–4080. [Google Scholar] [CrossRef]
  51. McCutcheon, R.J.; McNamara, J.P.; Kohn, M.J.; Evans, S.L. An Evaluation of the Ecohydrological Separation Hypothesis in a Semiarid Catchment. Hydrol. Process. 2016, 31, 783–799. [Google Scholar] [CrossRef]
  52. Simonin, K.A.; Link, P.; Rempe, D.; Miller, S.; Oshun, J.; Bode, C.; Dietrich, W.E.; Fung, I.; Dawson, T.E. Vegetation induced changes in the stable isotope composition of near surface humidity. Ecohydrology 2014, 7, 936–949. [Google Scholar] [CrossRef]
  53. Midwood, A.J.; Boutton, T.W.; Archer, S.R.; Watts, S.E. Water use by woody plants on contrasting soils in a savanna parkland: Assessment with δ2H and δ18O. Plant Soil. 1998, 205, 13–24. [Google Scholar] [CrossRef]
  54. Woessner, W.W. Stream and fluvial plain ground water interactions: Rescaling hydrogeologic thought. Groundwater 2000, 38, 423–429. [Google Scholar] [CrossRef]
  55. Yeh, H.F.; Lee, C.H.; Hsu, K.C. Oxygen and hydrogen isotopes for the characteristics of groundwater recharge: A case study from the Chih-Pen Creek basin, Taiwan. Environ. Earth Sci. 2011, 62, 393–402. [Google Scholar] [CrossRef]
  56. Pringle, C. What is hydrologic connectivity and why is it ecologically important? Hydrol. Process. 2003, 17, 2685–2689. [Google Scholar] [CrossRef]
  57. Hurlbert, S.H. Pseudoreplication and the Design of Ecological Field Experiments. Ecol. Monogr. 1984, 54, 187–211. [Google Scholar] [CrossRef]
Figure 1. Map of the Poyang Lake wetland (A) and the study wetland section in Poyang Lake National Nature Reserve (PLNNR, B). Sample sites are conducted in the A. capillaries, P. australis, and C. cinerascens communities along the wetland section.
Sustainability 16 01755 g001
Figure 2. Variations in precipitation and temperature for multiyear average (1976–2017) and 2018 (A,B). Blue arrows indicate the sampling dates of soil samples from April to October. Variations in lake level at Xingzi station and the average groundwater level of the three wells in the study wetland in 2018 (C). The water level is based on the Wusong data. Temporal variation in water table depth in the three wetland vegetation communities in 2018 (D). The soil surface is defined as 0 m. Positive values refer to groundwater depths (water table is below soil surface). Negative values refer to the inundation depths caused by flooding (groundwater emerges above the soil surface).
Sustainability 16 01755 g002
Figure 3. Seasonal variations in the soil water content (means ± SD, n = 3) of A. capillaries (A), P. australis (B), and C. cinerascens (C) communities in 2018. Different lowercase letters indicate significant differences among months (p < 0.05). ns indicates no significant differences among depths. The significance of differences at the 0.05 level is denoted with one asterisk, 0.01 with two, and 0.001 with three.
Sustainability 16 01755 g003
Figure 4. Box–whisker diagrams showing the median, mean, and standard deviation for δD (A), δ18O (B), and lc-excess (C) values of different water types.
Sustainability 16 01755 g004
Figure 5. Monthly variations in δD (A) and δ18O (B) of rainfall, river water, lake water, and groundwater.
Sustainability 16 01755 g005
Figure 6. Dual-isotope plots of δ18O and δD values for water samples of precipitation, river water, lake water, groundwater, and soil water in A. capillaries (A), P. australis (B), and C. cinerascens (C) communities. The red open square in (C) was excluded from the soil water line fitting due to its significant enrichment from evaporation.
Sustainability 16 01755 g006
Figure 7. Temporal variations in soil water δD (A) and δ18O (B) values for the three vegetation communities. Different lowercase letters in each community indicate significant differences among months (p < 0.05). ns indicates no significant differences in the P. australis community.
Sustainability 16 01755 g007
Figure 8. Seasonal variation in soil water δ18O and δD profiles and the average isotopic values of groundwater (GW) in the A. capillaries (A,B), P. australis (C,D), and C. cinerascens (E,F) communities.
Sustainability 16 01755 g008
Figure 9. Monthly variation in line-conditioned excess (lc-excess) for soil water at different depths in the A. capillaries (A), P. australis (B), and C. cinerascens (C) communities. The boxplots of lc-excess values at different depths are shown in (D). * indicates significant differences from 0 for lc-excess values (p < 0.05).
Sustainability 16 01755 g009
Table 1. Vegetation distributions in the Poyang Lake wetland.
Vegetation CommunityEcotypeWusong Base Level (m)Companion Species
A. capillariesMesophyte17–18.5Cynodon dactylon an Eriophorum angustifolium
P. australisEmergent plant15–16Triarrhena lutarioriparia, C. cinerascens, and Polygonum hydropiper
C. cinerascensHygrophyte12–14Artemisia selengensis and Phalaris arundinacea
Table 2. Characteristics of vegetation community and soil physical properties in the study area.
Vegetation
Community
Plant Coverage
(%)
Belowground Biomass
(g/0.25 m2)
Height
(cm)
Depth
(cm)
Sand
(%)
Silt
(%)
Clay
(%)
Bulk Density
(g/cm3)
A. capillaries50–6083 ± 1255 ± 80–1592.86.21.01.33
15–4091.27.81.01.26
40–6087.18.64.31.32
60–8082.310.27.51.37
P. australis100586 ± 121150 ± 100–1513.675.411.01.30
15–4012.465.322.31.24
40–6011.268.320.51.26
60–8010.262.127.71.27
C. cinerascens95–100429 ± 10463 ± 70–1529.255.415.41.19
15–4033.750.316.01.23
40–6040.244.115.71.25
60–8033.247.619.21.30
Table 3. Estimation of root-zone soil water contribution by rainfall and groundwater in the P. australis community.
Hydrological PeriodMonthδ18O (‰)Contribution Ratio (%)
RainfallGroundwaterSoil WaterRainfallGroundwater
Water level rising periodApril−3.49−5.23−4.9317.382.7
May−3.82−5.05−4.4548.651.4
High water level periodJune−8.46−5.09−4.64\\
August−5.78−3.83−4.5737.762.3
Water level falling periodSeptember −6.82−6.04−5.45\\
October−7.13−5.57−4.99\\
“\” indicates that the root-zone soil water was drained downward, and thus we did not calculate the water supply ratios.
Table 4. Estimation of root-zone soil water contribution by rainfall and groundwater in the C. cinerascens community.
Hydrological PeriodMonthδ18O (‰)Contribution Ratio (%)
RainfallGroundwaterSoil WaterRainfallGroundwater
Water level rising periodApril−3.49 −5.72−4.71 45.654.4
May−3.82 −5.30 −4.72 39.360.7
Water level falling periodSeptember −6.82 −5.24 −5.67 27.272.8
October−7.13 −5.70 −6.5458.441.6
Disclaimer/Publisher’s Note: The statements, opinions and data contained in all publications are solely those of the individual author(s) and contributor(s) and not of MDPI and/or the editor(s). MDPI and/or the editor(s) disclaim responsibility for any injury to people or property resulting from any ideas, methods, instructions or products referred to in the content.

