Abstract
This research addresses three main review points related to the harmful practices of artisanal and small-scale gold mining and the appropriateness of prevention approaches to resilience for local residents’ environments. First, the focus is on cases of illegal mining exploitation in North Rarowatu and Lantari Jaya, with emphasis on the aspects of disaster risk management and prevention approaches in construction areas. Second, focus is given to the abundance of gold grains in the mining area, which attracts the author to utilize a dynamic system approach to explore whether a progressive restructuring exists for avoiding casualties in the mining area. Third, the precautionary accuracy of the security forces and the government are given focus to emphasize the prohibition of mercury absorption as a mining method. This research utilizes a system dynamics methodology to investigate the review of preventive approaches for maintaining the resilience of local communities and the determinants of small-scale gold mining activities by considering other empirical testing models. This study finds that a 30–50% increase in gold production significantly results in hydrological pollution due to mercury content, increased worker deaths, and unending damage to resident ecosystems, with minimal preventive capabilities in the pre-illegal artisanal and small-scale gold mining period. Moreover, this study offers an input and output prevention approach to controlling the number of illegal gold miners while protecting the environmental resilience of local residents.
1. Introduction
The “gold rush” expansion experienced a breakthrough in the North Rarowatu and Lantari Jaya areas, Bombana Regency, Southeast Sulawesi Province. The unprecedented equalization of digging has led to a 70-fold increase in alluvial gold production, which reportedly increases significantly in each period. The exponential acceleration of artisanal and small-scale gold mining (ASGM) has resulted in critical environmental circulation impacts that degrade ecosystem values, cause deforestation, damage road infrastructure, cause soil erosion, and lead to dangerous mercury contamination [1]. The hydration of rivers and community springs is also an issue, as they are affected by the development of gold mining operations in these areas. Alluvial gold deposits throughout the mining area are sterilized for geological reasons by using water sources close to the high-water pressure layer. The entire fluid content of clean water, including air and water cohesion filter receptors, has inevitably been exposed to sedimentation content. Most of the water resources near a mine have the highest level of pollution susceptibility to the accumulation of mercury materials mixed in the gold mine filtering process [2].
Ref. [3] argues that saving people’s lives due to mining land is a public concern in disaster prevention, considering mercury bioaccumulation through the trophic chain. Previous research clearly shows that, in addition to environmental opinions, gold mining damages socioeconomic aspects of local communities. The convergence of cultural restoration does not easily fade away, given the competition for maximum profit from the elemental value of gold [4]. Very little is known about the issue of what will happen to gold mining communities in North Rarowatu and Lantari after potentially colonized areas are depleted of all economically valuable energy resources, particularly how residents will survive by relying solely on the external capacity of the gold mining sector to restructure the economy and wellbeing of the population. The empirical evidence from [5] states that the majority of the population around the mine has been working in the mining sector, which is the primary livelihood for the surrounding population, and this factor causes a gap between the culture of dependency and indications of worker safety at mine intersections. Ref. [6] looked further into the actuality to explore the extent of the dominance of existing problems raised by the performance of mining companies in establishing safety precautions for mine workers to protect the good name of the company and create a path for related parties in the development of long-term dependency.
Rational actions demanding the arbitrariness of non-renewable ASGM are increasing, especially in regional areas with uncorrected geographical layouts. The facts that emerge from exploiting natural energy supplies and social injustice among the community are targeted victims of mining settlements [7]. This opinion of [8] views social and political thinking as a policy exploration of the limits of mining opening practices, which is a substantial relocation for the consideration of inclusive development reconstruction and upholding equitable human freedom [8]. Coordinating the attention of local governments in releasing mining land in settlements around North Rarowatu and Lantari is necessary to prioritize the objectivity of the seriousness of the composite material conservation project. This project is the center of the connectivity of discretionary prevention in mining activities. However, there is a debate ongoing about the conflict between mining practices, the political policy of mining law, and the coexistence of the population, leading to a loss of social distance to environmental security [9]. One study has shown that the concentration on mining actors ensures a difficulty in implementing legal policies to prevent illegal mining activities that do not comply with operational procedures and future environmental impacts [10,11]
Against this background, the policy of institutionalizing social arrangements for residents and workers around gold mines reflects the importance of protecting sustainable mining practices [12,13]. Different concerns have been raised about ASGM practices and the contribution of institutionalizing social arrangements. Local communities also need procedural and distributive justice in regard to illegal ASGM prevention methods exposing structurally unclear boundaries. The lack of institutional security arrangements to encourage social participation, trust, and influence of non-governmental organizations is also the cause of difficulty in eliminating illegal ASGM activities.
Although illegal ASGM practices have been banned from operating due to environmental harm to nearby residents, they are still considered sustainable if the benefits can be converted into business assets that balance economies of scale and tax-screening costs. This factor claims that the preventive approach of ASGM practices from the input–output side still needs to be realized, as previous empirics required a comprehensive conventional legal approach to the resilience of local residents. Ref. [14] states that the validity of the establishment of sustainable mining deeds must follow rules that have been strictly interpreted and fulfilled according to conventional customary law to prevent the exchange of aspects between natural resources and the accumulation of the mining industry [15].
Small-scale artisanal mines in North Rarowatu and Lantari Jaya are estimated to have employed around 100 gold miners and produced at least 57% of all gold production over the past two decades. According to factual reports from elders, manual gold-prospecting methods expose workers to mercury, thereby threatening their lives and health. Miners pour mercury chemicals directly into the gold or filter mercury-laced water with makeshift tools (also, workers usually put their hands into the mercury-laced water). This downstream process jeopardizes the role of workers and companies because no safeguards are in place to control mining operations in regard to the input and output sides. Allegations also exist that the operation of the gold mine without a waste-disposal container has resulted in fatalities among the population in the surrounding settlements [3,5].
Extensive fieldwork in North Rarowatu and Lantari Jaya over 10 days has resulted in a uniquely original study by empirical researchers that has little in common with other studies of mining investigations into significant disasters in the history of community life in the area. This research is necessary because it explains, in detail, the characteristics of preventive consolidation measures against environmental problems caused by ASGM and the possible instrumental approaches. The research discussion is divided into three topics for study. First, it focuses on illegal mining exploitation in North Rarowatu and Lantari Jaya by prioritizing the approach of disaster risk management and prevention in the construction area. Second, it examines the abundance of gold grains in the mining area and explores the dynamic system of whether a progressive restructuring is available to avoid casualties in the mining area. Considering the conflicting debates on mining practices and the legal policies enacted to prevent illegal ASGM practices, recognizing a need for systemic restructuring is essential. The discussion of this research emphasizes questions regarding the phenomenon of the object of research, which are stated as follows: (1) How does one review the appropriate prevention approach to protect the resilience of residents from small-scale gold mining activities? (2) What determinants of resident resilience significantly affect small-scale gold mining activities? This research explores how to review appropriate preventive approaches for protecting the resilience of local communities from small-scale gold mining activities. This research also determines the resilience of local communities that significantly influence small-scale gold mining activities.
2. Materials and Methods
2.1. Illustration of Empirical Model
The object of this study is located in the mining area of the North Rarowatu and Lantari Jaya districts, Bombana Regency. Several populations living in the North Rarowatu and Lintari Jaya mining areas still depend on traditional communal mining processing that results in mercury production. Some miners’ rights have not been recommended for absolute permit certification, indicating that mining activities do not have safety insurance and effective protection.
This methodology investigates the review of precautionary approaches to maintain population resilience and the determinants of small-scale gold mining activities by considering other empirical testing models. In the approach model to [16], a study has been found that uses a system dynamics model to identify causal loops and stock flow diagrams regarding mitigation agents, which prevents “porous” land control against flooding in settlements with low water absorption. A similar phenomenon has been found by [17,18], who noted that the HC–HQ input model is useful for testing the sensitivity of mining hazards to mercury content and emphasized the importance of low mercury modification variability to produce a threshold HC–HQ score under the Environmental Protection Agency analysis. Ref. [19] describes a method of preventing risk factors for underground-mine land self-management through the geographically weighted regression (GWR) model to distinguish how chemical concentrations vary with pollutants and environmental distribution in developing areas.
This quantitative method covers a household survey with a randomly selected 100 respondents. The research questionnaire was developed based on literature studies and the operationalization of the variables presented in Table 1. The model has nine variables comprising three scales of the questionnaire arrangement (1 = increasing, 2 = decreasing, 3 = remaining the same) for characteristic community variables (BK), economic opportunity (GP), and community connected cohesion (HK). A questionnaire search with Likert scale points (1 = very good, 2 = good, 3 = average, 4 = bad, and 5 = no service) is used for four variables, namely infrastructure and access to public facilities (CI), education (DP), access to health services (EA), and environmental issues (FL). The gap variable in the community (IG) discusses the physical and social conditions of the number of communities in a village before and after the entry of a mine that can be realized on a scale of 6 (1 = strongly disagree, 2 = disagree, 3 = neutral, 4 = agree, 5 = disagree, and 6 = do not know). The ASGM risk-prevention preparedness (JP) question addresses what impact the mine has on the preventive behavior of residents around the mine, and the frequency comprises a five-action scale (1 = no action required, 2 = extensive preparedness, 3 = partial/vulnerable preparedness, 4 = no action taken, 5 = not aware of preventive action).

Table 1.
Variable Operationalization [15].
Then, the researcher’s data questionnaire results are obtained from focus group discussion interviews, while the GWR4 and Powerstudio10 devices verify the source of the information. The discussion of this research model applies a dynamic system and GWR in examining ASGM activity and its effect on population resilience constructed by the adaptation of previous empirical literature. This research combines preventive approach analysis between dynamic system causal loop diagram (CLD) and GWR validation. Next, the research describes the test using the dynamic model structure and spatial regression weighting.
2.2. System Dynamic Analysis
The sequence of analysis of the preventive approach to indigenous resilience and mining activities uses the CLD model, which is the link to building a model of input from relevant stakeholders. The link to the prevention approach generally aims to analyze the feedback dynamics of the observed object described in the CLD cycle. Findings [34,35] show that the CLD development cycle is part of building a dynamic system model be-tween positive (strengthening the variable itself) and negative (correcting or trying to balance the connecting variable) feedback entities to produce a dynamic loop value system. Loop simulation rotation is a conflict relationship entity that occurs when a decrease follows an increase in another entity. However, a dynamic balance can be achieved if the loop contains a balancer and an amplifier. The dynamic system method in the CLD represents the interaction among the population, ASGM activity, and the amount of mercury content, which is illustrated as follows (Figure 1).
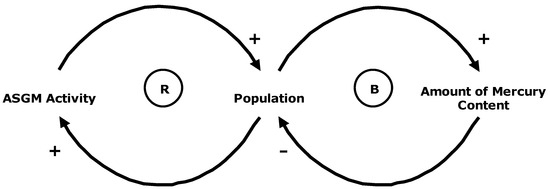
Figure 1.
System dynamic model between population, ASGM activity, and mercury content [36].
The variable loop elements gradually reach zero and depend on the relative rate until, finally, the loop value reaches dynamic equilibrium. The connecting arrow diagrams with polarity + or − are consonants for values indicating a causal relationship. The positive sign is used to see the level of the first correlation entity, which causes the second entity to increase (relationships between variables are considered constant). Meanwhile, the negative sign explains the inverse correlation between the increase in the first entity that causes a decrease in the second entity. A more complex loop variant provides a component side of two feedbacks, i.e., when the feedback value is positive, an even number of negative effects exist. The negative feedback loop is a cycle with a negative link at an odd number.
2.3. Geographically Weighted Regression Analysis
In a nutshell, the regression model to gain the opportunity for the observation model is tested for parameter estimation based on the ordinary least square (OLS) method results. The OLS formula can formulate the independent variable x and the dependent variable γ as a calculation of the correlation estimation of spatially stationary data regression. However, this estimation method is not ideal when the data estimation is used on non-stationary spatial data types. The approach of Wang et al. has revealed that the OLS regression procedure in non-stationary spatial fields can be identified through the GWR method. This method can extend the OLS regression to simple model estimation: . This extension of the regression model has the advantage of applying the spatial weighting matrix in the linear regression model. The GWR regression model can prove the level of differentiation in spatial structure. Based on the formulation of the GWR regression model, the appearance of the nine survey variables is as follows:
Notes:
= Activities of ASGM capacity in area .
= Observation area .
= Geographical coordinates of the administrative center of the mining area .
= Constant.
= Regression coefficient
= Standard error.
The variation in size of the GWR model directly affects the spatial size, so the de-termination of the bandwidth is very important for the formation of the GWR model. The bandwidth criterion is seen from the level of the fineness parameter. A greater bandwidth corresponds with a finer parameter. A model that is too fine leads to a tendency for all parameters in the study area objects to be the same. This part of the criteria is the best bandwidth in determining the analysis situation in the two study areas. Bandwidth methods are divided into cross-validation, Akaike information criterion (AIC), AIC correction (AICc), and BIC/MDL. The GWR model of this study is determined by the bandwidth value with the AICc method.
3. Results
3.1. Dynamic System Modeling Results
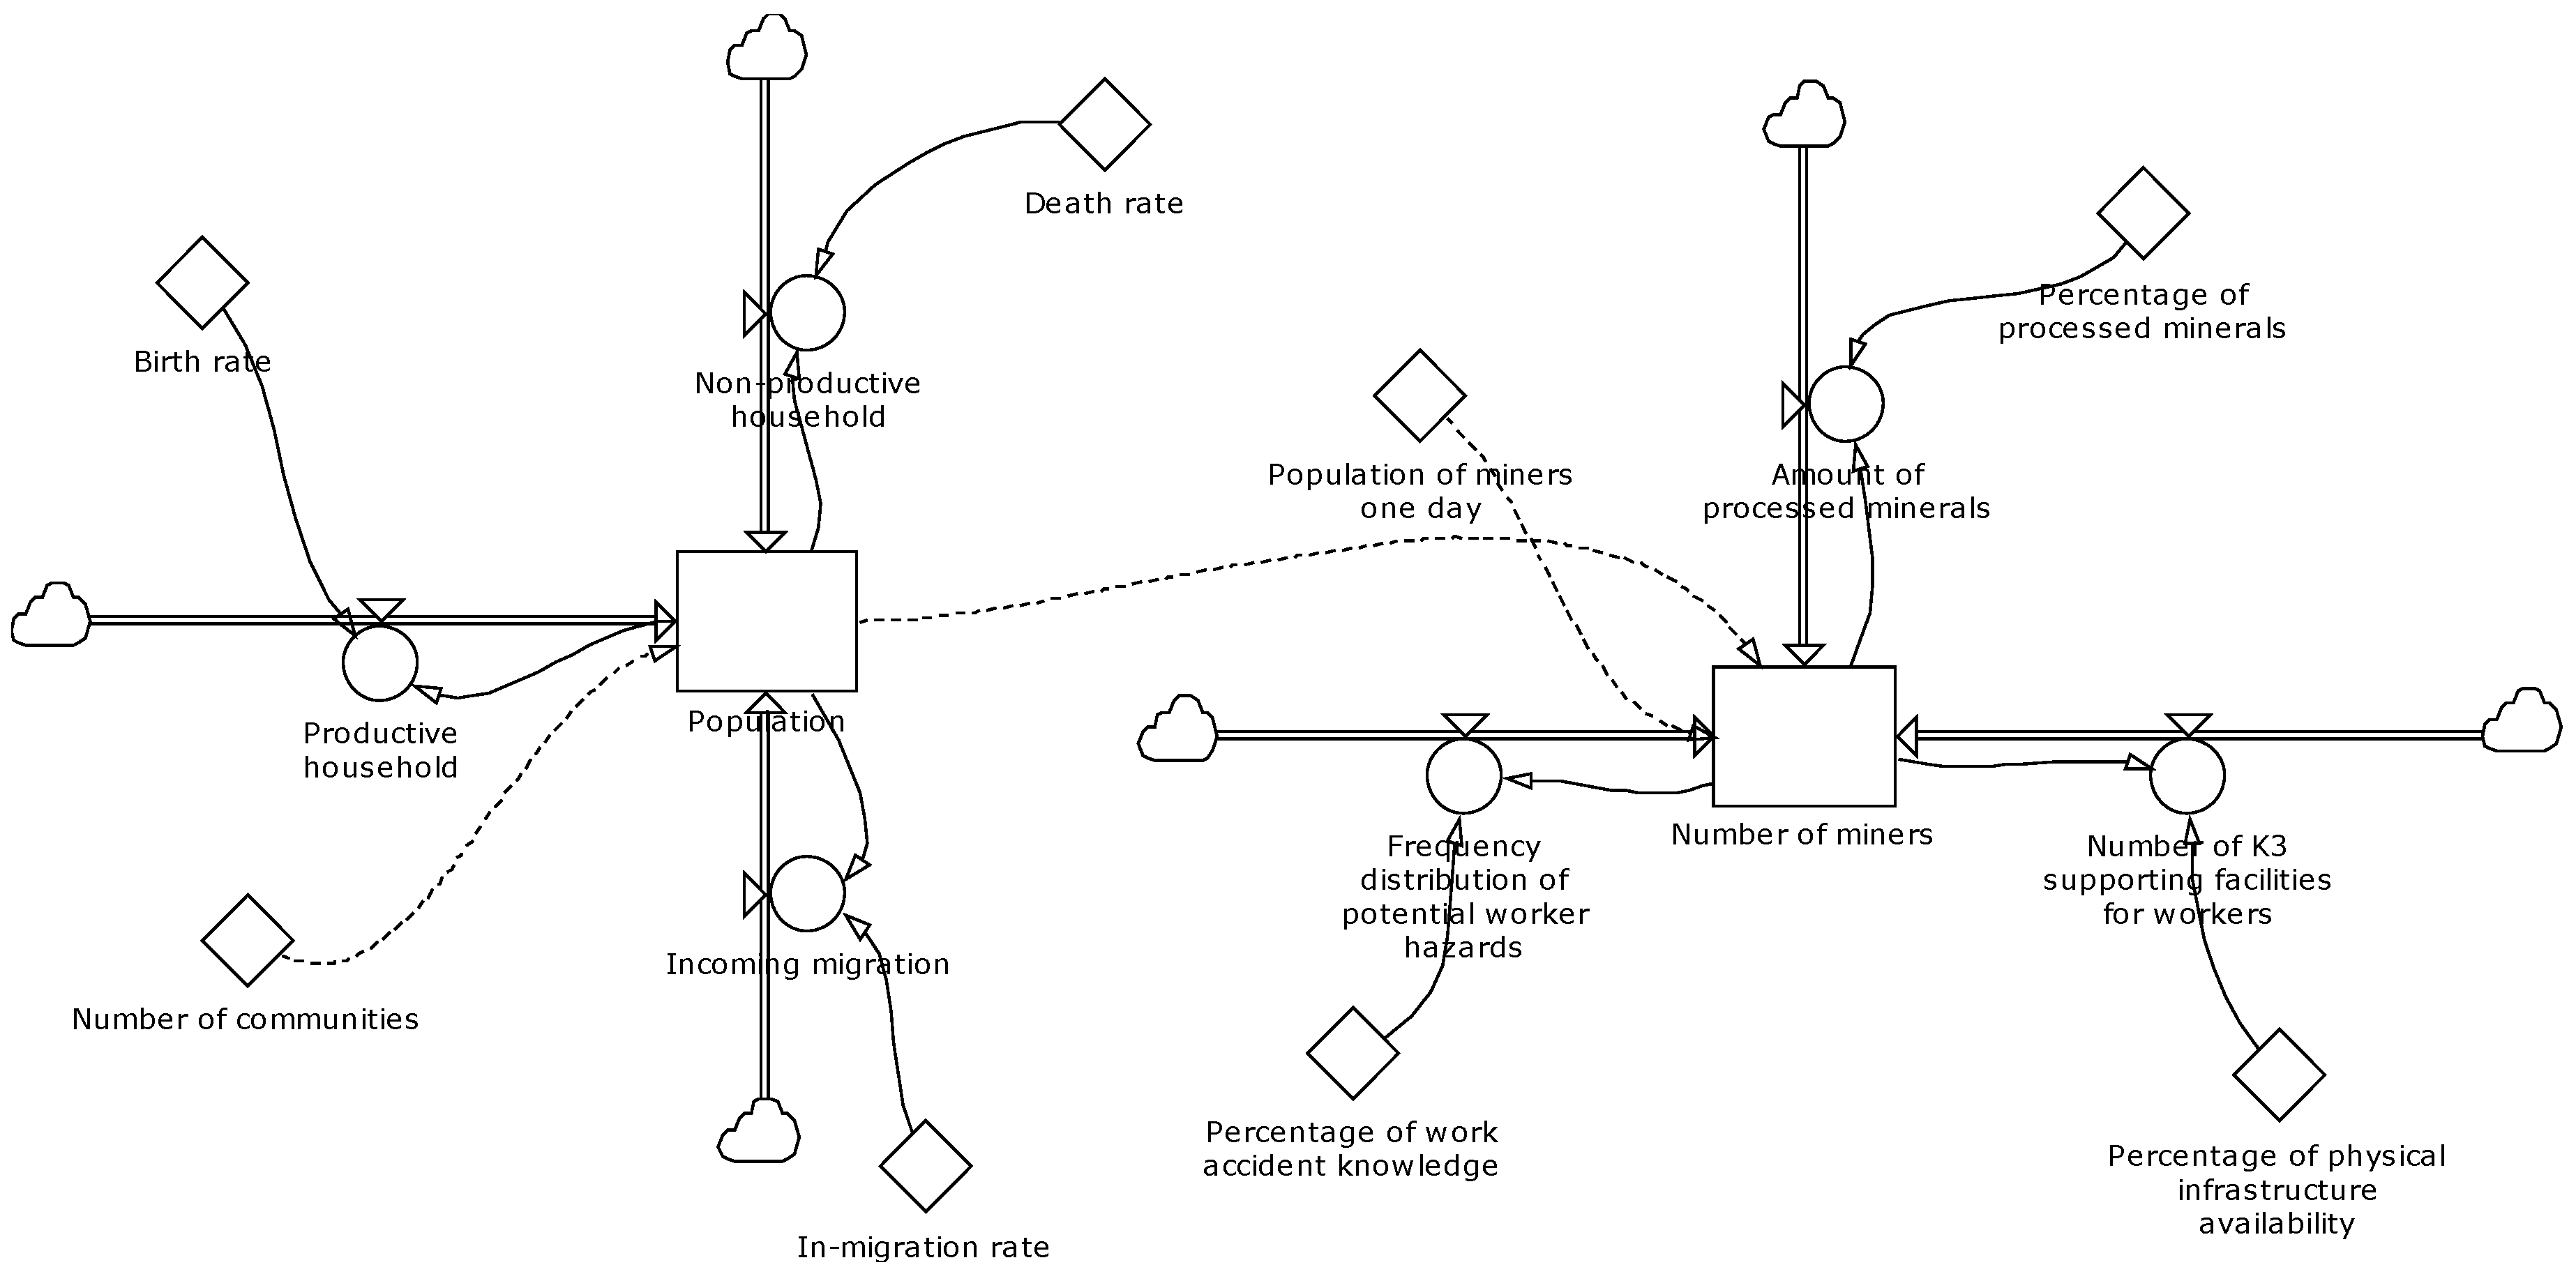
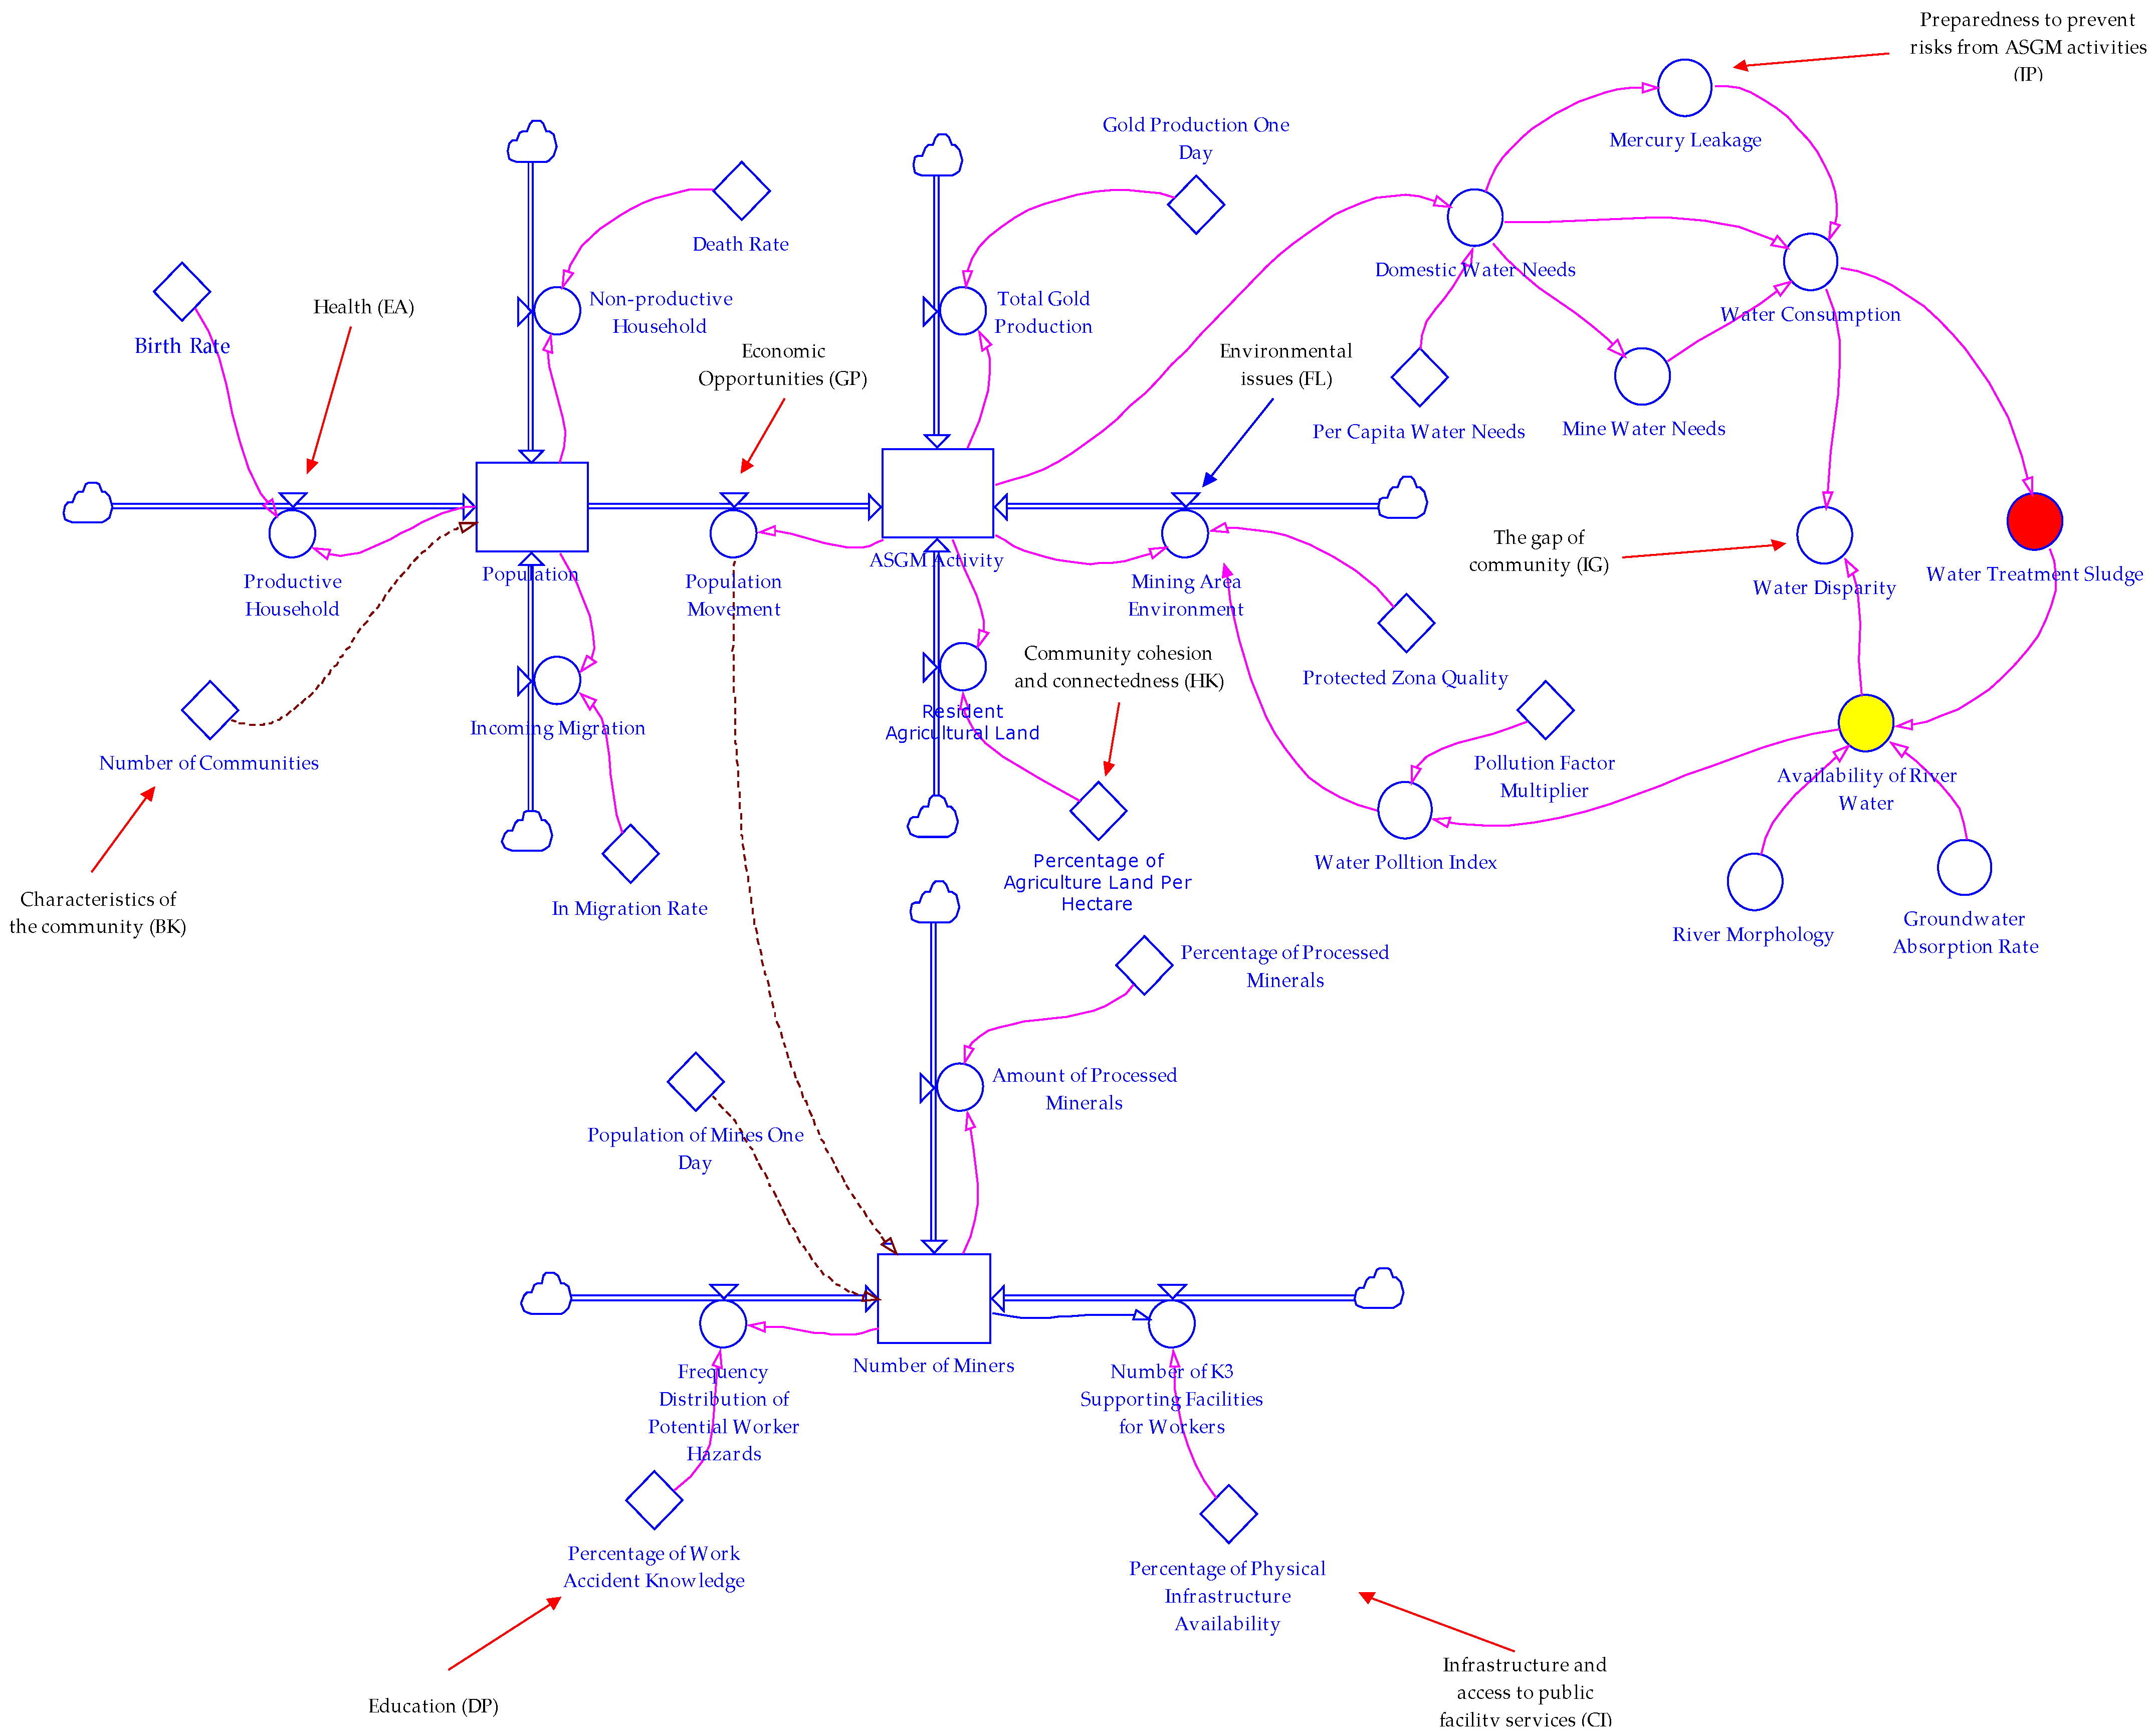
In this section, the researcher thoroughly explains the system dynamics approach for informal ASGM by using prevention methods in the Rarowatu Utara and Lantari Jaya areas. The identification of the results of the dynamic system model in Figure 2 shows two stages comprising input and output to determine the dynamic prevention chain within the framework of the anticipatory model of ASGM activities on population resilience. The first stage is to look at the input prevention factor from the dynamics system chain, as described through the population factor and the number of mine processing workers. This recognition of input prevention still requires further dynamic models that aim to capture causality beyond factors. The second step is to identify factor diagrams of ASGM activity and water availability which are input-continued causality loops and complement prevention models in dynamic system analysis. Most ASGM sites process the same seed material, so these two nodes are verified simultaneously in the dynamic system model. The two proposed models consider the flow of population factors, the number of mining workers, ASGM activities, and the availability of water to and from the mining location based on data obtained from the North Rarowatu and Lantari Jaya areas.
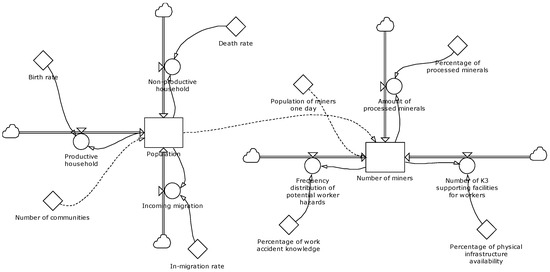
Figure 2.
System dynamics model input prevention approach [34].
The preparation of two dynamic models operationalized by the Powerstudio10 application was built completely in 10 days considering several indicators of observational variables. In this model, the square symbols represent stocks, the double-lined arrows represent flows, and the single-lined arrows represent variables.
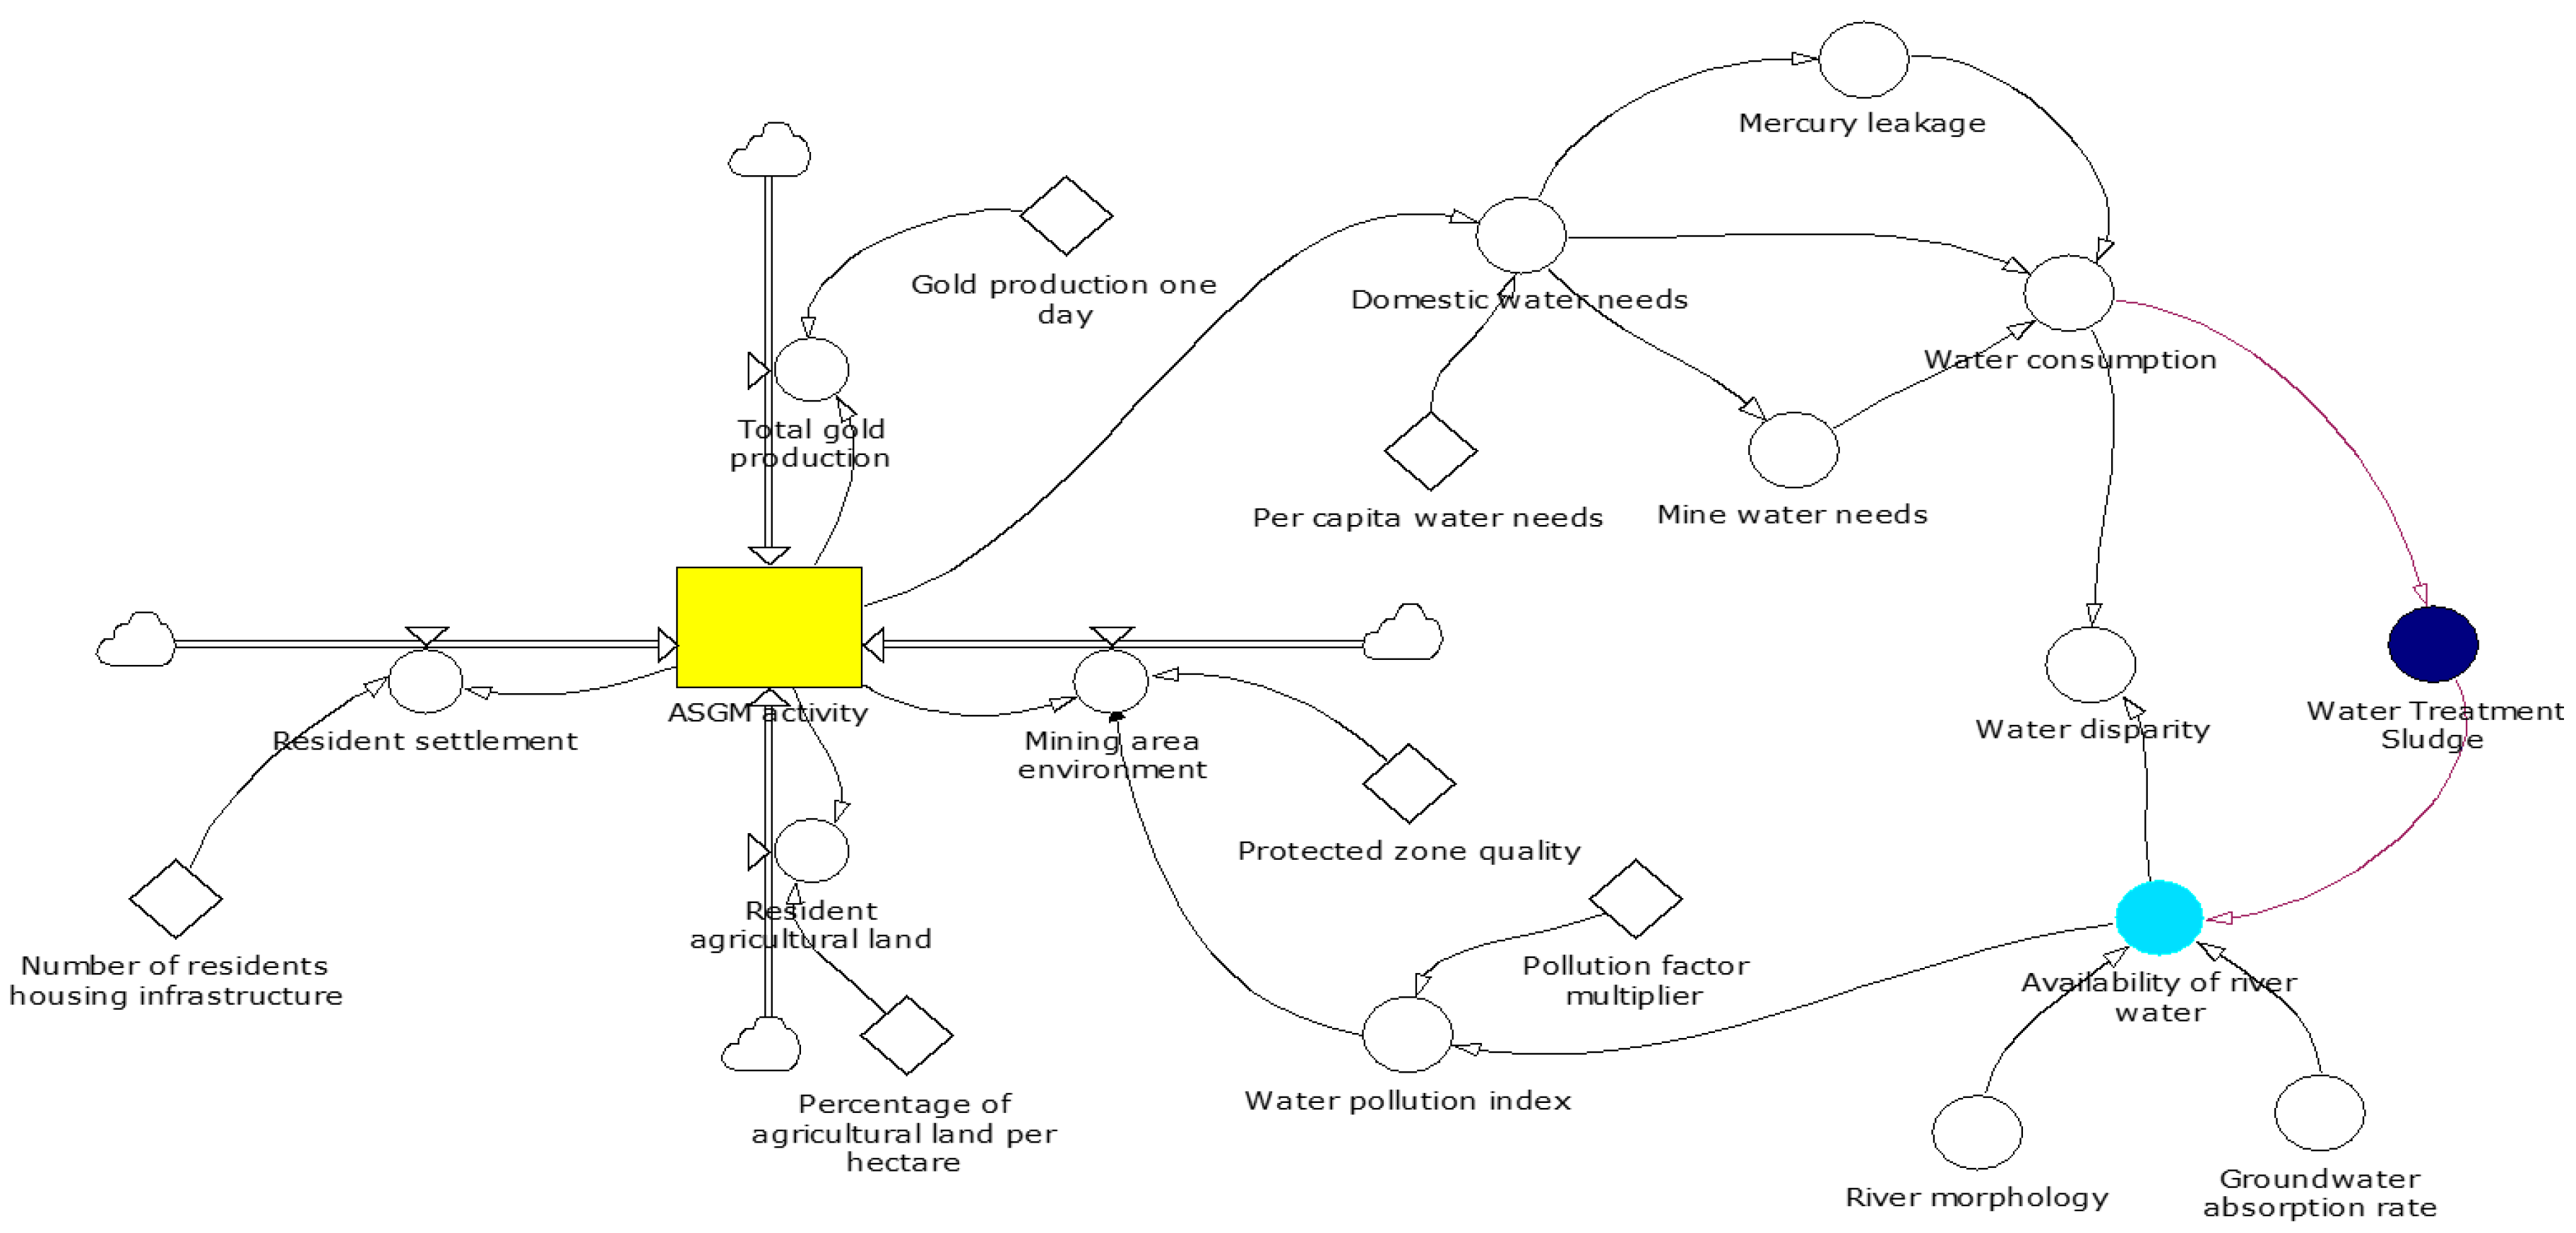
The model above contains two main flow nodes, namely population (millions) and the number of mining workers (person/year). These dynamic flows interact through correlations and data variables collected from focus group discussion interviews. Then, Figure 3 shows the components of ASGM activity flow, which examines the analysis of output prevention on the availability of river water as a result of using processed sources of gold mining materials.
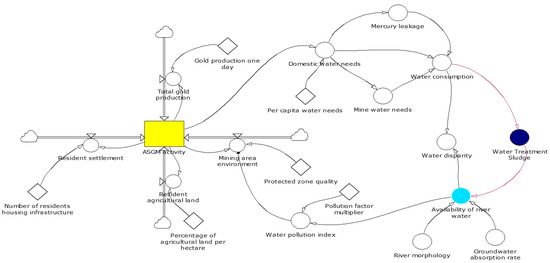
Figure 3.
The system dynamics model of the output prevention approach [34].
As the illustration explains, the stock flow represented by ASGM activity has a dynamic distributive effect on the indicator variables in all directions. Among them are residential areas, representing the amount of infrastructure. The population’s agricultural land represents the percentage of agricultural land per hectare, while total gold pro-duction represents gold production per day. The next cycle assumes that the source of ASGM activity flows from domestic water needs, which represent per capita water needs. Instead, mine water pollution and mercury leakage come from household water sources. The flow rate of water consumption includes the overall share among the four streams. The interaction of water consumption is divided into two-cycle cores: water disparity and water-treatment sludge. For the arrow direction, the water disparity has a validity that is influenced by the flow of river water availability. However, it differs from water-treatment sludge, which is a part of causality that is of great concern, as this variable is the cause of the loss of river water quality levels caused by ASGM impacts (marked by a dark blue circle).
The availability of river water also becomes a dynamic control center point (marked with a light blue circle) representing the morphology of the river and the level of water absorption. It involves the exploration of the indicator value element to determine the prevention factor of ASGM activity. The determinant of water availability is also influenced by the water–pollution index, which represents the multiplier of the pollution factor to determine the quality of the environment around mining. Environmental indicators are the real causality factor in responding to the prevention approach to reduce ASGM externalities. The disabled condition of the environmental sector is endangering the internal aspect and the construction, thereby affecting the resilience of the area concerned.
After a detailed examination of the model, the main point of knowing whether the model can provide insights is to connect an effect-validation system on a predetermined model. The validation function of the model in the dynamics system between input and output prevention is to test how well the verification of the input prevention core sub-system performs through the population and ASGM activity as output prevention. This dynamic prevention model is instructed to conduct conformity verification testing built to the actual model values. The validation of the dynamics model criteria also has a degree of critical level that is relevant to determining whether causality development is considered feasible at the academic level, thus preventing dynamic model errors from occurring.
Based on the general validation test on the dynamic model criteria, the absolute average deviation of the simulation to the actual (AME), with a significance limit of 30%, is used. Although the research is 10 days long, the researchers attempt to compare the two main historical variable data from 2018 to 2022 to test whether the simulation is valid in the dynamic system model (Table 2 and Table 3).
Table 2.
Comparison of AME Validity Population of North Rarowatu and Lantari Jaya Mine Areas [16].
Table 3.
Comparison of AME Validity of ASGM Activities in Rarowatu Utara and Lantari Jaya [17].
3.2. Geographically Weighted Regression Model Results
The model of this article takes ASGM activity as an endogenous variable and nine exogenous variables. The exogenous variables to be included in the GWR analysis are community characteristics, infrastructure and access to public facility services, education, health, environmental issues, economic opportunities, community cohesion and connectedness, inequality within the community, as well as risk prevention readiness regarding ASGM activities. Summarizing the results of the spatial heterogeneity of the factors that influence ASGM, as measured by the AICc score criterion, reveals that the GWR has a better goodness-of-fit than the R -squared value. However, the AICc value is significantly lower than the OLS model (Table 4). The square has a very small number, meaning that the criteria for the model regression results are close to the true value, indicating that the GWR model may have a good metric value for the ASGM activity variable.
Table 4.
Index Model Criteria [18].
Bandwidth here represents the range of determinants that influence ASGM activity. The bandwidth characteristics involve the AICc value where the OLS regression is on a permanent scale, and GWR generates a measure in each of each variable with different bandwidth characteristics. In the GWR results, the regression coefficients on the nine independent variables are significant overall. In the specific scope of the sample, spatial heterogeneity accounts for more than 85% of the total sample. The spatial coefficient states that the results of the regression parameter driving variables in influencing ASGM activities are mostly positive and reflect strong and diverse spatial driving factors (Table 5 and Table 6). Based on the average coefficient, the strongest driving variable is preparedness to prevent the risk of ASGM activities, followed by cohesion estimates on community connectedness and gaps in the community. Infrastructure and access to public facilities services are also the weakest drivers among the estimated variables.
Table 5.
GWR Model Parameter Estimation [18].
Table 6.
GWR Model for North Rarowatu and Lantari Jaya Regions [19].
3.3. Exploring the Preventive Model on ASGM Practices
In this section, we examine previous reviews involving the contribution of the precautionary model and the scenario of residents in mining areas and river water cycle areas in regard to the factors of ASGM activities. Quantitative data collection shows that illegal ASGM activities disrupt the resilience balance of residents around mines, especially the contamination of residents’ river water sources due to the combination of mercury in the gold mining production process. In the following sub-sections, we provide quantitative comparative insights on our findings through data on the determinants affecting ASGM activities between resident scenarios and water availability in the mining area.
3.3.1. Preventive Model Description
In this section, we provide details on the input–output deterrence comparison on the determinants of ASGM activities in both scenarios considered in the simulation and spatial regression models. Data related to nine survey variables were collected and used to analyze the design of the deterrence model against illegal ASGM activities. We analyzed the deterrence model relationship between population scenarios and river water availability in the gold ASGM production areas of North Rarowatu and Lantari Jaya. This relationship was converted into a percentage sequence to predict yearly increased gold production. The deterrence approach sequence is used as input for comparing determinants affecting ASGM activities under population resilience and river water cycle availability scenarios through actual and simulated data analysis.
3.3.2. Implementation of the Preventive Model on ASGM Activity Scenarios
We tested ASGM practice activity scenarios involving population resilience and river water cycle availability to validate the input–output precautionary simulation model. Specifically, we added nine variables as regression models that represent spatial factors affecting ASGM production practice activities. Estimating our observed data over five years, the statistics of small-scale gold mining practices in Rarowatu Utara resulted in approximately 30% and 50% production in Lantari Jaya, both illegal. The complete validation of the prevention simulation model is shown in Figure 4.
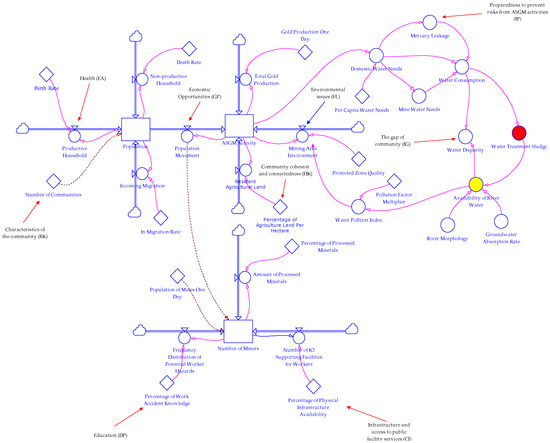
Figure 4.
Prevention Model with ASGM Activity Scenario [36].
The validation of the input–output prevention model presented in Figure 4 shows the integration and activation based on nine determinants that affect ASGM activities throughout the production span. According to our analysis, throughout such a production run, labor, population mobility, and mercury supply decrease by an average of 25% to 40% a year. The impact of the nine factors can be explained as a “precautionary effect” instrument scenario, which is the implementation of policies to reduce the level of mining production while following up on the sustainability of ASGM practices with illegal status.
4. Discussion
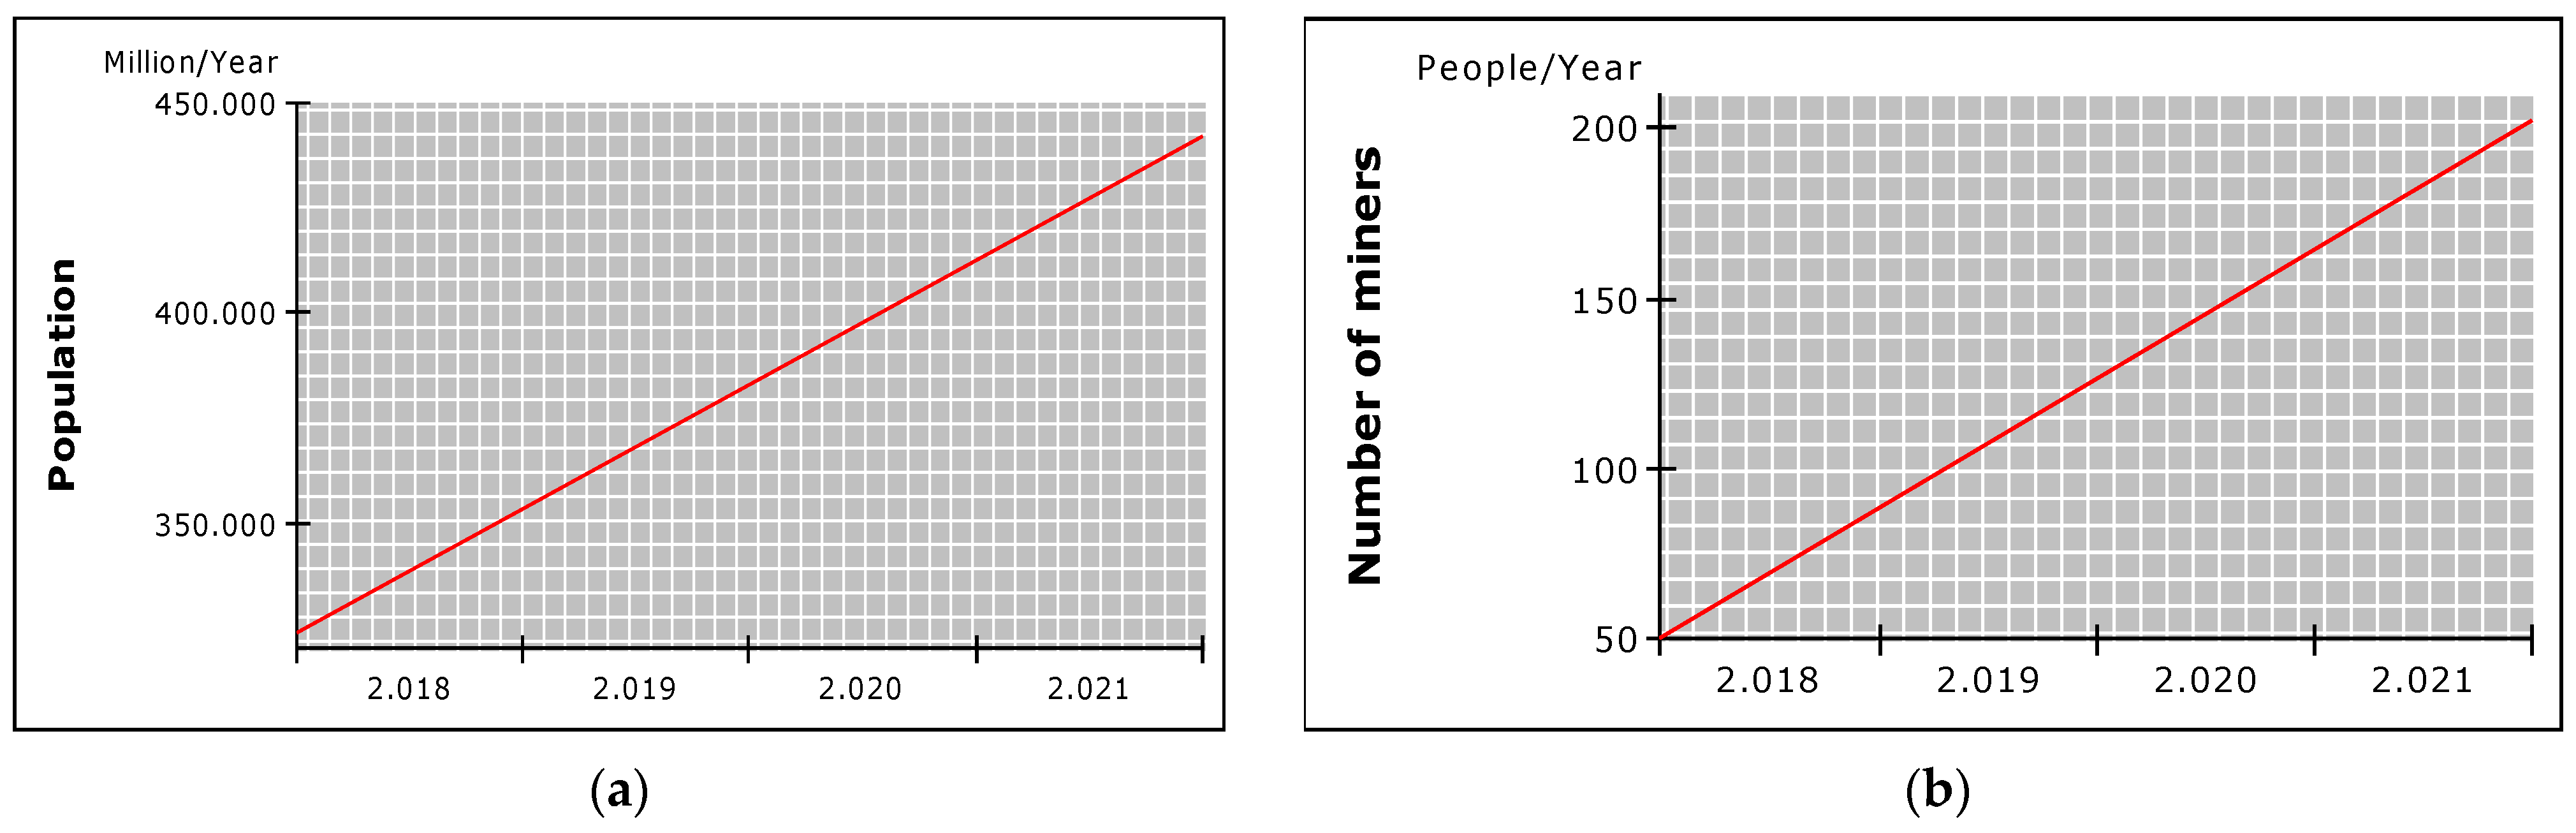
In this literature case study, finding the center for the system dynamic model of ASGM explores input and output prevention scenarios by considering the ratio of the number of workers and the availability of river water as contributing variables that affect population and ASGM activities. At the level of inspection of the simulation analysis, the core observations are found to be similar to the simulation in [36]. This simulation shows that the BAU scale of the population graph continuously grows such that most of the concentration of community workers in Rarowatu Utara and Lantari Jaya has seen an increase in workforce starting in 2019.
The population simulation shows that the causality rate from year to year has begun to increase by 353.501 million/year, followed by an increase in the number of workers at 50 people/year (Figure 5).
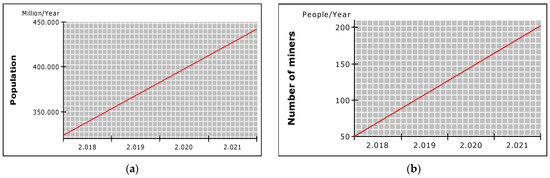
Figure 5.
(a) Graph of Population and (b) Number of Mining Workers [36].
Meanwhile, in 2021, the population decreased by 42%. Even though the population decreased, the continuity of mining workers increased. By applying, the population’s death factor is zero, other than the victims of workers working in the gold mining sector. This procedure follows the approach of [37], stating that the normative prevention of mining workers needs to be supported by harmony in substantial occupational safety and health. Aside from input factors, prevention considerations view the output as an effort to involve ASGM activities in the disasters that have occurred directly. The illegal ASGM in Rarowatu Utara and Lantari Jaya shows that the possibility of sustainable mining practices still poses significant challenges. Empirically, [38] investigate the regulation of functional environmental indicators, especially seeing that river-flow sources are heavily involved in role-playing ASGM activities. Finally, preventive efforts using a structural prevention approach have yet to be able to resolve illegal ASGM activities.
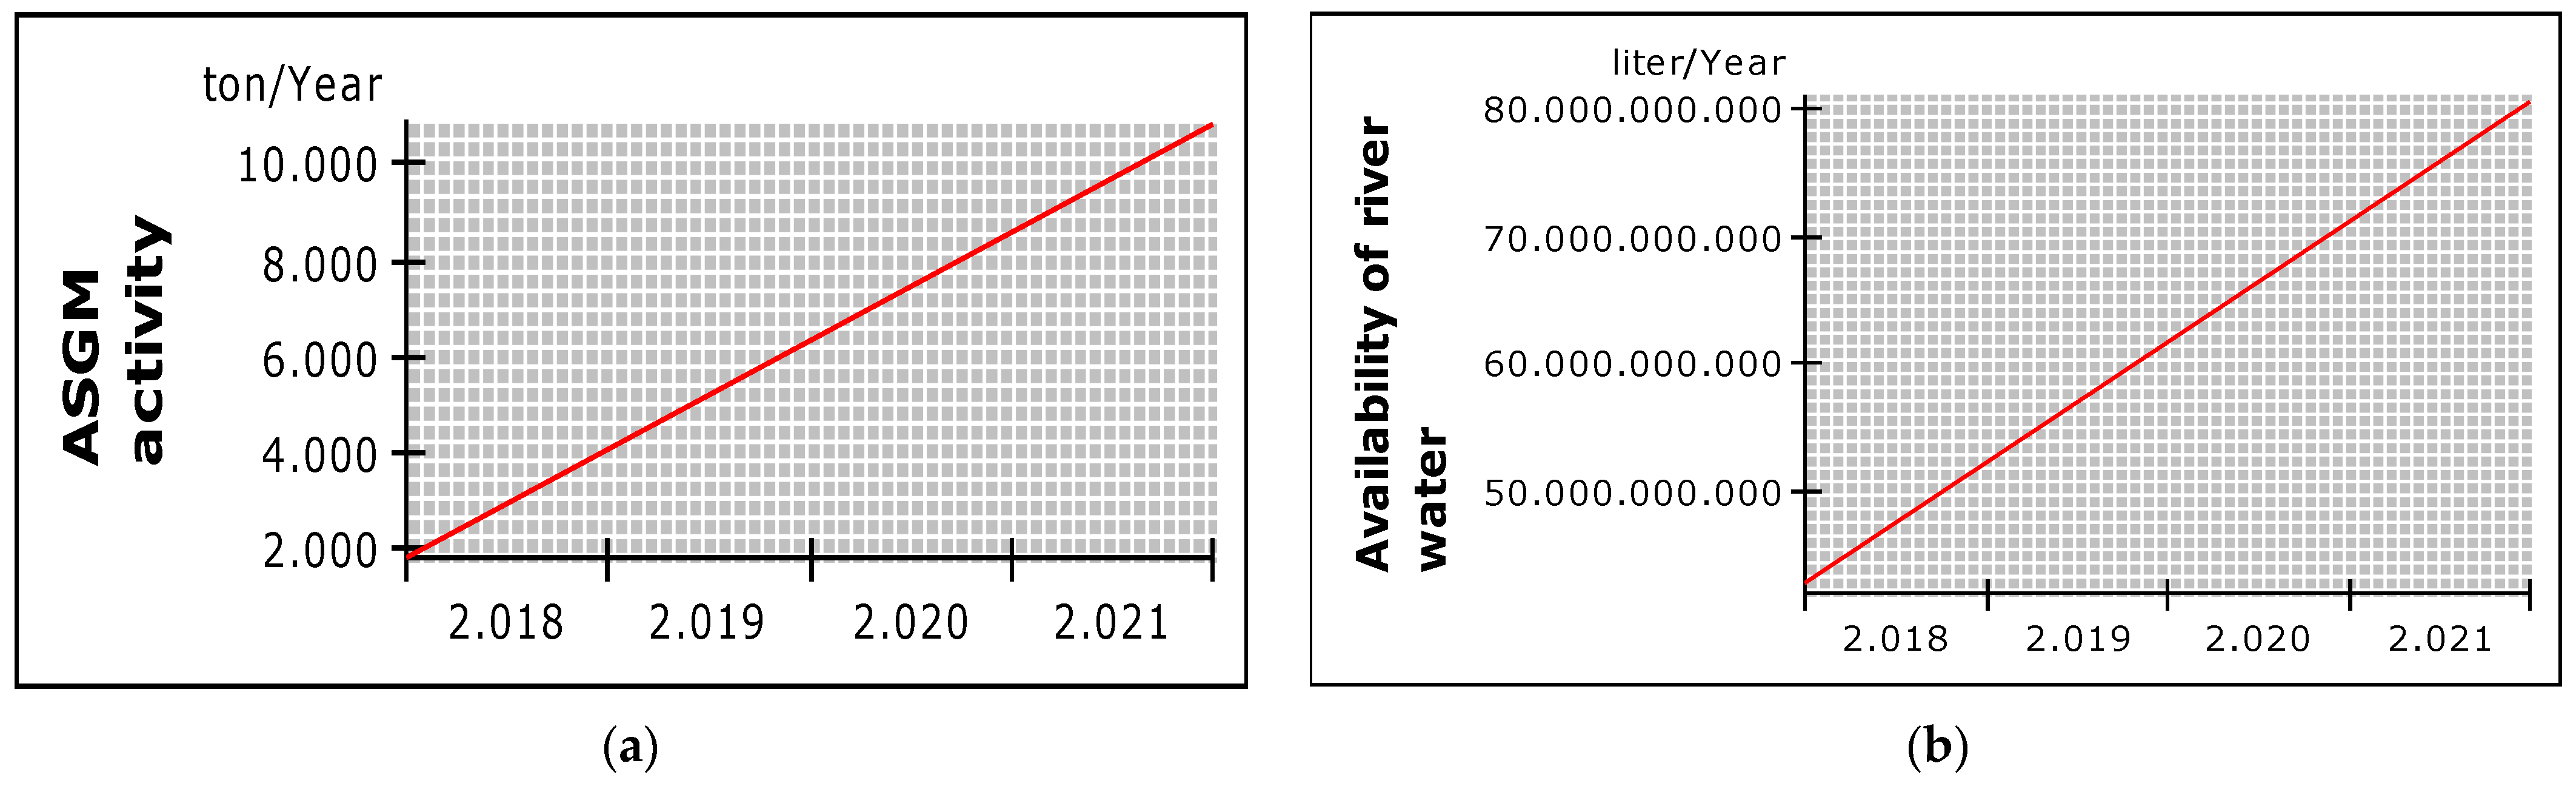
The simulation analysis in Figure 6 shows that ASGM activity is very sensitive to changes in river water levels. The special model of the simulation states that the level of ASGM activity reduces the river water quality by 30% to 50% due to the use of mercury, where the dependence of river water for settlements on people’s land has been contaminated with concentrations of mine sludge or so-called water-treatment sludge. This analysis is similar to that of [39]. They described the expansion of extraction of gold material mines and found that it directly affects the accessibility of domestic clean water supplies at a point measuring the amount of material processing on the time axis per day. The sensitivity of the behavioral determinants of simulated ASGM activities to river water availability indicates a 95% water disparity in the consumption of illegal mercury compared with the amount of mercury for gold production that needs to be reported as legal. This finding indicates that part of the process of using mercury that is available for legal mining supplies is only 5% of the total supply for using mercury.

Figure 6.
(a) Graphic of ASGM activity and (b) Availability of River Water [36].
Some mining practices are notably carried out occasionally by legal facilities, thereby burdening the preventive preparation aspect of the community in dealing with the brutality of mining activities [25,31,32]. The research findings of [26] convey the participation of private institutions, especially the security community, in discussing risk identification in the supply of river water for environmental–sanitation purposes, including the management of mine water using mercury. Regarding the measure of justice and welfare in mining practices, it can be separated into distributive or procedural justice [23,26,29]. This fairness questions the government’s chances of enacting a method to cut the supply of mercury materials as a socialization of reducing water-treatment sludge, which is the best representation of mining methods [22,40]. This intention is in accordance with the study of [22], which stated that the development of smart-sensitivity water prevention can prepare river water infrastructure, i.e., the application of slum water as alternative disposal management for mining waste (utilizing artificial groundwater absorption) and filtering mercury content. This aim is to reduce the pollution index in water.
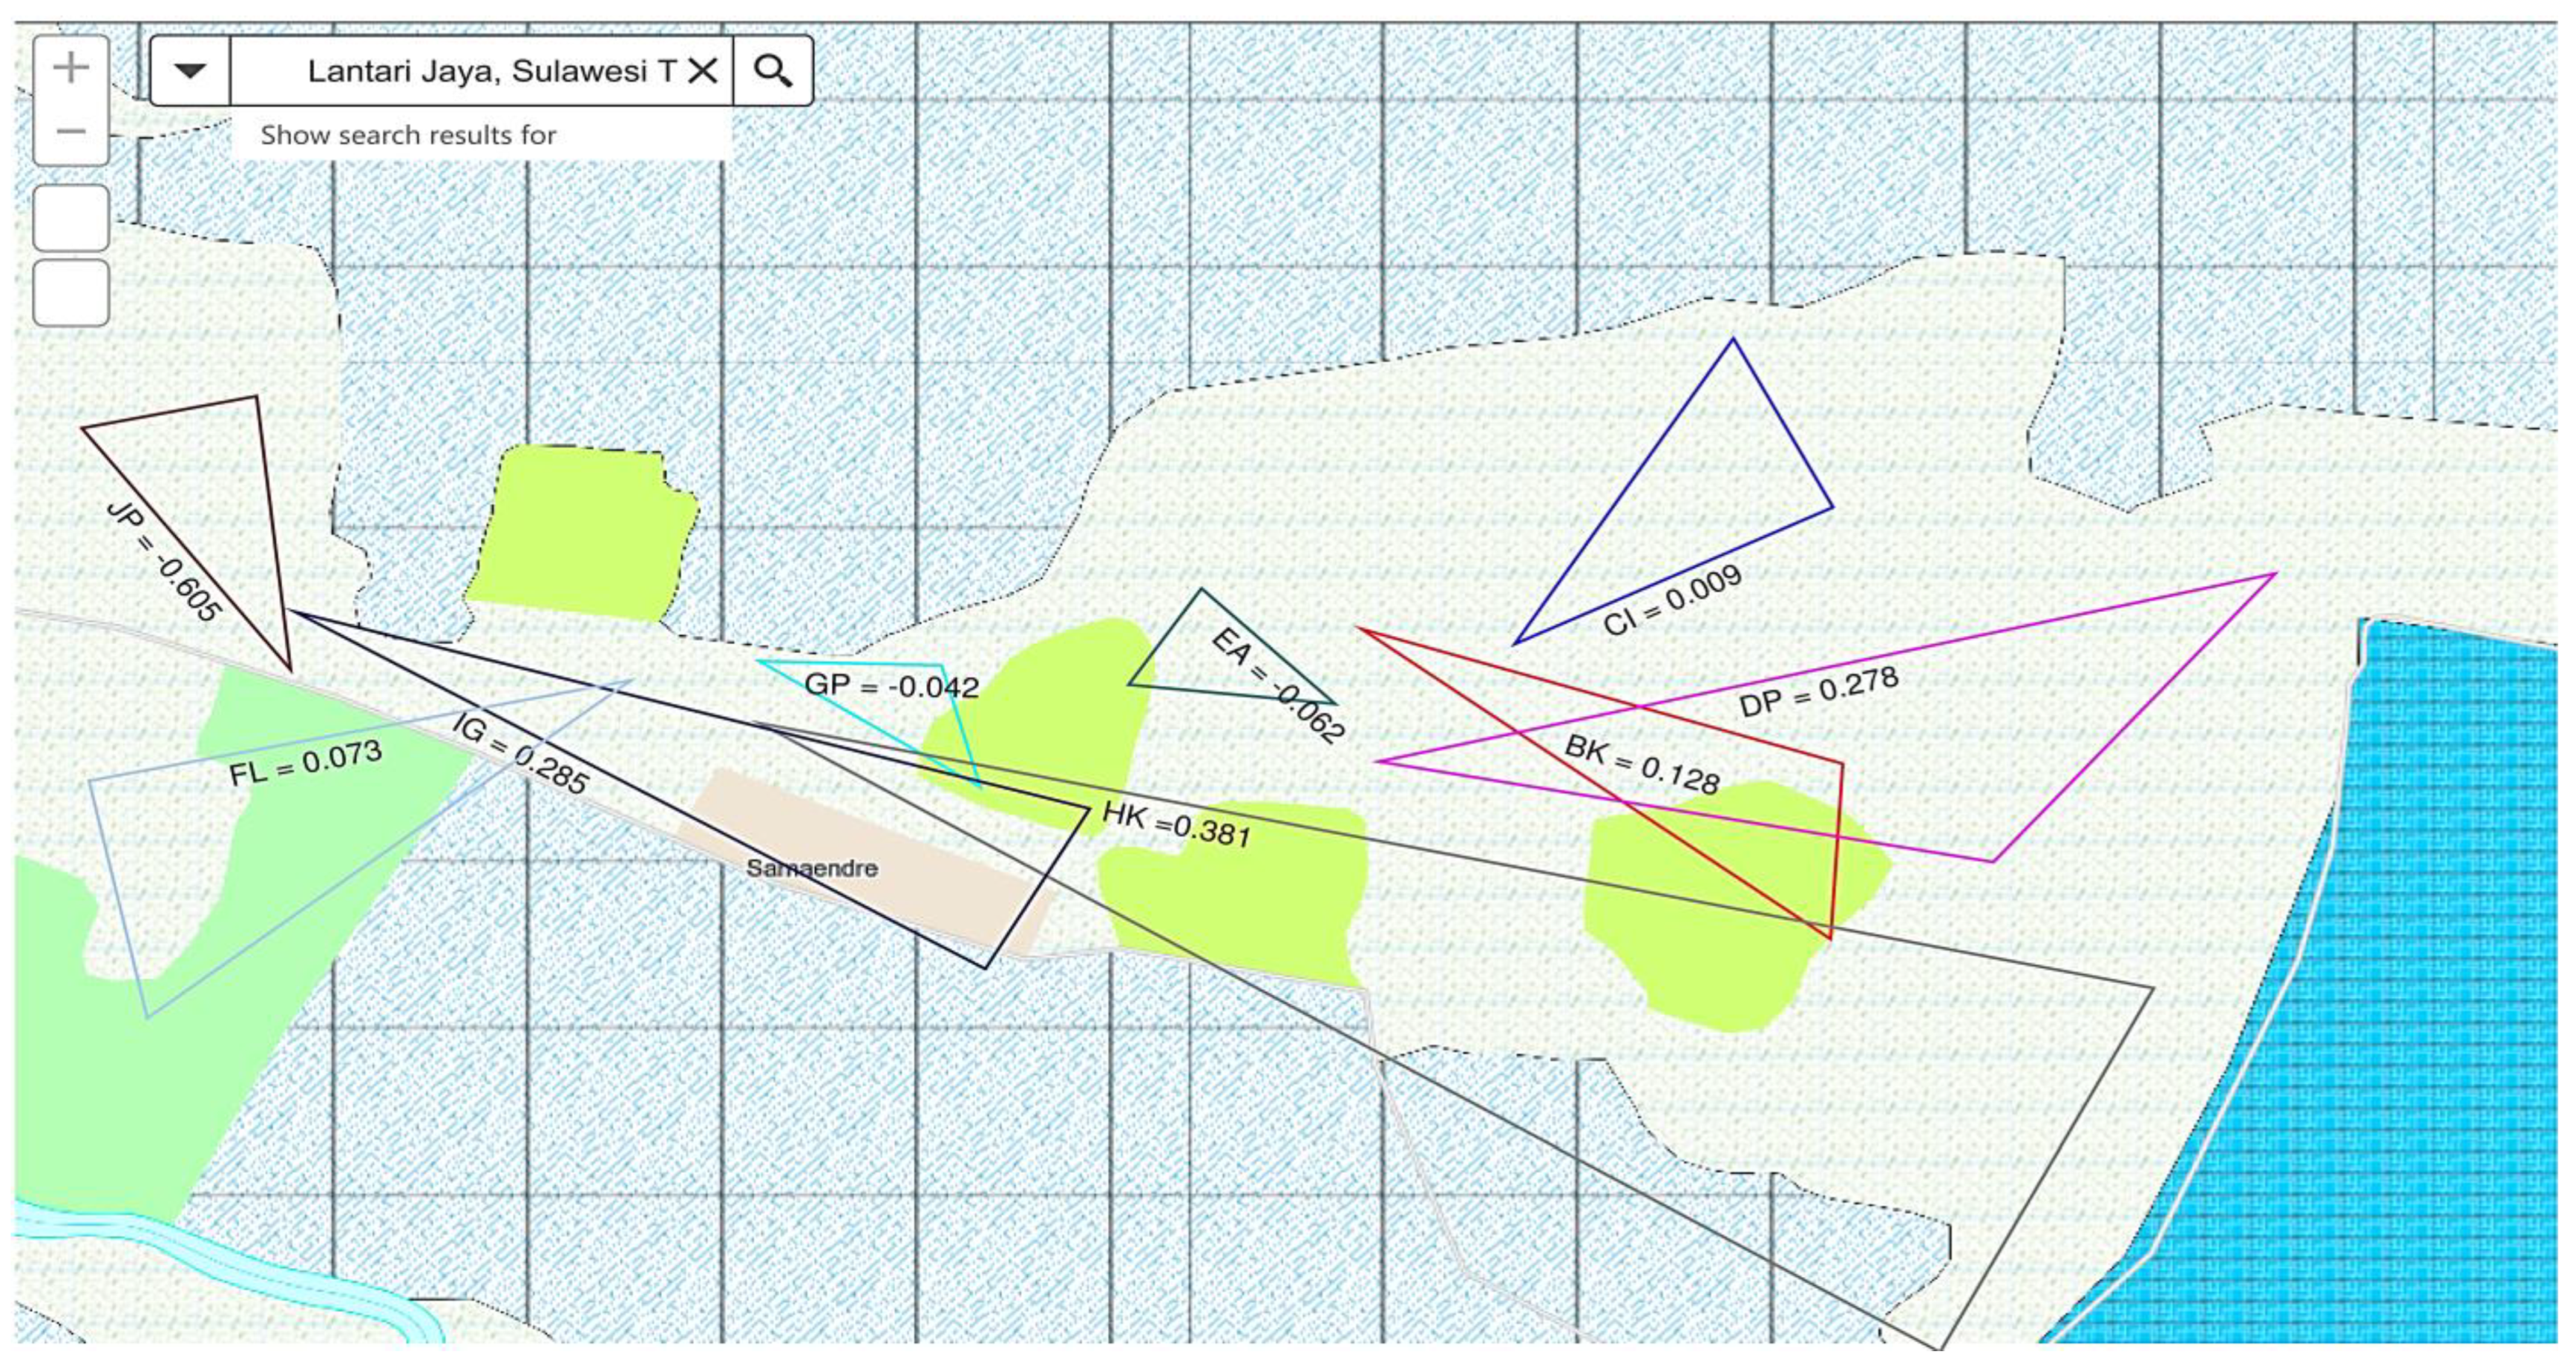
The current approach that must be continued in sharpening the analysis of ASGM prevention in North Rarowatu and Lantari Jaya is to identify spatial factors in the location of people in the mining area. Spatial regression is an accurate method of determining the intensity-scale bandwidth of the distribution coefficient pattern of the control variable in an area. Bandwidth here represents the range of configuration distances in which the factors to be tested affect ASGM activity. The GWR experimental set is used to test the elimination scale that manages to enter significance at the critical 1% and 5% levels by using geospatial provisions to demonstrate the distribution of variables. Results are shown in Figure 7 and Figure 8. The spatial variation in the estimated coefficients emerging from the two GWR models is mapped by Figure 3 and Figure 4. The relative urgency of the confidence level is established for each local model with covariate values at each spatial location.
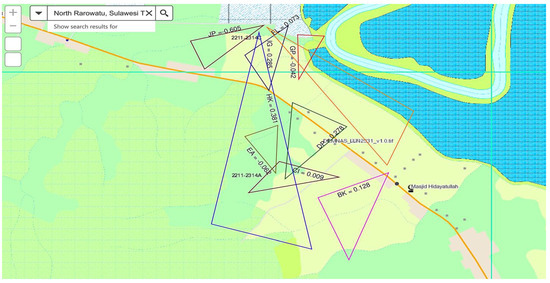
Figure 7.
The spatial distribution coefficients in North Rarowatu are shown by the colored triangular lines. Criteria (γi) = 2,097,337,989.
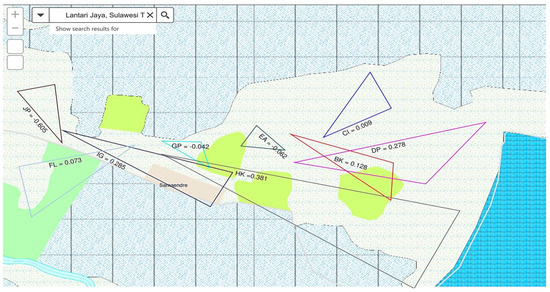
Figure 8.
The spatial distribution coefficients in Lantari Jaya are shown by the colored triangular lines. Criteria (γi) = 2,424,894,809.
The GWR coefficient models further apply the same kernel bandwidth and include the entire set of covariates in the distribution of partial coefficients in each local regression model. The estimated GWR approach at the spatial status level provides an alternative interpretation of local regression through model selection and optimization of local bandwidth. The reliability of the spatial construct model builds on the previous GWR study by [41], in which the analytic advantage is examined when the identification of regression coefficients, non-constant bandwidth, and selection of covariates are determined locally. This model combines the characteristics of the spatial regression test, but its main purpose has different explanations from the study of [42]. They authors found that the modeling focus on the variation in the non-stationary error rate of the GWR analysis is corrected by parametric methods and cointegrated to prevent the assumption of collinearity of local GWR coefficients through a multidimensional-GWR approach [28,30].
The spatial patterns of ASGM activities in the two regions are influenced by the largest variable coefficients, namely community cohesion and connectedness, followed by community gap variables, community characteristics, the cohesion of connectedness, education, health, service infrastructure, environmental problems, and economic opportunities. A comparison of the spatial results of [43] suggests that changes influence ASGM activity in terms of weather or climate, geological land-forms, and landscape ecology. Their research method is centered on the flood disaster diversification model, which analyzes mining characteristics and reflects the relationship between elements influencing one another. The spatiotemporal data spectrum examined in this study uses the relevant observation equivalent of 86% of ASGM activity zones. The modeling of the two mining areas has different GWR coefficient values. The GWR model formulated for each region shows the amount of verification to assess the extent to which the spatial regression establishes an accurate significance criterion in determining the vulnerability of the test area, which is shown in the following.
Based on the analysis of nine exogenous variables on the impact of population resilience in areas vulnerable to mining activities, this paper shows the interpretation of local changes in observations in selected areas of the diagnosis of estimates that GWR has analyzed. Systematic monitoring of the impact of ASGM activities on the locals’ resilience, such as environmental damage to settlements, gold mining casualties, and inter-community conflicts, can be interpreted as externalities of the mining as a serious preventive approach, as it causes rehabilitation failures due to underground mining on the surface. In line with the idea of sustainable extraction of natural resources, it can play an important role when mining activities have negative social responses related to the progress of environmental changes. The explanation of spatial data and other verification data listed in this article is expanded by emphasizing data collection and processing as initial data that utilize GWR-modeling algorithms that study the accuracy and classification characteristics of mine prevention structures in each region.
Several limitations of our study may affect the implications of the findings for prevention models regarding ASGM activities. First, this study was designed to review the impact of illegal ASGM and did not include mining actors who already have official permit certificates in both regions. Second, the focus of the prevention management we analyzed only looked at two scenarios supporting residents’ resilience: labor and the availability of river water that is frequently used and vulnerable to mercury dregs in the gold mining process. In addition, the literature we obtained needs to provide more information related to prevention models on population resilience in terms of the multidimensionality of conflict, especially the preposition of the struggle for livelihoods between mining and agricultural production. Therefore, further research on mining conflicts needs to be re-proposed in reviewing the involvement of production freedom. Lastly, our data on the nine determinant variables of ASGM activities have limitations in regard to informing in-depth research methods across the various social, economic, and environmental factors that influence ASGM activities.
5. Conclusions
This study explicitly describes the chain of defense of population resilience and its impact on ASGM activities for mining-prevention methods in Rarowatu Utara and Lantari Jaya. Explicit analysis of ASGM prevention findings involved system dynamics capital and spatial analysis distances, as well as quantifying population resilience factor components and spatial correlations by examining mine prevention systems. The scale scenario for testing the dynamics of the ASGM prevention system also shows system transparency divided into two aspects, namely input and output. The input prevention simulation results yield an actual accuracy of 26.55% compared with the actual output prevention result, which validates the proposed model of 0.052%. Studies have noted that gold production, which has increased by 30–50%, results in hydrological pollution due to mercury content, additional worker deaths, and damage to resident ecosystems. These events have never stopped, and there were minimal prevention capabilities in the days before illegal ASGM occurred.
This analysis can be continued with other models of approach, such as discrete event simulations; however, identifying the consistency of the area and its impacts is followed explicitly through geospatial distance analysis. This chain of analysis is called the GWR, which highlights the spatial transparency of the population area around the mine and its influence on ASGM activities, including symptoms of the socioeconomic community before and after mining occurs. Given the large number of mining activities in these two observation areas, the analysis of this study broadens the horizons of predicting quantitative values on the variables involved, such as community characteristics, environment, education and health, infrastructure, economy, community cohesion, community gaps, and readiness to prevent ASGM risks. The analysis performs a refill process to obtain an active effect on spatial regression. The accuracy proven by this study shows that community cohesion and connectedness are the effective variables and, simultaneously, the largest coefficients in the entire spatial regression system. This pattern occurs because this influence is very vulnerable to highlighting the limits of the population’s resilience and the openness of society to accept and filter out all dependencies on the mining sector.
This research design is an early concept of thinking about the impact of ASGM, which uses two modalities, namely system dynamics and GWR, to generate quantitative values. They have been previously explored, albeit only qualitatively, in empirical studies. This research establishes two sets of multiple models to detect the variance of mining-prevention methods in two regions with different external variables. By combining these two analytical methods, this research provides an optimal input–output policy model for mining-prevention decision-making related to ASGM activities in Raro-watu Utara and Lantari Jaya, and thus minimizing illegal miners, while maintaining the resilience of local communities.
Author Contributions
Conceptualization, R.M., K.W. and H.H.; methodology, R.M.; software, R.M.; validation, K.W. and H.H.; formal analysis, R.M., K.W. and H.H.; investigation, K.W.; resources, K.W.; data curation, R.M.; writing—original draft preparation, R.M., K.W. and H.H.; writing—review and editing, R.M., K.W. and H.H.; visualization, R.M.; supervision, K.W. and H.H.; project administration, K.W.; funding acquisition, K.W. All authors have read and agreed to the published version of the manuscript.
Funding
This work was supported by the Hibah Publikasi Terindeks Internasional (PUTI) Q1, Directorate of Research and Development, Universitas Indonesia [grant numbers NKB-1101/UN2.RST/HKP.05.00/2022.
Institutional Review Board Statement
Declaration of Helsinki and approved by the Research Ethics Committee, Faculty of Medicine, Universitas Sebelas Maret, (protocol code 141/UN27. 06.11/KEP/EC/2022 and date of approval on 4 November 2022).
Informed Consent Statement
Not applicable.
Data Availability Statement
Data are contained within the article.
Acknowledgments
Thank to Basri and enumerator team from Makassar.
Conflicts of Interest
The authors declare no conflicts of interest.
References
- Spiegel, S.J.; Agrawal, S.; Mikha, D.; Vitamerry, K.; Le Billon, P.; Veiga, M.; Konolius, K.; Paul, B. Phasing Out Mercury? Ecological Economics and Indonesia’s Small-Scale Gold Mining Sector. Ecol. Econ. 2018, 144, 1–11. [Google Scholar] [CrossRef]
- Muthuri, J.N.; Jain, A.; Ndegwa, A.A.; Mwagandi, S.M.; Tagoe, N.D. The Impact of Covid-19 on Gold and Gemstone Artisanal and Small-Scale Mining in Sub-Saharan Africa: The Case of Ghana and Kenya. Afr. J. Manag. 2021, 7, 121–147. [Google Scholar] [CrossRef]
- Brosse, S.; Grenouillet, G.; Gevrey, M.; Khazraie, K.; Tudesque, L. Small-Scale Gold Mining Erodes Fish Assemblage Structure in Small Neotropical Streams. Biodivers. Conserv. 2011, 20, 1013–1026. [Google Scholar] [CrossRef]
- Ince, C. Reusing Gold-Mine Tailings in Cement Mortars: Mechanical Properties and Socio-Economic Developments for the Lefke-Xeros Area of Cyprus. J. Clean. Prod. 2019, 238, 117871. [Google Scholar] [CrossRef]
- Katz-Lavigne, S. Artisanal Copper Mining and Conflict at the Intersection of Property Rights and Corporate Strategies in the Democratic Republic of Congo. Extr. Ind. Soc. 2019, 6, 399–406. [Google Scholar] [CrossRef]
- Betancur-Corredor, B.; Loaiza-Usuga, J.C.; Denich, M.; Borgemeister, C. Gold Mining as a Potential Driver of Development in Colombia: Challenges and Opportunities. J. Clean. Prod. 2018, 199, 538–553. [Google Scholar] [CrossRef]
- Ngom, N.M.; Baratoux, D.; Bolay, M.; Dessertine, A.; Abass Saley, A.; Baratoux, L.; Mbaye, M.; Faye, G.; Yao, A.K.; Kouamé, K.J. Artisanal Exploitation of Mineral Resources: Remote Sensing Observations of Environmental Consequences, Social and Ethical Aspects. Surv. Geophys. 2023, 44, 225–247. [Google Scholar] [CrossRef]
- Engels, B. Nothing Will Be as before: Shifting Political Opportunity Structures in Protests against Gold Mining in Burkina Faso. Extr. Ind. Soc. 2018, 5, 354–362. [Google Scholar] [CrossRef]
- Ruban, D.A.; Yashalova, N.N. “Greening” Business Ethics in Gold Mining: Evidence from the Codes of Conduct. Resour. Policy 2021, 74, 102322. [Google Scholar] [CrossRef]
- Matlaba, V.J.; Mota, J.A.; Maneschy, M.C.; Filipe dos Santos, J. Social Perception at the Onset of a Mining Development in Eastern Amazonia, Brazil. Resour. Policy 2017, 54, 157–166. [Google Scholar] [CrossRef]
- Hong, S.-Y.; Bal, A.; Badurdeen, F.; Agioutantis, Z.; Hicks, S. Evaluation of Bunker Size for Continuous/Discrete Flow Systems by Applying Discrete Event Simulation: A Case Study in Mining. Simul. Model. Pract. Theory 2020, 105, 102155. [Google Scholar] [CrossRef]
- Entwistle, J.A.; Hursthouse, A.S.; Marinho Reis, P.A.; Stewart, A.G. Metalliferous Mine Dust: Human Health Impacts and the Potential Determinants of Disease in Mining Communities. Curr. Pollut. Rep. 2019, 5, 67–83. [Google Scholar] [CrossRef]
- Mactaggart, F.; Mcdermott, L.; Tynan, A.; Whittaker, M.; Mactaggart, F.; Mcdermott, L.; Tynan, A.; Whittaker, M. Exploring The Broader Health and Well-Being Outcomes of Mining Communities in Low- and Middle-Income Countries: A Systematic Review. Glob. Public Health 2016, 8, 899–913. [Google Scholar] [CrossRef] [PubMed]
- Fannam, V.; Afrifa-yamoah, E.; Adusei-asante, K.; John, E.; Etten, V.; Frimpong, K.; Adjei, I.; Oosthuizen, J. Construct Validity and Invariance Assessment of The Social Impacts of Occupational Heat Stress Scale (SIOHSS) Among Ghanaian Mining Workers. Sci. Total Environ. 2021, 7, 144–150. [Google Scholar]
- Ishardanti, R. Social impact analysis on environmental conflict dynamics at coal fired steam power plant. Interact. Community Engagem. Soc. Environ. 2023, 1, 1. [Google Scholar] [CrossRef]
- Tamara Michaelis, L.B.; Mazzoleni, M. Capturing Flood-Risk Dynamics with a Coupled Agent-Based and Hydraulic Modelling Framework. Hydrol. Sci. J. 2020, 65, 1458–1473. [Google Scholar] [CrossRef]
- Laing, T. The Economic Impact of the Coronavirus 2019 (Covid-2019): Implications for the Mining Industry. Extr. Ind. Soc. 2020, 7, 580–582. [Google Scholar] [CrossRef] [PubMed]
- Morgan, V.L.; Casso-Hartmann, L.; Velez-Torres, I.; Vanegas, D.C.; Muñoz-Carpena, R.; McLamore, E.S.; Kiker, G.A. Modeling Exposure Risk and Prevention of Mercury in Drinking Water for Artisanal-Small Scale Gold Mining Communities. Hum. Ecol. Risk Assess. Int. J. 2021, 27, 1492–1508. [Google Scholar] [CrossRef]
- Wang, Z.; Xiao, J.; Wang, L.; Liang, T.; Guo, Q.; Guan, Y.; Rinklebe, J. Elucidating the Differentiation of Soil Heavy Metals under Different Land Uses with Geographically Weighted Regression and Self-Organizing Map. Environ. Pollut. 2020, 260, 114065. [Google Scholar] [CrossRef]
- Mariet, A.; Gauthier-manuel, H.; Bégeot, C.; Gimbert, F. Impact Assessment of Legacy Wastes from Ancient Mining Activities on Current Earthworm Community. J. Hazard. Mater. 2020, 3, 122–126. [Google Scholar] [CrossRef]
- Que, S.; Awuah-offei, K.; Demirel, A.; Wang, L.; Demirel, N.; Chen, Y. Comparative Study of Factors Affecting Public Acceptance of Mining Projects: Evidence from USA, China and Turkey. J. Clean. Prod. 2019, 2, 117–124. [Google Scholar] [CrossRef]
- Dietler, D.; Farnham, A.; Loss, G.; Fink, G.; Winkler, M.S. Impact of Mining Projects on Water and Sanitation Infrastructures and Associated Child Health Outcomes: A Multi-Country Analysis of Demographic and Health Surveys (DHS) in Sub-Saharan Africa. Global. Health 2021, 17, 70. [Google Scholar] [CrossRef] [PubMed]
- Syahrir, R.; Wall, F.; Diallo, P. Socio-Economic Impacts and Sustainability of Mining, a Case Study of the Historical Tin Mining in Singkep Island-Indonesia. Extr. Ind. Soc. 2020, 7, 1525–1533. [Google Scholar] [CrossRef]
- Oyarzo, M.; Paredes, D. The Impact of Mining Taxes on Public Education: Evidence for Mining Municipalities in Chile. Resour. Policy 2018, 5, 101–207. [Google Scholar] [CrossRef]
- Sincovich, A.; Gregory, T.; Wilson, A.; Brinkman, S.; Sincovich, A.; Gregory, T.; Wilson, A.; Brinkman, S.; Sincovich, A.; Gregory, T.; et al. The Social Impacts of Mining on Local Communities in Australia. Rural Soc. 2018, 16, 18–34. [Google Scholar] [CrossRef]
- Tepanosyan, G.; Sahakyan, L.; Belyaeva, O.; Asmaryan, S.; Saghatelyan, A. Continuous Impact of Mining Activities on Soil Heavy Metals Levels and Human Health. Sci. Total Environ. 2018, 639, 900–909. [Google Scholar] [CrossRef] [PubMed]
- Marimuthu, R.; Sankaranarayanan, B.; Mithun, S.; Beatriz, A.; De Sousa, L.; Karuppiah, K. Assessment of Key Socio-Economic and Environmental Challenges in The Mining Industry: Implications for Resource Policies in Emerging Economies. Sustain. Prod. Consum. 2021, 17, 814–830. [Google Scholar] [CrossRef]
- Amirshenava, S.; Osanloo, M. A Hybrid Semi-Quantitative Approach for Impact Assessment of Mining Activities on Sustainable Development Indexes. J. Clean. Prod. 2019, 218, 823–834. [Google Scholar] [CrossRef]
- Upadhyay, A.; Laing, T.; Kumar, V.; Dora, M. Exploring Barriers and Drivers to the Implementation of Circular Economy Practices in the Mining Industry. Resour. Policy 2021, 72, 102037. [Google Scholar] [CrossRef]
- Della Bosca, H.; Gillespie, J. The Coal Story: Generational Coal Mining Communities and Strategies of Energy Transition in Australia. Energy Policy 2018, 120, 734–740. [Google Scholar] [CrossRef]
- Segerstedt, E.; Abrahamsson, L. Diversity of Livelihoods and Social Sustainability in Established Mining Communities. Extr. Ind. Soc. 2019, 6, 610–619. [Google Scholar] [CrossRef]
- Raitio, K.; Allard, C.; Lawrence, R. Mineral Extraction in Swedish Sápmi: The Regulatory Gap between Sami Rights and Sweden’s Mining Permitting Practices. Land Use Policy 2020, 99, 105001. [Google Scholar] [CrossRef]
- Domingues, M.S.Q.; Baptista, A.L.F.; Diogo, M.T. Engineering Complex Systems Applied to Risk Management in The Mining Industry. Int. J. Min. Sci. Technol. 2017, 27, 611–616. [Google Scholar] [CrossRef]
- Sverdrup, H.U.; Olafsdottir, A.H. System Dynamics Modelling of the Global Extraction, Supply, Price, Reserves, Resources and Environmental Losses of Mercury. Water Air Soil Pollut. 2020, 231, 439. [Google Scholar] [CrossRef]
- Komljenovic, D.; Stojanovic, L.; Malbasic, V.; Lukic, A. A Resilience-Based Approach in Managing the Closure and Abandonment of Large Mine Tailing Ponds. Int. J. Min. Sci. Technol. 2020, 30, 737–746. [Google Scholar] [CrossRef]
- Jiao, J.; Jing, Y.; Pang, S. An Integrated Quantitative Safety Assessment Framework Based on the STPA and System Dynamics. Systems 2022, 10, 137. [Google Scholar] [CrossRef]
- Aranoglu, F.; Flamand, T.; Duzgun, S. Analysis of Artisanal and Small-Scale Gold Mining in Peru under Climate Impacts Using System Dynamics Modeling. Sustainability 2022, 14, 7390. [Google Scholar] [CrossRef]
- Tseng, C.-H.; Chen, L.-L.; Yeh, P.-C. Modeling contamination conditions in small-scale industrial areas to estimate health savings benefits associated with remediation. Heliyon 2018, 4, e00995. [Google Scholar] [CrossRef]
- Septriana, F.E.; Ariesta, S.F.S.; Nugraha, B.; Putri, K. Social change and community perceptions on change environment due to sand mining. Interact. Community Engagem. Soc. Environ. 2024, 1, 1–15. [Google Scholar] [CrossRef]
- Wu, Y.; Xu, Y.; Zhao, Y.; Luo, Y.; Lu, J.; Chen, Y. Evolution of River Network Due to Urbanization in the Southeast Yinzhou Plain of Yongjiang River Basin, China. Clean. Prod. 2022, 379, 134718. [Google Scholar] [CrossRef]
- Neville, J.A.; Guz, J.; Rosko, H.M.; Owens, M.C.; Neville, J.A.; Guz, J.; Rosko, H.M.; Owens, M.C.; Neville, J.A. Water Quality Inequality: A Non-Targeted Hotspot Analysis for Ambient Water Quality Injustices. Hydrol. Sci. J. 2022, 67, 1011–1025. [Google Scholar] [CrossRef]
- Kope, A.; Buczy, A.; Owczarz, K.; Bugajska, N.; Kozi, P. Application of Remote Sensing, GIS and Machine Learning with Geographically Weighted Regression in Assessing the Impact of Hard Coal Mining on the Natural Environment. Sustainability 2020, 12, 1–26. [Google Scholar] [CrossRef]
- Lumowa, R.; Utomo, S.W.; Soesilo, T.E.B.; Hariyadi, H. Promote Social Order to Achieve Social and Ecological Justice for Communities to Prevent Illegal Artisanal Small-Scale Gold Mining. Sustainability 2022, 14, 9530. [Google Scholar] [CrossRef]


Disclaimer/Publisher’s Note: The statements, opinions and data contained in all publications are solely those of the individual author(s) and contributor(s) and not of MDPI and/or the editor(s). MDPI and/or the editor(s) disclaim responsibility for any injury to people or property resulting from any ideas, methods, instructions or products referred to in the content. |
© 2024 by the authors. Licensee MDPI, Basel, Switzerland. This article is an open access article distributed under the terms and conditions of the Creative Commons Attribution (CC BY) license (https://creativecommons.org/licenses/by/4.0/).