Abstract
The large size of wind turbines and wind farm clustering aggravate the effect of wake on output power, resulting in a reduction in the economic benefits of wind farms. This paper took the actual operating turbines of an onshore wind farm in China as the research object and analyzed the influence of wake on energy efficiency loss by combining SCADA data. The research established a complete loss assessment method and proposed the corresponding evaluation criteria. The results showed that typical wind turbines seriously affected by wake accounted for 32.8% of the wind farm. The actual output power was only 84.2% of the theoretical output power at the lowest month, and the wake loss of the wind farm is serious. The economic efficiency of the wind farm is lower in the summer months (June–August). The study can provide a theoretical basis for the arrangement of wind farms and the development of an operation control strategy.
1. Introduction
In the social context of carbon emission reduction, the vigorous development of renewable energy represented by wind power has great practical significance [1,2,3]. In order to achieve the maximization of output power in the limited space of wind farms, wind turbines are gradually being developed into large-scale turbines [4], and the distance between different arrays of wind turbines is also shrinking [5]. The above behaviors exacerbate the wake interference between the turbines, which causes serious aerodynamic loss and affects the economic benefits of wind farms [6,7]. Studies have shown that the wake effect between wind turbines can cause a 10–20% loss in energy production per year [8,9]. Accurately analyzing the wake interference effect in wind farms and evaluating the wake loss are crucial for the stable operation of the turbines and the improvement of power generation.
The wake effect refers to the fact that after the inflow wind passes through upstream turbines, a part of the wind energy is converted into mechanical energy, resulting in a reduction of the subsequent output momentum [10]. The wake effect causes uneven wind speed distribution in the wind farm, causing most of the turbines to operate under conditions of lower than the free wind speed, which affects the economic efficiency of the wind farm [11]. On the other hand, the change in wind velocity in front of the downstream wind turbine will cause characteristic responses such as torque, thrust, and output power change. At the same time, the effects of wind shear and turbulence cause fluctuations in wind speed and corresponding output power [12], and make it difficult to assess the wake energy efficiency loss by characterizing the three-dimensional wake flow field [13].
The energy efficiency loss due to the wake effect includes velocity deficit and power loss. Due to the positive correlation between turbine output power and wind speed, the downstream wind speed attenuation caused by wake can lead to a decrease in power generation [14]. Therefore, the velocity deficit can not only characterize the wake loss, but also is the basis for analyzing the wake loss through turbine output power. There are relatively more studies on velocity deficit in the current research. McKay et al. [15] analyzed the wake velocity deficit resulting from a linear array of wind turbines using six months of recorded SCADA data. The results indicated an average wind speed deficit of more than 30%. Christiansen, MB et al. [16] investigated the velocity deficit due to the wake effect at a large wind farm by analyzing data collected by satellite synthetic aperture radar. A decrease in average wind speed was found downstream of the wind turbine array, with an average wind speed deficit of 8–9%. In the specific study of wind turbine wake velocity deficit, four main methods are included: wind tunnel tests [17], field measurements [18], simulation [19] and analytical modeling [20].
The wind tunnel test method is more convenient, but the difference in the Reynolds number due to scale scaling may affect the test results [21]. Bartl et al. [22] set up a wind turbine model in a large-scale wind tunnel and investigated the local velocity deficit behind the wind turbine array. They discussed the distribution law of the flow field under the interference of wake. The flow field environment of the field measurements is real and more credible, but the accuracy may be significantly affected by factors such as unstable wind field and poor monitoring environment, etc. Zhu Xiaoxun et al. [23] conducted a field experiment based on Doppler radars at a wind farm in northern China. They analyzed the wake characteristics of the wind field combined with the SCADA data and investigated the velocity deficit at different distances. The numerical simulation method is simpler and faster in terms of setting up the inflow conditions, but the computational resource requirement is high, and the efficiency is relatively low [24]. Bastankhah M et al. [25] used the large eddy simulation method to compare the wake characteristics of a multi-rotor wind turbine and a single-rotor turbine. It was found that the wake flow of a multi-rotor turbine recovered faster at short downwind distances, corresponding to a smaller velocity deficit. Wu Yuting et al. [26] investigated the differences in wake effects under eight wind turbine array layout methods. In addition, they investigated the effects of different incoming turbulent boundary layer flows on large wind farms and found that increasing the intensity of incoming turbulence is favorable to the recovery of wake velocity compared to changing the layout arrangement of wind turbines, which improves the overall power generation [27,28]. Mahmoodi E et al. [29] combined the Gaussian wake model and the cylindrical vortex induction model to derive a new model to analyze the interaction of wake and induction zones. The velocity deficit characteristics were analyzed. Liu Hengxu et al. [30] used a vortex filament wake model to study the aerodynamic interference of two wind turbines in parallel, series and staggered arrangements. Shin JH et al. [31] proposed a numerical model based on momentum theory to study the disturbance effect of multiple wind turbine wake streams. Compared with other research methods, the wake model can meet the engineering requirements in terms of accuracy, simplicity and rapidity [32]. Classical models include the Jensen model [33] and the Frandsen model [34]. On the basis of the classical model, researchers have proposed models with cosine velocity correction [35] or Gaussian distribution correction [36,37]. At present, research on the wake model is mature and has been widely used [38,39,40].
In terms of power loss assessment, Kim, SH et al. [41] used a multi-MW wind turbine model to compare the power performance of the wind model for each time period under the influence of wake. They combined wind data and power curves from wind farms to clarify the effect of wake on the power and load of the turbines. Barthelmie, RJ et al. [42] used SCADA data to analyze the power loss caused by wake. Power loss was analyzed and the overall efficiency of the Middelgrunden wind farm was calculated to be 90%. It was found that the turbines produced 5.7% more power than predicted using the manufacturer’s power curves. At the same time, they performed a detailed analysis of the output power data from the Nysted wind farm in conjunction with WAsP simulations. They quantified the role of parameters such as atmospheric stability and turbine spacing in determining power loss due to wind turbine wake and wind farm efficiency [43]. Hansen, KS et al. [44] analyzed the power characteristics of the Horns Rev using ten-minute statistic data stored in a public database. The power characteristics of a wind farm and a classification method of atmospheric stability based on the bulk-Ri number resolves the effect of stability and distance between turbines on power deficiencies. El-Asha, S et al. [45] investigated power loss due to wind farm wake interaction in conjunction with SCADA data and meteorological data. They discussed the effect of varying wind directions and atmospheric stability on power loss.
The above velocity deficit and power loss assessment methods have their own advantages and suitable application environments, proving that it is feasible to use SCADA data and the wake model to analyze the wake loss characteristics of the target wind farms. However, there is no systematic wake energy efficiency loss assessment scheme for any wind farm, which needs to be further researched.
On the other hand, the effect of wake on the energy efficiency loss of wind farms requires the selection of appropriate response values for data comparison. Some researchers have compared the response of a downstream wind turbine with that of an upstream wind turbine. Tian W. et al. [46] conducted an experimental investigation of the wake effect between different wind turbines located upstream and downstream of the atmospheric boundary layer. They quantified the output power and dynamic loads acting on the wind turbine model, as well as the wake characteristics behind the wind turbine model. Some studies have also been carried out by comparing the differences between wind turbines under the wake effect and those under free inflow wind. Gustavo S. Bohme et al. [47] compared the measurement periods in the above two cases and computed the corresponding wind speed deficit to complete the analysis of wake effect on a target wind farm. There is no consensus in the industry on the selection of the feature quantity corresponding to the evaluation criteria. Overall, a credible and universal wake loss evaluation method urgently needs to be proposed.
In this paper, the evaluation results combining velocity deficit and output power loss characterize the energy efficiency loss caused by the wake effect. A three-dimensional wake model considering wind shear and Gaussian shape distribution correction of wake velocity was used to analyze the velocity deficit of wind turbines using SCADA data. Turbines that are seriously affected by wake in the target wind farm were selected for analysis and discussion. At the same time, the output power of the wind farm was calculated, and new evaluation criteria were proposed for evaluating the loss.
The innovations of this paper are as follows:
- (1)
- A velocity deficit evaluation method based on SCADA data and a three-dimensional model is proposed, which takes into account the influence of the atmospheric boundary environment, the Gaussian shape distribution of wake velocity and the range of the wake radius on the velocity of downstream wind turbines. The evaluation of the target wind farm is realized by screening typical turbines, and the results are more realistic and reliable.
- (2)
- A method for evaluating the loss by calculating the output power is proposed. SCADA data and turbine characteristic parameters are combined to calculate the output power response of the wind farm. The conclusion can verify the evaluation results based on the selection of typical turbines, which improves the scientific accuracy of the method.
- (3)
- Comprehensive evaluation criteria are proposed to quantify the loss, which can provide a reference for the assessment of wind farms and other research work.
The structure of this paper is as follows: Section 2 introduces the evaluation method, wake model and evaluation criteria. In Section 3, research on velocity deficit is carried out with a specific case. The output power of the selected wind farm is calculated, and the evaluation results are provided. Section 4 summarizes the paper.
2. Methodology
2.1. Wake Loss Assessment Method
2.1.1. Assessment Method Process
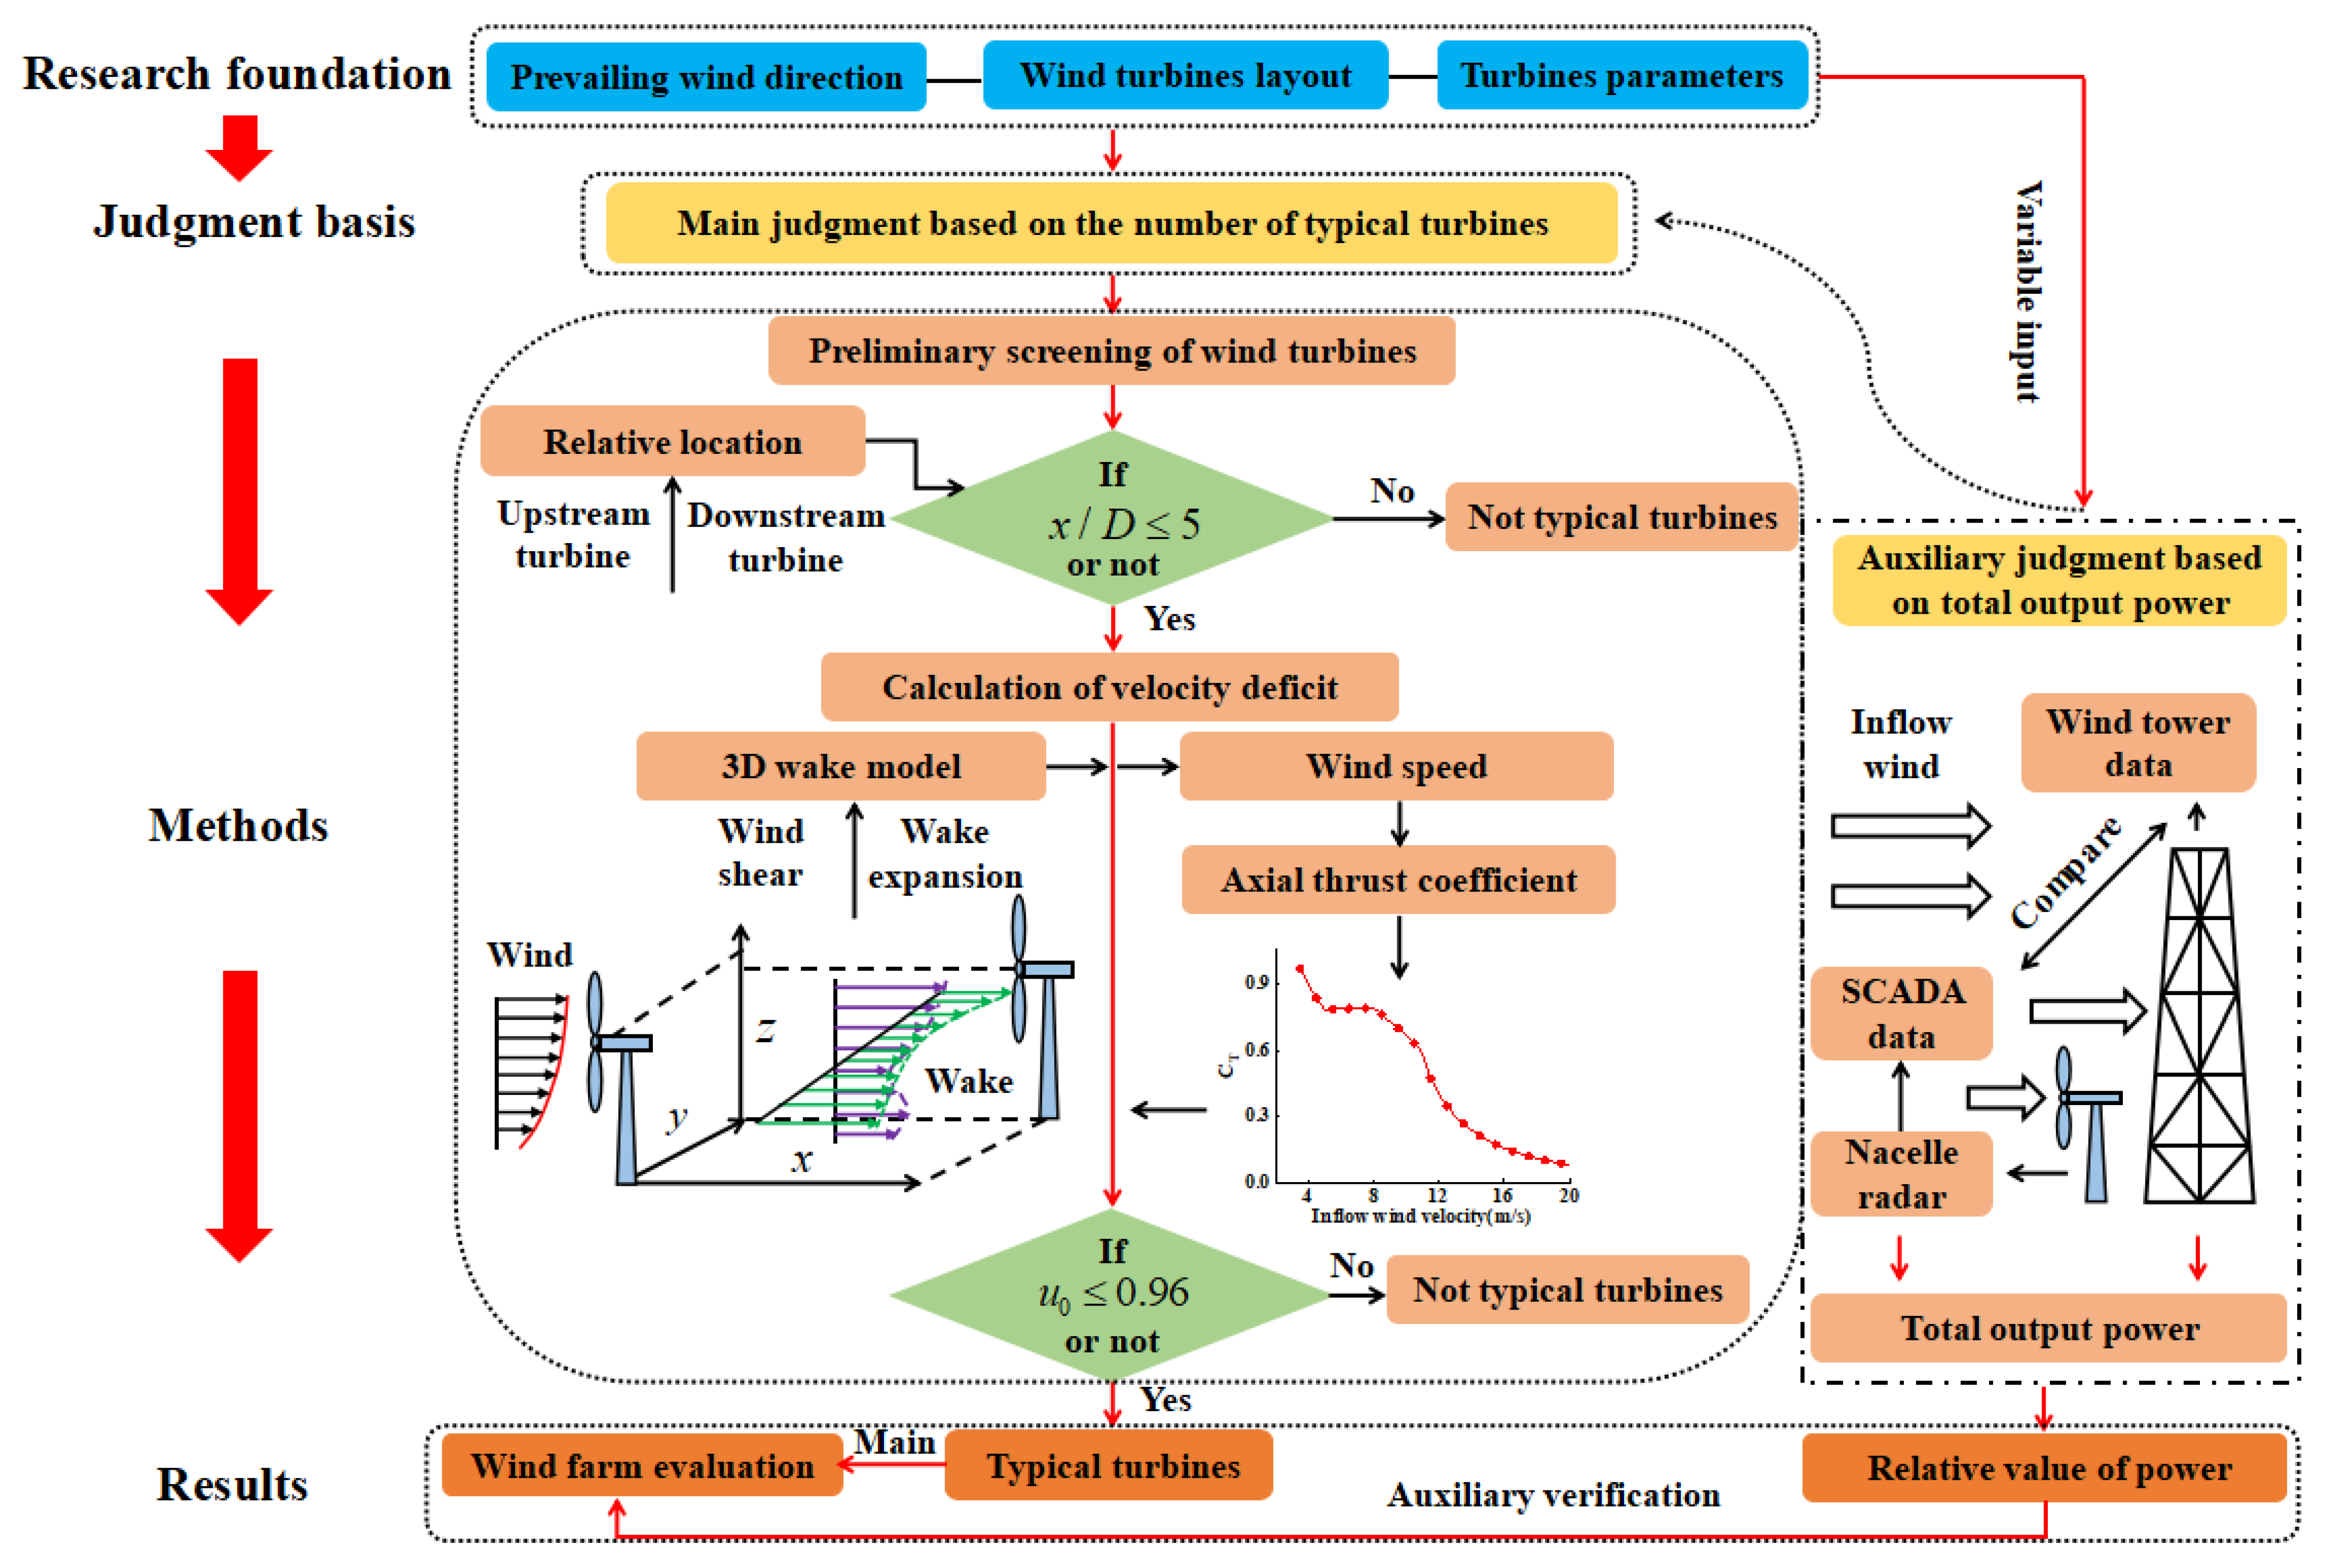
A systematic assessment method is proposed to address the serious loss of benefits caused by the wake of existing wind farms, and the specific flowchart is shown in Figure 1.
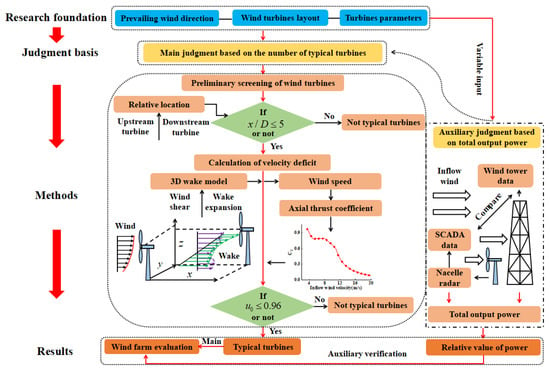
Figure 1.
Flowchart of wind farm wake loss assessment method.
The proposed research method takes the prevailing wind direction of the wind farm, the layout and the characteristic parameters of the turbines as inputs. It comprehensively evaluates the wake loss of the wind farm in terms of the number of typical turbines and the total output power. In the selection of typical turbines, a three-dimensional wake model is introduced and combined with the axial thrust coefficient characteristic curve to analyze the wake velocity of wind turbines at different relative positions. In the calculation of the wind farm output power, the actual value is compared with the theoretical value based on SCADA data and the output power response curve of the turbine. Compared with the existing studies that discuss the effects of a single factor, the wake loss assessment method integrates the discussion of velocity deficit and power loss to form a complete system. The specific details are described below.
2.1.2. Evaluation Method Based on Screening Typical Wind Turbines
The method is used as the main determination basis for the assessment of wind farm wake loss, and the target object is evaluated by solving the proportion of typical wind turbines that are seriously affected by wake. In the data preprocessing stage, the wind condition information (prevailing wind direction, average inflow wind speed and turbulence intensity) of the target wind farm is correlated and analyzed with the arrangement of the turbines, which lays the foundation for further wind turbine screening. Two neighboring turbines are selected, and a coordinate system is established with the upstream wind turbine as the reference. Taking the hub center of the wind turbine as the origin point, the direction indicates the axial direction extending from the direction of the inflow wind to the wake area. The direction indicates the horizontal direction perpendicular to the axis in the radial direction. The direction indicates the vertical direction perpendicular to the plane. The downstream turbine hub coordinates are assumed to be , corresponding to (the dimensionless ratio of wind velocity at the hub to ). The initial screening of the wind turbines is carried out after determining the location coordinates, and the basis for the screening () is referenced to the layout of the actual operating wind farm. As the distance increases, the wake velocity continues to recover, and the selection of distance in the screening criteria will affect the evaluation results. In order to minimize the impact of upstream wind turbine wake on downstream wind turbine capacity, wind turbine spacing within the wind farm is generally selected to be 5–7 times the wind turbine diameter (D), e.g., Horns-Rev Wind Farm [48]. The initial screening mainly considers the variation of wake velocity in the same direction as the inflow wind. The radial distribution characteristics and radius of action of the wake effect will also change the operating conditions under which the downstream wind turbine operates. The wind turbines that pass the initial screening are further analyzed to calculate the velocity at the hub height of the downstream turbine in the wake region of the upstream turbine by combining the wake model with the axial thrust coefficient characteristic curve. The power of a wind turbine is proportional to the cube of the inflow wind speed, and a downstream turbine is determined to be typical if the dimensionless velocity value of the velocity compared to the velocity at the hub of the upstream turbine does not exceed 0.96 (considering a power loss of 10%). The output power maps how much the wind turbine is affected by the wake effect. That is, when Equation (1) is satisfied, the wind turbine is determined to be a typical turbine.
The final determination of the degree of wind farm wake velocity deficit is based on the ratio of the number of typical turbines to the total number of wind turbines .
2.1.3. Auxiliary Validation Evaluation Method Based on Output Power Calculation
The following method is used to validate the results of the velocity deficit assessment. The actual output power of the wind farm is calculated from the data collected by the nacelle radar and recorded in the SCADA system. The theoretical output power of the wind farm is calculated by matching the inflow wind condition data measured by the anemometer towers with the output characteristic curve of the wind turbine. The SCADA data contains information on wind speed, wind direction, and output power under the wind turbine’s operating conditions, which enables the assessment of the wake energy efficiency loss of wind farms. The wake effect affects the inflow wind speed in front of the wind turbine, which in turn reduces the output power. The analysis of output power based on SCADA data can reflect the characteristics of wake energy efficiency loss in wind farms. Due to the limitations of data collection equipment layout and measurement principles, there may be missing data and significant errors. However, data preprocessing and statistical analysis of data covering sufficiently long time scales can meet the accuracy requirements. The SCADA data used for a single validation generally covers no less than a period of 1 month. With the introduction of the comparison value of the above characterized quantities, the output power response in the wind farm is determined. The scientific validity and reliability of the method is further enhanced by introducing SCADA data for correlation analysis.
By carrying out separate studies on the number of typical turbines and the total output power of the target wind farm, mutual verification of the results can be realized. The energy efficiency loss characteristics caused by the wake effect can be more objectively represented.
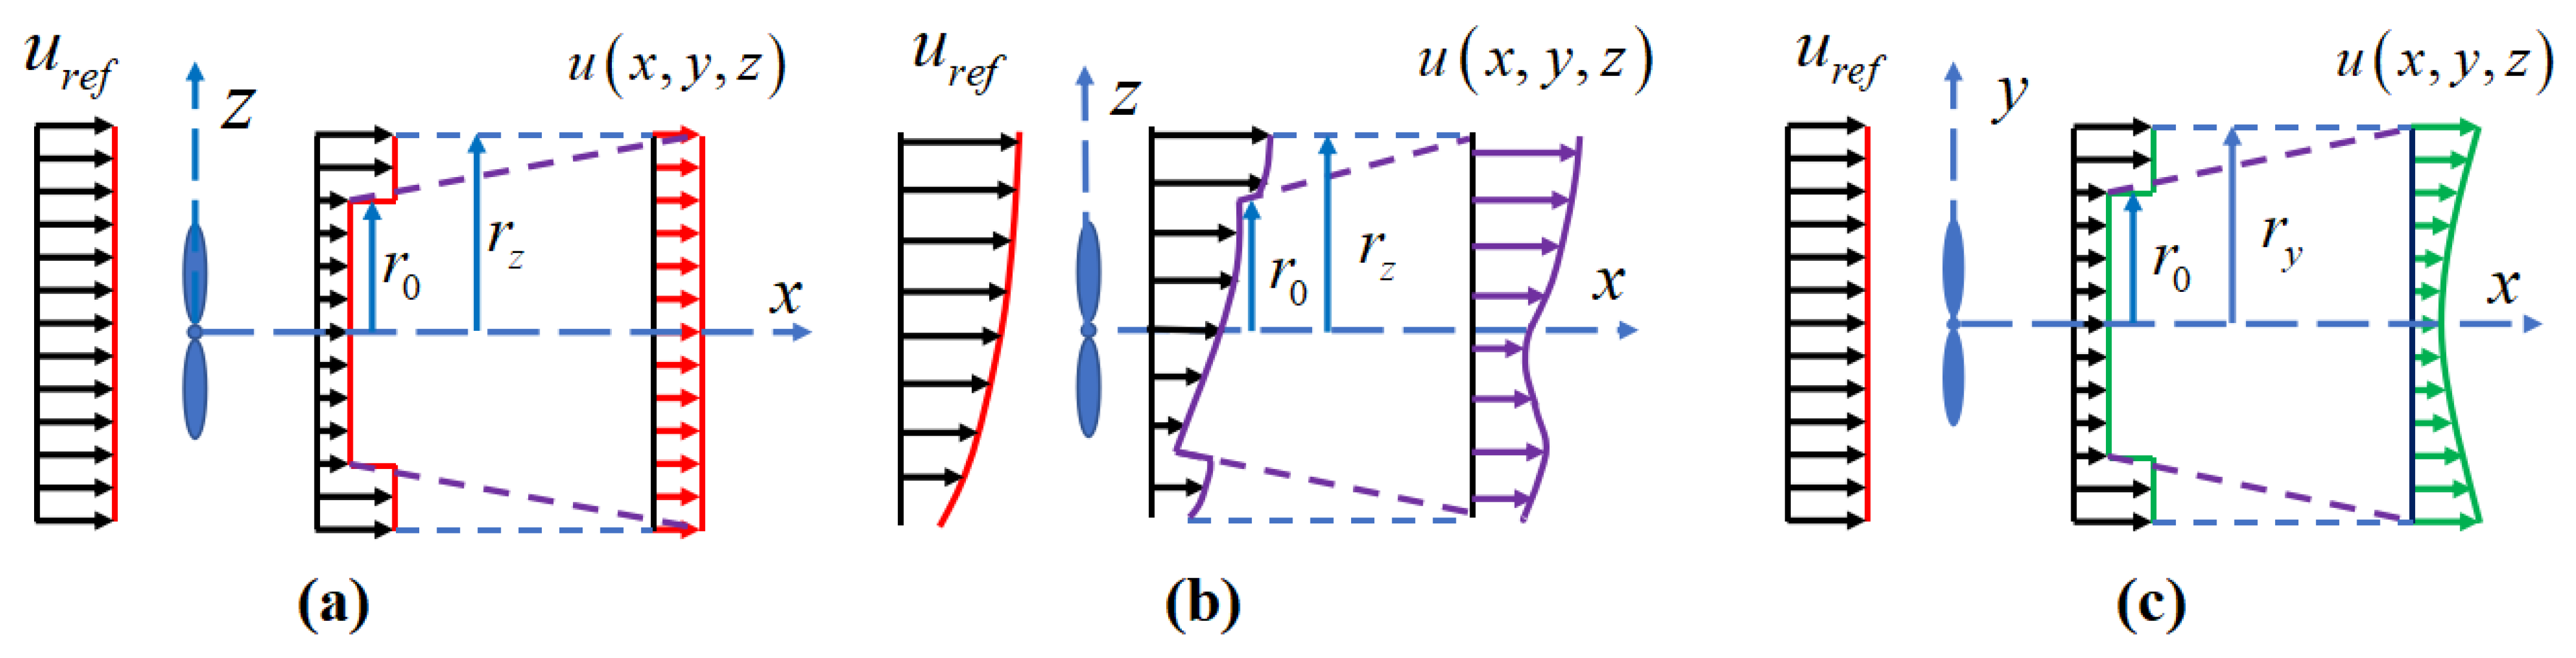
2.2. Wake Model and Associated Parameters
The wake velocities of the downstream turbines are calculated and analyzed using the 3D wake model. In this paper, the 3DJG wake model [49], which takes into account the wind shear and Gaussian distribution characteristics, is used to analyze the operating conditions of the downstream turbine. The model characterizes the velocity distribution pattern at different locations in the wake zone. Compared to other models, the 3DJG model is able to represent the anisotropic distribution of the wake velocity and the accuracy has been verified. The principle is shown in Figure 2.
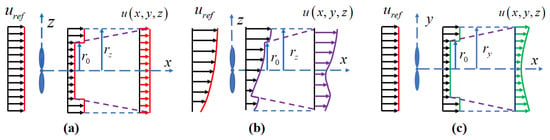
Figure 2.
3DJG model derivation principle: Jensen model wake velocity distribution assumptions (a); 3DJG model vertical profile velocity distribution (b); 3DJG model horizontal profile velocity distribution (c).
The model introduces the effect of wind shear on the wake in the vertical direction as in Equation (2).
In the specific derivation process, the difference between the Gaussian function distribution characteristics and the top-hat shape is corrected. A control body consistent with the Jensen model is selected, and the momentum conservation theorem is applied to propose the final 3DJG wake model. The model converts the influence of the wind shear effect into the velocity deficit, and the specific expression is shown in Equation (3).
The expression for calculating the relevant variables is shown in Equation (4).
The value of the wake expansion coefficient in the model refers to the relevant studies in the literature [50] and is 0.075 for onshore wind farms and 0.05 for offshore wind farms.
The 3DJG wake model can evaluate wake velocity for the turbines that passed the initial screening. Typical turbines at different relative positions upstream and downstream can be selected, which provides the theoretical support for the subsequent research.
As mentioned in the previous section, when selecting the neighboring turbines, the inflow wind direction of the wind farm should be analyzed and combined with the installation location of the wind turbines. When calculating the wake speed and power, the characteristic parameters of the turbines and the response curves are different. The different characteristics of wind conditions, such as wind shear index and turbulence, also impact the final results. The specific values of the above factors should be clarified in advance when carrying out the specific research.
Overall, the assessment of wake energy efficiency loss was carried out in two parts. On the one hand, neighboring turbines are identified based on the layout of the wind farm and wind resource information, and the wind condition information is transformed into parameter corrections in Equations (2)–(4). Based on Equation (1), the wind turbines are screened to complete the velocity deficit assessment. On the other hand, the actual output power of the wind farm in different time scales is counted based on the data recorded by the SCADA system. The theoretical output power is obtained by comparing the wind speed recorded from the anemometer towers with the characteristic curves of the wind turbine and comparing it with the actual output power to complete the power loss assessment. The conclusion can verify the results of the velocity deficit assessment.
2.3. Criteria for Evaluating Wake Loss
The evaluation method for screening typical turbines ultimately determines the degree of wind farm wake velocity deficit according to , which is categorized into four levels. The specific evaluation criteria are shown in Table 1.

Table 1.
Evaluation criteria for wake velocity deficit.
The evaluation method for calculating wind farm output power determines the degree of power loss with the comparison value of the characteristic quantity. The results are classified into four levels. The specific evaluation criteria are shown in Table 2.
Table 2.
Evaluation criteria for power loss.
Comparative analysis of the evaluation results of the number of typical turbines versus the total output power can further improve the rigor of the conclusions. The results can fully reflect the impact of the wake effect on energy efficiency loss.
Compared to the other research methods in the references, the method used in this paper for assessing wake energy efficiency loss has certain advantages. It is shown that the velocity distribution of the wind turbine in the far wake region exhibits obvious Gaussian shape characteristics [37,51]. The 3DJG model chosen in this paper is able to reflect the shape characteristics of the wake velocity and correct the influence of other environmental factors compared with other models [33,34]. Its accuracy has also been proved [49]. Unlike the single theoretical derivation [29,30,31] or statistical research methods [42,43,44], this paper combines the velocity analysis based on the wake model with the power analysis based on SCADA data. It evaluates the wake energy efficiency loss of wind farms from both theoretical and practical perspectives, and the results are more scientific and accurate. At the same time, unlike the existing studies which mostly only stay in the result analysis [46,47], the method proposed in this paper contains specific evaluation criteria, which can quantify and classify the wake loss and provide rationalization suggestions for wind farm operation. In summary, it is reasonable to assess the wake energy efficiency loss of wind farms based on the method proposed in this paper.
3. Case Analysis
3.1. Introduction of Target Wind Farm
The selected wind farm is located in the Inner Mongolia Autonomous Region, China, with a total area of about 53 km2. The average altitude is about 1430 m, and the air density is 1.064 kg/m3. The wind farm consists of 125 WT 1500/77 wind turbines produced by Sinovel Wind Group Co., Ltd. located in Beijing, China, and the specific parameters are shown in Table 3.
Table 3.
WT 1500/77 wind turbine technical data.
The layout of the wind turbines will affect the judgement of the wake effect, and is also the basis for the selection of neighboring turbines in the subsequent assessment of the velocity deficit. When calculating the theoretical output power of the wind turbine, it is necessary to check the power output characteristic curve and determine the value of the axial thrust coefficient in the solution process of the wake velocity. The layout of the 125 WT1500/77 turbines in the wind farm and the corresponding characteristic response curves are shown in Figure 3.
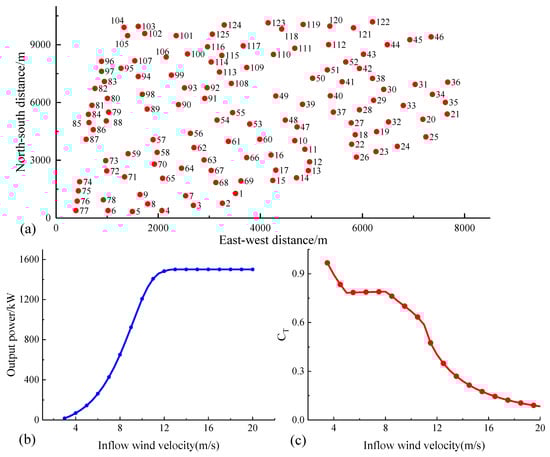
Figure 3.
Wind farm wind turbine layout (a); output power characteristic curve (b); axial thrust coefficient curve (c).
Grasping the overall situation of the wind farm and the characteristic parameters of the turbines lays the foundation for subsequent in-depth research.
3.2. Wind Resource Information
Wind resource information, such as prevailing wind direction, average wind speed and turbulence intensity of the wind farm, needs to be determined to carry out the related research. In this paper, the wind resource data are taken from three anemometer towers, 8003#, 8004# and 8005#, which are close to the wind farm. The specific information of the anemometer towers is shown in Table 4.
Table 4.
Statistics on anemometer towers information.
The completeness rates for the data of the three anemometer towers are 96.68%, 96.72%, and 98.73%, respectively. All rates exceeded 95%. The anemometer towers are located inside the wind farm, and the terrain is flat. The altitude and topography are basically the same as the wind farm, so they are selected for the evaluation of the wind farm.
The difference in wind shear coefficients represents the difference in wind speed with height. According to the data collected from the anemometer towers and the expression of Equation (1), the wind shear indexes are 0.138, 0.124 and 0.143, respectively. Therefore, the integrated wind shear index of the anemometer towers is 0.1392. The data of the anemometer towers are shown in Table 5.
Table 5.
Wind shear coefficients at different heights measured by anemometer towers.
Turbulence intensity describes the degree of change in wind speed over time and space, reflecting the influence of the atmospheric boundary layer. According to the analysis of the data collected from the anemometer towers, the representative turbulence intensity at the height of 70 m is 0.105. The average turbulence intensity and representative turbulence intensity at each height of the anemometer towers at 15 m/s are shown in Table 6.
Table 6.
Turbulence intensity at different heights measured by the anemometer towers.
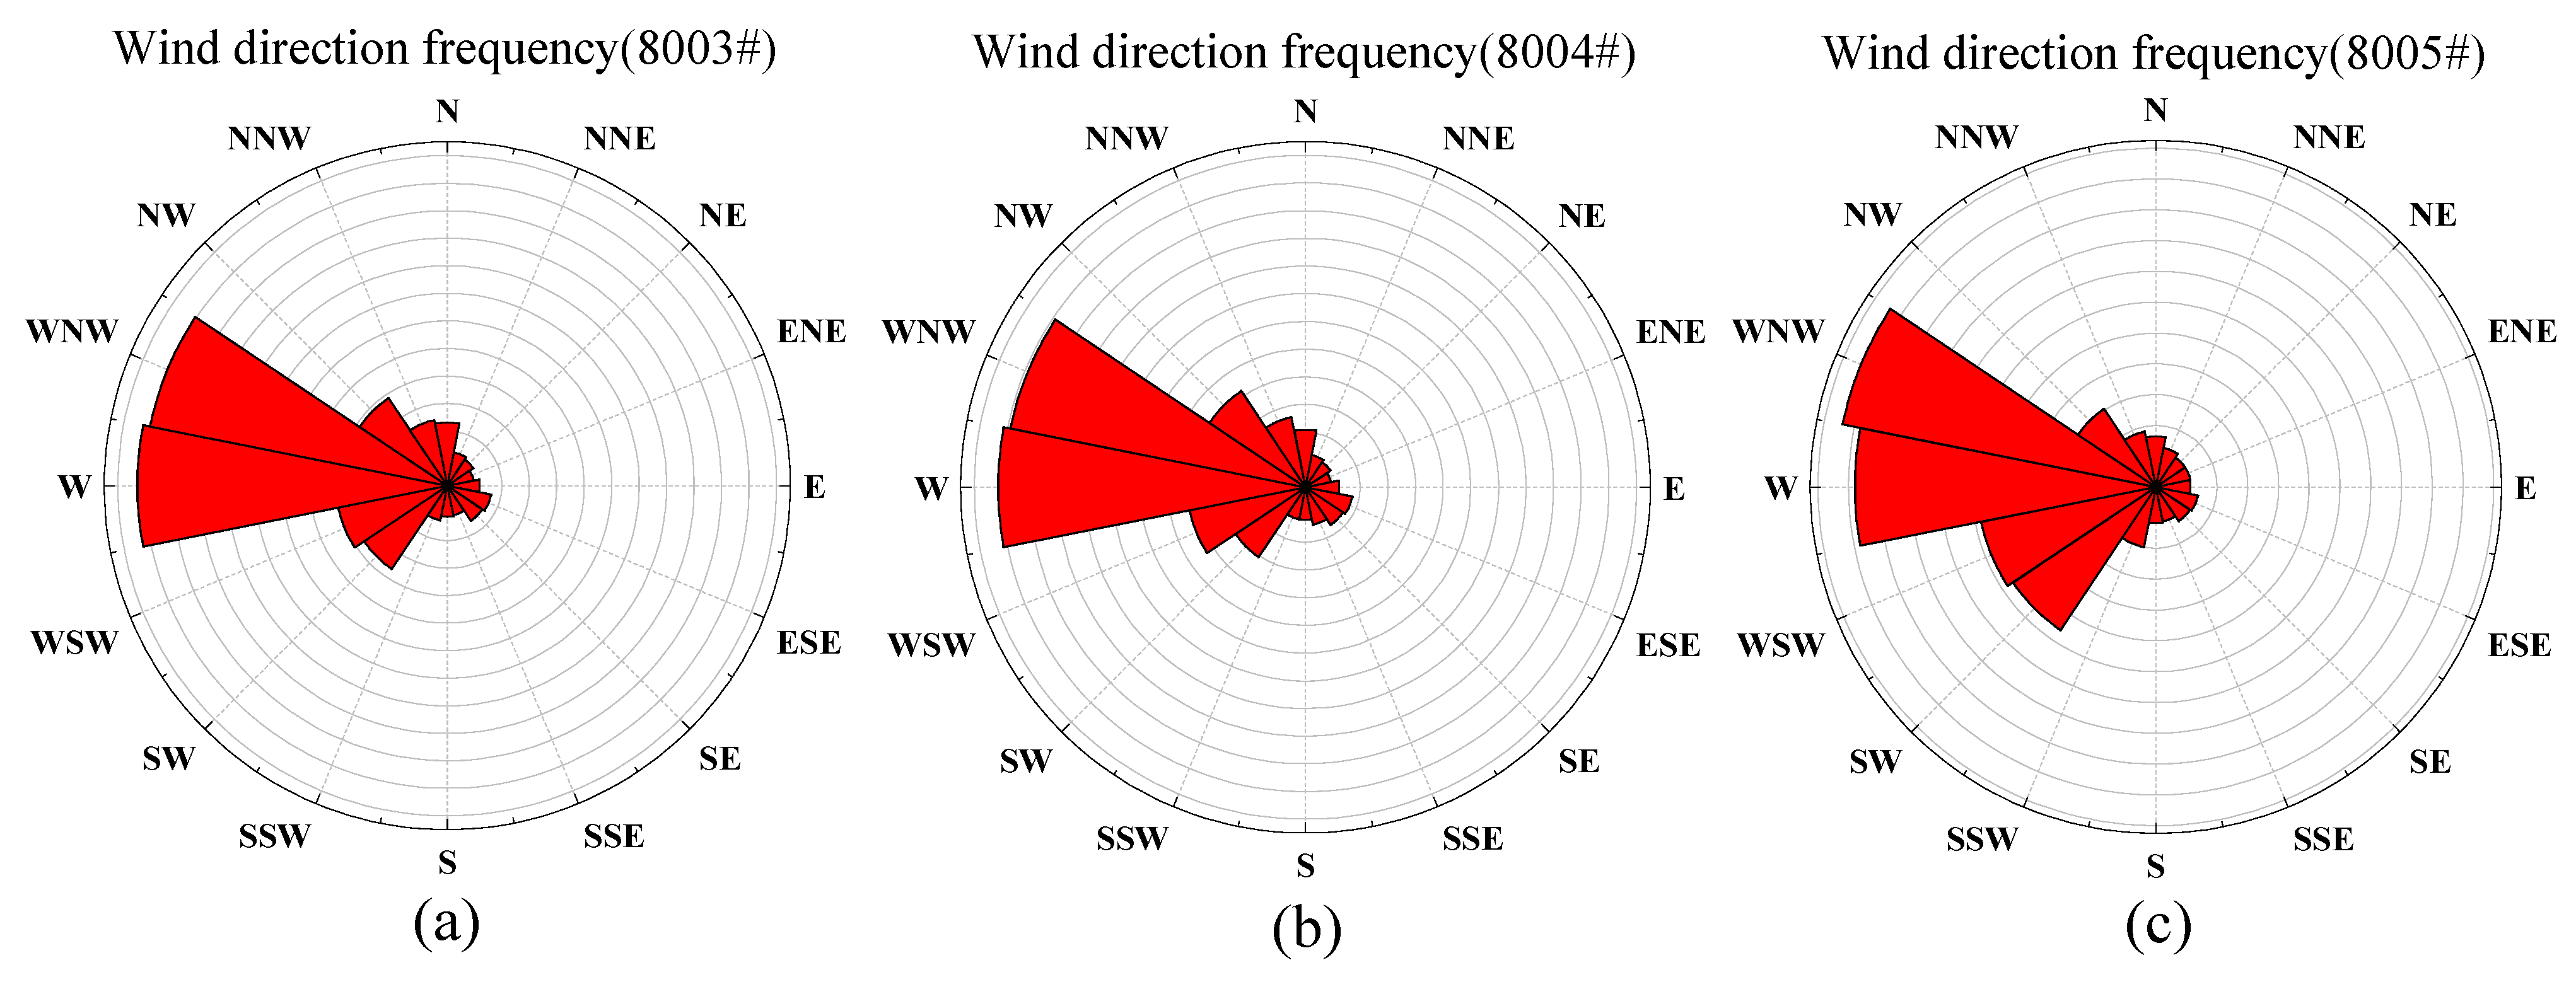
The judgment of the coordinate relationship between neighboring turbines is based on the same direction as the inflow wind. The frequency of wind directions at 270° and 292.5° measured by anemometer towers 8003# and 8004# is the highest and relatively close, while the frequency of wind direction at 292.5° measured by wind measurement tower 8005# is higher than that at 270°. Therefore, it is determined that the wind direction studied in this paper is 292.5° (the north direction is 0°, the clockwise direction is the positive direction). The wind direction frequency distribution is shown in Figure 4.

Figure 4.
Frequency distribution of wind direction at wind farm: 8003# (a); 8004# (b); 8005# (c).
When assessing the velocity deficit of the wind farm based on the screening of typical wind turbines, the determination of the inflow wind speed is made with reference to the average wind speed, and the wind speed at the hub height is determined to be 6.88m/s. The analysis of the wind speed frequency also shows that the average wind speed belongs to the common wind speed in the wind farm, which proves the reliability of the selection. The corresponding value is 0.79. The data from the anemometer towers is shown in Table 7, and the wind speed frequency distribution is shown in Figure 5.
Table 7.
Wind speed at different heights measured by anemometer towers.
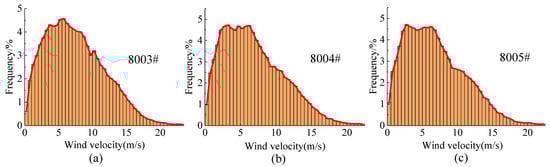
Figure 5.
Frequency distribution of wind speed at the wind farm: 8003# (a); 8004# (b); 8005# (c).
3.3. Assessment of Velocity Deficit Based on the Screening of Typical Wind Turbines
The wake velocity deficit was evaluated based on the proposed wind turbine screening method and summarized wind farm characterization information. It should be noted that when studying the wind turbines at the wind farm boundary, some of the turbines were directly recognized as atypical turbines (corresponding to as 1) due to the absence of wind turbines upwind, e.g., 81# and 82#. Other turbines selected the upstream turbines closest to each other for wake effect analysis, such as 105# and 104#. At this time, the influence of prevailing wind direction was ignored. In order to avoid the misjudgment of these turbines due to the close distance in the wind direction, the corresponding wake velocity was further calculated. The results of the calculation and analysis of each wind turbine are shown in Figure 6.
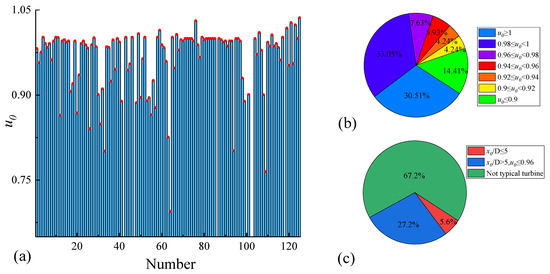
Figure 6.
Wind turbine wake velocities (a); percentage of different wake velocities (b); percentage of different types of turbines (c).
In Figure 6a, the wake velocities at the hub height of the remaining wind turbines after the initial screening are characterized. The minimum value is 0.694, obtained at 64#, and the maximum value is 1.037, obtained at 125#. The occurrence of dimensionless velocity values greater than 1 is due to the fact that the hub height of the downstream wind turbine is higher than that of the upstream wind turbine, which will be subject to the wind shear effect. Combined with the layout of the target wind farm, it can be found that the larger speed deficit occurs in the denser wind turbine area or when the upstream and downstream wind turbine connection line is extremely consistent with the inflow wind direction. In wind farm layout design, it is crucial to arrange the distance between turbines and stagger them properly to minimize the economic loss caused by the wake effect.
In Figure 6b, the percentage of wake velocities at hub height for the remaining wind turbines after the initial screening is analyzed. The highest percentage of wind turbines with dimensionless velocity values in the range of 0.98–1 is 33.05%, while the lowest percentage of velocity ranges are 0.92–0.94 and 0.9–0.92, both with 4.24%. On the whole, the wake velocity deficit in the wind farm is serious, and the percentage of turbines with velocity values lower than 0.96 reaches 28.82%.
In Figure 6c, the turbines are categorized based on the proposed evaluation method for screening typical turbines. The results show that the percentage of the selected typical wind turbines reaches 32.8%. The velocity deficit of the target wind farm is serious and belongs to the ‘Large’ level.
The research in this paper was carried out based on the prevailing wind direction, and when the inflow wind direction of the wind farm is changed, the velocity deficit caused by the wake effect also has differences. The actual working conditions should be taken into account when analyzing the specific problems.
3.4. Auxiliary Assessment Based on Output Power Calculation
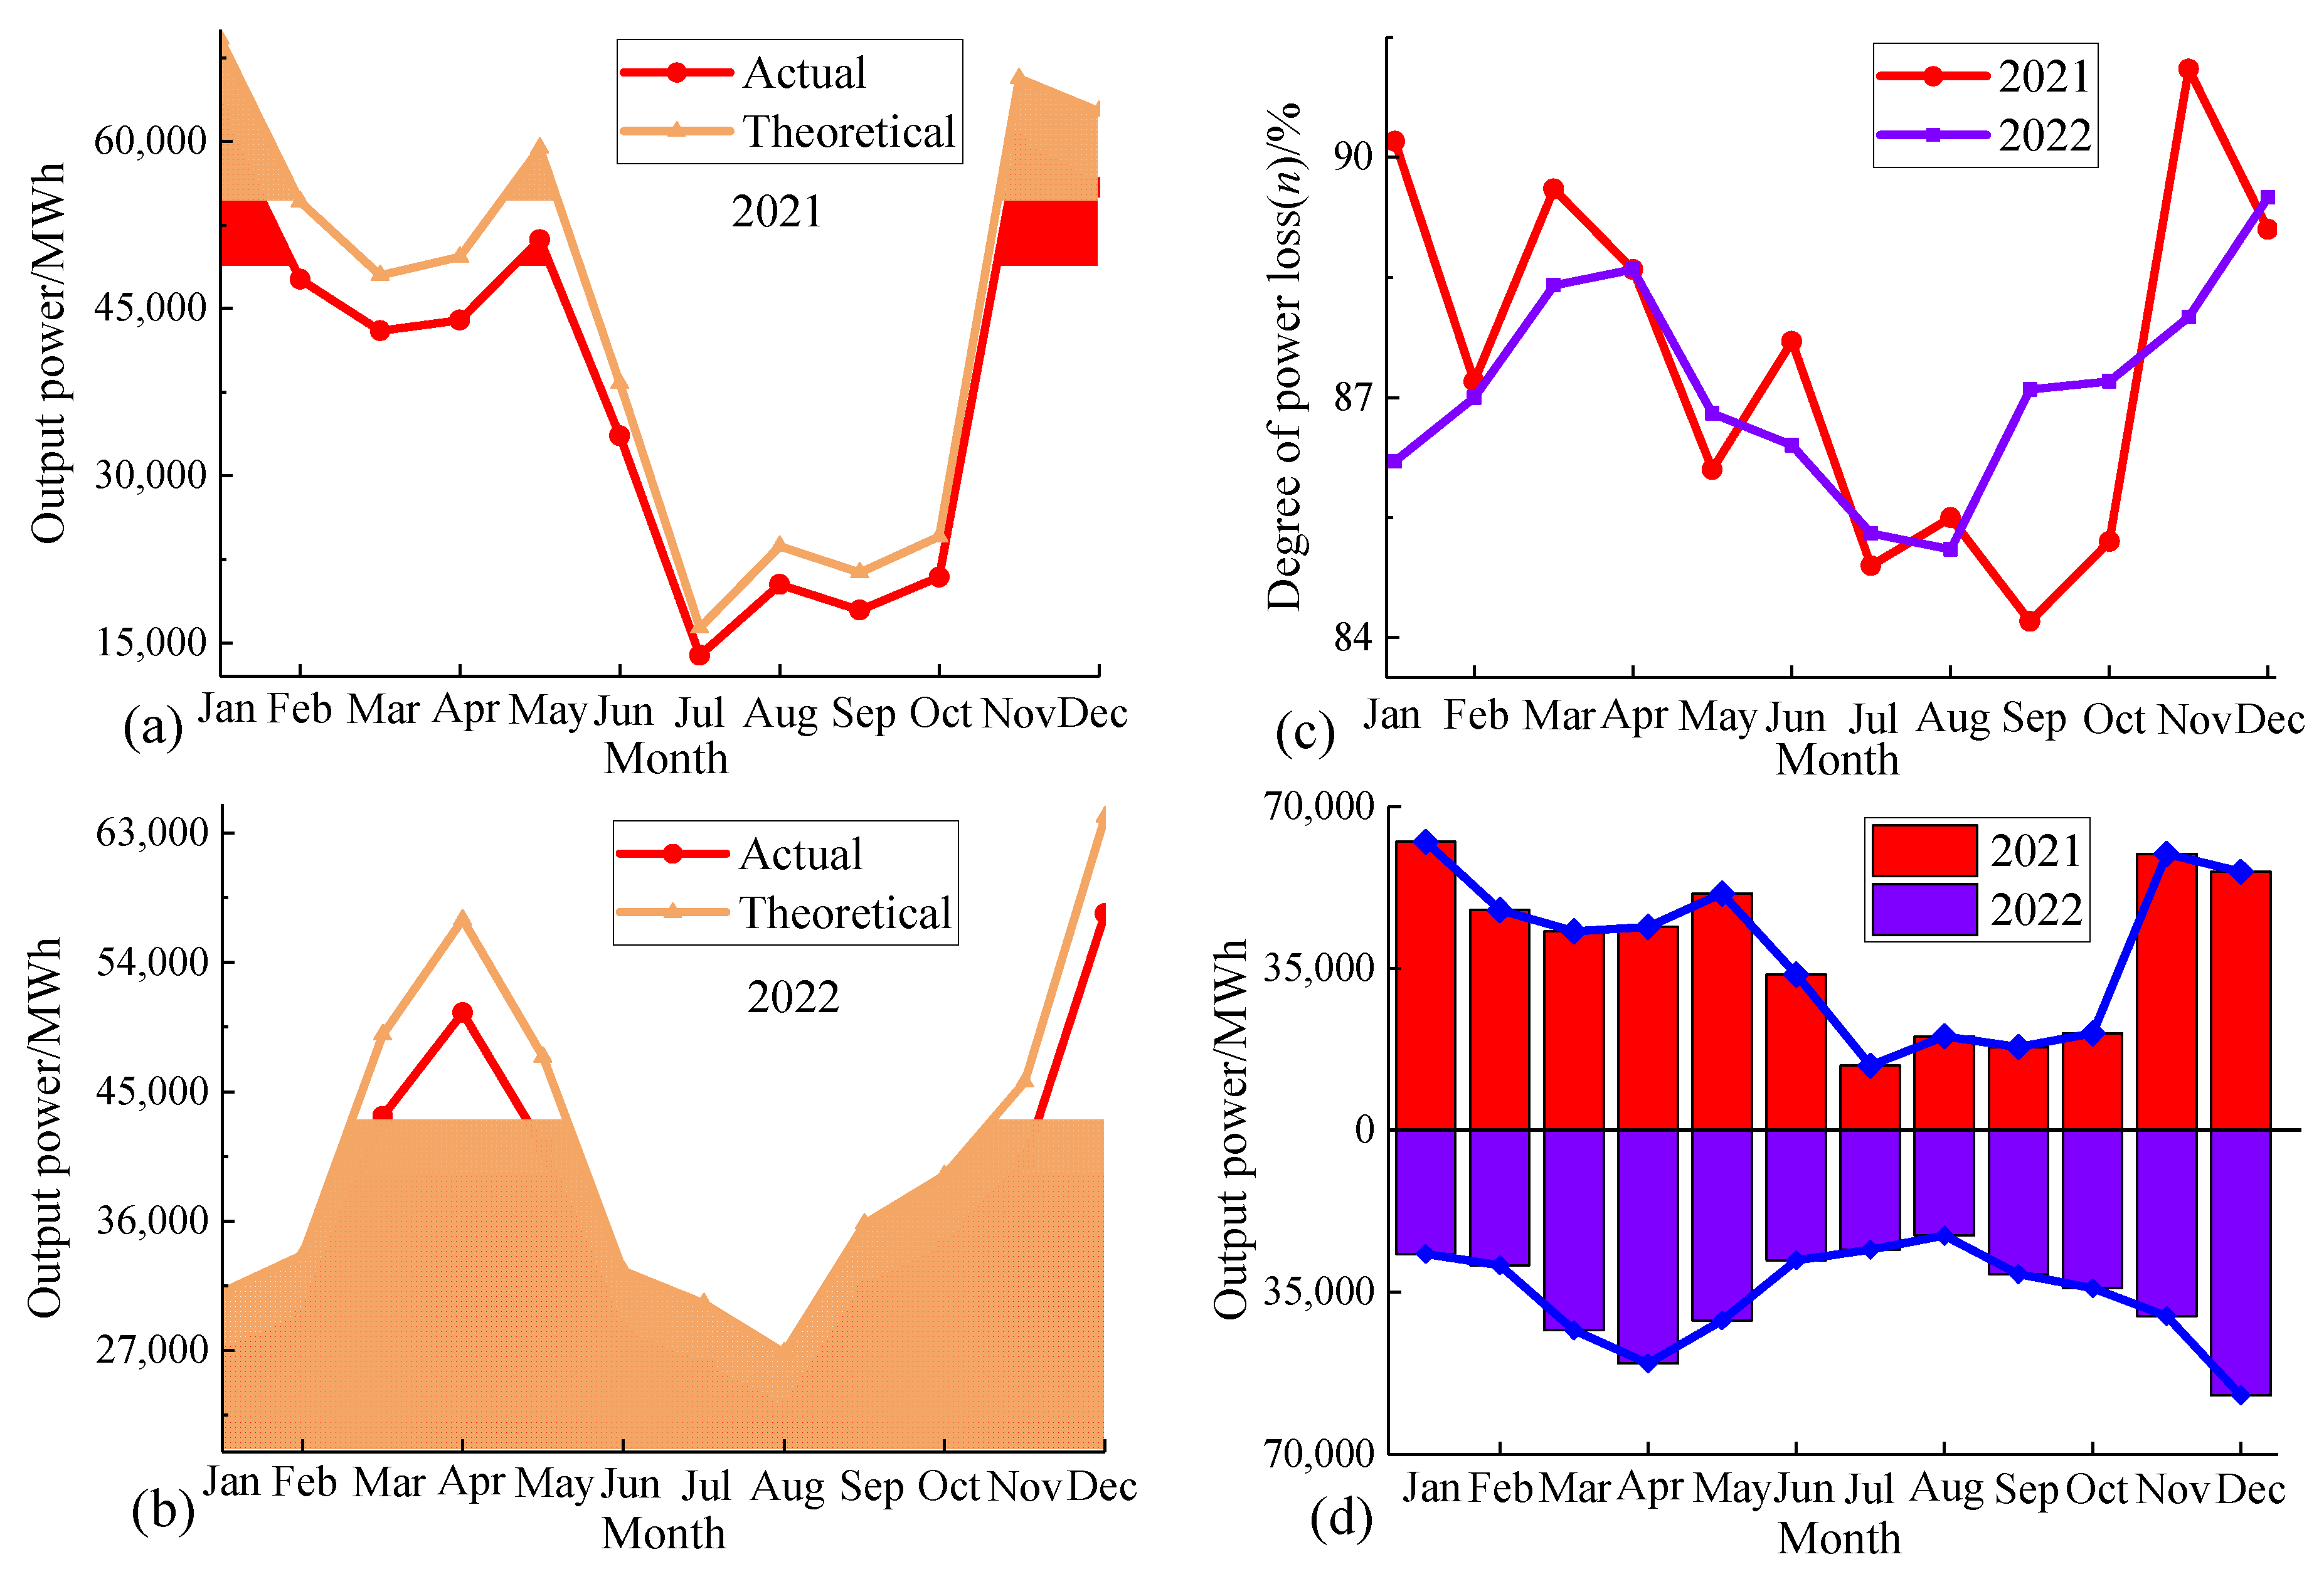
The results of the wake evaluation were validated by calculating the output power of the wind farm. The total power of 125 wind turbines was analyzed using SCADA data, wind speed measured by the anemometer towers and turbine output power characteristic curves. The data points corresponding to the time when the wind turbines were unable to work due to maintenance and malfunctions were excluded. The data from 2021 and 2022 were selected for discussion, and the results of the relevant calculations are shown in Figure 7.

Figure 7.
Actual and theoretical output power of the wind farm in 2021 (a); actual and theoretical output power of the wind farm in 2022 (b); characterized value of power loss of the target wind farm (c); comparison of actual output power in 2021 and 2022 (d).
In Figure 7a,b, the actual output power of the wind farm is compared with the theoretical output power for the selected time periods, and the portion between the two folded lines corresponds to the loss of power generation due to the wake effect. For further quantification, the ratio of actual output power to theoretical output power is analyzed in Figure 7c. The results show that in 2021, the wind farm has a relatively high output power loss due to wake interference in the summer months (June–August) and a relatively low wake power loss in the winter months (December–February). While in 2022, the lower loss of wake energy efficiency corresponds to the spring months (March–May). The reason for this phenomenon is that wind speeds are relatively high in winter and spring, and higher wind speeds facilitate the rapid recovery of the wake velocity and reduce the impact of the wake effect on the output power. Power loss fluctuations at the wind farm are more dramatic in 2021 than in 2022. The trend of the change in the power loss characteristics is not exactly the same as the change in output power of the wind farm. At the same wind speed, the change in wind direction causes the relative position between different array turbines to change, which affects the wake disturbance characteristics. In the selected time range, the power loss is more severe in all time periods, except for a few months corresponding to evaluation eigenvalues slightly above 90%, with the lowest evaluation value of 84.2%. Overall, the power loss caused by the wake effect in the target wind farm is relatively serious and belongs to the ‘Large’ level, which verifies the evaluation results obtained by screening typical turbines.
In Figure 7d, the actual output power in 2021 is compared with that of 2022. The comparison results show that the economic benefit of the wind farm is higher in 2021 than in 2022. When analyzed on an annual time scale, the wind resource distribution characteristics of the wind farm are generally consistent, except for a few months. The spring months (March–May) correspond to relatively higher output power, when the wind speed is higher, and the wind energy utilization rate is relatively high. The wind farm has lower power output in the summer months (June–August), which is less economically efficient.
In this paper, an onshore wind farm was selected for wake energy efficiency loss assessment. When wind farms under other climatic conditions are selected for analysis, the wake model should be revised according to the wind resource characteristics. For offshore wind farms, the structure of the wind turbine is different and the motion of the waves also affects the characteristics of the wake velocity distribution. The energy efficiency loss assessment can be finalized by correcting the model to reflect the impact of different environmental factors. Overall, the process of the wake energy efficiency loss assessment method has not changed and is still universal.
4. Conclusions
This paper proposed a wake energy efficiency loss analysis method applicable to general wind farms, which, combined with the evaluation criteria, could complete the loss assessment by screening typical wind turbines and calculating the output power. Based on SCADA data and the characteristic parameters of the wind turbine, the wake loss assessment of the target wind farm has been completed. The conclusions are summarized as follows:
- The 3DJG wake model was introduced for the screening of typical turbines, which comprehensively considered the influence of the external environment and the relative position between turbines on wake velocity. The analysis of the target wind field shows that the percentage of turbines seriously affected by wake reaches 32.8%, and the results of wake velocity calculation also show that the distance in the perpendicular direction to the inflow wind direction affects the recovery of wake velocity.
- The auxiliary evaluation method for output power calculation based on the analysis of SCADA data was proposed, which enabled the validation of the results of the wake assessment. The analysis of the target wind farm shows that the output power loss is serious in the selected time periods. Compared to the theoretical output power, the actual output power is as low as 84.2%. The economic efficiency of the wind farm is higher in the spring months (March–May).
- The conclusion obtained from the calculation of the output power validated the results of the wake loss assessment from the screening of typical turbines. Under the studied operating conditions, the wake energy efficiency loss is serious and belongs to the ‘Large’ level. The results can provide theoretical support for wind farm layout optimization, wake energy efficiency loss assessment and operation control strategy development.
Author Contributions
Paper idea provider, K.M.; supervision, K.M.; funding acquisition, K.M.; writing—Original draft, H.Z.; data analysis, H.Z.; formal analysis, X.G.; methodology, X.W.; data curation, H.N.; visualization, W.F. All authors have read and agreed to the published version of the manuscript.
Funding
This work was partly supported by Zhejiang Province Postdoctoral program (No. 301816) and the Research and Development Project of China Huadian Corporation Ltd. (No. CHDKJ 21-01-98).
Institutional Review Board Statement
Not applicable.
Informed Consent Statement
Not applicable.
Data Availability Statement
Data supporting the findings of this study are available from the corresponding author upon reasonable request.
Conflicts of Interest
Authors Kuichao Ma and Wei Fan were employed by the Huadian Electric Power Research Institute Co., Ltd. The authors have no actual or potential conflict of interest, including any financial, personal or other relationships with other people or organizations within three years of beginning the submitted work, that could inappropriately influence, or be perceived to influence, their work.
Nomenclature
| SCADA | Supervisory control and data acquisition |
| 3DJG | Three dimensional Jensen-Gaussian |
| Inflow wind velocity (m/s) | |
| Inflow wind velocity measured at the reference height (m/s) | |
| Wake velocity (m/s) | |
| Rotor radius (m) | |
| Reference height (m) | |
| Hub height (m) | |
| Diameter of wind turbine (m) | |
| Wind shear index | |
| Initial wake radius (m) | |
| Wake radius in vertical direction (m) | |
| Wake radius in horizontal direction (m) | |
| Standard deviation in vertical direction (m) | |
| Standard deviation in horizontal direction (m) | |
| Thrust coefficient | |
| Wake expansion coefficient in horizontal direction | |
| Wake expansion coefficient in vertical direction | |
| Axial induction factor |
References
- Zhang, L.; Li, H.; Zhang, K.; Li, W.; Zuo, C.; Odunmbaku, G.O.; Chen, J.; Chen, C.; Zhang, L.; Li, R.; et al. Major strategies for improving the performance of perovskite solar cells. iEnergy 2023, 2, 172–199. [Google Scholar] [CrossRef]
- Kou, X.; Wang, R.; Du, S.; Xu, Z.; Zhu, X. Heat pump assists in energy transition: Challenges and approaches. DeCarbon 2024, 3, 100033. [Google Scholar] [CrossRef]
- Zhang, H.; Park, N.-G. Progress and issues in p-i-n type perovskite solar cells. DeCarbon 2024, 3, 100025. [Google Scholar] [CrossRef]
- Hegazy, A.; Blondel, F.; Cathelain, M.; Aubrun, S. LiDAR and SCADA data processing for interacting wind turbine wakes with comparison to analytical wake models. Renew. Energy 2022, 181, 457–471. [Google Scholar] [CrossRef]
- Stevens, R.J.; Meneveau, C. Flow structure and turbulence in wind farms. Annu. Rev. Fluid Mech. 2017, 49, 311–339. [Google Scholar] [CrossRef]
- Cai, W.; Hu, Y.; Fang, F.; Yao, L.; Liu, J. Wind farm power production and fatigue load optimization based on dynamic partitioning and wake redirection of wind turbines. Appl. Energy 2023, 339, 121000. [Google Scholar] [CrossRef]
- Archer, C.L.; Vasel-Be-Hagh, A.; Yan, C.; Wu, S.; Pan, Y.; Brodie, J.F.; Maguire, A.E. Review and evaluation of wake loss models for wind energy applications. Appl. Energy 2018, 226, 1187–1207. [Google Scholar] [CrossRef]
- Howland, M.F.; Quesada, J.B.; Martínez, J.J.P.; Larrañaga, F.P.; Yadav, N.; Chawla, J.S.; Sivaram, V.; Dabiri, J.O. Collective wind farm operation based on a predictive model increases utility-scale energy production. Nat. Energy 2022, 7, 818–827. [Google Scholar] [CrossRef]
- Barthelmie, R.J.; Hansen, K.; Frandsen, S.T.; Rathmann, O.; Schepers, J.G.; Schlez, W.; Phillips, J.; Rados, K.; Zervos, A.; Politis, E.S.; et al. Modelling and measuring flow and wind turbine wakes in large wind farms offshore. Wind Energy 2009, 12, 431–444. [Google Scholar] [CrossRef]
- Shaler, K.; Kecskemety, K.M.; McNamara, J.J. Benchmarking of a free vortex wake model for prediction of wake interactions. Renew. Energy 2019, 136, 607–620. [Google Scholar] [CrossRef]
- Gao, X.; Yang, H.; Lin, L.; Koo, P. Wind turbine layout optimization using multi-population genetic algorithm and a case study in Hong Kong offshore. J. Wind Eng. Ind. Aerodyn. 2015, 139, 89–99. [Google Scholar] [CrossRef]
- Li, L.; Hearst, R.J.; Ferreira, M.A.; Ganapathisubramani, B. The near-field of a lab-scale wind turbine in tailored turbulent shear flows. Renew. Energy 2020, 149, 735–748. [Google Scholar] [CrossRef]
- Bangga, G.; Lutz, T. Aerodynamic modeling of wind turbine loads exposed to turbulent inflow and validation with experimental data. Energy 2021, 223, 120076. [Google Scholar] [CrossRef]
- Sun, H.; Yang, H. Study on an innovative three-dimensional wind turbine wake model. Appl. Energy 2018, 226, 483–493. [Google Scholar] [CrossRef]
- McKay, P.; Carriveau, R.; Ting, D.S. Wake impacts on downstream wind turbine performance and yaw alignment. Wind Energy 2013, 16, 221–234. [Google Scholar] [CrossRef]
- Christiansen, M.B.; Hasager, C.B. Wake effects of large offshore wind farms identified from satellite SAR. Remote Sens. Environ. 2005, 98, 251–268. [Google Scholar] [CrossRef]
- Adaramola, M.S.; Krogstad, P. Experimental investigation of wake effects on wind turbine performance. Renew. Energy 2011, 36, 2078–2086. [Google Scholar] [CrossRef]
- Kumer, V.M.; Reuder, J.; Svardal, B.; Saetre, C.; Eecen, P.J. Characterisation of single wind turbine wakes with static and scanning WINTWEX-W LiDAR data. Energy Procedia 2015, 80, 245–254. [Google Scholar] [CrossRef]
- Uchida, T.; Taniyama, Y.; Fukatani, Y.; Nakano, M.; Bai, Z.; Yoshida, T.; Inui, M. A new wind turbine CFD modeling method based on a porous disk approach for practical wind farm design. Energies 2020, 13, 3197. [Google Scholar] [CrossRef]
- Ge, M.; Wu, Y.; Liu, Y.; Li, Q. A two-dimensional model based on the expansion of physical wake boundary for wind-turbine wakes. Appl. Energy 2019, 233-234, 975–984. [Google Scholar] [CrossRef]
- Tang, H.; Lam, K.-M.; Shum, K.-M.; Li, Y. Wake effect of a horizontal axis wind turbine on the performance of a downstream turbine. Energies 2019, 12, 2395. [Google Scholar] [CrossRef]
- Bartl, J.; Pierella, F.; Sætran, L. Wake measurements behind an array of two model wind turbines. Energy Procedia 2012, 24, 305–312. [Google Scholar] [CrossRef]
- Zhu, X.; Chen, Y.; Xu, S.; Zhang, S.; Gao, X.; Sun, H.; Wang, Y.; Zhao, F.; Lv, T. Three-dimensional non-uniform full wake characteristics for yawed wind turbine with LiDAR-based experimental verification. Energy 2023, 270, 126907. [Google Scholar] [CrossRef]
- Sorensen, N.N. CFD modelling of laminar-turbulent transition for airfoils and rotors using the γ-(Re)over-tildeθ model. Wind. Energy 2009, 12, 715–733. [Google Scholar] [CrossRef]
- Bastankhah, M.; Abkar, M. Multirotor wind turbine wakes. Phys. Fluids 2019, 31, 085106. [Google Scholar] [CrossRef]
- Wu, Y.-T.; Liao, T.-L.; Chen, C.-K.; Lin, C.-Y.; Chen, P.-W. Power output efficiency in large wind farms with different hub heights and configurations. Renew. Energy 2019, 132, 941–949. [Google Scholar] [CrossRef]
- Wu, Y.; Lin, C.; Chang, T. Effects of inflow turbulence intensity and turbine arrangements on the power generation efficiency of large wind farms. Wind Energy 2020, 23, 1640–1655. [Google Scholar] [CrossRef]
- Husien, W.; El-Osta, W.; Dekam, E. Effect of the wake behind wind rotor on optimum energy output of wind farms. Renew. Energy 2013, 49, 128–132. [Google Scholar] [CrossRef]
- Mahmoodi, E.; Khezri, M.; Ebrahimi, A.; Ritschel, U.; Chamorro, L.P.; Khanjari, A. A simple model for wake-induced aerodynamic interaction of wind turbines. Energies 2023, 16, 5710. [Google Scholar] [CrossRef]
- Liu, H.-X.; Tian, Y.-N.; Liu, W.-Q.; Jin, Y.-Q.; Kong, F.-K.; Chen, H.-L.; Zhong, Y.-G. Aerodynamic interference characteristics of multiple unit wind turbine based on vortex filament wake model. Energy 2023, 268, 126663. [Google Scholar] [CrossRef]
- Shin, J.-H.; Lee, J.-H.; Chang, S.-M. A Simplified Numerical Model for the Prediction of Wake Interaction in Multiple Wind Turbines. Energies 2019, 12, 4122. [Google Scholar] [CrossRef]
- Wang, T.; Cai, C.; Wang, X.; Wang, Z.; Chen, Y.; Song, J.; Xu, J.; Zhang, Y.; Li, Q. A new Gaussian analytical wake model validated by wind tunnel experiment and LiDAR field measurements under different turbulent flow. Energy 2023, 271, 127089. [Google Scholar] [CrossRef]
- Jensen, N.O. A Note on Wind Generator Interaction; Risoe National Laboratory: Roskilde, Denmark, 1983. [Google Scholar]
- Frandsen, S.; Barthelmie, R.; Pryor, S.; Rathmann, O.; Larsen, S.; Højstrup, J.; Thøgersen, M. Analytical modelling of wind speed deficit in large offshore wind farms. Wind Energy 2006, 9, 39–53. [Google Scholar] [CrossRef]
- Tian, L.; Zhu, W.; Shen, W.; Zhao, N.; Shen, Z. Development and validation of a new two-dimensional wake model for wind turbine wakes. J. Wind Eng. Ind. Aerodyn. 2015, 137, 90–99. [Google Scholar] [CrossRef]
- Cheng, Y.; Zhang, M.; Zhang, Z.; Xu, J. A new analytical model for wind turbine wakes based on Monin-Obukhov similarity theory. Appl. Energy 2019, 239, 96–106. [Google Scholar] [CrossRef]
- Brogna, R.; Feng, J.; Sørensen, J.N.; Shen, W.Z.; Porté-Agel, F. A new wake model and comparison of eight algorithms for layout optimization of wind farms in complex terrain. Appl. Energy 2020, 259, 114189. [Google Scholar] [CrossRef]
- Gao, X.X.; Yang, H.X.; Lu, L. Optimization of wind turbine layout position in a wind farm using a newly-developed two-dimensional wake model. Appl. Energy 2016, 174, 192–200. [Google Scholar] [CrossRef]
- Ishihara, T.; Qian, G.-W. A new Gaussian-based analytical wake model for wind turbines considering ambient turbulence intensities and thrust coefficient effects. J. Wind Eng. Ind. Aerodyn. 2018, 177, 275–292. [Google Scholar] [CrossRef]
- Lopes, A.M.; Vicente, A.H.; Sánchez, O.H.; Daus, R.; Koch, H. Operation assessment of analytical wind turbine wake models. J. Wind Eng. Ind. Aerodyn. 2022, 220, 104840. [Google Scholar] [CrossRef]
- Kim, S.-H.; Shin, H.-K.; Joo, Y.-C.; Kim, K.-H. A study of the wake effects on the wind characteristics and fatigue loads for the turbines in a wind farm. Renew. Energy 2015, 74, 536–543. [Google Scholar] [CrossRef]
- Barthelmie, R.J.; Frandsen, S.T.; Nielsen, M.N.; Pryor, S.C.; Rethore, P.E.; Jørgensen, H.E. Modelling and measurements of power losses and turbulence intensity in wind turbine wakes at Middelgrunden offshore wind farm. Wind Energy 2007, 10, 517–528. [Google Scholar] [CrossRef]
- Barthelmie, R.J.; Jensen, L.E. Evaluation of wind farm efficiency and wind turbine wakes at the Nysted offshore wind farm. Wind Energy 2010, 13, 573–586. [Google Scholar] [CrossRef]
- Hansen, K.S.; Barthelmie, R.J.; Jensen, L.E.; Sommer, A. The impact of turbulence intensity and atmospheric stability on power deficits due to wind turbine wakes at Horns Rev wind farm. Wind Energy 2012, 15, 183–196. [Google Scholar] [CrossRef]
- El-Asha, S.; Zhan, L.; Iungo, G.V. Quantification of power losses due to wind turbine wake interactions through SCADA, meteorological and wind LiDAR data. Wind Energy 2017, 20, 1823–1839. [Google Scholar] [CrossRef]
- Tian, W.; Ozbay, A.; Wang, X.D.; Hu, H. Experimental investigation on the wake interference among wind turbines sited in atmospheric boundary layer winds. Acta Mech. Sin. 2017, 33, 742–753. [Google Scholar] [CrossRef]
- Böhme, G.S.; Fadigas, E.A.; Gimenes, A.L.; Tassinari, C.E. Wake effect measurement in complex terrain—A case study in Brazilian wind farms. Energy 2018, 161, 277–283. [Google Scholar] [CrossRef]
- Porté-Agel, F.; Bastankhah, M.; Shamsoddin, S. Wind-turbine and Wind-farm flows: A review. Bound.-Layer Meteorol. 2020, 174, 1–59. [Google Scholar] [CrossRef] [PubMed]
- Gao, X.; Li, B.; Wang, T.; Sun, H.; Yang, H.; Li, Y.; Wang, Y.; Zhao, F. Investigation and validation of 3D wake model for horizontal-axis wind turbines based on filed measurements. Appl. Energy 2020, 260, 114272. [Google Scholar] [CrossRef]
- Barthelmie, R.J.; Larsen, G.C.; Frandsen, S.T.; Folkerts, L.; Rados, K.; Pryor, S.C.; Lange, B.; Schepers, G. Comparison of wake model simulations with offshore wind turbine wake profiles measured by sodar. J. Atmos. Ocean. Technol. 2006, 23, 888–901. [Google Scholar] [CrossRef]
- Cao, L.; Ge, M.; Gao, X.; Du, B.; Li, B.; Huang, Z.; Liu, Y. Wind farm layout optimization to minimize the wake induced turbulence effect on wind turbines. Appl. Energy 2022, 323, 119599. [Google Scholar] [CrossRef]


Disclaimer/Publisher’s Note: The statements, opinions and data contained in all publications are solely those of the individual author(s) and contributor(s) and not of MDPI and/or the editor(s). MDPI and/or the editor(s) disclaim responsibility for any injury to people or property resulting from any ideas, methods, instructions or products referred to in the content. |
© 2024 by the authors. Licensee MDPI, Basel, Switzerland. This article is an open access article distributed under the terms and conditions of the Creative Commons Attribution (CC BY) license (https://creativecommons.org/licenses/by/4.0/).