
Intensity of Tourism Economic Linkages in Chinese Land Border Cities and Network Characterization

Abstract
:1. Introduction
2. Literature Review
3. Materials and Methods
3.1. Study Area
3.2. Data Source and Processing
3.3. Methodology
3.3.1. Modified Gravitational Model
3.3.2. Social Network Analysis
Network Density
Core–Edge Structure Analysis
Network Cohesion Subgroup Analysis
Centrality
Structural Hole Analysis
4. Results
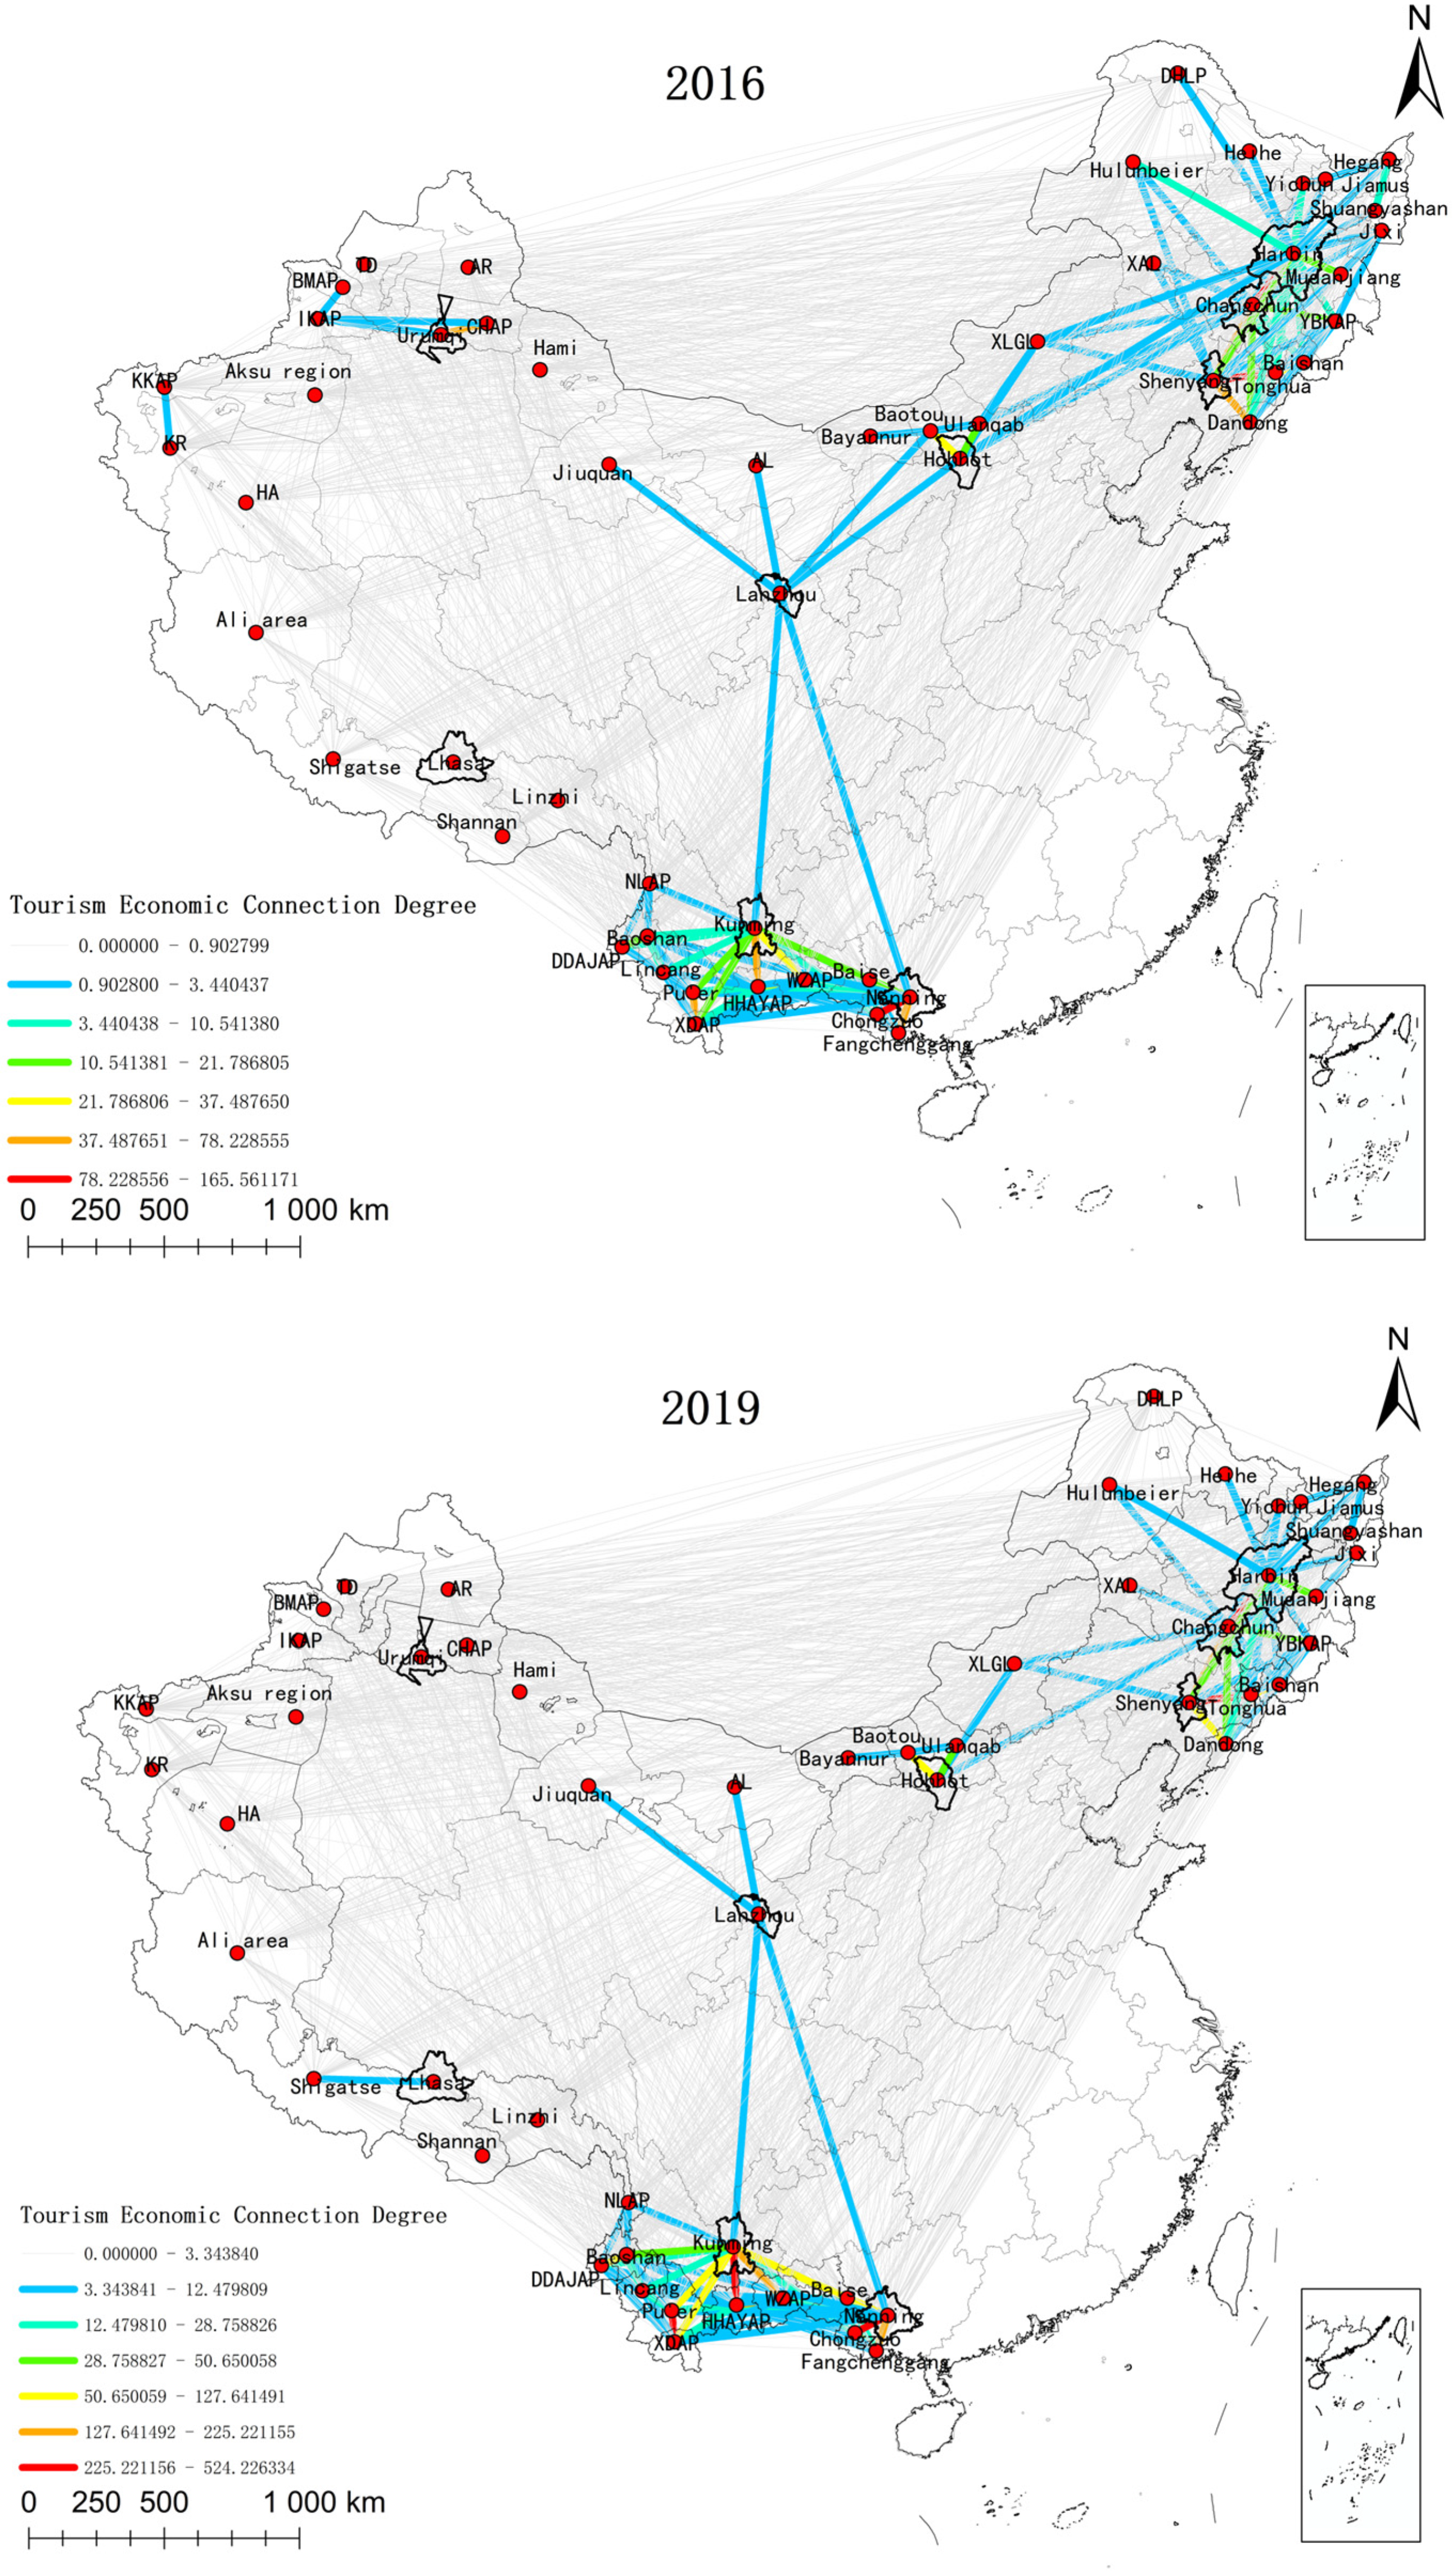
4.1. Degree and Volume of Tourism Economic Linkages in Chinese Land Border Cities
Tourism Economic Linkages
- Uneven Development of “Trilateral” Tourism Economic Linkages
- 2.
- Central Cities Remain Central
- 3.
- Enhanced Tourism Economic Linkages in Neighboring Cities

4.2. Social Network Analysis
4.2.1. Network Density Analysis
4.2.2. Core–Edge Structure Analysis
- The core–edge structure is remarkable
- 2.
- The core area gradually extends to the northwest and southwest
- 3.
- The impact of the core zone on the tourism economy of the marginal zone has increased
4.2.3. Analysis of Network Cohesion Subgroups
- Geographically Neighboring Border Cities Are More Likely to Form a Subgroup


| Cohesive Subgroup | Regional Distribution |
|---|---|
| subgroup 1 | Heilongjiang, Jilin, Liaoning, eastern Inner Mongolia Autonomous Region |
| subgroup 2 | Eastern Inner Mongolia Autonomous Region, Western Inner Mongolia Autonomous Region |
| subgroup 3 | Guangxi, Yunnan, Tibet South |
| subgroup 4 | Xinjiang, Gansu, Mongolia West, Tibet North |
- 2.
- Border Region’s Tourism Economy “Embraces the Warmth”
| Subgroup | 1 | 2 | 3 | 4 | 5 | 6 | 7 | 8 |
|---|---|---|---|---|---|---|---|---|
| 1 | 0.5 | 0.121 | 0 | 0 | 0 | 0 | 0 | 0 |
| 2 | 0.621 | 0.373 | 0 | 0.026 | 0.013 | 0 | 0 | 0 |
| 3 | 0.375 | 0 | 0.333 | 0 | 0.071 | 0 | 0.036 | 0.75 |
| 4 | 0.429 | 0.013 | 0 | 0.405 | 0.041 | 0 | 0.02 | 0.036 |
| 5 | 0 | 0 | 0 | 0 | 0.643 | 0 | 0 | 0 |
| 6 | 0.083 | 0 | 0 | 0 | 0.375 | 0.393 | 0.089 | 0.031 |
| 7 | 0.357 | 0 | 0.143 | 0.204 | 0.306 | 0.107 | 0.095 | 0.536 |
| 8 | 0.083 | 0 | 0.375 | 0 | 0.071 | 0 | 0.036 | 0.417 |
| Subgroup | 1 | 2 | 3 | 4 | 5 | 6 | 7 | 8 |
|---|---|---|---|---|---|---|---|---|
| 1 | 0.8 | 0.148 | 0.167 | 0 | 0 | 0 | 0 | 0 |
| 2 | 0.574 | 0.611 | 0 | 0.022 | 0.009 | 0 | 0 | 0 |
| 3 | 0.833 | 0.111 | 0.5 | 0.2 | 0 | 0 | 0 | 0 |
| 4 | 0.367 | 0.022 | 0.2 | 0.8 | 0.031 | 0 | 0.029 | 0 |
| 5 | 0 | 0 | 0 | 0 | 0.442 | 0 | 0 | 0 |
| 6 | 0.083 | 0 | 0 | 0 | 0.231 | 0.917 | 0.036 | 0 |
| 7 | 0.405 | 0 | 0 | 0.514 | 0.231 | 0.107 | 0.357 | 0.339 |
| 8 | 0.125 | 0 | 0 | 0.075 | 0.058 | 0 | 0.071 | 0.446 |
| Subgroup | 1 | 2 | 3 | 4 | 5 | 6 | 7 | 8 |
|---|---|---|---|---|---|---|---|---|
| 1 | 0.768 | 0.042 | 0 | 0 | 0 | 0 | 0 | 0 |
| 2 | 0.708 | 0.458 | 0 | 0.111 | 0.016 | 0 | 0 | 0 |
| 3 | 0.167 | 0 | 1 | 0.667 | 0 | 0 | 0 | 0.83 |
| 4 | 0.5 | 0.111 | 1 | 0.5 | 0.071 | 0 | 0 | 0.25 |
| 5 | 0 | 0 | 0 | 0 | 0.786 | 0 | 0 | 0 |
| 6 | 0.05 | 0 | 0 | 0 | 0.457 | 0.014 | 0.014 | 0.075 |
| 7 | 0.036 | 0.016 | 0 | 0 | 0.061 | 0.357 | 0.357 | 0.161 |
| 8 | 0.25 | 0 | 0.417 | 0.188 | 0.286 | 0.304 | 0.304 | 0.411 |
| Subgroup | 1 | 2 | 3 | 4 | 5 | 6 | 7 | 8 |
|---|---|---|---|---|---|---|---|---|
| 1 | 0.875 | 0.057 | 0 | 0 | 0 | 0 | 0 | 0 |
| 2 | 0.729 | 0.5 | 0 | 0.2 | 0.014 | 0 | 0 | 0 |
| 3 | 0.143 | 0 | 1 | 0.667 | 0 | 0 | 0 | 0.19 |
| 4 | 0.714 | 0.2 | 1 | 0 | 0.286 | 0 | 0 | 0.143 |
| 5 | 0 | 0 | 0 | 0 | 0.833 | 0.1 | 0 | 0 |
| 6 | 0 | 0 | 0 | 0 | 0.429 | 0.433 | 0 | 0.071 |
| 7 | 0.111 | 0 | 0 | 0.204 | 0.222 | 0.067 | 0.125 | 0.333 |
| 8 | 0.408 | 0 | 0.714 | 0 | 0.408 | 0.014 | 0.079 | 0.595 |
4.2.4. Centrality Analysis
- Degree Centrality
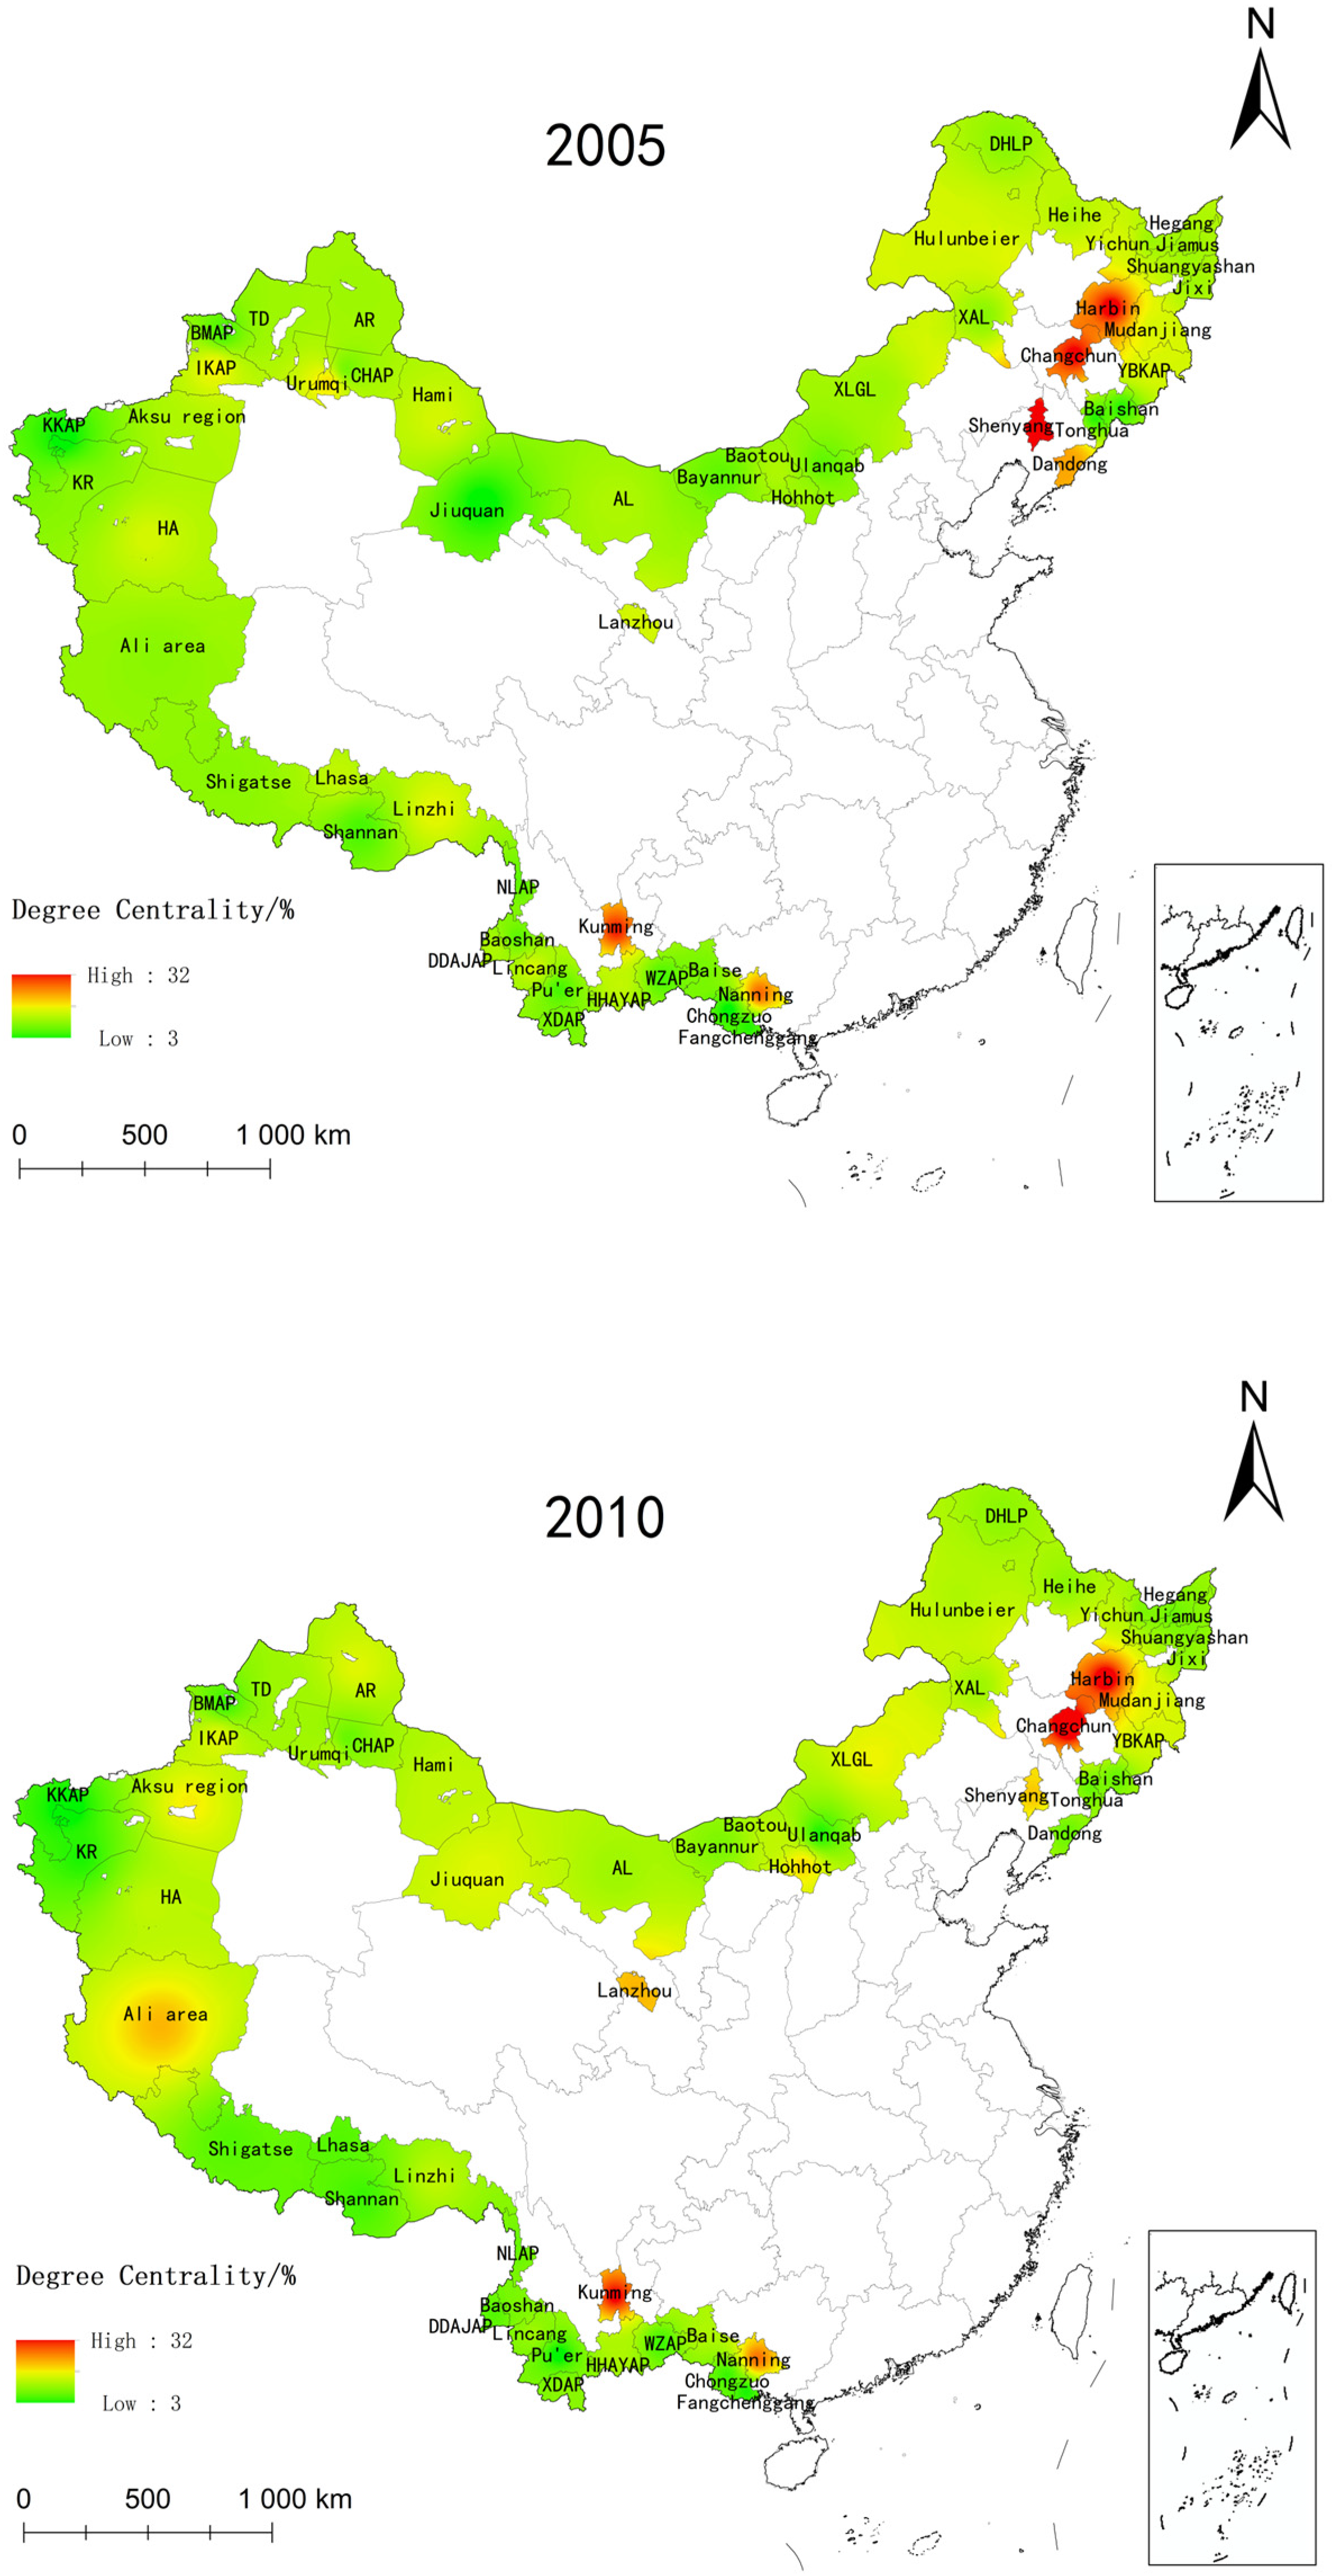

- 2.
- Closeness Centrality
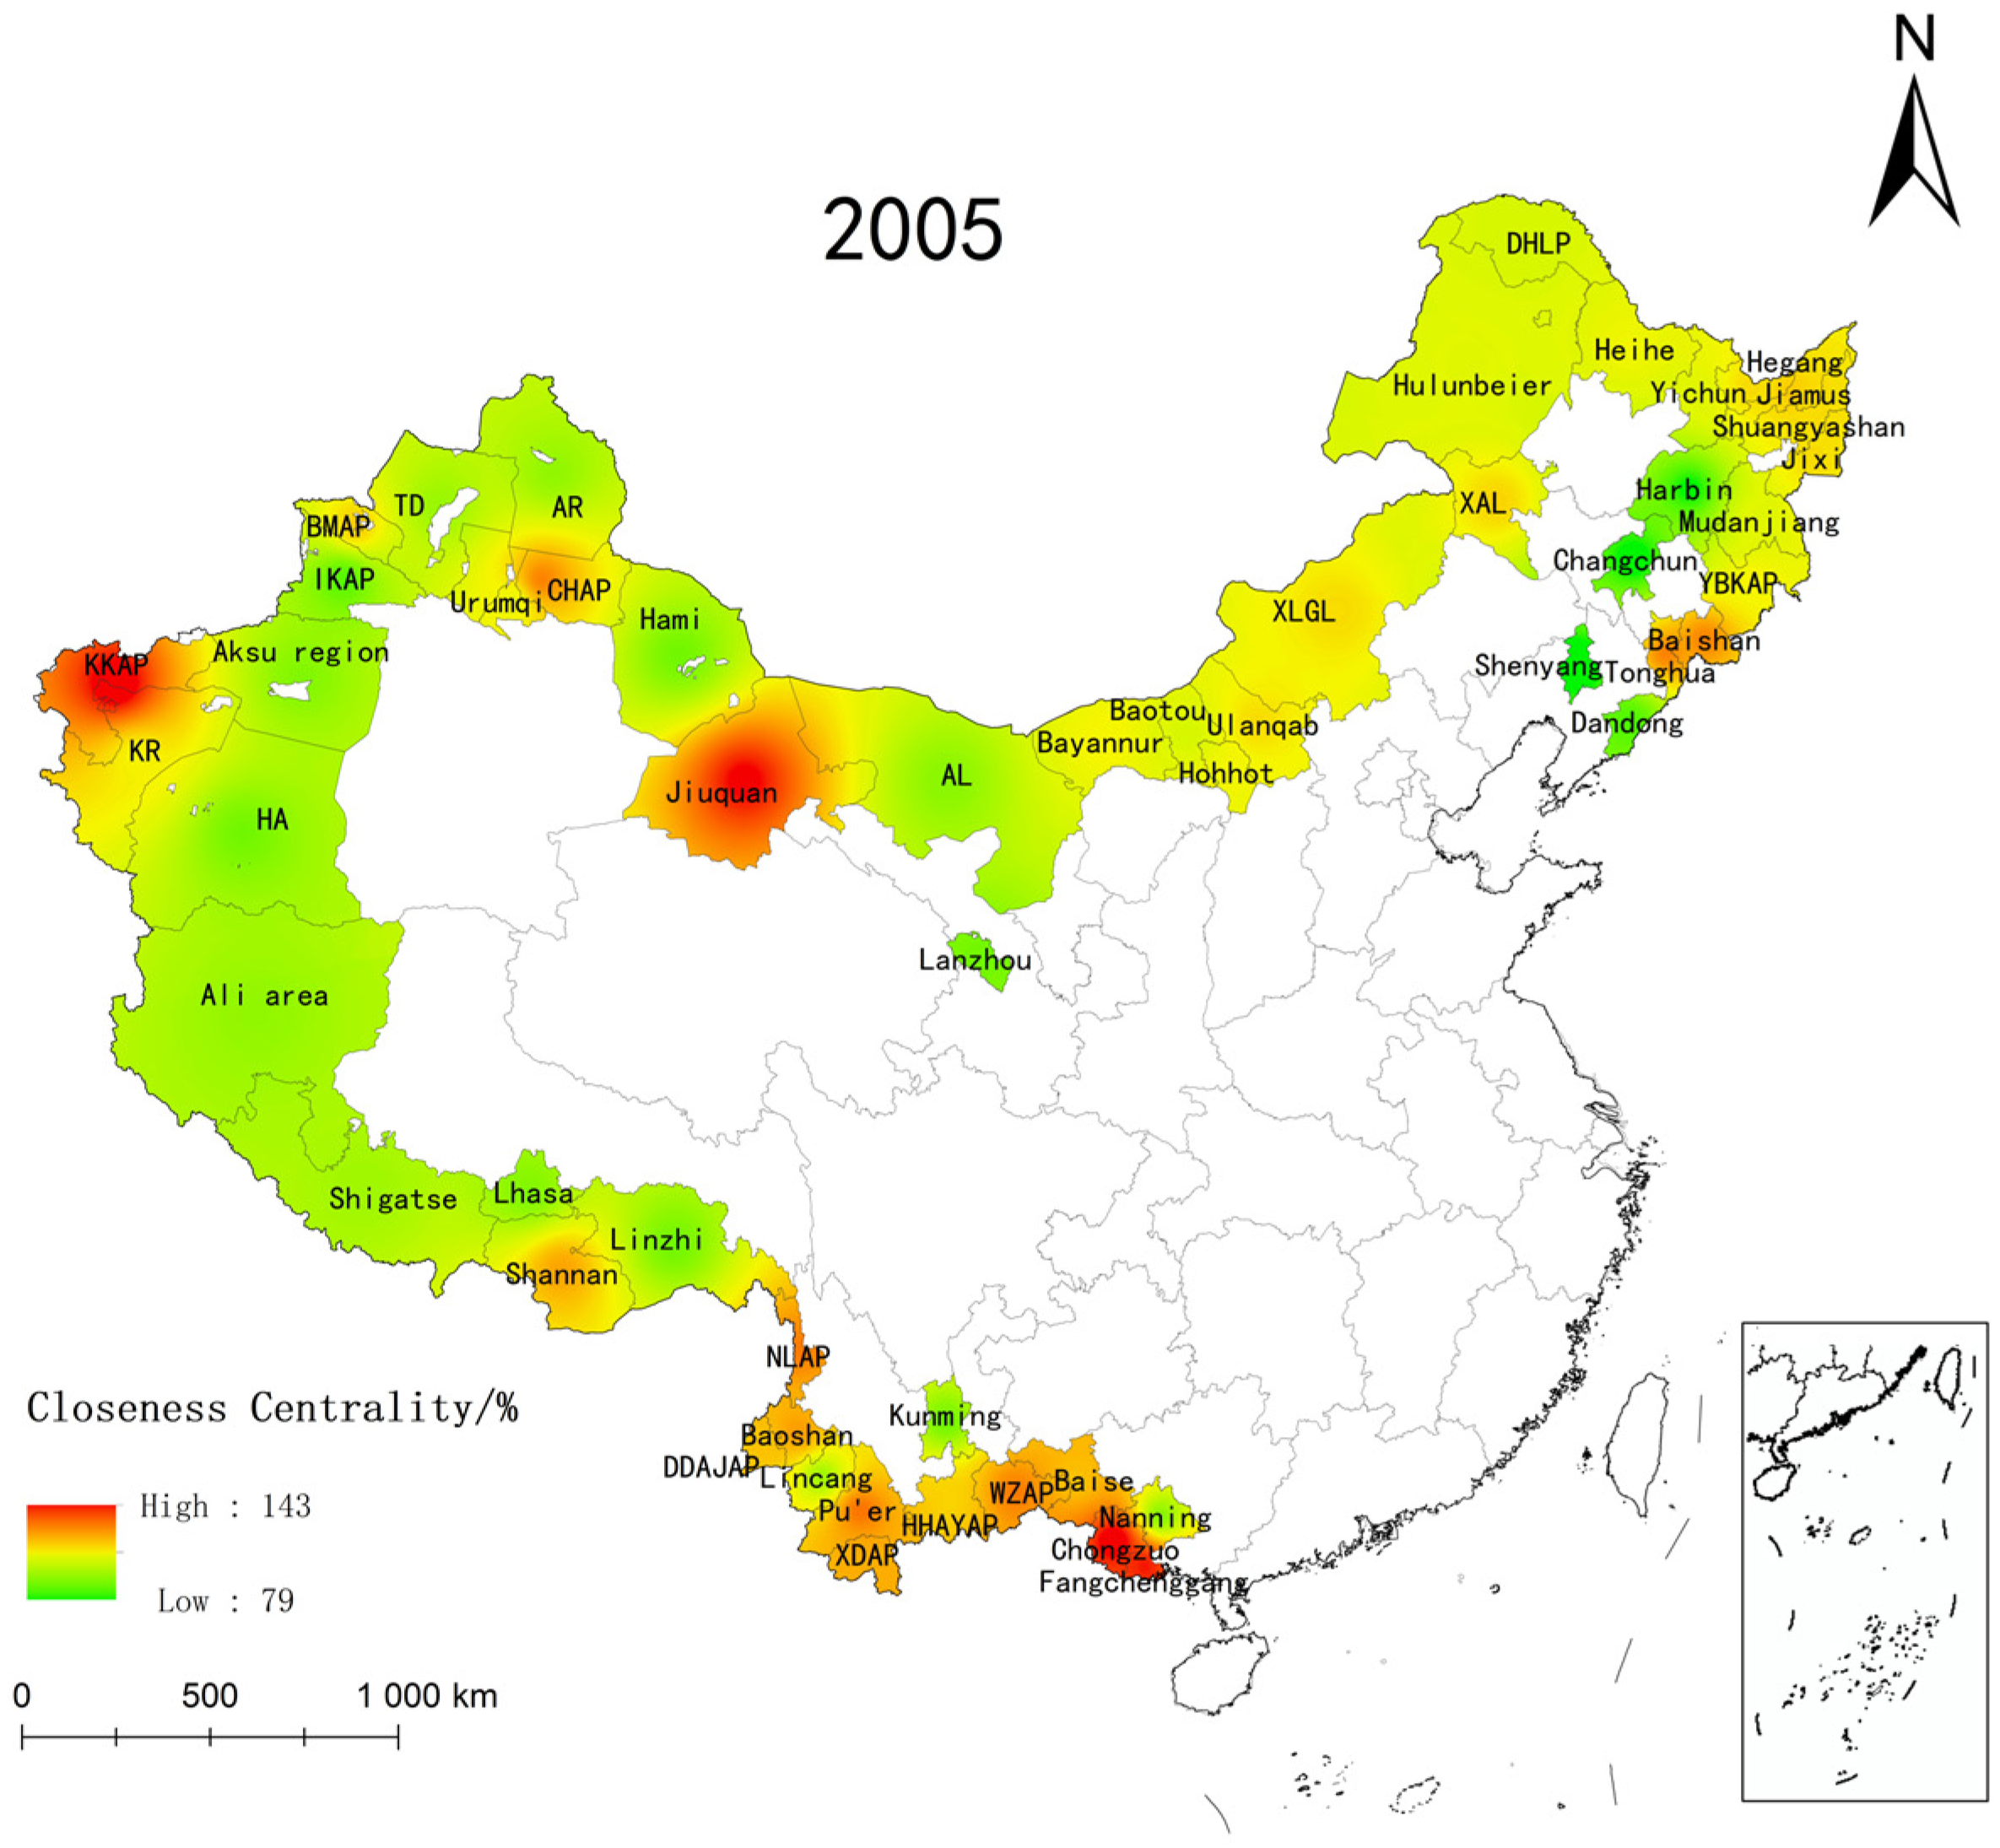


- 3.
- Betweenness Centrality
4.2.5. Structural Hole Analysis
5. Discussion
5.1. Tourism Economic Linkages and Linkage Volume Perspectives
5.2. Perspectives on Social Network Characteristics of Tourism Economic Linkages in Land-Level Border Cities in China
6. Conclusions
Author Contributions
Funding
Institutional Review Board Statement
Informed Consent Statement
Data Availability Statement
Acknowledgments
Conflicts of Interest
References
- China Customs. Interim Management Measures for Border Tourism. China Cust. 1998, 1, 4–5. [Google Scholar]
- Zhang, G. Strategies and Policy Options for Border Tourism Development in China. Financ. Trade Econ. 1997, 3, 55–58. [Google Scholar] [CrossRef]
- Yao, S. A Test of Border Tourism and Its Role. J. Beijing Int. Stud. Univ. (BISU) 1998, 17–22. [Google Scholar]
- Xiong, M. Study on the Management of the Sino-Vietnamese Border Tourism System. Master’s Thesis, Guangxi University, Nanning, China, 2005. [Google Scholar]
- Guedes, A.S.; Jiménez, M.I.M. Spatial Patterns of Cultural Tourism in Portugal. Tour. Manag. Perspect. 2015, 16, 107–115. [Google Scholar] [CrossRef]
- Zhang, L. Sustainable development: A new agenda for quality tourism development. Tour. Trib. 2023, 38, 1–2. [Google Scholar] [CrossRef]
- Sergeyeva, A.; Abdullina, A.; Nazarov, M.; Turdimambetov, I.; Maxmudov, M.; Yanchuk, S. Development of Cross-Border Tourism in Accordance with the Principles of Sustainable Development on the Kazakhstan-Uzbekistan Border. Sustainability 2022, 14, 12734. [Google Scholar] [CrossRef]
- Kropinova, E. Transnational and Cross-Border Cooperation for Sustainable Tourism Development in the Baltic Sea Region. Sustainability 2021, 13, 2111. [Google Scholar] [CrossRef]
- Mikhaylova, A.A.; Wendt, J.A.; Hvaley, D.V.; Bógdał-Brzezińska, A.; Mikhaylov, A.S. Impact of Cross-Border Tourism on the Sustainable Development of Rural Areas in the Russian–Polish and Russian–Kazakh Borderlands. Sustainability 2022, 14, 2409. [Google Scholar] [CrossRef]
- Gao, J.; Wang, L.; Huang, Q. Rural Transformation and Sustainable Development Paths in Border Tourism Lands--An Ethnographic Study of Yunnan’s Daluo Port Area. Geogr. Res. 2020, 39, 2233–2248. [Google Scholar]
- Li, C.; Fan, S. Current Situation of Border Tourism in Honghe Prefecture and its Countermeasures for Sustainable Development. China J. Commer. 2010, 18, 80–81. [Google Scholar]
- Chen, T. Sustainable Development of Sino-Vietnamese Border Tourism--Third in a Series of Papers on Border Tourism in the Beibu Gulf Region. J. Southwest Minzu Univ. 2005, 1, 336–340. [Google Scholar]
- Jiang, M. Analysis of problems and countermeasures in the development of border tourism in Guangxi. Tour. Forum 2008, 4, 86–89. [Google Scholar]
- Scott, N.; Cooper, C.; Baggio, R. Destination networks: Four Australian cases. Ann. Tour. Res. 2008, 35, 169–188. [Google Scholar] [CrossRef]
- Scott, N.; Baggio, R.; Cooper, C. Network Analysis and Tourism: From Theory to Practice; Channel View Publications: Bristol, UK, 2008. [Google Scholar]
- Santana-Gallego, M.; Ledesma-Rodríguez, F.J.; Pérez-Rodríguez, J.V. International Trade and Tourism Flows: An Extension of the Gravity Model. Econ. Model. 2016, 52, 1026–1033. [Google Scholar] [CrossRef]
- Kang, S.; Lee, G.; Kim, J.; Park, D. Identifying the Spatial Structure of the Tourist Attraction System in South Korea Using GIS and Network Analysis: An Application of Anchor-Point Theory. J. Destin. Mark. Manag. 2018, 9, 358–370. [Google Scholar] [CrossRef]
- Sarrión-Gavilán, M.D.; Benítez-Márquez, M.D.; Mora-Rangel, E.O. Spatial Distribution of Tourism Supply in Andalusia. Tour. Manag. Perspect. 2015, 15, 29–45. [Google Scholar] [CrossRef]
- Peng, H.; Zhang, J.; Liu, Z.; Lu, L.; Yang, L. Network Analysis of Tourist Flows: A Cross-Provincial Boundary Perspective. Tour. Geogr. 2016, 18, 561–586. [Google Scholar] [CrossRef]
- Marrocu, E.; Paci, R. Different tourists to different destinations. Tour. Manag. 2013, 39, 71–83. [Google Scholar] [CrossRef]
- Hwang, Y.-H.; Gretzel, U.; Fesenmaier, D.R. Multicity Trip Patterns. Ann. Tour. Res. 2006, 33, 1057–1078. [Google Scholar] [CrossRef]
- Sofield, T.H.B. Border Tourism and Border Communities: An Overview. Tour. Geogr. 2006, 8, 102–121. [Google Scholar] [CrossRef]
- García-Palomares, J.C.; Gutiérrez, J.; Mínguez, C. Identification of Tourist Hot Spots Based on Social Networks: A Comparative Analysis of European Metropolises Using Photo-Sharing Services and GIS. Appl. Geogr. 2015, 63, 408–417. [Google Scholar] [CrossRef]
- Leung, X.Y.; Wang, F.; Wu, B.; Bai, B.; Stahura, K.A.; Xie, Z. A Social Network Analysis of Overseas Tourist Movement Patterns in Beijing: The Impact of the Olympic Games. Int. J. Tour. Res. 2012, 14, 469–484. [Google Scholar] [CrossRef]
- Wang, S.; He, Z.; Guo, Y.; Guo, A. Does tourism poverty reduction have spatial spillover effect? Econ. Manag. 2020, 42, 103–119. [Google Scholar] [CrossRef]
- Song, X.; Li, Q.; Ruan, W. Dynamic mechanism and causal combination configuration of tourism economic network evolution in urban agglomerations on the west coast of the Taiwan Strait. World Reg. Stud. 2022, 31, 1321–1331. [Google Scholar]
- Yu, T.; Zuo, B.; A, R.; Gao, J. Spatial pattern and driving mechanism of tourism development in China’s border areas. Econ. Geogr. 2021, 41, 203–213. [Google Scholar] [CrossRef]
- Wang, L.; Gao, M. Spatial Characterization of Tourism Economy in City Clusters in the Middle Reaches of the Yangtze River Based on Social Network Analysis Perspective. Acad. Res. 2019, 4, 43–48+84. [Google Scholar]
- Huang, D.; Wang, Z. Evolution and effect of spatial network structure of tourism eco-efficiency in urban agglomerations in the middle reaches of Yangtze River. Resour. Environ. Yangtze River Basin 2023, 32, 2326–2337. [Google Scholar]
- Ruan, W.; Zhang, S.; Zheng, X. Study on the network structure and formation mechanism of Chinese tourist flow to Thailand. World Reg. Stud. 2018, 27, 34–44. [Google Scholar]
- Luo, J.; Zhang, B.; Liu, S. The spatial relationship between transportation accessibility and tourism economy in Guangdong-Hong Kong-Macao Greater Bay Area. Econ. Geogr. 2020, 40, 213–220. [Google Scholar] [CrossRef]
- Wu, Z.; Zhang, L.; Huang, S. Spatial structure and cooperative mode of tourism economic links in Guangdong-Hong Kong-Macao Greater Bay Area. Geogr. Res. 2020, 39, 1370–1385. [Google Scholar]
- Han, J.; Ming, Q.; Shi, P. Characterization of Regional Tourism Network Structure and its Role Mechanisms under the Perspective of Multidimensional “Flow”---Taking Yunnan Province as an Example. World Reg. Stud. 2021, 30, 645–656. [Google Scholar]
- Meng, A.; Geng, K.; Liu, Y. Tourism flow patterns and driving factors of land border tourist destinations in China. Reg. Res. Dev. 2022, 41, 101–105. [Google Scholar]
- Mi, K.; Ye, C.; Ma, R.; Zhuang, R. Spatiotemporal differentiation and evolution of tourism economy in Yangtze River Delta region. J. Shaanxi Norm. Univ. 2014, 42, 85–90. [Google Scholar] [CrossRef]
- Shi, Q.; Xie, Y.; Han, Z.; Liu, T.; Liu, G.; Du, P. Spatial structure and development mode of inter-city tourism economic relations in Northeast China. Econ. Geogr. 2018, 38, 211–219. [Google Scholar] [CrossRef]
- Li, H.; Wang, L.; Yu, L. Analysis on the strength and network characteristics of China’s regional tourism economic relations. Stat. Decis. 2022, 38, 102–107. [Google Scholar] [CrossRef]
- Ma, L.; Zhang, J. Evolution of Spatial Differences and Interaction between Tourism and Economic Development in City Clusters in the Middle Reaches of the Yangtze River. Ecol. Econ. 2020, 36, 116–121+134. [Google Scholar]
- Yan, H.; Xu, F.; Xiong, H.; Wang, Y. Characterization of the Spatial Structure of Tourism Economy Based on the “3d” Framework of New Economic Geography--The Case of Yangtze River Delta Region. Hum. Geogr. 2020, 35, 76–84. [Google Scholar] [CrossRef]
- Zhang, S.; Wang, Y.; Ju, H.; Zhong, L. Regional differences in the development of land border tourism in China and its influencing factors. Geogr. Res. 2020, 39, 414–429. [Google Scholar]
- Liu, M.; Wei, Q. Study on the spatial differentiation of vulnerability of tourism economic system in Chinese border areas. Resour. Dev. Mark. 2021, 37, 1108–1114. [Google Scholar]
- Huang, A.; Zhu, J.; Peng, C. Study on the Evolution and Characteristics of the Spatial Structure of Tourism Economy in China’s Border Provinces. Inq. Into Econ. Issues 2021, 1, 155–170. [Google Scholar]
- Taaffe, E.J. The urban hierarchy: An air passenger definition. Econ. Geogr. 1962, 38, 1–14. [Google Scholar] [CrossRef]
- Yao, S.; Wang, D.; Ye, F. Radiation function and development trend of Xiamen Special Economic Zone economy. Acta Geogr. Sin. 1989, 2, 140–146. [Google Scholar]
- Wang, D.; Zhuang, R. A Primer on Quantitative Analysis of Regional Economic Linkages--Taking Shanghai’s Economic Linkages with Suzhou, Wuxi and Changzhou as an Example. Sci. Geogr. Sin. 1996, 1, 51–57. [Google Scholar]
- Zhou, H.; Wang, F. Characterizing the Spatial Network Structure of Interprovincial Tourist Flows in China Based on Modified Gravity Modeling. Geogr. Res. 2020, 39, 669–681. [Google Scholar]
- Liu, J. Overall Network Analysis—A Practical Guide to UCINET Software; Gezi Publishing House: Shanghai, China, 2014. [Google Scholar]
- Su, Z.; Aaron, J.R.; McDowell, W.C.; Lu, D.D. Sustainable Synergies between the Cultural and Tourism Industries: An Efficiency Evaluation Perspective. Sustainability 2019, 11, 6607. [Google Scholar] [CrossRef]
- Streimikiene, D.; Svagzdiene, B.; Jasinskas, E.; Simanavicius, A. Sustainable tourism development and competitiveness: The systematic literature review. Sustain. Dev. 2021, 29, 259–271. [Google Scholar] [CrossRef]
- Wan, J.; Yan, J.; Wang, X.; Liu, Z.; Wang, H.; Wang, T. Spatial-Temporal Pattern and Its Influencing Factors on Urban Tourism Competitiveness in City Agglomerations Across the Guanzhong Plain. Sustainability 2019, 11, 6743. [Google Scholar] [CrossRef]
- Ma, X.; Yang, Z.; Zheng, J. Analysis of spatial patterns and driving factors of provincial tourism demand in China. Sci. Rep. 2022, 12, 2260. [Google Scholar] [CrossRef]
- Hunter, C.J. On the need to re-conceptualise sustainable tourism development. J. Sustain. Tour. 1995, 3, 155–165. [Google Scholar] [CrossRef]
- Liu, Z. Sustainable tourism development: A critique. J. Sustain. Tour. 2003, 11, 459–475. [Google Scholar] [CrossRef]


| Area | Provinces | Land Border Prefecture-Level Cities | Bordering Countries |
|---|---|---|---|
| Northeastern | Liaoning | Dandong | DPRK, Russia, Mongolia |
| Jilin | Baishan, Tonghua, Yanbian Korean Autonomous Prefecture (YBKAP) | ||
| Heilongjiang | Da Hinggan Ling Prefecture (AHLP), Heihe, Yichun, Hegang, Jiamusi, Shuangyashan, Jixi, Mudanjiang | ||
| Eastern Inner Mongolia Autonomous Prefecture | Hulunbeier, Xing’an League (XAL), Xilin Gol league (XLGL) | ||
| Northwestern | Gansu | Jiuquan | Russia, Mongolia, Kazakhstan, Tajikistan, Kyrgyzstan, Afghanistan, Pakistan, India, Nepal, Bhutan |
| Tibet | Linzhi, Shannan, Shigatse, Ali area | ||
| Xinjiang | Hotan area (HA), Kashgar region (KR), Tacheng District (TD), Altay region (AR), Aksu region, Hami, Kizilsu Kyrgyz Autonomous Prefecture (KKAP), Ili Kazakh Autonomous Prefecture (IKAP), Bortala Mongol Autonomous Prefecture (BMAP), Changji Hui Autonomous Prefecture (CHAP) | ||
| Western Inner Mongolia Autonomous Prefecture | Baotou, Ulanqab, Bayannur, Alxa League (AL) | ||
| Southwestern | Yunnan | Wenshan Zhuang Autonomous Prefecture (WZAP), Honghe Hani and Yi Autonomous Prefecture (HHAYAP), Xishuangbanna Dai Autonomous Prefecture (XDAP), Dehong Dai and Jingpo Autonomous Prefectures (DDAJAP), Nujiang Lisu Autonomous Prefecture (NLAP), Pu’er, Lincang, Baoshan | Vietnam, Laos, Myanmar |
| Guangxi | Baise, Chongzuo, Fangchenggang |
| Centrality Indicators | Formula | Description of the Formula |
|---|---|---|
| Degree Centrality | (3) | is the degree center degree of the node and n denotes the number of other points in the network connected to i |
| Closeness Centrality | (4) | is the proximity centrality of the node; d (ni,nj) denotes the shortest distance between point i and point j |
| Betweenness centrality | (5) | is the relative median centrality of point I; bjk (i) indicates that the shortest path from j to k passes through i. The denominator indicates the number of paths between the two points, i.e., the number of all paths |
| Particular Year | Densities | Growth Rate/% |
|---|---|---|
| 2005 | 0.1191 | - |
| 2010 | 0.1366 | 14.69 |
| 2016 | 0.1461 | 6.95 |
| 2019 | 0.1488 | 1.85 |
| Area | 2005 Core Area | 2010 Additional Core Areas | 2016 Additional Core Areas | 2019 Additional Core Areas |
|---|---|---|---|---|
| Northeastern | Baishan, Tonghua, Yanbian Korean Autonomous Prefecture, Changchun, Dandong, Shenyang, Yichun, Heihe, Shuangyashan, Mudanjiang, Jixi, Jiamusi, Harbin, Hulunbeier | Hegang | Xilin Gol league | - |
| Northwestern | - | - | Jiuquan, Lanzhou | Ili Kazakh Autonomous Prefecture, Ali Region |
| Southwestern | - | - | Kunming | Baise, Nanning, Honghe Hani and Yi Autonomous Prefecture |
| Particular Year | 2005 | 2010 | 2016 | 2019 | ||||
|---|---|---|---|---|---|---|---|---|
| Contact Density | Core Figure | Interface | Core Figure | Interface | Core Figure | Interface | Core Figure | Interface |
| Core figure | 0.44 | 0.005 | 0.516 | 0.007 | 0.404 | 0.069 | 0.35 | 0.088 |
| Interface | 0.129 | 0.119 | 0.109 | 0.149 | 0.183 | 0.119 | 0.224 | 0.072 |
Disclaimer/Publisher’s Note: The statements, opinions and data contained in all publications are solely those of the individual author(s) and contributor(s) and not of MDPI and/or the editor(s). MDPI and/or the editor(s) disclaim responsibility for any injury to people or property resulting from any ideas, methods, instructions or products referred to in the content. |
© 2024 by the authors. Licensee MDPI, Basel, Switzerland. This article is an open access article distributed under the terms and conditions of the Creative Commons Attribution (CC BY) license (https://creativecommons.org/licenses/by/4.0/).
Share and Cite
Gan, J.; Zhang, D.; Guo, F.; Dong, E. Intensity of Tourism Economic Linkages in Chinese Land Border Cities and Network Characterization. Sustainability 2024, 16, 1843. https://doi.org/10.3390/su16051843
Gan J, Zhang D, Guo F, Dong E. Intensity of Tourism Economic Linkages in Chinese Land Border Cities and Network Characterization. Sustainability. 2024; 16(5):1843. https://doi.org/10.3390/su16051843
Chicago/Turabian StyleGan, Jing, Dongxue Zhang, Fuyou Guo, and Erwei Dong. 2024. "Intensity of Tourism Economic Linkages in Chinese Land Border Cities and Network Characterization" Sustainability 16, no. 5: 1843. https://doi.org/10.3390/su16051843