Abstract
Pile foundation is the most important foundation type of long-span bridges, of which the ultimate load-bearing capacity affects the safety and sustainable performance of bridges. When constructing large-span bridges, the bridge site may be close to the adjacent fault zones, which seriously affects the safety and long-term performance of pile foundations, causing the failure and unsustainability of long-span bridges in their life-cycle service life. At present, there are no engineering design rules or methods for assessing the load-bearing capacity of the pile foundation near the fault zones. To study the influence of the fault zone on the loading-bearing capacity and sustainable performance of pile foundations, triaxial compression tests were carried out on the mylonite at the Yanji suspension bridge site near the Xiangfan–Guangji fault zone in Hubei Province. The mechanical properties of mylonite were reflected by the Mohr–Coulomb yield criterion, and a topographic and geological modeling method based on the multi-platform was established. Then, the ABAQUS finite element software was used to study the deformation, stress, failure modes, and sustainable performance of the pile foundation under different bridge load levels, analyze the safety of the pile foundation in the fracture zone, and summarize the ultimate bearing characteristics of the pile foundation. The results show that the whole pile and surrounding rock are basically elastic under the pressure of the designed load, the plastic zone of the pile foundation is mainly concentrated at the pile bottom, and the shear stress concentration zone of the pile is mainly manifested in the joint of the cap and pile and the interface between soft and hard rock. When the load is increased to 4 times the designed load, the stress concentration area of the pile body gradually shifts upward from the pile bottom, and the surrounding rock at the bottom forms an “X-shaped” shear failure zone. After 100 years of operation, the maximum compressive stress of piles reaches 28.6 MPa, which is 120% higher than that at the beginning of the bridge construction, indicating that the sustainable performance of the piles can withstand the effect of the fault zone over the designed service years.
1. Introduction
Due to the rapid economic development of urbanization in China over the last decades, many urban infrastructures have been constructed, such as buildings, highways, bridges, tunnels, and so on [1,2,3]. All these structures should be designed and constructed under the sustainable and resilience concept [4,5,6] to ensure functionality and safety during the life-cycle service. The sustainable concept of the designed structure requires resilience components and good structural loading capacity to withstand various risks and infrastructural problems. However, all these structures and bridges may face natural threats and hazards (e.g., earthquakes, slopes, typhoons, and faults) in their life-cycle service [7,8,9], especially long-span bridges, which are usually the key component of the transportation system. If the ultimate load-bearing capacity of long-span bridges cannot accommodate the increasing traffic demands and have substantial damage in the designed life, it would cause significant harmful impacts on transportation systems and cause large economic losses and casualties [9]. Furthermore, pile foundations are widely used for large-span bridges because of their good load-bearing capacity and strong stability [10]. Fault zones are widespread in China, and the bridges may be built close to them. Due to the significant relative displacement of rock blocks on both sides of the fault zone, the continuity and integrity of the rock layer may result in reduced support resistance of the rock and soil to the pile and weakened restraining effects on the pile from adjacent soil masses [11,12,13]. Therefore, research into the bearing capacity of pile foundations in fault zones can be used to assess the sustainability and resilience of the long-span bridge.
Many researchers have studied a great deal about the mechanical performance of pile foundations in near-fault zones [14]. For the impact of faults on the foundation or overall structure, Bray [15] suggested that when an active fault cannot be avoided, its effects can be minimized through a correct design. Park et al. [16] conducted the non-linear time history analysis of the multi-degree-of-freedom model to show the effect of the faults on the seismic damage of bridges. Bransby et al. [17] studied the interaction between fault and strip foundation by centrifuge model testing and finite element analysis. Zhao et al. [18] proposed a pile-column calculation model based on the difference between pile foundation considering the interaction of pile, pier and soil into account. Mohamed et al. [19] presented an analytical pile–cap soil model that allowed the calculation of the mobilized passive and lateral shear cap–soil resistances based on soil, cap, and pile properties. For the influence of faults on the dynamic responses of structures, Zhang et al. [20] carried out quasi-static tests on reduced-scale models. The test results showed that, quite differently from the pile foundation in unfrozen soils, severer damages occurred at the pile foundation in soils with permafrost. Anastasopoulos [21] discussed the interaction between normal fault rupture and structure based on the field observation of the Kocaeli earthquake in Turkey. Dong et al. [22] conducted a large-scale shaking table test (STT) to determine the dynamic characteristics of the bridge pile foundation with an artificial mass model. He et al. [23] constructed a soil-pile-bridge model to study the influence of near-fault seismic waves on the pile–soil interaction through shaking table tests. Hui et al. [24] calculated the seismic response of strike-slip fault beam bridges by using nonlinear time history analysis. Feng et al. [25] and Jia et al. [26] used Midas finite element software to establish a finite element model and analyzed the dynamic response of pile foundation of cross-fault bridge and under pile–soil–structure interactions. Cai et al. [27] studied the static failure of pile group foundations in overlying sandy soil induced by normal fault activity of bedrock and investigated the failure characteristics of pile groups under different relative positions of pile group faults. Fu et al. [28] simulated the failure process of high abutment group pile foundations under normal fault displacement based on FLAC3D finite difference software. Feng et al. [29] conducted indoor physical model tests and used the three-dimensional (3D) finite element program ABAQUS to investigate the lateral bearing capacity of single piles and pile groups in soft soil layers. For the geological modeling method, Song et al. [30] proposed a semi-automatic method for three-dimensional modeling and visualizing complex geological bodies by using ArcGIS10.4 and SketchUp2016. Hu et al. [31] summarized a set of methods for 3D numerical analysis of slope using MIDAS/GTS and AutoCAD for 3D geometric visualization. Liu et al. [32] used the Visual Basic program and the software CATIA to build the 3D geological model of the study area based on the GPR geological pictures. Su et al. [33] proposed a tunnel geological model based on CATIA and 3DSMAX software to create 3D models.
In general, pile foundations in fault zones require sophisticated geological modeling to accurately reflect their bearing characteristics due to the complexity of their geological conditions. This paper focused on pile foundations in fault zones and used the Yanji suspension bridge in Hubei Province as the engineering background. Triaxial compression tests were conducted to study the mechanical properties of mylonite. A 3D-refined geological modeling analysis method based on multi-platform collaboration was then established for the pile foundation sites. Then, the deformation, stress, and failure modes of the pile foundations and surrounding rocks under different bridge load levels were studied to analyze the safety of pile foundations in fault zones. Finally, the sustainable performance of the pile foundation was studied, providing a theoretical basis for the design of pile foundations in fault zones.
2. Project Overview and Testing
2.1. Project Overview
The Yanji suspension bridge is a large-span suspension bridge, the southern main pier of which is located within the Xiangfan–Guangji fault zone, according to the geological exploration test, which is shown in Figure 1. The Xiangfan–Guangji fault is a deep-seated regional fault consisting of several sets of parallel thrust faults and crush zones. Along the fault, there are secondary folds and developed fractures in the crush zones, with a large cutting depth and wide impact. Drilling and geophysical results show that this fault cuts diagonally across the bridge on the south bank, with a significant impact on the main pier foundation and nearby structures. The rock types within the Xiang–Guang fault zone mainly include mylonites, tectonic breccias, limestones, mudstones, and sandstones with complex lithology. Specific physical and mechanical parameters of the soil layers are shown in Table 1. The soft rocks within the Xiang–Guang fault zone are mainly mylonites, whose mechanical properties have an important influence on the stability of pile foundations on the south bank. In this paper, laboratory tests on the strength characteristics of mylonites were carried out to provide a basis for the selection of design parameters.
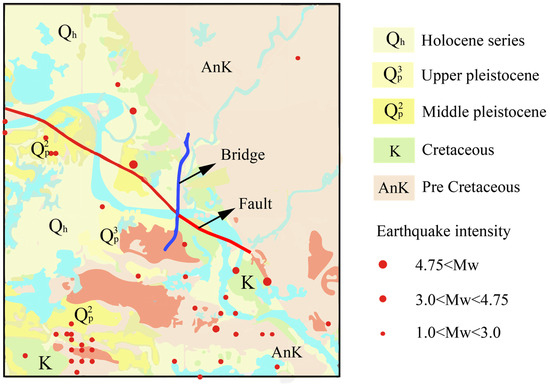
Figure 1.
Regional and local geological structures.

Table 1.
Basic physical and mechanical parameters of the soil layer at the site.
2.2. Triaxial Compression Test on Mylonites
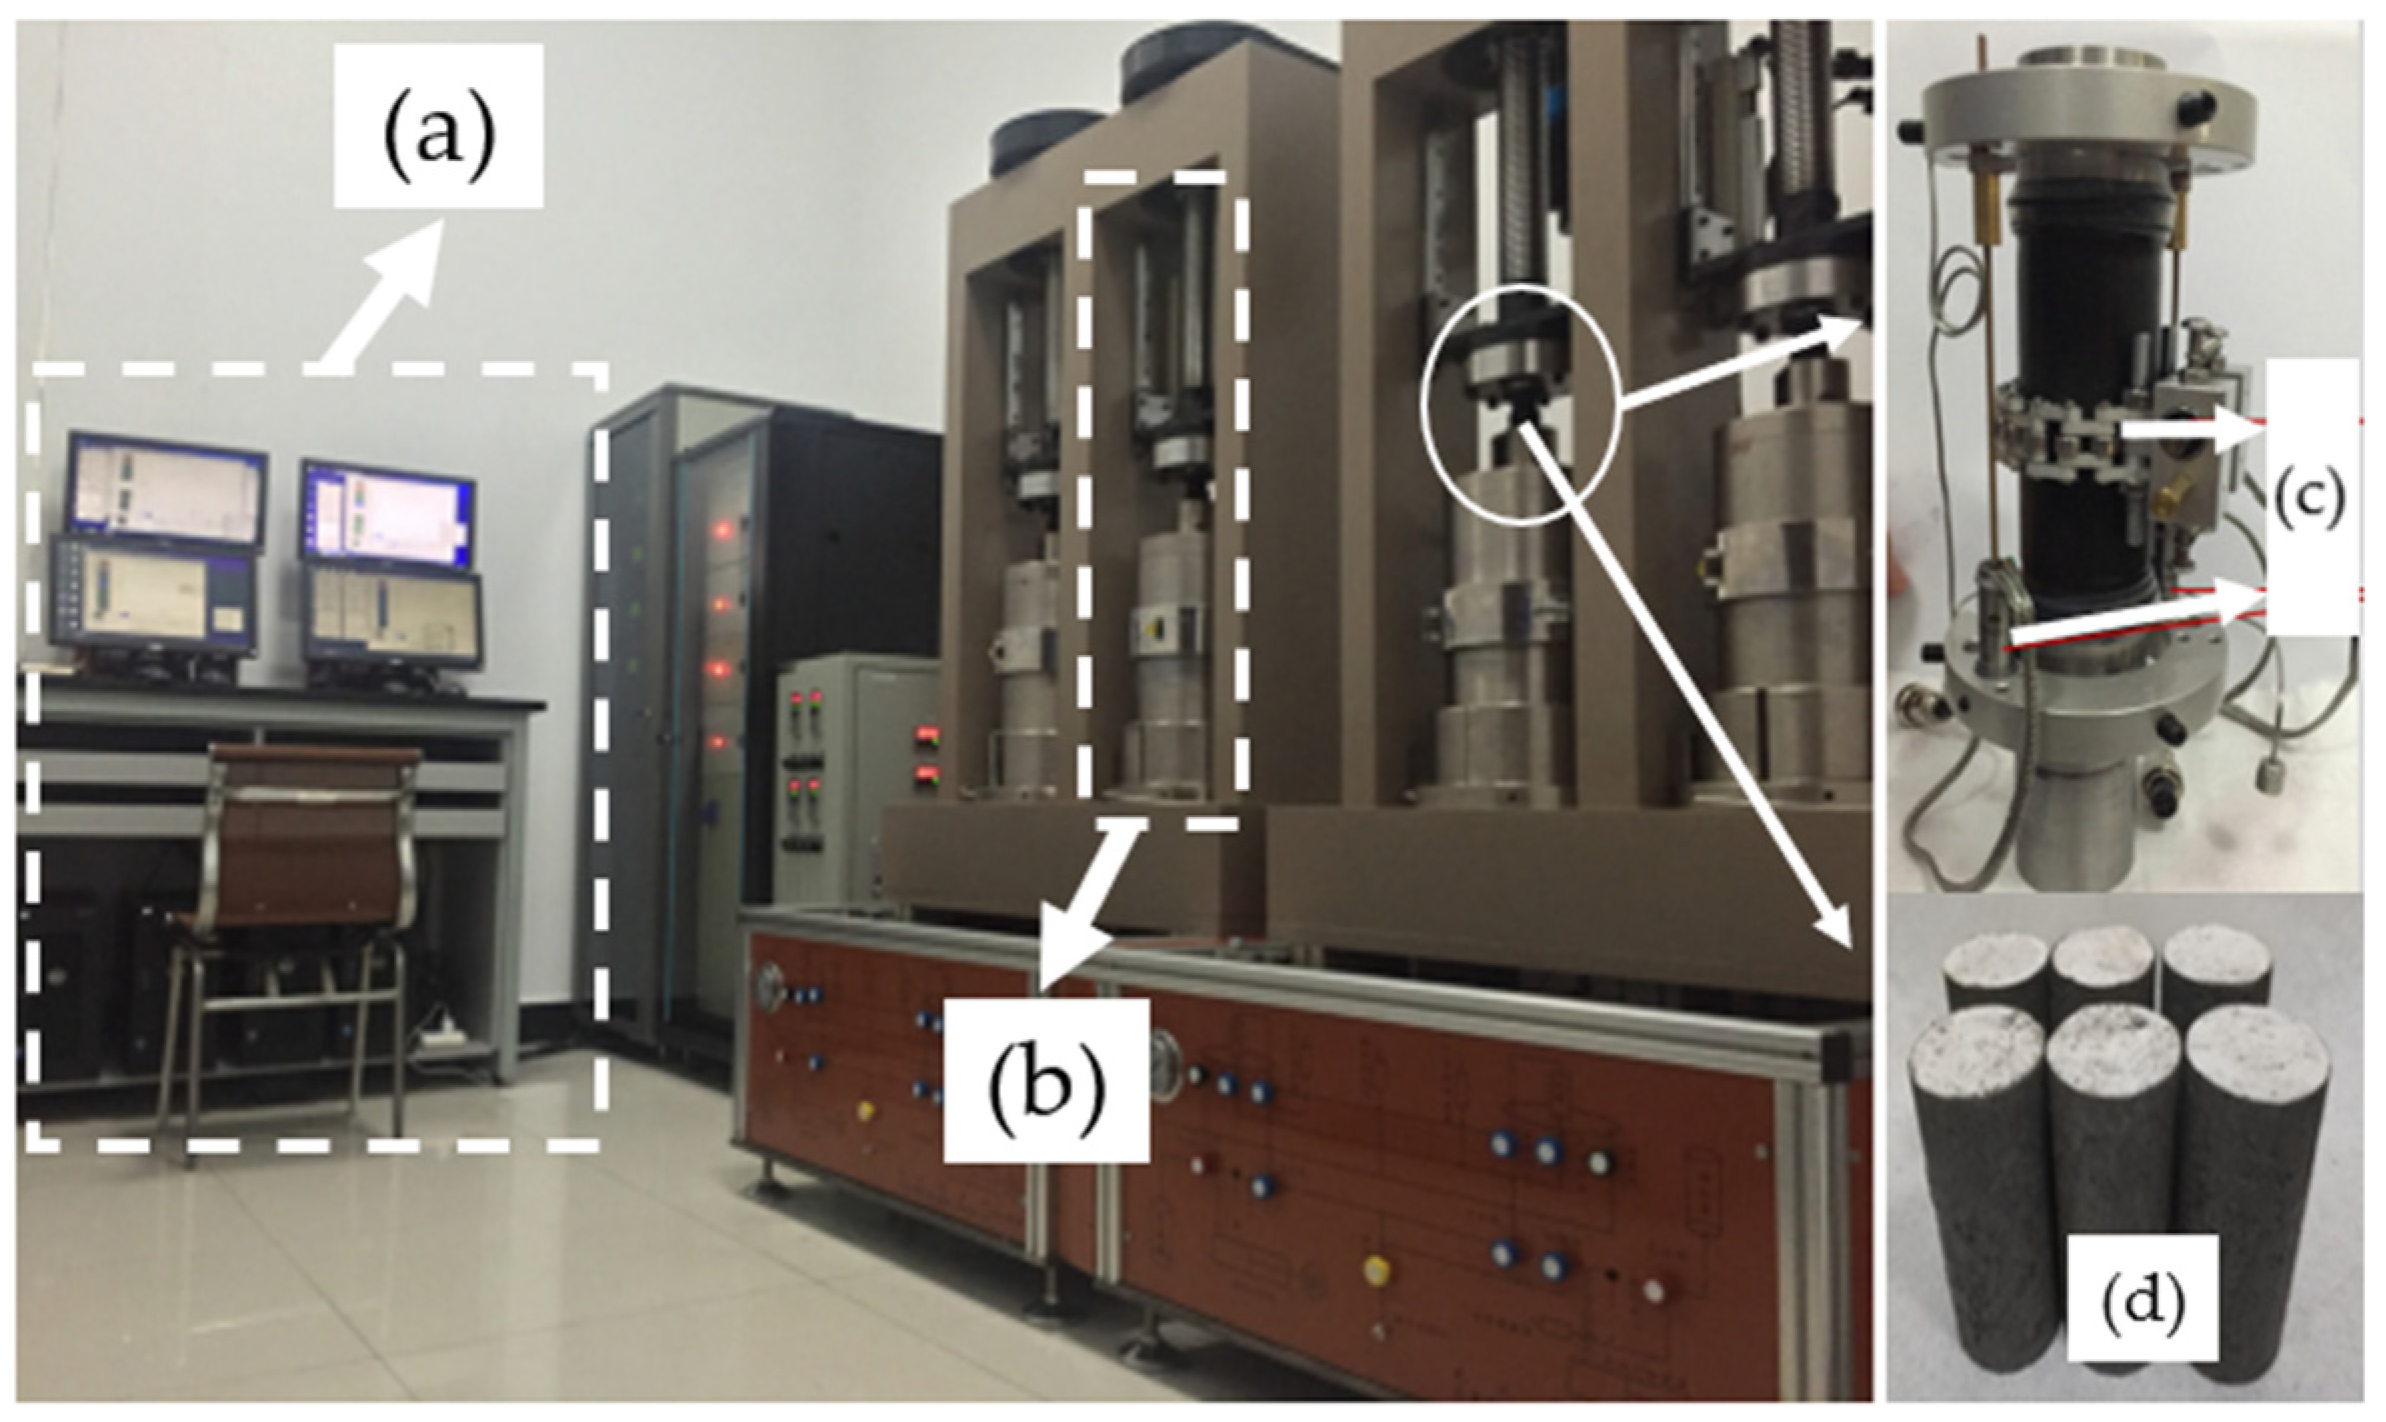
The triaxial testing equipment used in this paper is a parallel triaxial rock tester, which can be used to carry out experimental research on the mechanical properties of rock under different loading conditions. The instrument adopts a high-precision LVDT deformation sensor to accurately measure the deformation of the sample, as shown in Figure 2. The sample was selected from the representative core of the south main pier of the Yanji Yangtze River Bridge. The confining pressure of the triaxial test was selected as 1 MPa, 2 MPa and 3 MPa.
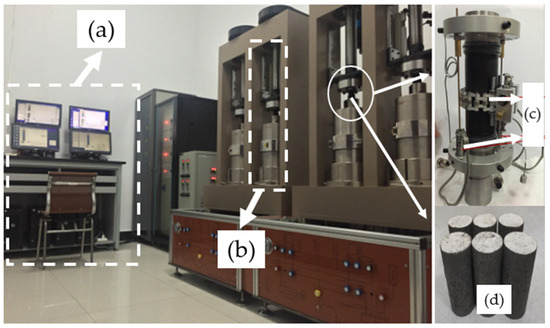
Figure 2.
Schematic of the Mylonite triaxial compression test. (a) Data acquisition system. (b) Triaxial rock test equipment. (c) Sensors. (d) Samples.
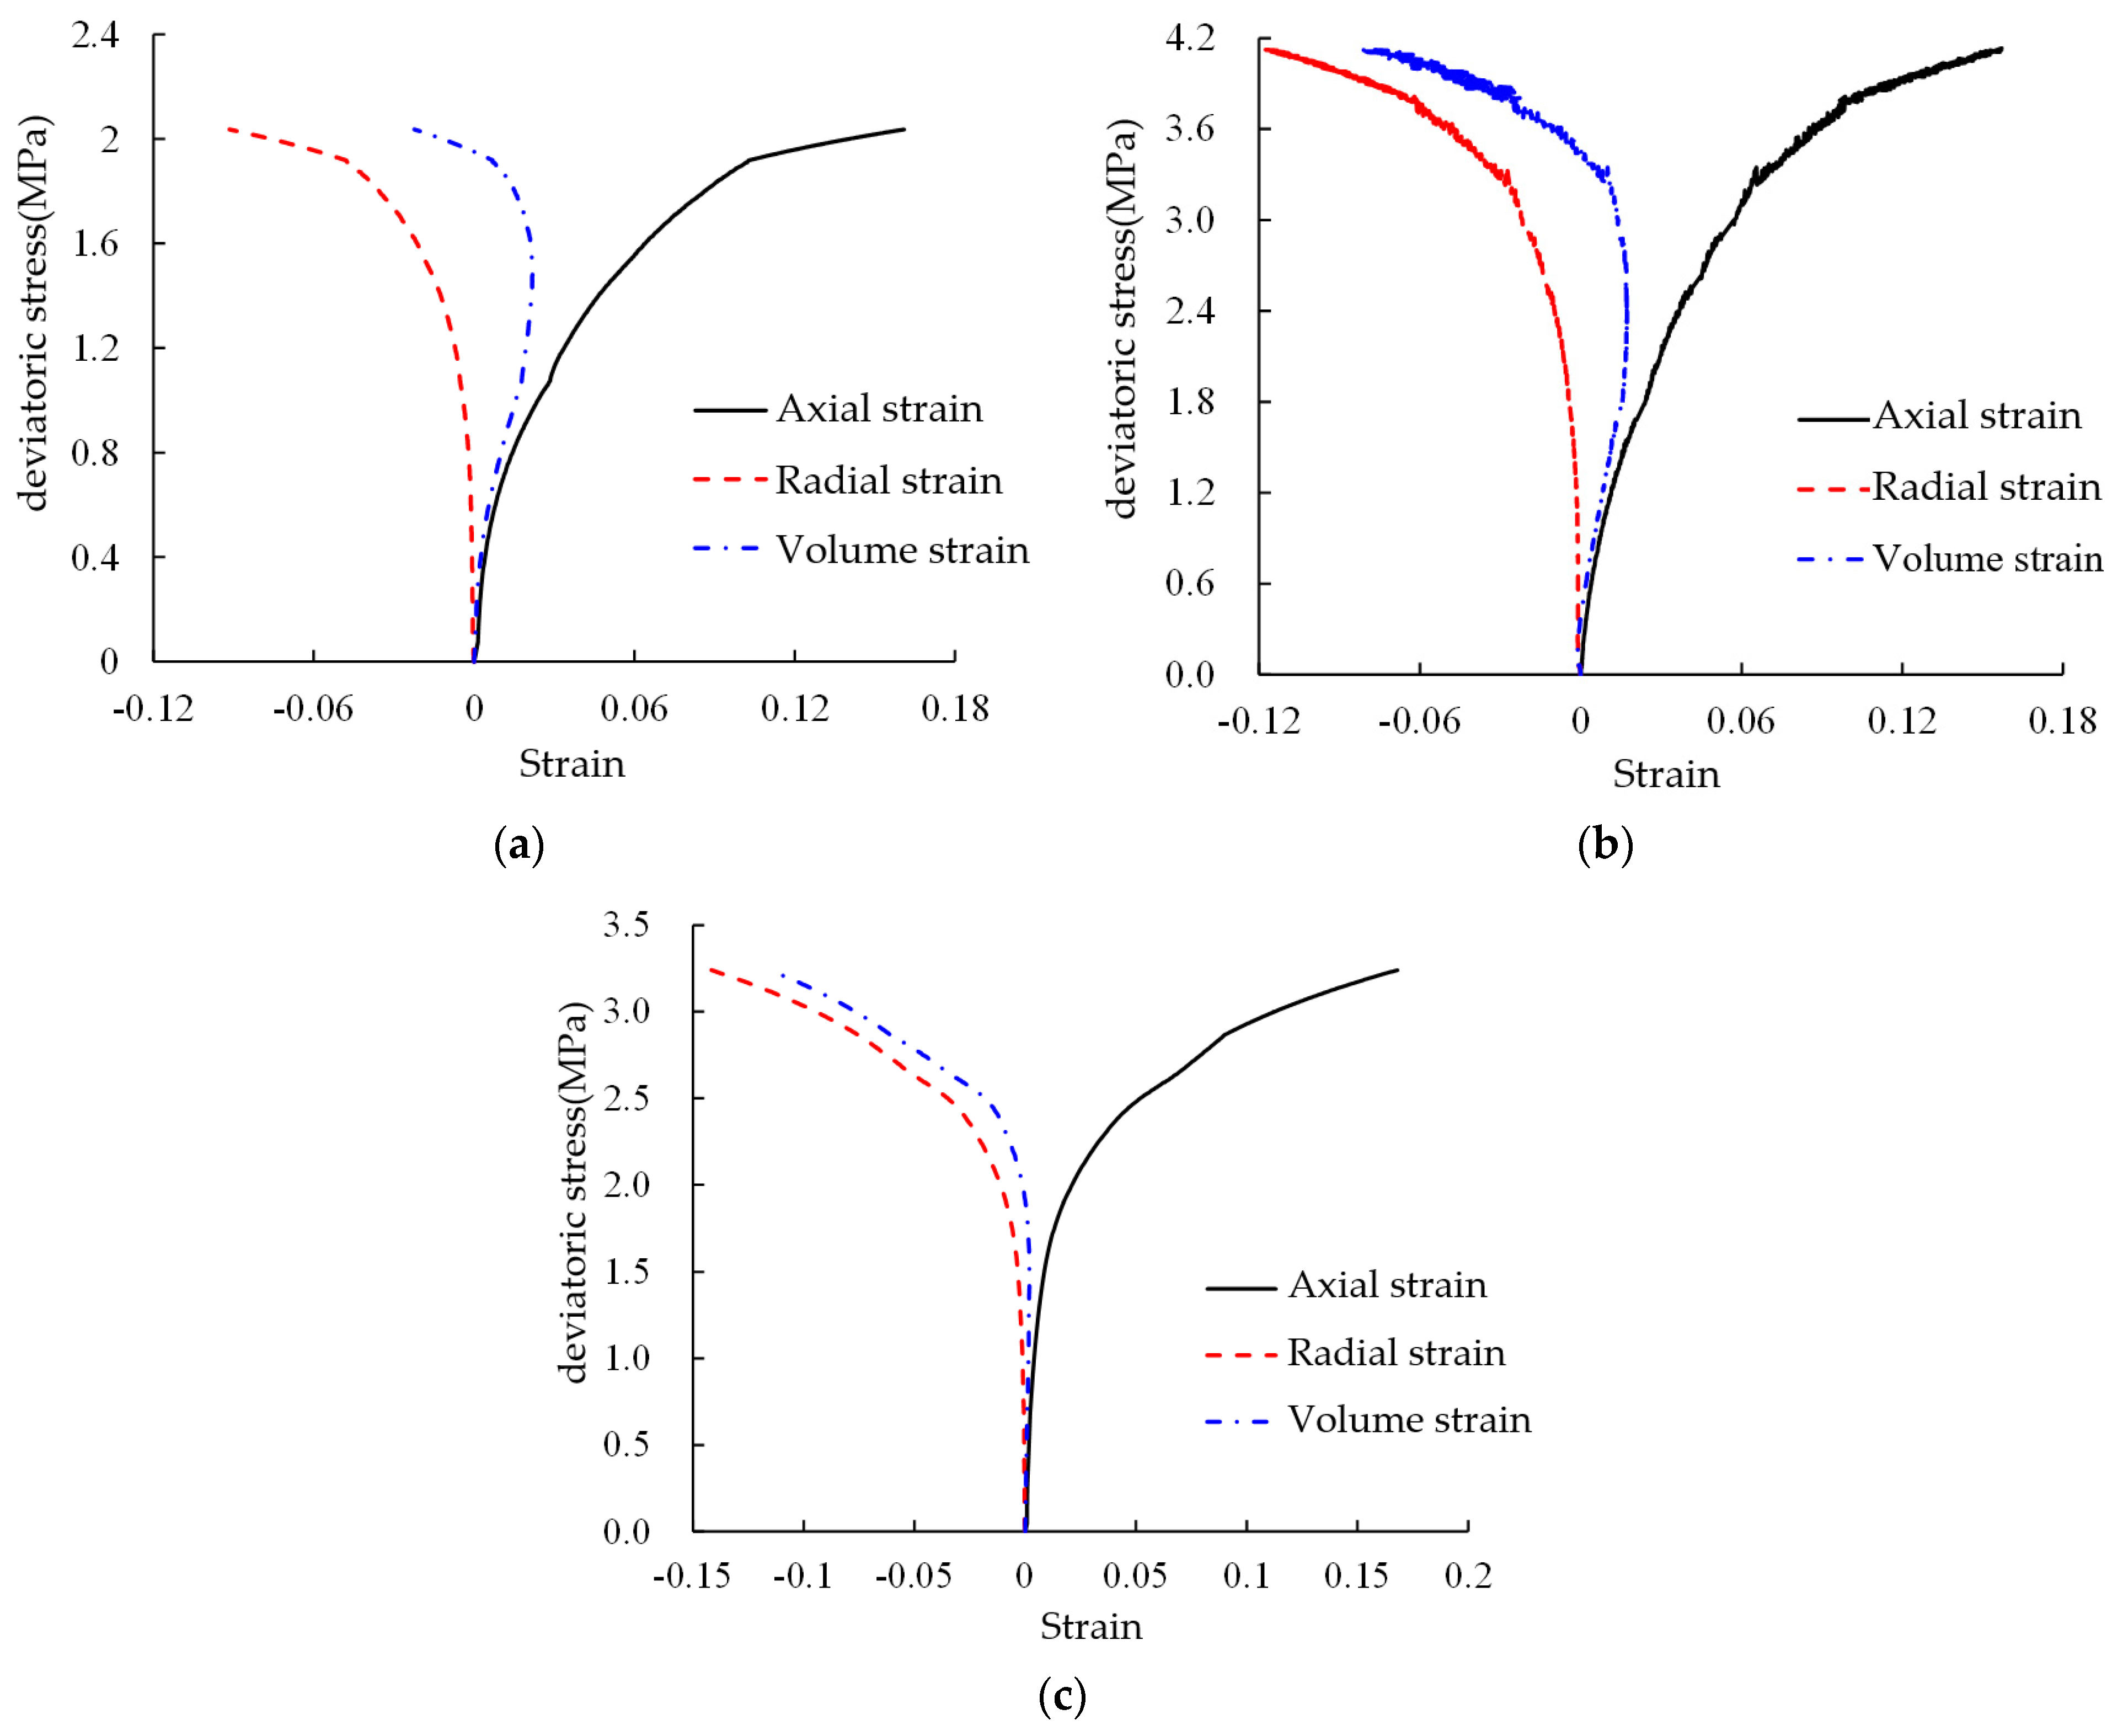
The triaxial compression test results of the mylonites under different confining pressures are shown in Figure 3, and the test results are shown in Table 2. It can be seen from the table that the maximum deformation modulus of mylonite is 160.69 MPa, the minimum is 41.61 MPa, and the average is 104.27 MPa. The maximum Poisson’s ratio is 0.33, the minimum is 0.30, and the average is 0.32.

Figure 3.
Triaxial compression test results of mylonites at different confining pressures. (a) Stress–strain curve of a mylonite sample under a confining pressure of 1 MPa. (b) Stress–strain curve of a mylonite sample under a confining pressure of 2 MPa. (c) Stress–strain curve of a mylonite sample under a confining pressure of 3 MPa.
Table 2.
Results of conventional triaxial test on the mylonite samples.
In this paper, the Mohr–Coulomb strength criterion is used to describe the mechanical structure of the mylonites. The Mohr–Coulomb strength criterion can be expressed as:
For the triaxial compression test, the Mohr stress circle gives the following relationship:
Substituting Equation (2) into Equation (1) gives the expression for the Mohr–Coulomb criterion in the triaxial compression test:
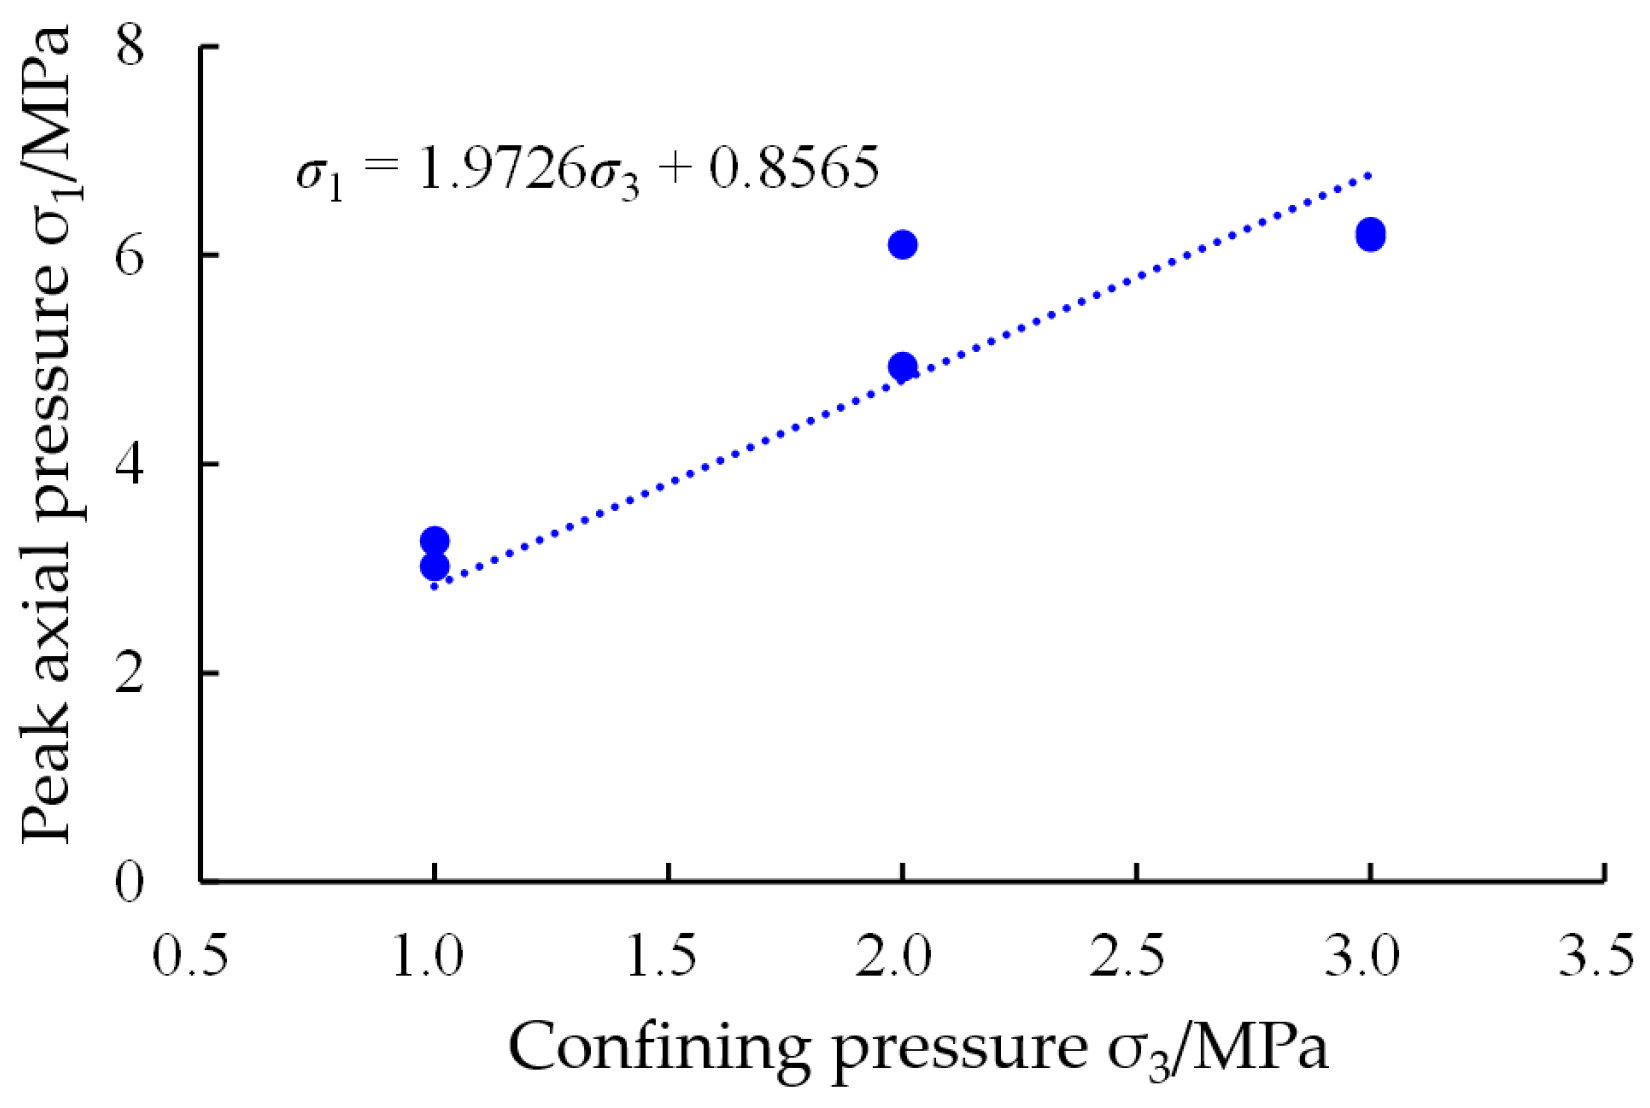
The results of the triaxial test on the mylonite samples are shown in Figure 4. It can be seen that the σ1–σ3 relationship curve is generally linear, and using the Mohr–Coulomb yield criterion can well reflect the mechanical properties of the mylonites in the area of the bridge site. The internal friction angle of the mylonites sample is ϕ = 19.10°, and the cohesion is c = 0.30 MPa.

Figure 4.
Mylonite sample σ1–σ3 relationship curve.
3. 3D Fine Geological Modelling
3.1. Introduction to the Multi-Platform Collaboration Method
The geological conditions of the pile foundation in the fault zone are complex, so a 3D-refined geological and topographic analysis model is needed as a basis for numerical calculations in order to obtain an analysis and calculation model that is closer to the actual construction. In this paper, a multi-platform collaborative terrain and geological modelling analysis method is used to perform accurate 3D geological and topographic modelling of the pile foundation in the fault zone.
The multi-platform combined fine geological modeling method proposed in this paper is a comprehensive application of the Goody2.16 platform, Surpac6.6 platform, CATIA V6 software platform, and ABAQUS2020 software platform. The Goody platform is a geographic information system developed on the basis of Google Earth, which can obtain corresponding terrain and surface information according to needs. Surpac is a shared information platform developed by Dassault. Its geological database customization function and management tool can record various geological exploration information, which is convenient for the construction of geological models and ore body resource models. CATIA is a 3D design software developed by Dassault. As an important intermediate software for this modeling method, CATIA has powerful functions in surface modeling and secondary development. Its 3D data format is interoperable with finite element analysis software, which can be used as a bridge between the early-stage geological model and the later-stage finite element analysis. As a large finite element numerical analysis software, ABAQUS can be used to analyze the bearing characteristics of the pile foundation of the main tower under bridge load.
The specific modeling process of the 3D fine geological model of the fault zone is shown in Figure 5. In the absence of topographic maps, the contour map and elevation point data of the underground engineering area are obtained based on the Goody platform to form point cloud data with an .asc suffix. These data are imported into CATIA software to create a terrain model. Based on the drilling information, rock layer boundaries are established in Surpac software, which are then integrated with the established terrain model to form a 3D geological and terrain simulation model. Finally, the resulting geological and terrain simulation model is imported into the ABAQUS software for numerical analysis.
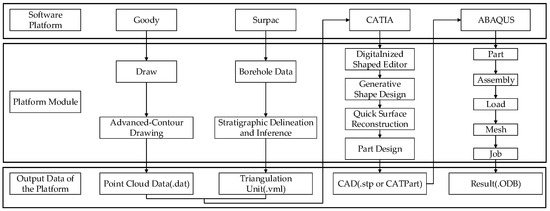
Figure 5.
Modeling flow chart of 3D refined geological and terrain simulation model.
3.2. The Steps for Fine Geological Modeling
Given the existing topographic map and borehole column map, the modeling area is determined according to the borehole column map and borehole plan, tabular data such as borehole position list, lithology data list, and dip data list are created, and the interpretation profile combination is determined according to the borehole position distribution. For each interpretation profile, the stratigraphic boundary of the same lithological and stratigraphic interface is derived from the imported borehole lithology data and sealed according to lithology to form a closed lithological section line on the section where it is located. The same interpretation operation is carried out on each interpretation section, and then the same lithological string is joined into a solid triangulation model according to relative position to form a rock and geological body. The final geological terrain simulation model is formed by combining the interpreted lithological geological unit models. The specific steps of 3D fine geological modeling are as follows:
- Open Goody software, determine the extent of the map using the drawing module according to the longitude and latitude of the project area.
- Enter the isoline extraction module and select the interval of sampling points and the distance of contour lines in the pop-up box to obtain the point cloud data and form an .asc file.
- Using the DSE module of CATIA software, import the .asc point cloud data and use the QSR model to form a terrain surface based on the point cloud and repair the surface.
- The hole position list, lithology data list, and inclination survey data list were sorted out according to the existing borehole column diagram and borehole location distribution data and imported into Surpac software to digitize the borehole location, lithology, and depth range.
- According to the distribution characteristics of the borehole location, a suitable interpretation section is established, the geological body area is delineated and derived according to the rock layer boundary for each interpretation section, and a closed section curve of the rock layer area is formed.
- Form the triangulation model by connecting the range curves of the strata formed by each section, and derive the WRL format for each lithological geological body.
- Enter the PD module of CATIA, seal the imported rock layers to obtain solid geological information based on the closed surface, and export it in stp or CATPart format.
- Import the file exported in the previous step into ABAQUS software for numerical finite element analysis.
3.3. Regional Geological Model of Pile Foundation Fault Zone
According to the above multi-platform-based 3D modeling method, the 3D geological model of the main south pier of the actual long-span suspension bridge and the detailed structural model of the cap and pile are constructed (Figure 6). The model is 300 m long, 100 m wide, and 130 m high. The pile diameter is 3.2 m, the pile length is 56 m, and the number of piles is 28. In the calculation, the bottom of the rock mass is derived according to the most unfavorable conditions, and the mylonite layer is formed at a depth of 100 m. In the finite element model, all soil layers are simulated using the Mohr–Coulomb model [34], and the surrounding rock, cap, and pile are all simulated using the C3D4 element [35]. The pile, cap, and surrounding rock are simulated using the Tie constraint. The pile and surrounding rock in the model are divided into 58,858 and 1,254,263 units, respectively. The pile foundation and surrounding rock are simulated using the contact element [36].
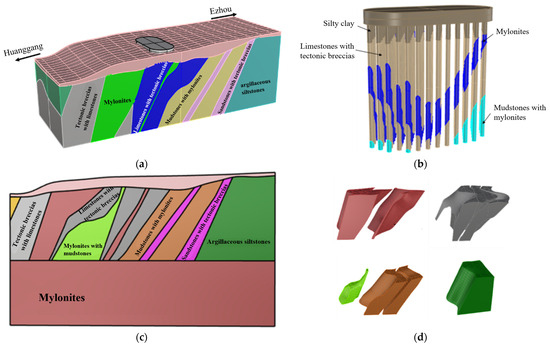
Figure 6.
3D fine geological model and detailed structural model of cap and pile body. (a) 3D geological model of pile foundation. (b) Pile foundation detail model. (c) Stratigraphic profile. (d) Various rock mass distribution patterns.
4. Results and Discussion
Physical and mechanical properties of the diverse fault zone lithologies are extremely different. In particular, the difference in compressive modulus and compressive strength between the weak mylonites and the hard limestones is more than 30 times. The stress and deformation characteristics of the bridges under load are also different. The influence of this difference on the loading and ultimate load-bearing capacity of the pile foundation needs a detailed analysis.
4.1. Stress Analysis of Pile Foundation and Surrounding Rock under Design Load
Based on the detailed 3D geological model of the pile foundation in the fault zone established above, this paper investigates the response of the pile foundation under the operational load of the bridge. For the design load at the top of the pile cap, the maximum axial force and bending moment of the standard load combination at the top of the pile cap are selected and combined according to the most unfavorable situation. The values are given in Table 3.
Table 3.
Design load on top of pile cap.
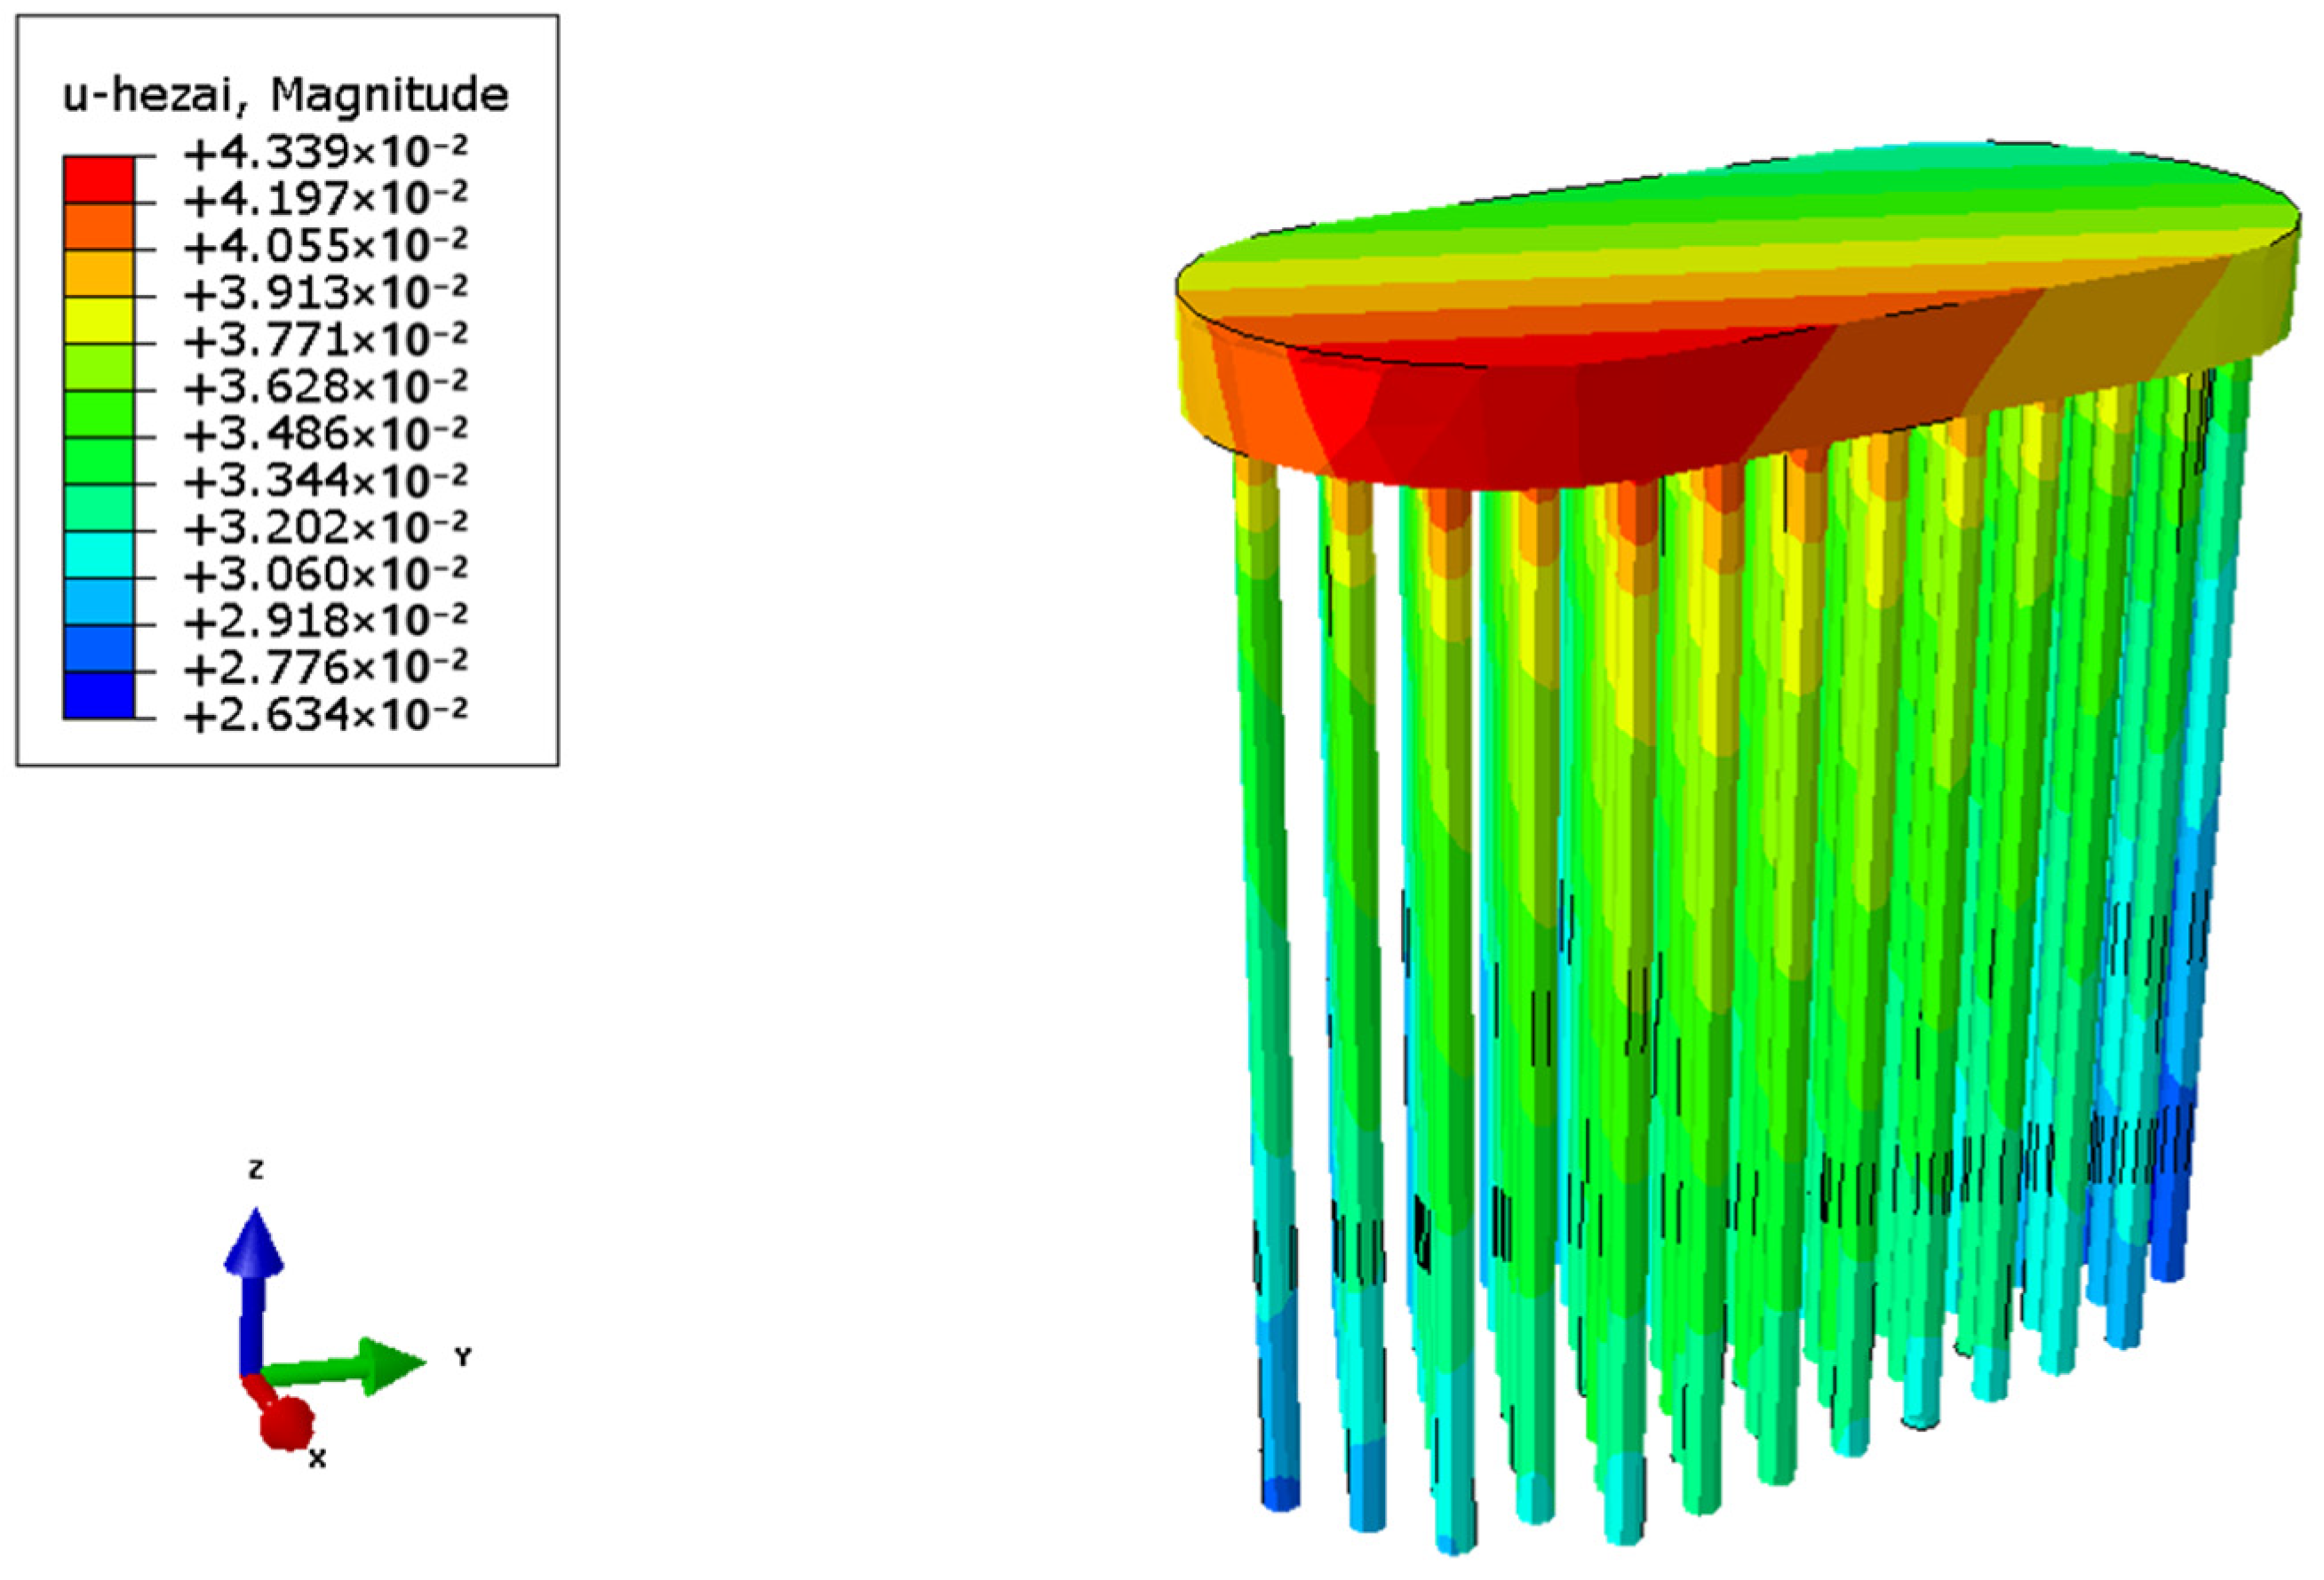
Under the bridge design load, the deformation cloud image and vector image of the cap under the bridge load are shown in Figure 7. As can be seen from the figure, the cap and pile foundation mainly undergo settlement deformation, and the maximum deformation will occur on the side of the cap. The maximum non-uniform settlement of the cap is 12.2 mm (the cap deformation difference). The deformation of the pile top and cap is coordinated, and the deformation of the pile body gradually decreases with the increase in buried depth.
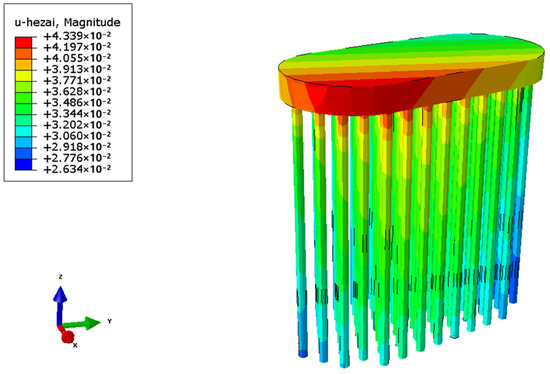
Figure 7.
Deformation distribution of pile foundation under bridge design load.
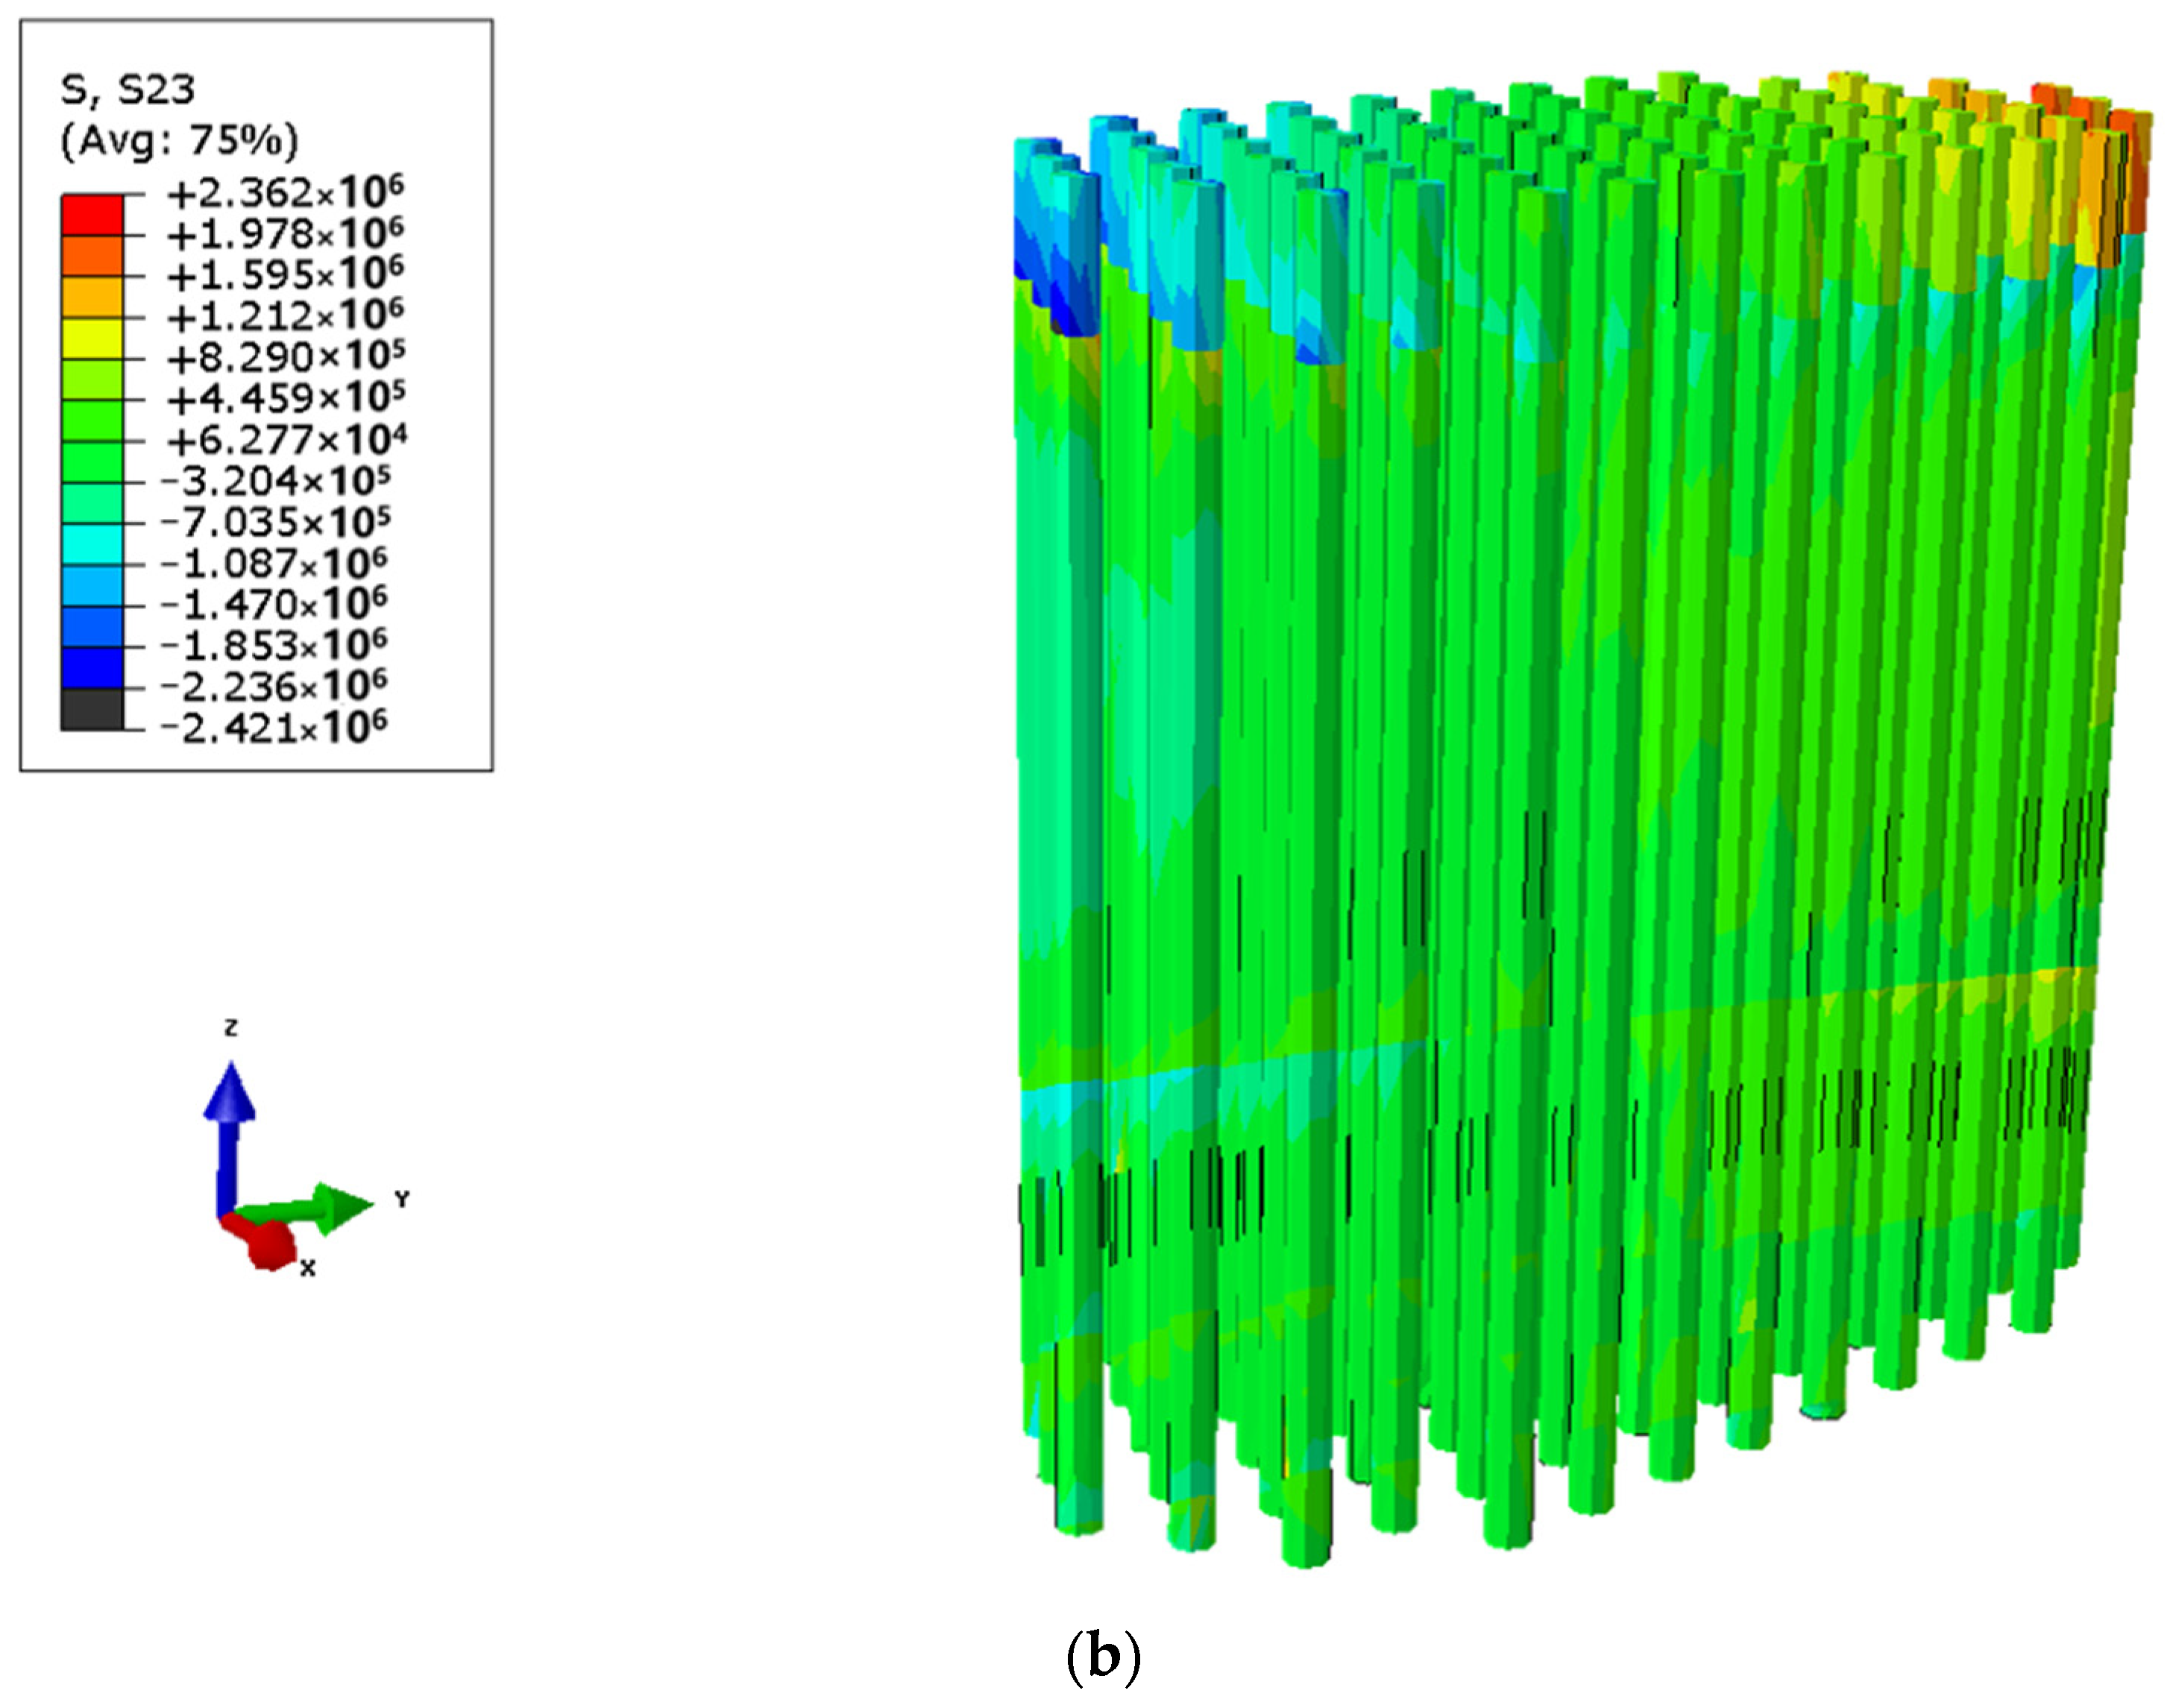
Under the bridge design load, the stress distribution of the pile foundation under the bridge load is shown in Figure 8. It can be seen that the pile body is under vertical pressure, and the maximum compressive stress appears at the top of the pile body, whose maximum value is 13.1 MPa, which is lower than the compressive strength of concrete. The shear stress concentration area of the pile body occurs mainly at the joint between the cap and the pile body and at the soft–hard rock interface, and the maximum value is about 2.4 MPa.
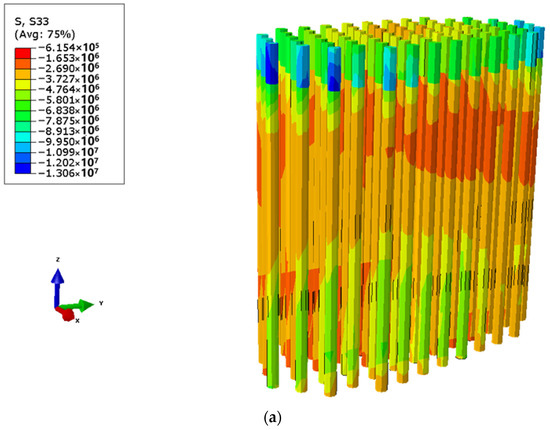

Figure 8.
Stress distribution of pile foundation under bridge load. (a) Vertical compressive stress distribution. (b) Shear stress distribution.
The load of the bridge is transferred to the surrounding rock through the pile foundation, and the incremental distribution of vertical stress in the rock is shown in Figure 9. It can be seen that the stress increment in limestone breccia is the most significant, that in limestone structure breccia is the most significant, the stress increment in rock mass is 150~500 kPa, and the stress influence zone is about 40 m. The stress increment of mylonitic rock at the bottom of the pile is 10~300 kPa, and the influence zone at the bottom of the pile is about 25 m, and the rock is in a stable state.
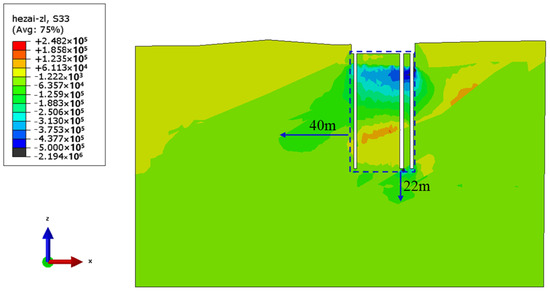
Figure 9.
Incremental distribution of vertical stress in bedrock.
4.2. Load Analysis of Pile Foundation and Surrounding Rock under Overload Conditions
The load analysis of the pile foundation and surrounding rock under overload conditions increases step by step according to the normal bridge design load, 2-times, 3-times, and 4-times design load. The stress cloud diagram of the pile foundation and surrounding rock under different overload conditions is shown in Figure 10. As can be seen from the figure, the whole pile body and surrounding rock are basically under pressure, and the surrounding rock at the bottom of the pile will have stress concentration, and the maximum compressive stress of the pile body is near the bottom of the pile, reaching about 20 MPa, which is less than the standard compressive strength value of the pile body C35, 23.4 MPa. The range of the crushing stress concentration area in the surrounding rock of the pile bottom increases with the increase in the load, and the stress concentration area of the pile body gradually moves upwards. When the load is 4-times, the stress concentration area of the pile body is concentrated at the contact point between the pile body and the cap, and the local force of the pile body may reach the design strength of the pile concret.

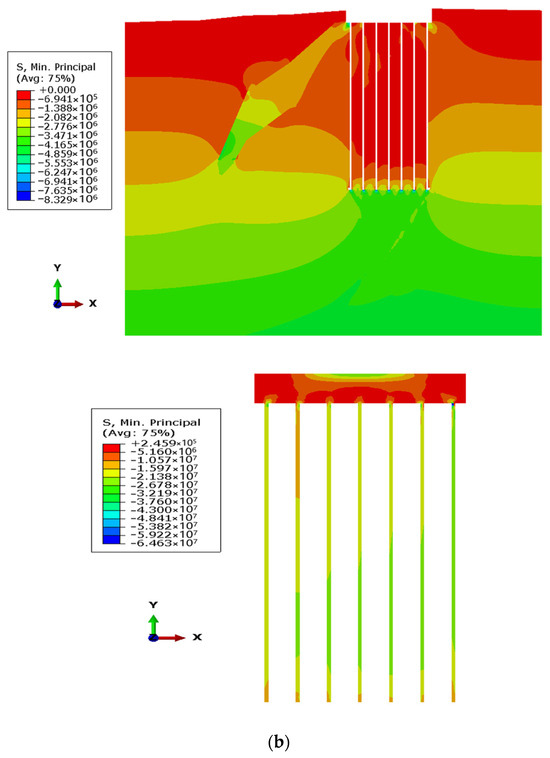
Figure 10.
Stress cloud diagram of pile foundation and surrounding rock under different overload conditions. (a) Normal design load. (b) 4−times the design load.
4.3. Ultimate Load-Bearing Capacity of a Pile Foundation under Overload Conditions
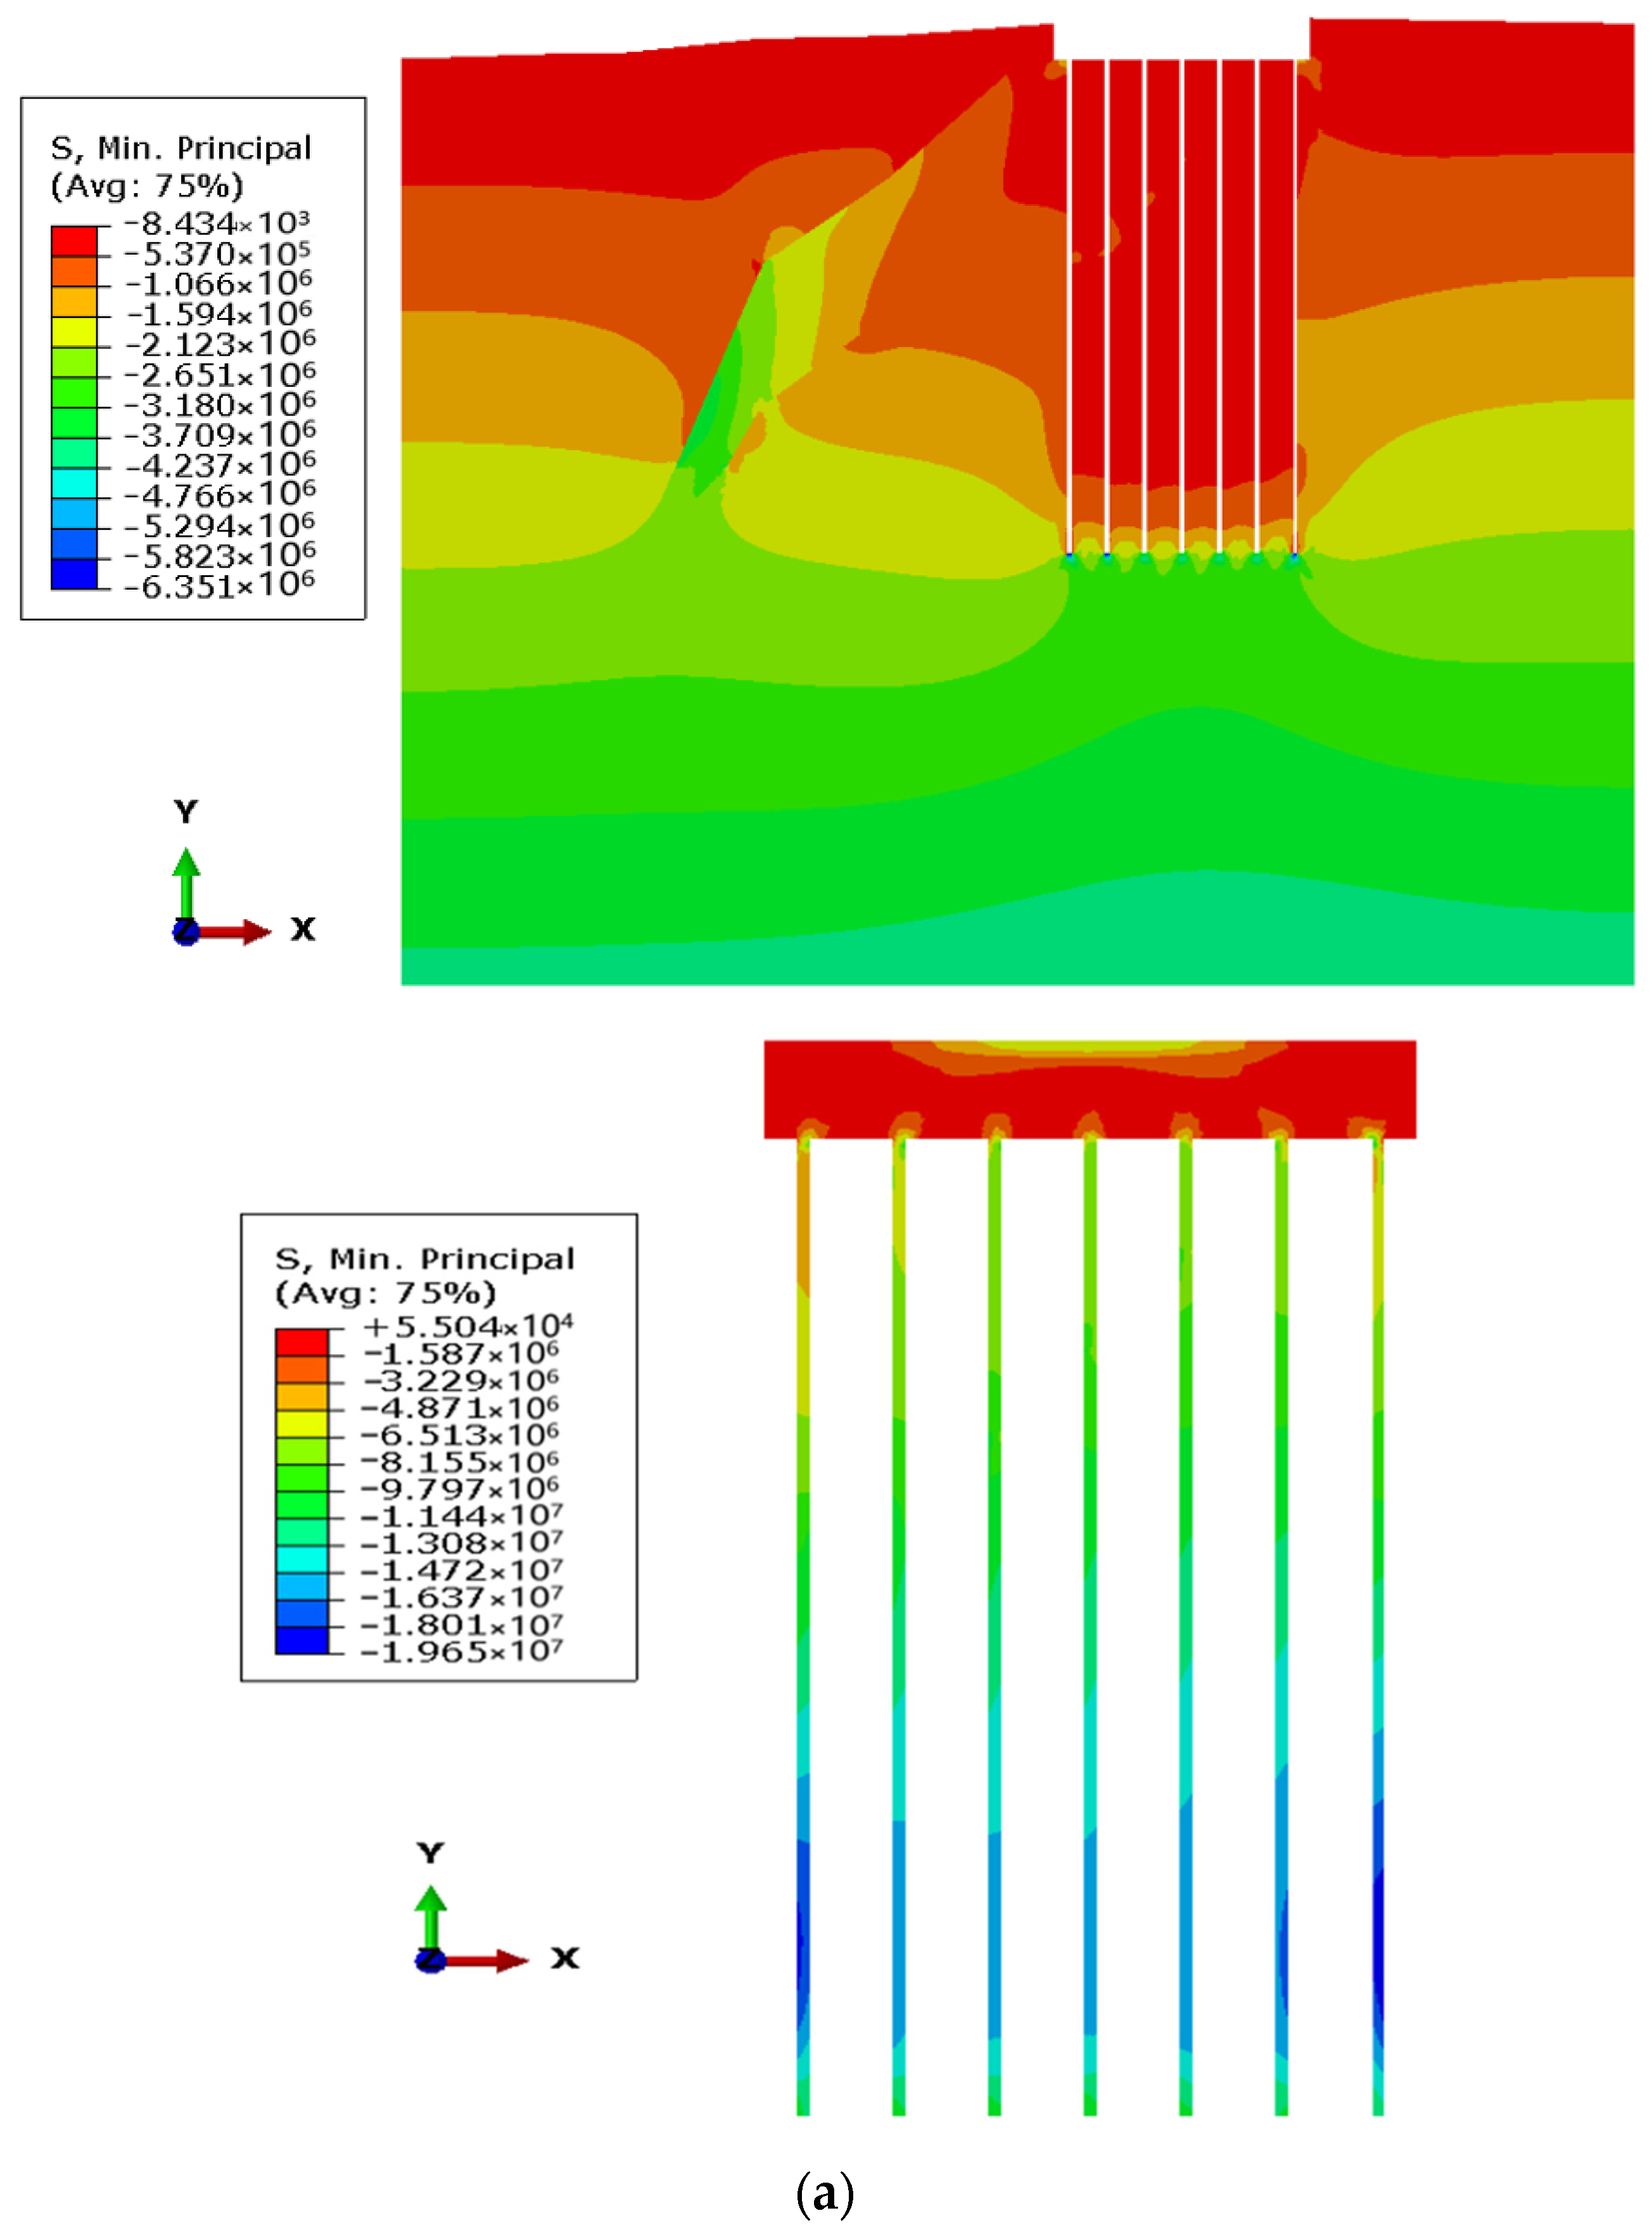
This section focuses on the relative sliding characteristics between hard limestone and weak mylonite under overload conditions, the stability of limestone, and the failure characteristics of pile-bottom mylonite under overload conditions. The loading, deformation, and failure characteristics of the pile foundation and the surrounding rock are studied according to the location of the pile foundation, taking into account the most unfavorable pile-rock interaction and the frictional effect of the formation interface between limestone and mylonite.
The distribution of the plastic zone of the pile foundation and the surrounding rock under different loads is shown in Figure 11a. It can be seen that, under the effect of overload, the plastic zone is mainly distributed in a part of the surrounding rock at the bottom of the pile. After the load is gradually increased four times, the plastic zone at the bottom of the pile gradually penetrates and finally forms an “X”-shaped shear failure zone, indicating that the surrounding rock at the bottom of the pile foundation will form a shear failure zone due to instability failure in this case. However, the interface between the weak mylonite and the hard limestone does not have a large damage area, and the limestone does not crack or rotate.

Figure 11.
Plastic zone distribution of pile foundation and surrounding rock under 4 times overload condition. (a) Normal design load. (b) 4−times the design load.
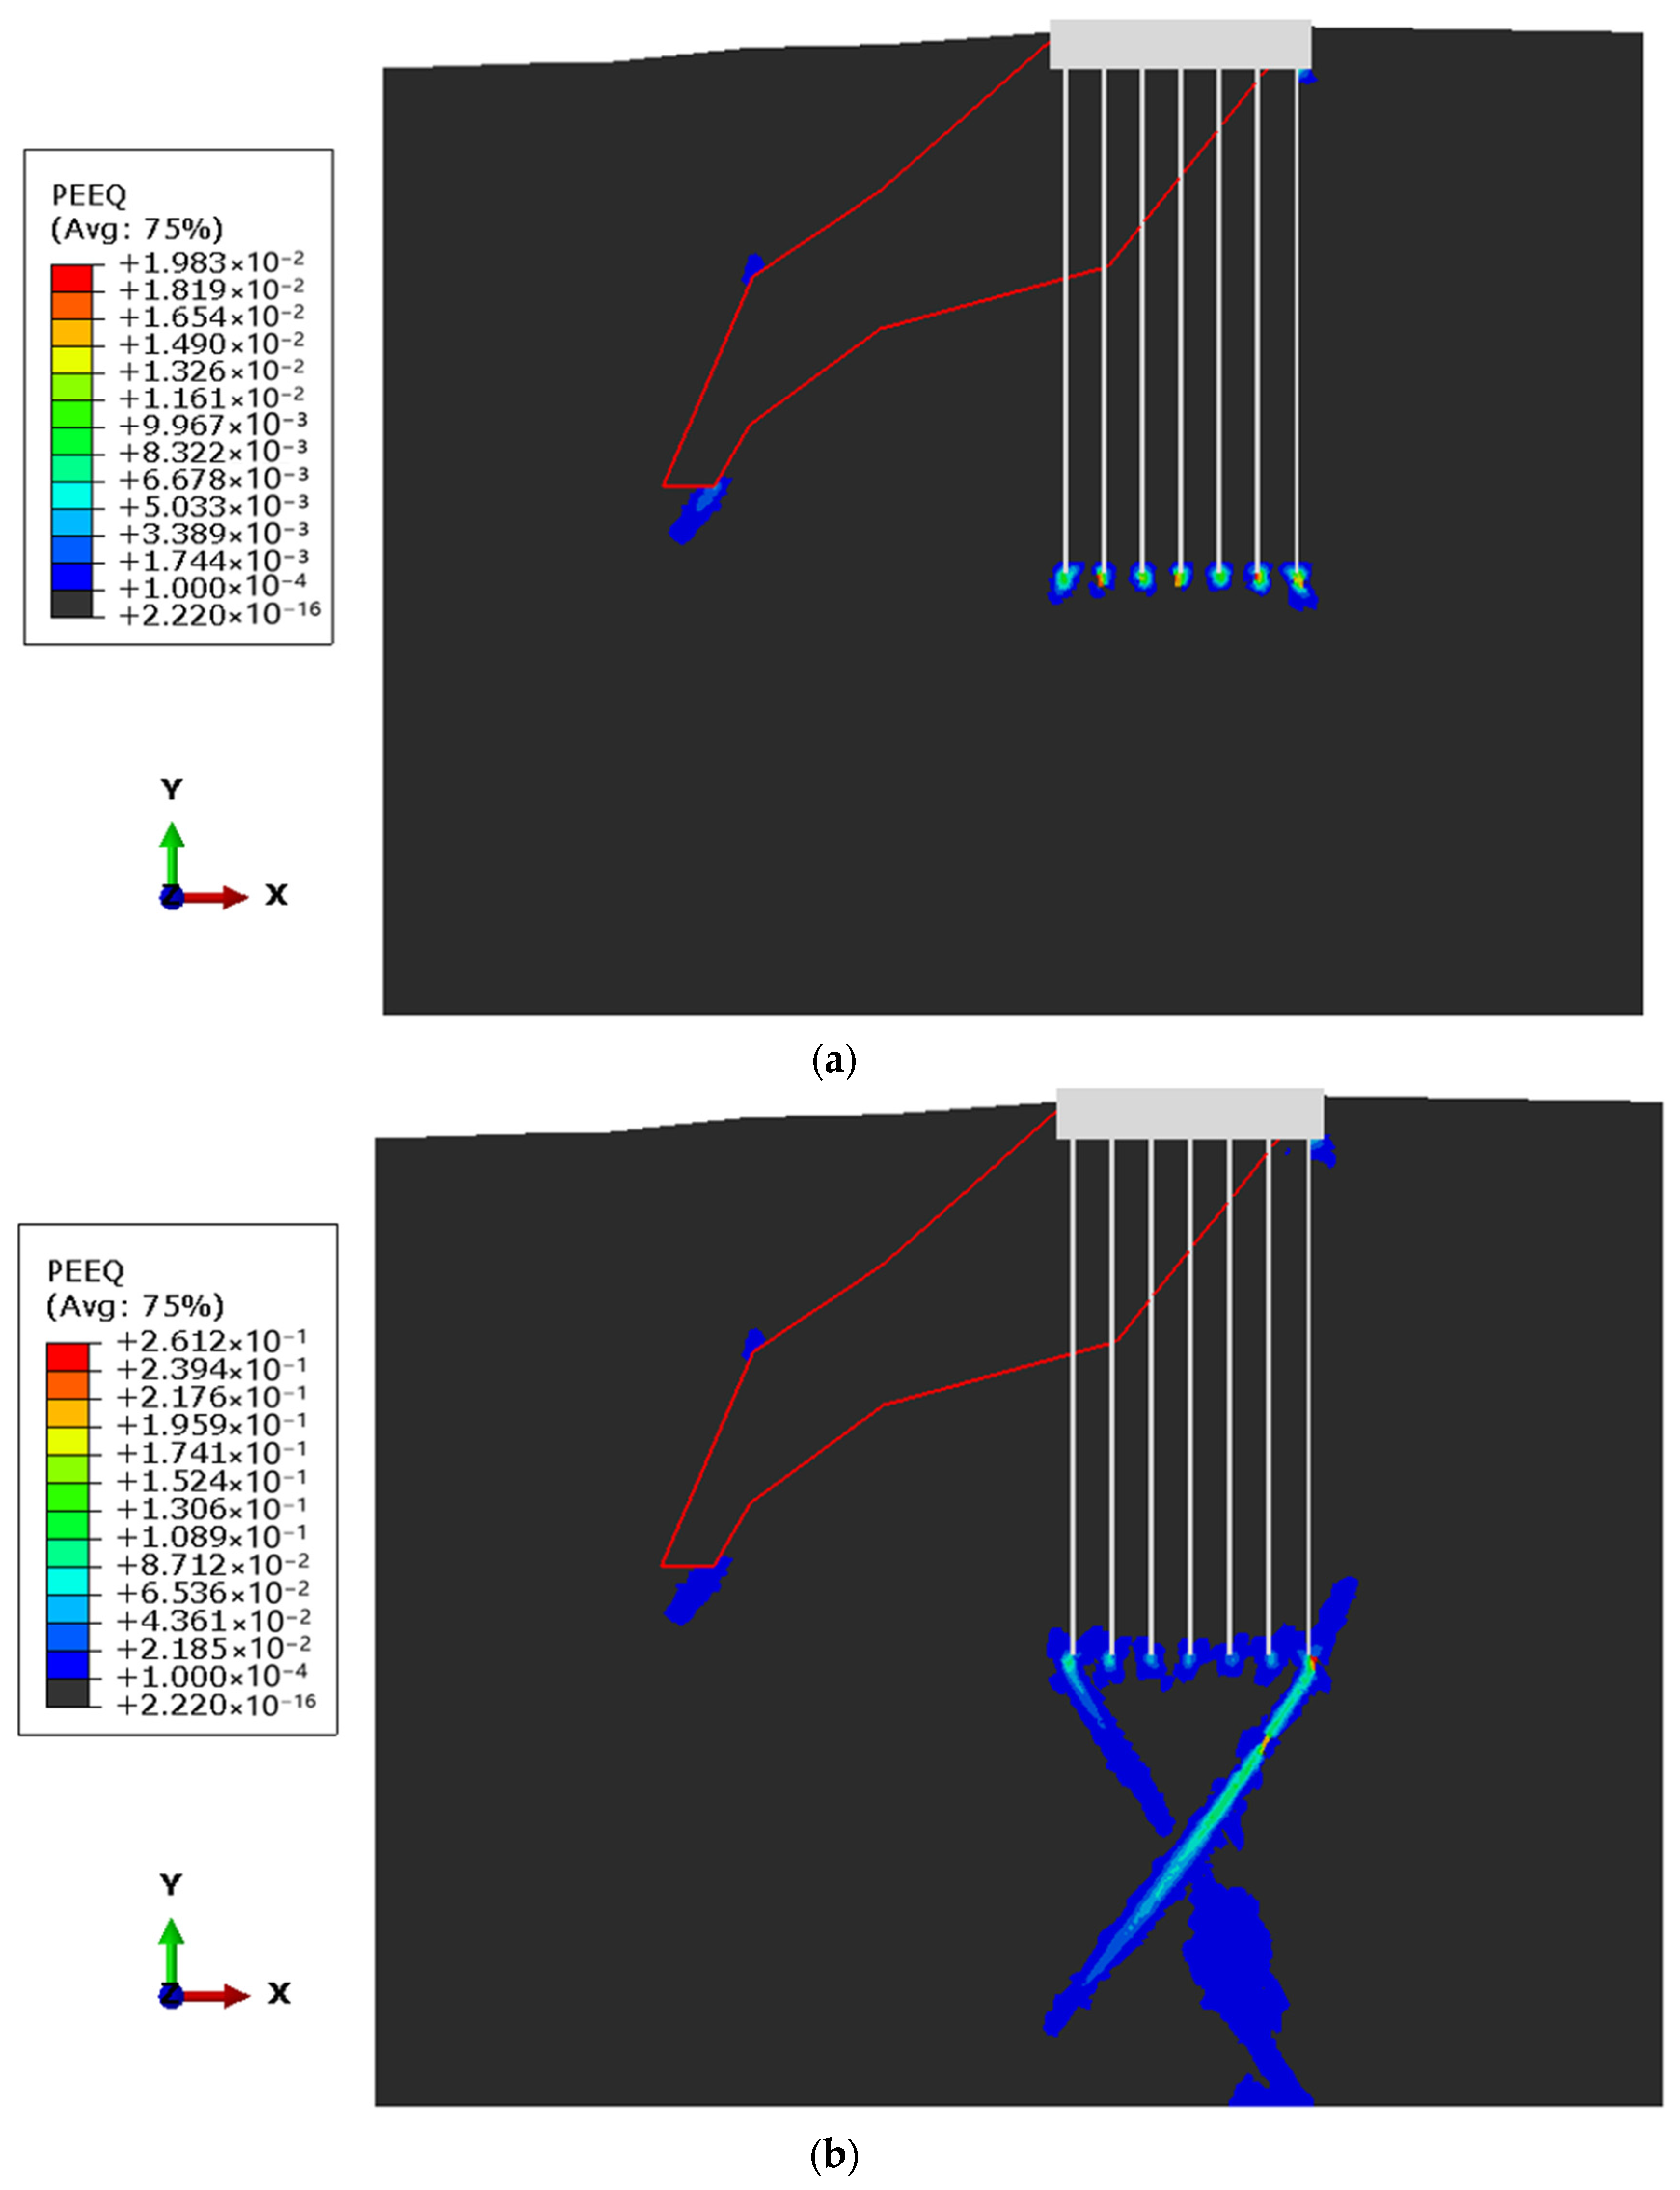
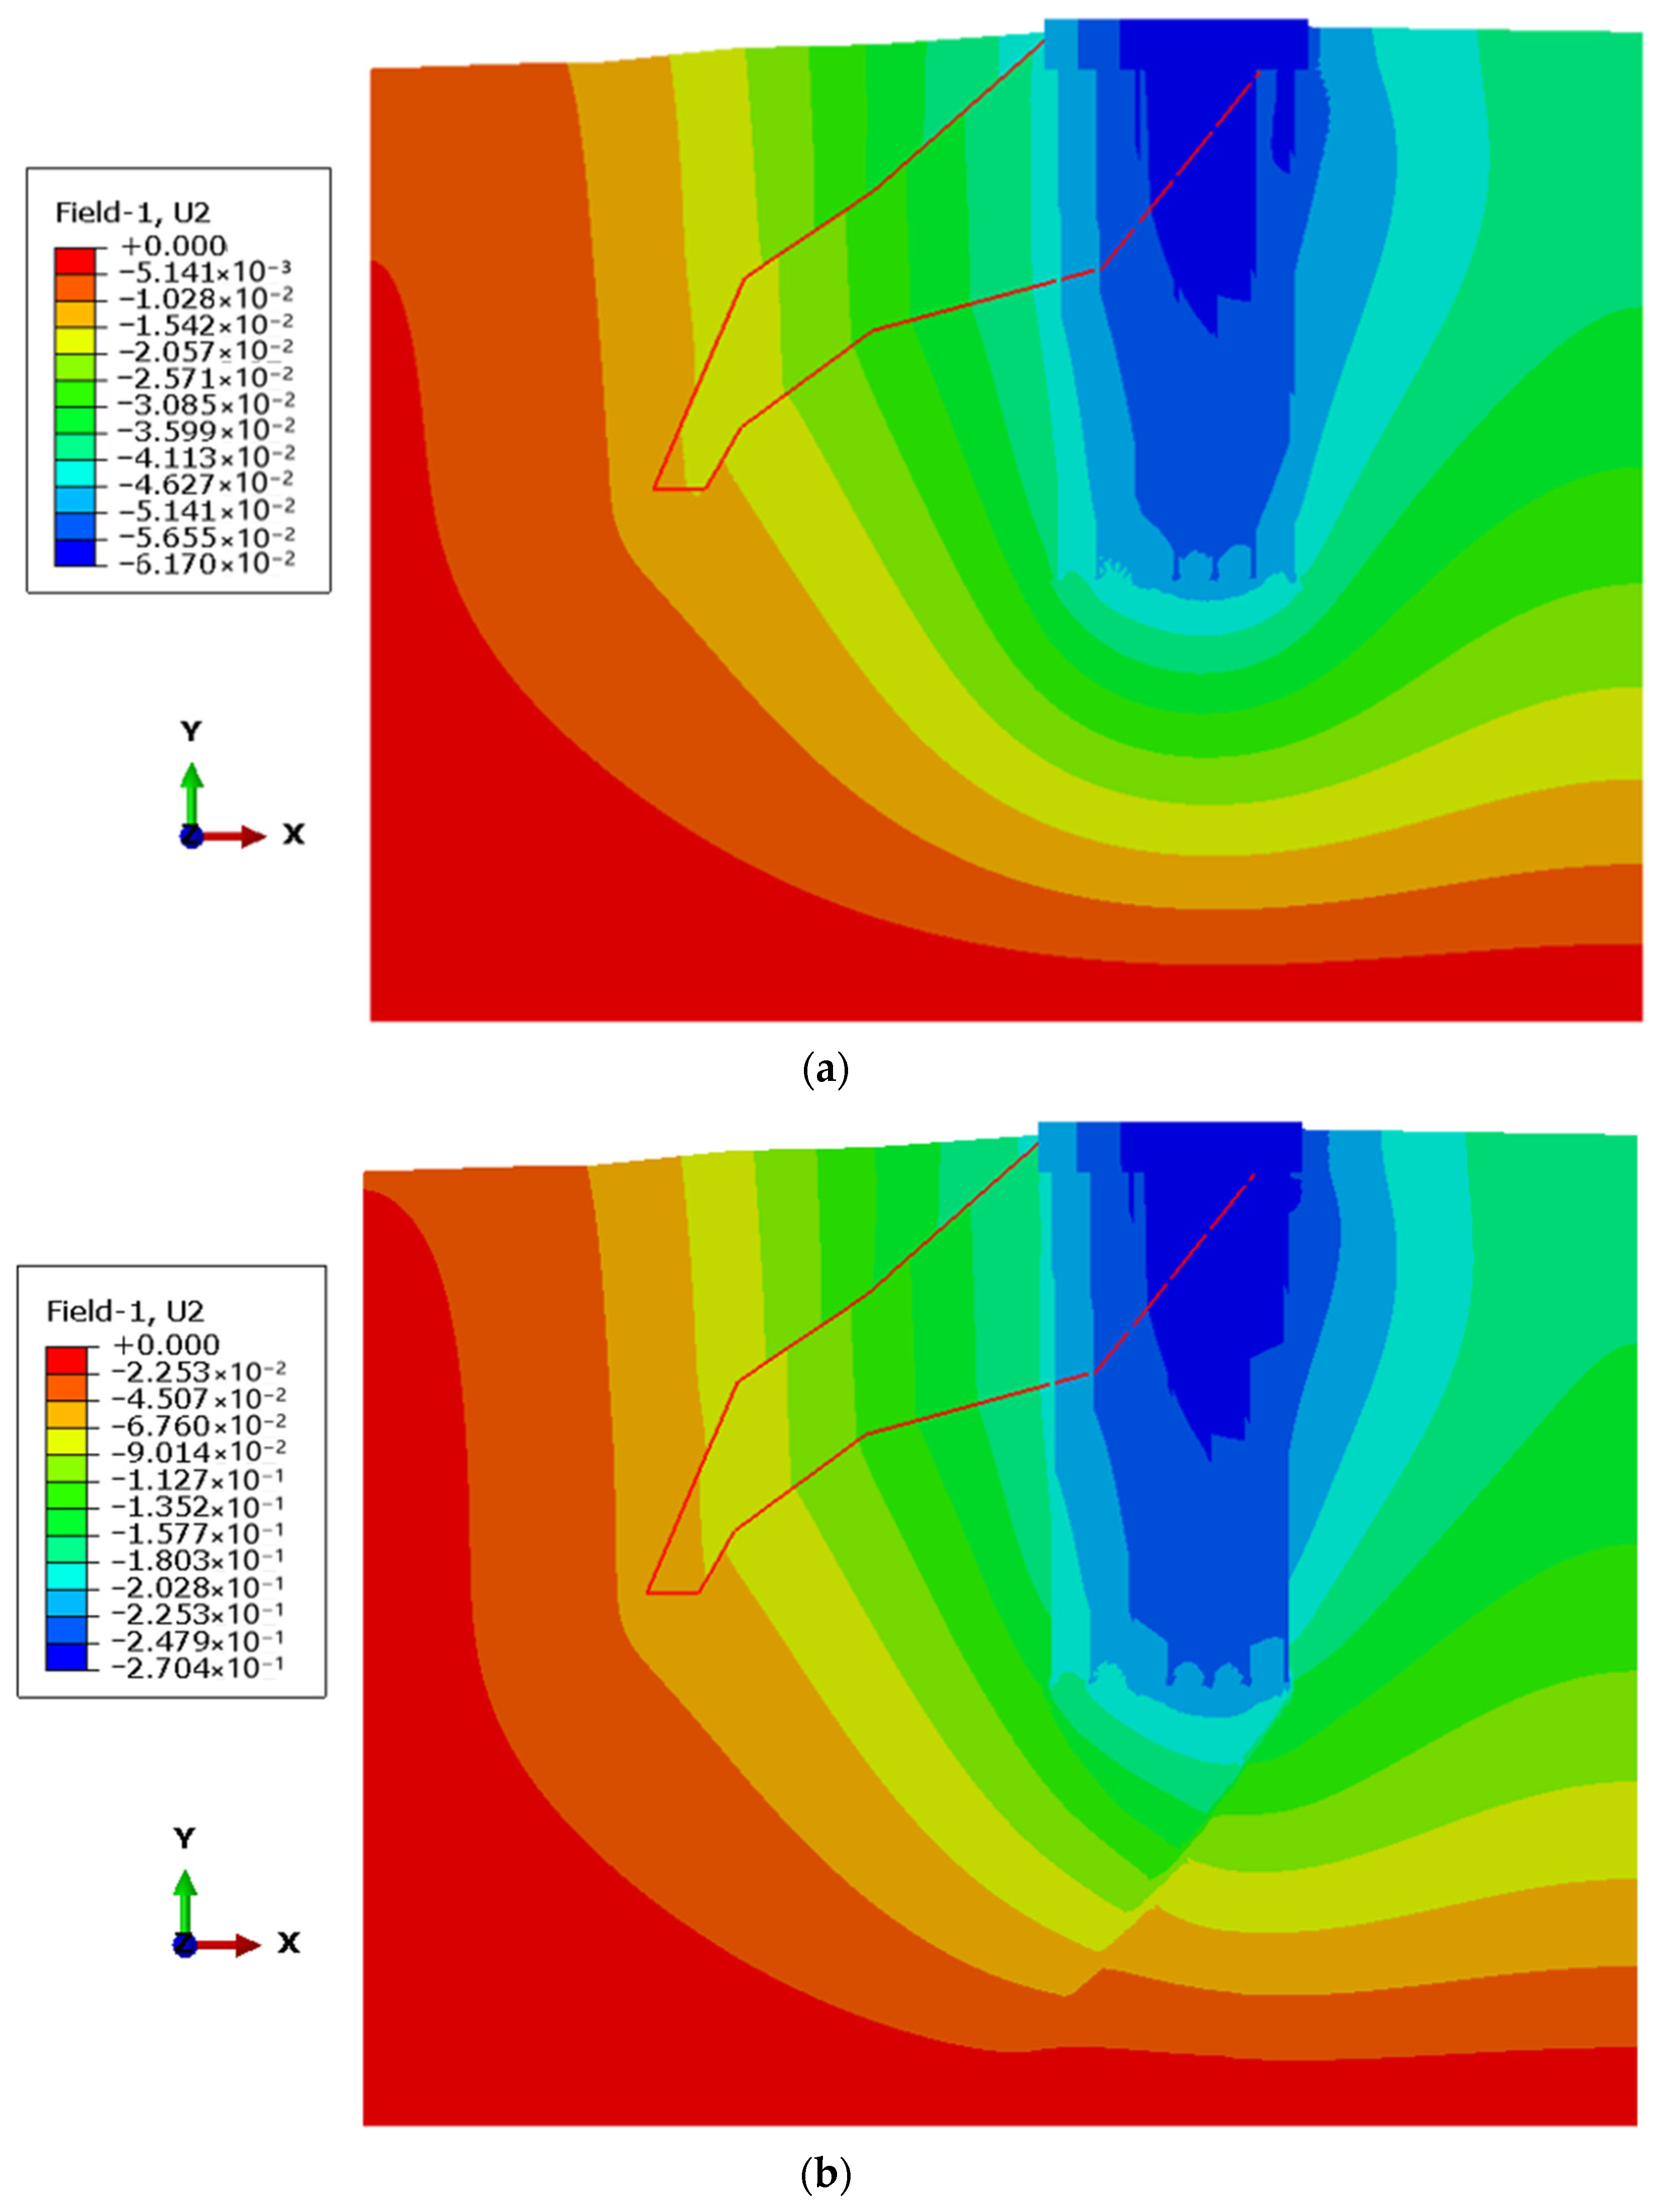
The deformation cloud diagram of the pile foundation and surrounding rock under different bridge loading conditions is shown in Figure 12. It can be seen from the figure that the pile foundation and surrounding rock as a whole show settlement deformation, with the maximum settlement deformation reaching 6.5 cm, which occurs in the area where mylonite and the pile foundation contact. The differential settlement of about 1.1 cm occurs on the upper surface of the cap, forming a slope of 0.3‰. Under different overload conditions, the settlement deformation of the left and right angles of the cap changes with the change of overload times, and the deformation increases abruptly between 4-times overload.
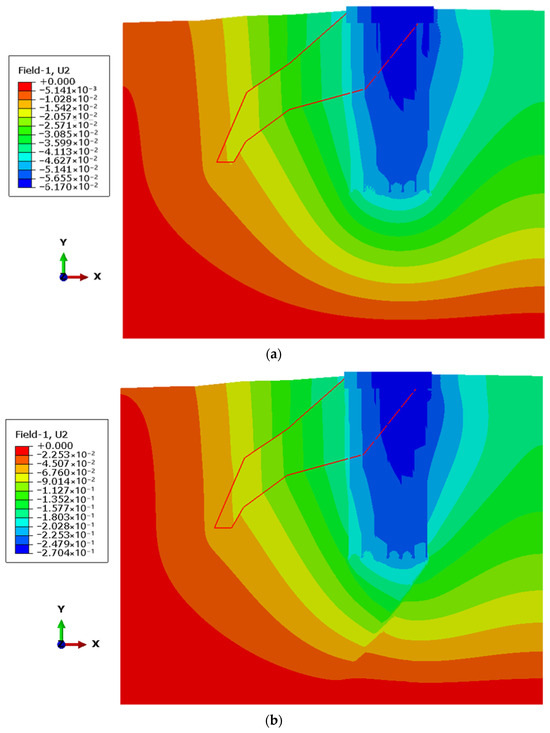
Figure 12.
Deformation cloud diagram of pile foundation and surrounding rock under different overload conditions. (a) Normal design load action. (b) 4−times the design load.
4.4. Sustainable Performance of the Pile Foundation
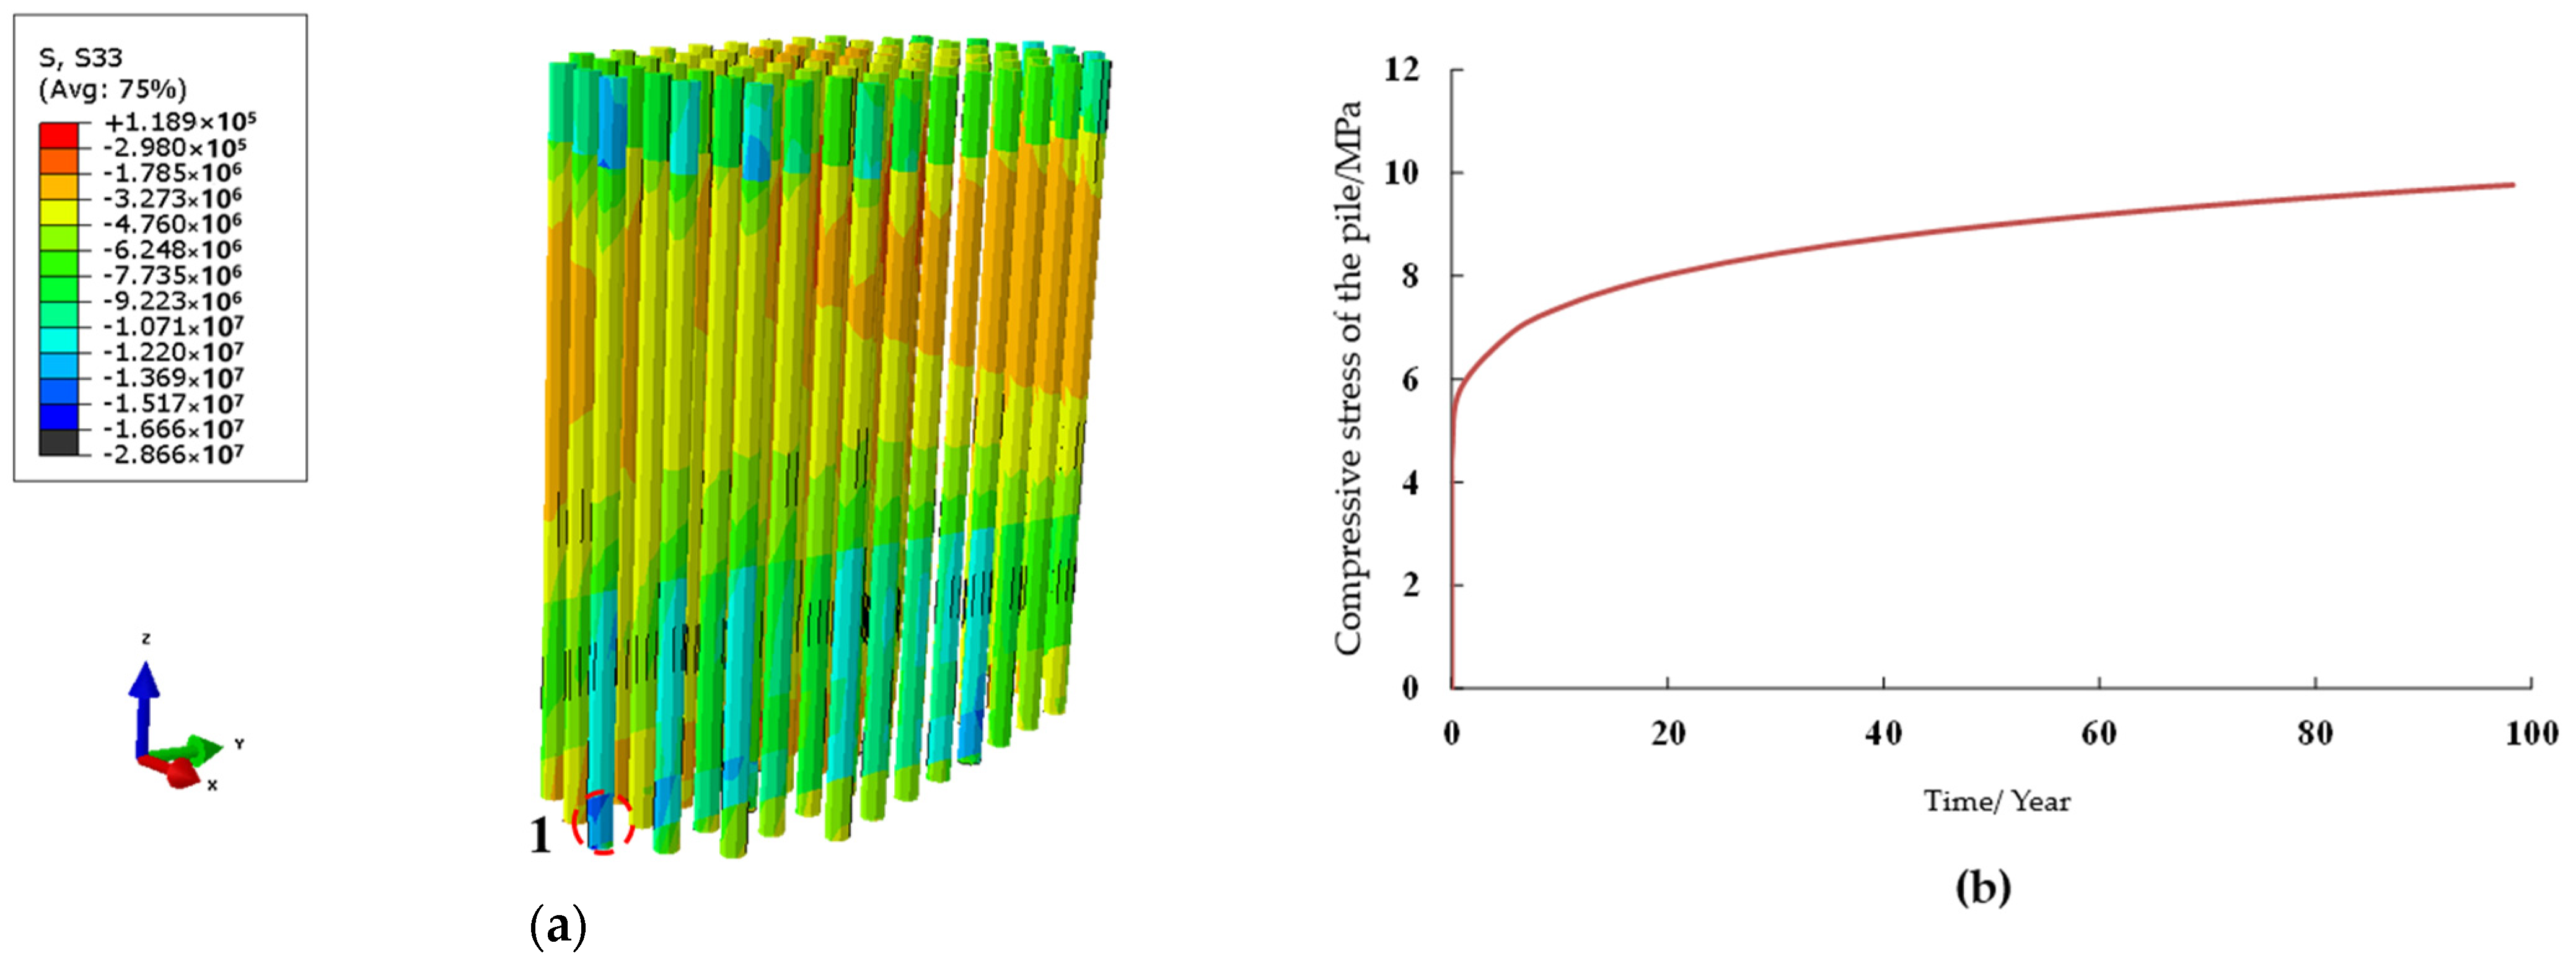
In this section, the sustainable performance of the pile group foundation was analyzed to see the long-term performance of the pile foundation. During the bridge operation period, the aging deformation of mylonite results in increasing pile stress, among which the pile stress in mylonite increases most significantly, as shown in Figure 13. After 100 years of bridge operation, it can be seen from the vertical stress distribution of the pile body that the whole pile body is still under vertical pressure, and the maximum compressive stress reaches 28.6 MPa, which is 120% more than that at the beginning of bridge construction, but it is still lower than the designed compressive strength of concrete.

Figure 13.
Vertical compressive stress distribution of the pile during operation period. (a) Vertical stress distribution of the pile after 100 years of operation. (b) Evolution of maximum compressive stress of the pile bottom with time.
5. Conclusions
Based on the fine terrain geological modeling and analysis method of multi-platform joint, this paper conducts 3D fine terrain modeling at the pile foundation site in the fault zone and then uses the finite element software ABAQUS to study the safety, ultimate bearing characteristics, and sustainable performance of the pile foundation under different bridge design loads, and draws the following conclusions:
- (1)
- The triaxial compression test of the mylonites shows that mylonite at the bridge site can be simulated by the Mohr–Coulomb model.
- (2)
- Under the bridge design load, the shear stress concentration area of the pile body occurs mainly at the cap/pile body joint and the soft–hard rock interface, and the shear failure of the pile body can be prevented by appropriate reinforcement. The load stress of the pile foundation is transferred to the inside of the rock, and the stress increase of the hard limestone structure breccia is the most significant, and the stress influence area is about 40 m. The influence area of the soft mylonite at the pile bottom is about 25 m.
- (3)
- Under various bridge loads, the whole pile and the surrounding rock are basically under compression. As the load increases, the stress concentration area of the pile body gradually shifts upward from the pile bottom, and the compressive stress concentration area of the surrounding rock at the pile bottom increases. Under the condition of 4-times load, the maximum stress exists at the contact point between the pile body and the cap, and the local stress of the pile body may reach the strength of the pile concrete.
- (4)
- The plastic zone of the pile foundation is mainly concentrated at the bottom of the pile, and the area of the plastic zone gradually increases with the increase in load. When the bridge is subjected to 4-times design load, the surrounding rock at the bottom will become unstable and form an “X”-shaped shear failure zone, and the hard limestones in the fracture zone will not break and rotate relative to the soft mylonites.
- (5)
- After 100 years of operation, the pile is still under vertical pressure, and the maximum compressive stress reaches 28.6 MPa, which is 120% higher than that at the beginning of the bridge construction, but it is still lower than the compressive strength of concrete. The shear stress of the pile body increases significantly at the interface between the mylonites and the limestones, and the maximum shear stress reaches 3.6 MPa, which is 50% higher than that at the beginning of bridge construction.
Although this paper investigates the load capacity and sustainable performance of the pile foundation near the fault, the effect of the fault on the performance of the suspension bridge is still necessary for the design of the large-span bridge. Moreover, further developments should regard the influence of faults on the dynamic responses of bridges in high seismic zones.
Author Contributions
Data curation, M.R. and J.C.; formal analysis, M.R.; methodology, S.Z. and M.R.; software, M.R. and J.C.; validation, S.Z. and Y.P.; writing—original draft, M.R. and J.C.; writing—review and editing, J.C., Y.P. and W.Z. All authors will be informed about each step of manuscript processing including submission, revision, revision reminder, etc., via emails from our system or assigned Assistant Editor. All authors have read and agreed to the published version of the manuscript.
Funding
This research was funded by [Major R&D Project of China Communications Construction Group (2021); Science and Technology Project of Hubei Communications Investment Group Co., Ltd.] grant number [HBJTKJ-47-2022001].
Institutional Review Board Statement
Not applicable.
Informed Consent Statement
Not applicable.
Data Availability Statement
Data are contained within the article.
Conflicts of Interest
Authors Meng Ren and Shengbin Zhang were employed by CCCC Second Highway Consultants Co., Ltd. The remaining authors declare that the research was conducted in the absence of any commercial or financial relationships that could be construed as a potential conflict of interest.
References
- Lu, X.L.; Wei, K.; He, H.F.; Qin, S.Q. Life-cycle seismic fragility of a cable-stayed bridge considering chloride-induced corrosion. Earthq. Eng. Resil. 2022, 1, 60–72. [Google Scholar] [CrossRef]
- Zhang, Y.Y.; Ding, Y.; Pang, Y.T. Selection of optimal intensity measures in seismic damage analysis of cable-stayed bridges subjected to far-fault ground motions. J. Earthq. Tsunami 2015, 9, 1550003. [Google Scholar] [CrossRef]
- Li, C.; Li, H.N.; Hao, H.; Bi, K.M.; Chen, B.K. Seismic fragility analyses of sea-crossing cable-stayed bridges subjected to multi-support ground motions on offshore sites. Eng. Struct. 2018, 165, 441–456. [Google Scholar] [CrossRef]
- Dong, Y.; Frangopol, D.M.; Saydam, D. Sustainability of highway bridge networks under seismic hazard. J. Earthq. Eng. 2014, 18, 41–66. [Google Scholar] [CrossRef]
- Sabatino, S.; Frangopol, D.M.; Dong, Y. Sustainability-informed maintenance optimization of highway bridges considering multi-attribute utility and risk attitude. Eng. Struct. 2015, 102, 310–321. [Google Scholar] [CrossRef]
- Qian, J.; Zheng, Y.; Dong, Y.; Wu, H.; Guo, H.; Zhang, J. Sustainability and resilience of steel–shape memory alloy reinforced concrete bridge under compound earthquakes and functional deterioration within entire life-cycle. Eng. Struct. 2022, 271, 114937. [Google Scholar] [CrossRef]
- Yang, S.; Mavroeidis, G.P. Bridges crossing fault rupture zones: A review. Soil Dyn. Earthq. Eng. 2018, 113, 545–571. [Google Scholar] [CrossRef]
- Goel, R.K.; Chopra, A.K. Role of shear keys in seismic behavior of bridges crossing fault-rupture zones. J. Bridge Eng. 2008, 13, 398–408. [Google Scholar] [CrossRef]
- Pang, Y.T.; Wei, K.; He, H.F.; Wang, W.X. Assessment of lifetime seismic resilience of a long-span cable-stayed bridge exposed to structural corrosion. Soil Dyn. Earthq. Eng. 2022, 157, 107275. [Google Scholar] [CrossRef]
- Feng, Z.J. Foundation Engineering in Special Areas; China Communications Press: Beijing, China, 2008. [Google Scholar]
- Wei, K.; Zhou, C.; Xu, B. Numerical Simulation of Wave Loads on Elevated Pile Cap of Pile Group Foundation for Sea-crossing Bridges. Appl. Ocean Res. 2022, 125, 103245. [Google Scholar] [CrossRef]
- Jia, H.Y.; Yang, J.; Zheng, S.X.; Zhao, C.H.; Du, X.L. Review on seismic resistance of cross-fault bridges. J. Southwest Jiaotong Univ. 2021, 56, 1075–1093. [Google Scholar]
- Zhang, J.R.; Wei, K.; Pang, Y.T.; Zhang, M.; Qin, S. Numerical investigation into hydrodynamic effects on the seismic response of complex hollow bridge pier submerged in reservoir: Case study. J. Bridge Eng. 2019, 24, 05018016. [Google Scholar] [CrossRef]
- Bachinilla, B.; Evangelista, A.; Siddhpura, M.; Haddad, A.N.; da Costa, B.B.F. High-Speed Railway Bridge and Pile Foundation: A Review. Infrastructures 2022, 7, 154. [Google Scholar] [CrossRef]
- Bray, J.D. Designing buildings to accommodate earthquake surface fault rupture. In Proceedings of the ATC & SEI Conference on Improving the Seismic Performance of Existing Buildings and Other Structures, San Francisco, CA, USA, 9–11 December 2009; pp. 1–12. [Google Scholar]
- Park, S.W.; Ghasemi, H.; Shen, J. Simulation of the seismic performance of the Bolu viaduct subjected to near-fault ground motions. Earthq. Eng. Struct. Dyn. 2004, 33, 1249–1270. [Google Scholar] [CrossRef]
- Bransby, M.F.; Davies, M.; Nahas, A.E. Centrifuge modelling of normal fault foundation interaction. Bull. Earthq. Eng. 2008, 6, 585–605. [Google Scholar] [CrossRef]
- Zhao, M.H.; Liu, E.; Yang, J. Analysis of Stability of Pile Foundation with Higher Pile-column Bridge Piers. J. Highw. Transp. Res. Dev. (Engl. Ed.) 2009, 4, 40–44. [Google Scholar] [CrossRef]
- Ashour, M.; Abbas, A.I.; Boskovic, S. Pile Cap Interaction with Bridge Pile Foundations under Lateral Loads. J. Bridge Eng. 2019, 24, 04019053. [Google Scholar] [CrossRef]
- Zhang, X.Y.; Guan, J.D.; Chen, X.C.; Pei, W.; Yu, S.; Wang, Y.; Wang, W. Effect of Permafrost on Seismic Performance of Railway Bridge Pile Foundation with Elevated Cap. Int. J. Struct. Stab. Dyn. 2022, 22, 2241002. [Google Scholar] [CrossRef]
- Anastasopoulos, I.; Kourkoulis, R.; Gazetas, G.; Tsatsis, A. Interaction of piled foundation with a rupturing normal fault. Geotechnique 2013, 63, 1042–1059. [Google Scholar] [CrossRef]
- Dong, Y.X.; Feng, Z.J.; He, J.B.; Chen, H.Y.; Jiang, G.; Yin, H. Seismic Response of a Bridge Pile Foundation during a Shaking Table Test. Shock Vib. 2019, 2019, 9726013. [Google Scholar] [CrossRef]
- He, J.B.; Feng, Z.J.; Dong, Y.X.; Hu, H.B.; Liu, C.; Guo, S.Z.; Zhang, C.; Wu, M.; Wang, Z. Dynamic response of pile foundation under pile-soil-fault coupling in strong earthquake region. Rock Soil Mech. 2020, 41, 2389–2400. [Google Scholar]
- Hui, Y.X.; Wang, K.H. Study of seismic response characteristics of brides crossing faults. Bridge Constr. 2015, 45, 70–75. [Google Scholar]
- Feng, Z.J.; Guan, Y.H.; Zhang, C.; Meng, Y.Y.; Dong, Y.X. Study on dynamic response and avoidance distance of cross-fault bridge pile foundation in strong earthquake area. J. Chongqing Jiaotong Univ. (Nat. Sci.) 2022, 41, 72–80. [Google Scholar]
- Jia, P.; Wang, L.M.; Wan, Z.; Qiu, R.; Liu, J. Seismic calculation of a bridge pile foundation. China Earthq. Eng. J. 2018, 40, 258–264. [Google Scholar]
- Cai, Q.P.; Gan, G.L.; Wu, H.W.; Chen, X.; Xiao, Z. Study on failure mechanism and setback distance of a pile group in sand subjected to normal faulting. Rock Soil Mech. 2019, 40, 1067–1075+1128. [Google Scholar]
- Fu, W.J.; Xiao, C.Y.; Gan, G.L.; Chen, R.; Zhang, W. Numerical simulation of failure mechanism of high-rise pile cap foundation subject to normal fault. J. Huaqiao Univ. (Nat. Sci. Ed.) 2020, 41, 156–163. [Google Scholar]
- Feng, J.; Zhang, J.Y.; Zhu, M.; Jiang, N. Characteristic study of horizontal bearing capacity and pile group effect coefficient of laterally loaded high pile group foundation for bridge in soft soil. Rock Soil Mech. 2016, 37, 94–104. [Google Scholar]
- Song, R.B.; Qin, X.Q.; Tao, Y.Q.; Wang, X.Y.; Yin, B.; Wang, Y.; Li, W. A semi-automatic method for 3D modeling and visualizing complex geological bodies. Bull. Eng. Geol. Environ. 2019, 78, 1371–1383. [Google Scholar] [CrossRef]
- Hu, T.F.; Liu, J.K. Three-dimensional geologic modeling technology and stability analysis method of complex slope. J. Disaster Prev. Mitig. 2016, 36, 580–587. [Google Scholar]
- Liu, Y.F.; Hu, C.; Zhang, L.; Wang, W.M. 3D geological modeling based on GPR data and CATIA. Eng. J. Wuhan Univ. 2010, 43, 458–461. [Google Scholar]
- Su, X.N.; Wang, Y.; Han, X. Study on application of 3D geological modeling and visualization based on CATIA. Yangtze River 2015, 46, 101–104. [Google Scholar]
- Shalabi, F.I.; Saleem, M.U.; Qureshi, H.J.; Arifuzzaman, M.; Khan, K.; Rahman, M.M. Rahman. 3D FE analysis of bored pile- pile cap interaction in sandy soils under axial compression-parametric study. J. Eng. Res. 2023, 11, 301–313. [Google Scholar] [CrossRef]
- Chen, Y.; Yang, B.B.; Wei, S.; Dave, C. Numerical implementation method and it’s verification in ABQUS under the condition of periodical loading and unloading. J. Hydraul. Eng. 2014, 45, 67–72. [Google Scholar]
- Luo, S.L.; Huang, D.; Peng, J.B.; Ailifeila, A.; Li, Z.; Kuang, X.B.; Roberto, T. Performance and application of a novel drainage anti-slide pile on accumulation landslide with a chair-like deposit-bedrock interface in the Three Gorges Reservoir area, China. Comput. Geotech. 2023, 155, 105199. [Google Scholar] [CrossRef]


Disclaimer/Publisher’s Note: The statements, opinions and data contained in all publications are solely those of the individual author(s) and contributor(s) and not of MDPI and/or the editor(s). MDPI and/or the editor(s) disclaim responsibility for any injury to people or property resulting from any ideas, methods, instructions or products referred to in the content. |
© 2024 by the authors. Licensee MDPI, Basel, Switzerland. This article is an open access article distributed under the terms and conditions of the Creative Commons Attribution (CC BY) license (https://creativecommons.org/licenses/by/4.0/).